Discovery of a 6.4 keV Emission Line in a Burst from SGR 1900+14
Abstract
We present evidence of a 6.4 keV emission line during a burst from the soft gamma-ray repeater SGR 1900+14. The Rossi X-ray Timing Explorer (RXTE) monitored this source extensively during its outburst in the summer of 1998. A strong burst observed on August 29, 1998 revealed a number of unique properties. The burst exhibits a precursor and is followed by a long ( s) tail modulated at the 5.16 s stellar rotation period. The precursor has a duration of s and shows both significant spectral evolution as well as an emission feature centered near 6.4 keV during the first 0.3 s of the event, when the X-ray spectrum was hardest. The continuum during the burst is well fit with an optically thin thermal bremsstrahlung (OTTB) spectrum with the temperature ranging from to 10 keV. The line is strong, with an equivalent width of eV, and is consistent with Fe K- fluorescence from relatively cool material. If the rest-frame energy is indeed 6.4 keV, then the lack of an observed redshift indicates that the source is at least km above the neutron star surface. We discuss the implications of the line detection in the context of models for SGRs.
Accepted for Publication in the Astrophysical Journal Letters
1 Introduction
Soft Gamma-ray Repeaters (SGRs) and Anomalous X-ray Pulsars (AXPs) are almost certainly young neutron stars with spin periods in the 5 - 10 s range and large spin down rates. The SGRs occasionally and unexpectedly produce short energetic ( ergs s-1) bursts of X-ray and -ray radiation and two of these sources (SGRs 0526-66 and 1900+14) have also produced so called ‘giant flares’, like the famous March 5th event, with luminosities upwards of ergs s-1. The persistent X-ray luminosities of both SGRs and AXPs are much larger than their spin down luminosities, implying some other source of energy powers the X-ray emission. The recent discoveries of X-ray pulsations from the SGR persistent X-ray counterparts (Kouveliotou et al. 1998, 1999; Hurley et al. 1999a) and their large period derivatives, s s-1, when interpreted in the context of magnetic dipole radiation, have provided support for the hypothesis, first proposed by Duncan & Thompson (1992), that SGRs are magnetars, neutron stars with dipolar magnetic fields much larger than the quantum critical field G (see also Paczynski 1992, Thompson & Duncan 1995, 1996). It has also been suggested that AXPs may be magnetars, but in a later, less active evolutionary state (Kouveliotou 1998).
Marsden, Rothschild & Lingenfelter (1999) suggest that the observed variations in from SGR 1900+14 are inconsistent with magnetic dipole spin down and that the torque may be dominated by a relativistic wind, in which case a dipolar field may not have to be super-critical. More recently, Harding, Contopoulos & Kazanas (1999) have computed the torque due to an episodic particle wind and suggest that a magnetar field can still be consistent with the observed spin down rates and supernova remnant ages as long as the wind duty cycle and luminosity are within well defined limits.
Attention has also been focused recently on accretion models for these sources (see Marsden et al. 1999; Chatterjee, Hernquist & Narayan 1999; and Alpar 1999). These models suggest the spin down torques may be due to disk accretion. However, direct evidence for such disks is extremely limited, and with daunting constraints on the presence of companions (Mereghetti 1999; and Mereghetti, Israel, & Stella 1998; Hulleman 2000) it seems unlikely that a binary companion could be the source of such material. These models also have difficulty explaining both the presence of bursts in SGRs and the apparently very quiet spin down of at least some of the AXPs (see Kaspi, Chakrabarty, & Steinberger 1999; Baykal et al. 2000).
Although much evidence supports the magnetar hypothesis, recent findings have provided new challenges and it remains for continued observations to either vindicate or disprove the hypothesis. In this Letter we describe recent X-ray spectral analysis of an unusual burst from SGR 1900+14 which provides the first strong evidence for line emission in an SGR burst. Here we focus on the evidence for both spectral features and spectral evolution during a precursor event to the strong burst observed with RXTE and BATSE on August 29, 1998 UT (see Ibrahim et al. 2000). We note that this event was also seen by the BeppoSAX Gamma-ray Burst Monitor and Ulysses (Hurley et al. 2000).
2 RXTE Observations
On 29 August 1998, at 10:16:32.5 UT a bright burst was observed during RXTE pointed observations of SGR 1900+14. The burst is unusual in that it showed a rather long ( s) precursor and a long decaying tail modulated with strong 5.16 s pulsations, similar in this respect to the giant flare which occurred on August 27, 1998 (see Hurley et al. 1999b). Here we describe in detail the spectral properties of the precursor. We used data from the proportional counter array (PCA) in an event mode which provides the time of each good X-ray event to a resolution of 125 -sec (1/8192 s) and its energy in one of 64 bins across the 2 - 90 keV PCA response. The event was also observed by BATSE (Ibrahim et al. 2000).

Figure 1 shows the time history in the entire PCA bandpass of the precursor with 2 ms time resolution ( s). The precursor is rather long ( s) compared to typical SGR burst durations and is comprised of several peaks. Multi-peaked compositions are not atypical for such bursts. Not only is the precursor itself rather long, but the main burst itself lasted s, quite long for an SGR burst. In order to investigate the precursor’s spectrum we accumulatd data in 5 independent intervals. These are labelled in Figure 1. We chose 5 intervals as a trade-off between having sufficient signal in each interval and a desire to search for spectral changes within the burst. We further chose the interval boundaries so that each interval would contain the same number of counts and therefore yield spectra of similar statistical quality. We used a s segment of preburst data as a background estimate. Thus our results describe the spectrum of the burst emission alone. We note, however, that there are very few background counts in the accumulated spectra. Thus, in terms of the derived spectral shape, including the presence of narrow spectral features, the background is essentially negligible.
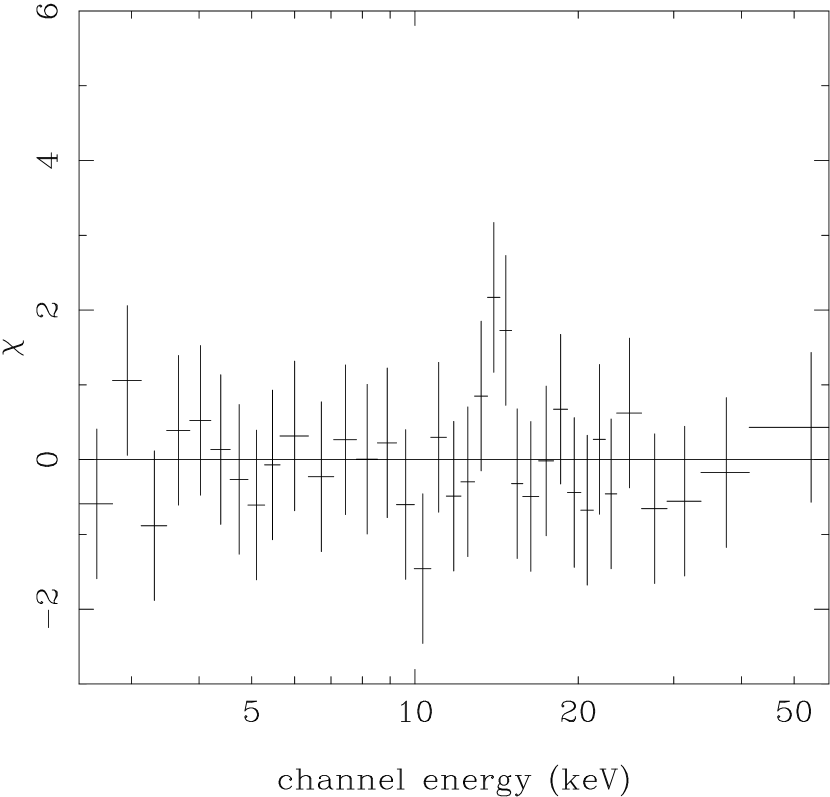
We began by fitting the accumulated spectra with an optically thin thermal bremsstrahlung (OTTB) model including photoelectric absorption (bremss wabs in XSPEC v10.0), a spectral form which has often been used to characterize SGR bursts. We found that the OTTB model provides an adequate description of the continuum in all the intervals. In the first two intervals inspection of the residuals suggested a narrow excess in the vicinity of 6.4 keV. We then added these two intervals together and fit the combined spectrum with the same model. To quantitatively assess the significance of the excess we added a narrow gaussian emission line to the model and evaluated the significance of the change in using the F-test (see Bevington 1992). Since the width of the feature is of the same order as the PCA instrumental width we are justified in using a narrow line (ie, a zero-width gaussian). We also checked a posteriori that allowing a finite width did not produce a significant decrease in . Our analysis indicates that the narrow line significantly improves and find a single-trial significance for the 6.4 keV feature of using the spectrum accumulated during intervals 1 and 2. Table 1 summarizes the spectral fits to all 5 intervals, both with and without the line component, and includes the F-test probabilities. Figure 2 shows the residuals (Data - Model, in units of standard deviations) as a function of channel energy for the sum of intervals 1 and 2 using only the best fitting OTTB continuum model (a), and the continuum plus gaussian line at 6.4 keV (b). After modeling the feature at 6.4 keV we still see a weaker excess near keV. If we just model this feature while ignoring the 6.4 keV excess, we find an F-test significance for the additional 2 parameters of only 0.075, so statistically it is much less compelling than the 6.4 keV feature, however, we note that the fitted centroid is consistent with a harmonic relationship to the 6.4 keV feature.
We did not find any evidence for significant excesses in the residuals from intervals 3 through 5. To emphasize this we show in figure 3 the residuals from a fit to the sum of intervals 4 and 5 using the OTTB model which reveal no evidence for an excess. We note that the OTTB continuum is much softer in these intervals than the first two (see Table 1 and Ibrahim et al. 2000).
At the PCA countrates observed during the precursor deadtime effects are not entirely negligible. We have shown elsewhere (Ibrahim et al. 2000) that for the observed rates during the precursor the effects of deadtime, and in this case more crucially, pulse pile-up, are not sufficient to explain the observed changes in the spectral continuum, nor can pile-up itself produce a narrow spectral feature.
The single-trial significance for the 6.4 keV feature is about . We did analyse a number of independent intervals, so in estimating an overall detection significance we must pay a trials penalty. Although the lines were detected in the first intervals examined we can be conservative and use 6 trials, one for each of the five independent intervals and one for the spectrum obtained by adding intervals 1 and 2. Even with this conservative number of trials we still have a significance of , a robust detection. That the line is present during only a portion of the burst, and not in intervals with similar count rates only tenths of seconds apart provides a solid argument that the feature is not instrumental. Further, the line has large equivalent width (EW), much larger in fact than any previously reported imperfections or residuals that could plausibly be attributed to the PCA response matrix (FTOOLS V4.2 and PCA response matrix generator MARFRMF V3.2.1; Jahoda et al. 2000). All these arguments provide very strong evidence that the line feature at 6.4 keV is real and therefore intrinsic to the source.

3 Summary and Discussion
The spectral behavior reported above is unique in several ways. First, a narrow spectral feature in an SGR burst has not to our knowledge been previously reported, and second, the burst also shows a dramatic spectral softening. Strohmayer & Ibrahim (1998) demonstrated that some bursts from SGR 1806-20 also show significant spectral evolution. Interestingly, the earlier result from SGR 1806-20 is similar in that the trend is for hard to soft evolution. Finally, the line feature is only present during the hardest spectral intervals, suggesting a possible connection between these properties.
The presence of line emission during an SGR burst raises a host of interesting questions concerning the production mechanism and has many implications for models of SGRs. It is beyond the scope of this paper to attempt an exhaustive description of possible models, rather, we qualitatively discuss several possibilities.
Of the various models proposed for SGR bursts the most often discussed have been the magnetar model (Thompson & Duncan 1995) and models based on sudden accretion (see Colgate & Petschek 1981; Epstein 1985; Colgate & Leonard 1993; Katz, Toole & Uhruh 1994). To date there has been little direct evidence to support accretion scenarios. An intriguing possibility, however, is that the line is due to fluorescence of iron in relatively cool material located near the neutron star. Such features have been observed in a number of astrophysical systems, including accreting X-ray pulsars and magnetic CVs (see White, Nagase & Parmar 1993; Ezuka & Ishida 1999; and references therein). In the X-ray pulsars some portion of the line EW is correlated with the observed absorbing column, , indicating that some of the line EW is due to fluorescence in the absorbing material, most likely the stellar wind from the secondary. In some circumstances there is evidence for an uncorrelated EW indicating an additional source of fluorescing material and it has been suggested that matter might accumulate in the Alfven shell (Inoue 1985; Basko 1980) or perhaps an accretion disk (see Bai 1980).
The appearance of lines in the disk accretors, Her X-1 and Cen X-3 indicates that a disk can also be an efficient reprocessor. The fluorescent lines from accreting X-ray pulsars are strong with EWs greater than 100 eV. This is at least qualitatively similar to the feature described here. If the line is due to 6.4 keV iron emission in the rest frame then the fluorescing material cannot be the stellar surface itself because of the absence of any significant redshift. Assuming the rest-frame energy of the line is 6.4 keV we can place a 90 % confidence lower limit of km on the altitude of the fluorescing material above a typical neutron star ( and km). Note that this estimate also ignores any possible effects of a magnetar strength field on the line spectrum. However, the question remains as to the source of the fluorescing material.

SGR giant flares likely produce a hot, optically thick electron-positron plasma in the magnetosphere (Thompson & Duncan 1995). Energy from this radiating plasma will likely be conducted into the surface of the star, which increases the crust temperature, and may also blow off a baryon wind. (Thompson & Duncan 1995). It is conceivable that an ablation process caused either by the precursor itself, or perhaps by the giant flare which occurred on August 27th, 1998 may have ejected enough iron-rich material into the neutron star environment to produce the flourescence. Somewhat related processes have been discussed in the context of the putative iron lines from gamma-ray burst afterglows (see Piro et al. 1999; Ghisellini, Lazzati, & Campana 1999). The SGR phenomenon reported here could conceivably be similar but on a smaller scale.
The apparent changes in spin down rate observed in SGR 1900+14 (Marsden, Rothschild & Lingenfelter 1999) have been used to argue for the presence of circumstellar material to produce the spin down torques. This material might be co-moving ejecta from the supernova explosion (Marsden et al. 1999), or perhaps a fall back accretion disk (see Chatterjee et al. 1999; Alpar 1999). It is possible that such material could be the source of a fluorescence line. Another clue would seem to be the dissapearance of the line as the continuum softens. This appears to be qualitatively consistent with fluorescence as the line mechanism, as the line strength will depend on the number of photons above the Fe K-edge absorbed in the fluorescing material, and as the spectrum hardens (softens) this quantity will increase (decrease).
Although the weaker excess at keV is not compellingly significant on its own, the harmonic relationship with the 6.4 keV feature is suggestive of cyclotron emission from accreting pulsars (see Nagase 1989; Dal Fiume et al. 1999). For magnetar-strength fields electron cyclotron transitions would lie above an MeV, well above the bandpass of RXTE/PCA. However, Duncan & Thompson (2000) have recently pointed out the following mechanism involving proton and alpha particle cyclotron transitions. In the magnetar model, the giant flare on August 27th produces a hot ( MeV) trapped fireball in the stellar magnetosphere. Heavy nuclei are ejected from the stellar surface into this fireball, where they photodissociate and subsequently settle to form a thin layer of light elements on the stellar surface. In the August 29 precursor which follows, radiative heating of the star’s surface gives rise to emission at the cyclotron fundamental of each ion, separated by a factor two in frequency. If the 6.4 keV line is the He4 cyclotron fundamental, then the implied surface field strength is G. This estimate takes into account a redshift correction from the surface of a canonical neutron star. The alternative interpretation of the lines as first and second proton harmonics in G seems less plausible. In any case, the surface field strength somewhat exceeds the dipole field strength deduced from the spindown of SGR 1900+14; but note that the multi-peaked pulse profile in the tail of the Aug. 27th flare gives evidence for stronger higher-order multipoles (Thompson et al. 2000). More work is required to determine if this model can account for the observed line EW and other details, but it is an intriguing possibility.
It is sometimes difficult to draw firm conclusions based on a single example, however, our results argue strongly for detailed spectral studies of the whole sample of bursts observed with RXTE from SGR 1900+14, a project we are pursuing. Studies with instruments possessing greater spectral resolution (such as Chandra and XMM, if they can handle the high fluxes) may hold great promise for further testing the magnetar hypothesis for SGRs.
References
- (1)
- (2) Alpar, M. A. 1999, astro-ph/9912228
- (3) Bai, T. 1980, ApJ, 239, 328
- (4) Basko, M. M. 1980, A&A, 87, 330
- (5) Baykal, A., Swank, J. H., Stark, M. J. 2000, A&A submitted
- (6) Bevington, P. R. 1992, “Data Reduction and Error Analysis for the Physical Sciences,” (New York: McGraw-Hill), 2nd ed.
- (7) Bezchastnov, V. G. et al. 1996, Gamma-Ray Bursts, 3rd Huntsville symposium, AIP 384, 907
- (8) Chatterjee, P., Hernquist, L., Narayan, R. 1999, astro-ph/9912137
- (9) Colgate, S. A., & Petschek, A. G. 1981, ApJ, 248, 771
- (10) Colgate, S. A., & Leonard, P. J. T. 1993, Proc. of BATSE Gamma-ray Burst Workshop, 21
- (11) Dal Fiume et al. 1999, Adv. Space Res., in press
- (12) Duncan, R. C. & Thompson, C. 2000, private communication
- (13) Duncan, R. C. & Thompson, C. 1992, ApJ, 392, L9
- (14) Epstein, R. I. 1985, ApJ, 291, 822
- (15) Ezuka, H. & Ishida, M. 1999, ApJS, 120, 277
- (16) Feroci, M. et al. 1999, ApJ, 515, L9
- (17) Frail, D. A., Kulkarni, S. R., & Bloom, J. S. 1999, Nature, 398, 127
- (18) Ghisellini, G., Lazzati, D. & Campana, S. 1999, A&AS, 138, 545
- (19) Harding, A. K., Contopoulos, Ioannis, & Kazanas, D. 1999, ApJ, 525, L125
- (20) Hulleman, F., van Kerkwijk, M. H., Verbunt, F. W. M., & Kulkarni, S. R. 2000, astro-ph/0002474
- (21) Hurley, K. et al 2000, private communication
- (22) Hurley, K. et al. 1999a, ApJ, 510, L111
- (23) Hurley, K. et al. 1999b, Nature, 397, 41
- (24) Ibrahim, A. I. et al. 2000, ApJ, submitted
- (25) Inoue, H. 1985, SSRev, 40, 317
- (26) Jahoda, K. 2000, private communication
- (27) Kaspi, V. M., Chakrabarty, D., & Steinberger, J. 1999, ApJ, 525, L33
- (28) Katz, J. I., Toole, H. A., & Unruh, S. H. 1994, ApJ, 437, 727
- (29) Kouveliotou, C. et al. 1998, Nature, 393, 235
- (30) Kouveliotou, C. et al. 1999, ApJ, 510, L115
- (31) Kulkarni, S. R., Frail, D. A., Kassim, N. E., Murakami, T., Vasisht, G. 1994, Nature, 368, 129
- (32) Marsden, D. Rothschild, R. E., & Lingenfelter, R. E. 1999, ApJ, 520, L107
- (33) Marsden, D. , Lingenfelter, R. E., Rothschild, R. E., & Higdon, J. C. 1999, astro-ph/9912207
- (34) Mereghetti, S., Israel, G. L., & Stella, L. 1998, MNRAS, 296, 689
- (35) Mereghetti, S. 1999, astro-ph/9911252
- (36) Murakami, T. et al. 1994, Nature, 368, 127
- (37) Nagase, F. 1989, PASJ, 41, 1
- (38) Paczynski, B. 1992, Acta Astronomica, 42, 145
- (39) Piro, L. et al. 1999, A&AS, 138, 431
- (40) Thompson, C. and Duncan, R. C. 1992, ApJ, 392, L9
- (41) Thompson, C. and Duncan, R. C. 1995, MNRAS 275, 255
- (42) Thompson, C. and Duncan, R. C. 1996, ApJ, 473, 322
- (43) Thompson, C., Duncan, R. C., Woods, P. M., Kouveliotou, C., Finger, M. H., & van Paradijs, J. 2000, astro-ph/9908086
- (44) White, N. E., Nagase, F., & Parmar, A. N. 1993, in X-ray Binaries, ed. W.H.G. Lewin, J. van Paradijs & E.P.J. van den Heuvel (Cambridge Univ. Press), 1
| Interval | kT (keV) | ( cm-2) | (keV) | f (cm-2 s-1) | EW (eV) | dof | ||
|---|---|---|---|---|---|---|---|---|
| 1+2 (line) | 33.8 4.1 | 3.8 | 6.48 | 0.24 | 414 | 3.8 | 18.5 | 30 |
| 1+2 (no line) | 26.9 2.6 | 4.9 | 36.5 | 32 | ||||
| 1 (line) | 42.6 9.2 | 3.9 | 6.40 | 0.30 | 398 | 1.68 | 19.5 | 26 |
| 1 (no line) | 34.8 5.9 | 5.0 | 26.7 | 28 | ||||
| 2 (line) | 23.8 3.1 | 3.3 | 6.56 | 0.20 | 440 | 1.1 | 13.5 | 23 |
| 2 (no line) | 18.9 2.4 | 4.9 | 23.3 | 25 | ||||
| 3 | 15.9 1.4 | 4.1 | 34.5 | 32 | ||||
| 4 | 11.8 0.9 | 3.9 | 16.7 | 27 | ||||
| 5 | 20.4 2.1 | 5.1 | 29.0 | 29 |