On the Nature of Andromeda IV111Based on observations with the NASA/ESA Hubble Space Telescope, obtained at the Space Telescope Science Institute, which is operated by the Association of Universities for Research in Astronomy, Inc. under NASA contract No. NAS5-26555. ,222Based on observations made with the William Herschel and Isaac Newton telescopes operated on the island of La Palma by the Isaac Newton Group in the Spanish Observatorio del Roque de los Muchachos of the Instituto de Astrofisica de Canarias.
Abstract
Lying at a projected distance of 40′ or 9 kpc from the centre of M31, Andromeda IV is an enigmatic object first discovered during van den Bergh’s search for dwarf spheroidal companions to M31. Being bluer, more compact and higher surface brightness than other known dwarf spheroidals, it has been suggested that And IV is either a relatively old star cloud’ in the outer disk of M31 or a background dwarf galaxy. We present deep HST WFPC2 observations of And IV and the surrounding field which, along with ground-based long-slit spectroscopy and H imagery, are used to decipher the true nature of this puzzling object. We find compelling evidence that And IV is a background galaxy seen through the disk of M31. The moderate surface brightness (24), very blue colour (VI 0.6), low current star formation rate (0.001 M⊙ yr-1) and low metallicity (10% Z⊙) reported here are consistent with And IV being a small dwarf irregular galaxy, perhaps similar to Local Group dwarfs such as IC 1613 and Sextans A. Although the distance to And IV is not tightly constrained with the current dataset, various arguments suggest it lies in the range 5D8 Mpc, placing it well outside the confines of the Local Group. It may be associated with a loose group of galaxies, containing major members UGC 64, IC 1727 and NGC 784. We report an updated position and radial velocity for And IV.
1 Introduction
Andromeda IV is an enigmatic object first discovered by van den Bergh (1972) during his photographic search for dwarf spheroidal companions to M31. On deep optical plates, it appears as a faint smudge lying at a projected distance of 40′ or 9 kpc (assuming D784 kpc, Holland (1998); Stanek & Garnavich (1998)) to the south-west of M31 (see Figure 1). Noted immediately as being more compact, bluer and of higher surface brightness than the other dwarf spheroidals he identified, van den Bergh suggested And IV was either a relatively old star cloud’ in the outer disk of M31333And IV actually appears listed as the open cluster C188 in the Atlas of the Andromeda Galaxy (Hodge, 1981). or a background dwarf galaxy. If in the disk of M31, And IV would have a size of 200 pc and lie at a deprojected distance from the center of 25 kpc (5 disk scalelengths, beyond the optical edge of the stellar disk), thus representing an example of a large diffuse star cluster which has formed in the outer regions of a galaxy where there is very little star formation at the present epoch. Such an object could potentially yield important insight into the nature of the star formation process under the extreme physical conditions of low gas surface density, high gas fraction and long dynamical timescales. On the other hand, And IV could be yet another example of a previously uncatalogued dwarf galaxy lurking in our local environs, perhaps even bound to M31 (eg. Armandroff, Davies & Jacoby (1998); Armandroff, Jacoby & Davies (1999)). Determining the distance, constituent stellar populations and evolutionary state of this puzzling object is therefore of obvious importance.
Ground-based study of And IV has been severely hampered due to the presence of a bright (V10) foreground star lying within 30′′ (see Figure 1) and by the combination of faintness and crowding of M31 stars along the line of sight. Jones (1993) used CFHT imagery to construct a colour-magnitude-diagram (CMD) to V23 of the And IV region, which he interpreted as representing a young population of stars with a narrow age range, an unusually large’ open cluster in M31. Jones’s data, however, did not allow a proper statistical subtraction of M31 field stars to be carried out and thus the possibility remains of a significant foreground M31 contamination in his And IV CMD. The reported HI detection of And IV is also rather uncertain. In their catalogue of extragalactic HI observations, Huchtmeier & Richter (1989) list an HI radial velocity for And IV of 375 km/s. This measurement can be traced back to the early work of Emerson (1974), who used the Cambridge Half-Mile telescope to map the disk of M31 with a spatial resolution of 1.5′ 2.2′. Emerson (1974) notes that And IV appears projected near a faint outer HI arm of M31 (see also Unwin (1980)) and that the measured velocity of the HI along this arm (375 km/s ) is consistent with that expected at that location in the disk based on the major axis rotation curve. The case for the association of this gas with And IV, as opposed to merely M31’s disk, would appear to have no stronger foundation than this, and therefore must be regarded as weak.
Detailed study of the structure and stellar populations of And IV requires the high resolution imaging capability of Hubble Space Telescope. We were awarded 5 orbits of Cycle 6 HST/WFPC2 time to observe And IV and the surrounding M31 field. We present these data here, along with supporting ground based observations (H imagery and optical long-slit spectroscopy). This new dataset clearly resolves the true nature of And IV, for the first time, as a small background dwarf irregular galaxy unassociated with M31. A companion paper will present an analysis of the field stellar populations in the outskirts of M31, derived from the same HST/WFPC2 dataset (Ferguson, et al 2000, in preparation).
2 Observations and Reductions
2.1 HST/WFPC2 Observations
HST/WFPC2 images were taken of And IV and the surrounding M31 field over five orbits on October 31, 1998 (GO #6734). The 3 WF cameras provide an L-shaped FOV of 150″ by 150″ with 0.1″ pixels, while the PC provides a square 34″ by 34″ FOV with 0.046″ pixels. Total exposure times amounted to 6000s and 6100s in the F555W (WFPC2 broadband V) and F814W (WFPC2 broadband I) filters respectively. The proximity of a very bright star (10th mag) to And IV imposed stringent roll angle constraints on our observations in order to avoid excessive scattered light and bright-object artifacts in our primary region of interest. The optimal orientation of the camera placed And IV largely on the WF3 chip and the bright star on the edge of WF4, a strategy which rendered the WF4 chip essentially useless but kept the region around And IV free of diffraction spikes and other artifacts. The WF3-FIX aperture was centered on 00h42m30.1s and 40∘34′32.7″. Both the WF2 and the PC imaged the surrounding field populations of M31.
Images were processed through the standard STScI pipeline. The frames were split into images of each individual CCD and the vignetted regions of the chips set to zero. The data were taken undithered and measurements of several bright stars confirmed no shifts were required to align the individual frames before combining. Images taken through a given filter were combined using the cosmic-ray rejection algorithm CRREJ in IRAF 444IRAF is distributed by the National Optical Astronomy Observatories, which are operated by the Association of Universities for Research in Astronomy, Inc., under cooperative agreement with the National Science Foundation.. Corrections were applied for warm pixels using pixel lists provided by STScI that were generated closest to the date of the observations. Figure 3 shows a colour representation of the combined F555W and F814W WF3 images; AndIV is clearly visible as a diffuse blue concentration towards the lower left of the chip.
2.2 HST/WFPC2 Photometry
Photometry was performed using the IRAF implementation of the crowded-field photometry package DAOPHOT/ALLSTAR (Stetson, 1987). Stars were detected on each chip using a DAOFIND threshold of 5, a value found to maximise the number of real stars detected while maintaining a low level of spurious sources. Given that our field is relatively crowded (70008000 stars per WF chip), there were few truly isolated bright stars suitable for characterizing the point-spread function (PSF). Our approach was instead to select a set of 30 of the brightest stars on each chip, subtract out all the other stars using a first-guess PSF and then use the remaining clean’ stars to construct a more refined PSF model. This was done for each filter/chip combination. The PSF models were based on Moffat functions with 1.5 and a look-up table of residuals, and these shapes were held constant across each chip. ALLSTAR photometry was carried out using the parameter values recommended by Cool & King (1995) to maximize the performance. We also experimented with using Tiny Tim PSFs for the photometry instead of PSFs built from the images themselves, and found that the results were generally very similar.
Aperture corrections were derived in the same manner to that used to construct PSF models, namely by isolating the brightest stars on each chip and subtracting out the rest. Total magnitudes were measured for the remaining stars using an aperture of radius 0.5″ (Holtzman et al., 1995b) and aperture corrections were defined in the sense . As the focus and PSF shape is a function of position on the WFPC2, aperture corrections were allowed to vary linearly across each chip. Corrections were also applied for geometric distortion and charge transfer efficiency using the recommendations of Holtzman et al. (1995a) and Whitmore, Heyer & Casertano (1999) respectively. Before transforming the instrumental magnitudes to the standard system, we corrected our data for the effects of extinction. We adopted a foreground Galactic reddening of E(BV)0.080.02 towards M31555Note that Schlegel, Finkbeiner & Davis (1998) quote the slightly lower value of E(BV)0.062 for the Galactic reddening towards M31, derived from the mean dust emission detected by DIRBE in surrounding annuli.. (Burstein & Heiles, 1984) and used Table 12(b) of Holtzman et al. (1995b) to derive the corresponding extinctions in the HST bandpasses. As And IV lies well beyond the main HI disk of M31, in a region where the mean N31020 cm-2, (Emerson, 1974; Unwin, 1980; Sofue & Kato, 1981), the reddening due to M31’s disk is low for all reasonable gas-to-dust ratios and hence we apply no correction. As And IV appears projected on a faint outer HI arm, there does exist the possibility of differential reddening across the face of the object (Emerson, 1974; Unwin, 1980). Unfortunately, we have no way to estimate the magnitude of this effect but it should be kept in mind. Transformation to standard Johnson-Cousins V- and I-band magnitudes was carried out via the iterative approach described in Holtzman et al. (1995b), and adopting the values presented in their Table 7.
Our photometry reaches to V27.5, I26.5. Typical 1- photometric errors for stars at 25th magnitude are 0.06 and 0.08. Only stars for which ALLSTAR photometry was deemed high quality (2 and 0.2sharpness0.2) are used in our final analysis. The completeness level at faint magnitudes is not a serious concern for the analysis that we present here, and we postpone a detailed discussion of this issue to a future paper. Past experience with WFPC2 photometry leads us to expect 80% completeness above V26 and I25.5 (Dohm-Palmer et al., 1997; Cole et al., 1999). Our analysis in this paper focuses only on those stars detected in the WF3 chip.
2.3 Ground-based Follow-Up Observations
We also obtained complementary ground-based imaging and spectroscopy of the And IV region. Deep narrow-band observations were obtained via the ING service program in August 1999 using the INT 2.5m telescope equipped with the Wide Field Camera at the f/3.3 prime focus. The Wide Field Camera consists of 4 thinned EEV 4k2k CCDs, each covering an area of 23′11′ on the sky with 0.33″ pixels. Our images therefore include a large portion of the surrounding M31 field. Exposures of 3800s were taken through a narrow-band H filter (6568Å, 95Å) and a 300s exposure through broadband Sloan r for the continuum subtraction. Conditions were photometric, but poor seeing prevailed (22.5″). The images were reduced in the standard manner (see for example, Ferguson, Wyse, Gallagher & Hunter (1996)) and observations of the spectrophotometric standard Feige 110 from the list of Massey, Strobel, Barnes & Anderson (1988) were used for the photometric calibration. The average sensitivity of the H continuum-subtracted image, taken to be 1 of the sky background, is determined to be 2.710-17 erg s-1 cm. Figure 3 shows portions of both the unsubtracted and the continuum-subtracted H images centered on And IV, with the WFPC2 field-of-view overlaid on the continuum-subtracted image. Several faint emission line sources are clearly visible in the vicinity of And IV.
We obtained long-slit optical spectroscopy of several of these objects in September 1999 using the WHT 4.2m and the ISIS double-beam spectrograph. The R300B grating was used with a 4k2k thinned EEV CCD in the blue arm to cover the range 3700Å5300Å with 3.4Å resolution; in the red arm, we used the R316R grating and a 1K1K TEK CCD to cover 5700Å7200Å with 3Å resolution. The slit length and width were 3.7′ and 1″ respectively. Conditions were excellent with sub-arcsecond seeing. Most observations were made at very low airmass to minimize the effects of differential atmospheric refraction. In addition, the slit was rotated close to the parallactic angle whenever the airmass exceeded 1.2. Total exposure times ranged from 18006300s, depending on the brightness of the source. Spectra of CuAr and CuNe lamps were made during the night to provide a wavelength calibration and observations of spectrophotometric standards from the list of Massey, Strobel, Barnes & Anderson (1988) were made for the flux calibration.
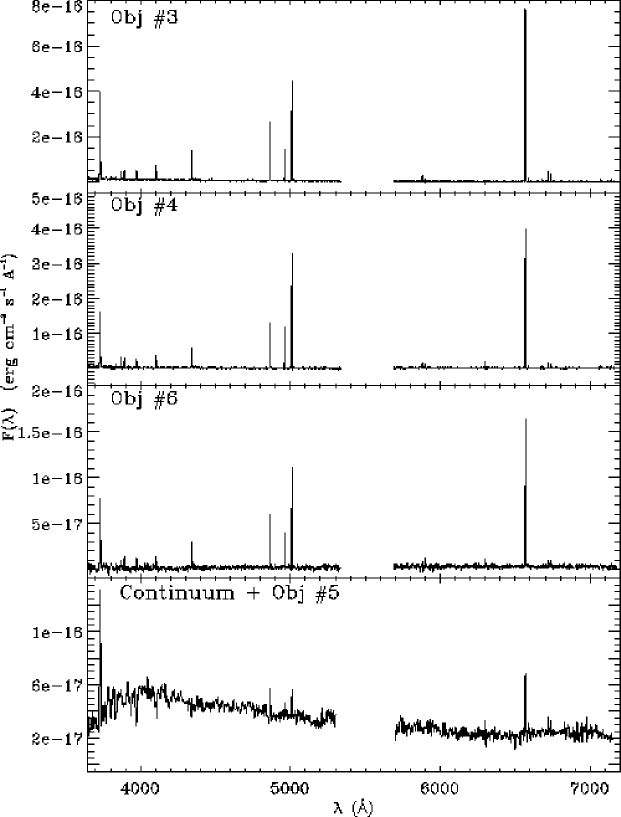
Given the faintness of the emission line sources, special care was required during the processing of the spectra. Individual 2-dimensional spectra from a given slit position were aligned to the nearest integer pixel and the sky removed by fitting a low order polynomial fit with the IRAF BACKGROUND task. The spectra were subsequently averaged together using a cosmic-ray rejection algorithm and apertures ranging from 3-4″ were used to extract one-dimensional spectra of each emission-line object. Care was taken to ensure that red and blue spectra for a given object corresponded to the same physical apertures (both size and shape). A region of 20″ centered on the brightest continuum emission from And IV was also extracted. The one-dimensional spectra were wavelength and flux calibrated with residuals of 0.5Å and 0.02-0.04 mag respectively. In Figure 4, we show the calibrated spectra for the three brightest nebulae (#3,4,6) in the vicinity of And IV as well as for the underlying continuum emission.
3 Results
3.1 Stellar Populations
3.1.1 Resolved Emission
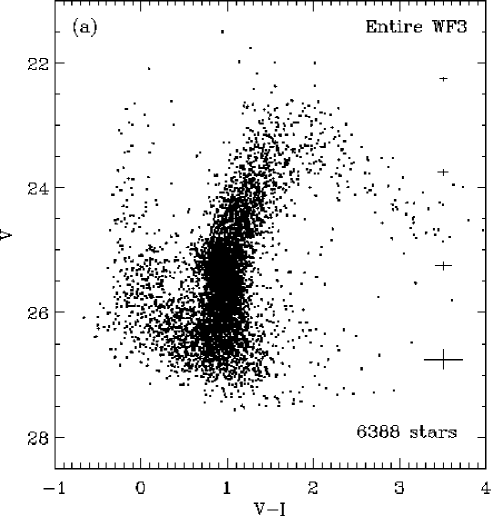
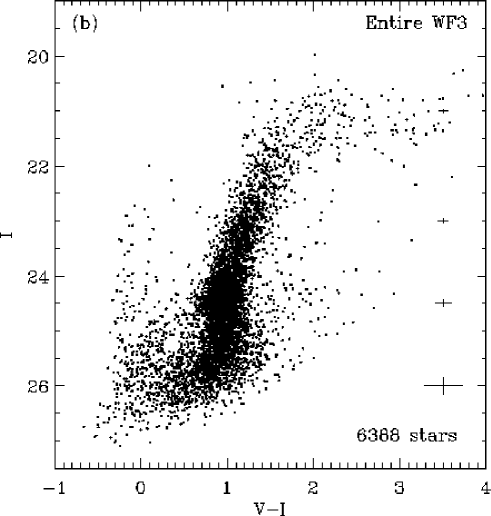
The (V,VI) and (I,VI) colour-magnitude diagrams (CMDs) of 6388 stars detected in the WF3 chip are shown in Figure 5. These CMDs reveal a prominent red giant branch (RGB) with a significant intrinsic width, a red clump, a weak blue plume and a possible blue horizontal branch. The striking downturn of the RGB at red colours (VI2) has previously been seen in the outskirts of M31 (eg. Holland, Fahlman & Richer (1996)) and indicates the presence of a metal-rich component to the stellar population. Based on standard star count models (Gilmore, 1981; Wyse & Gilmore, 1989), we expect 20 stars redder than the RGB and 1 star bluer than the RGB between 21V27 along this line of sight towards M31. Galactic field stars are therefore expected to contaminate our field by a negligible amount (0.3%).
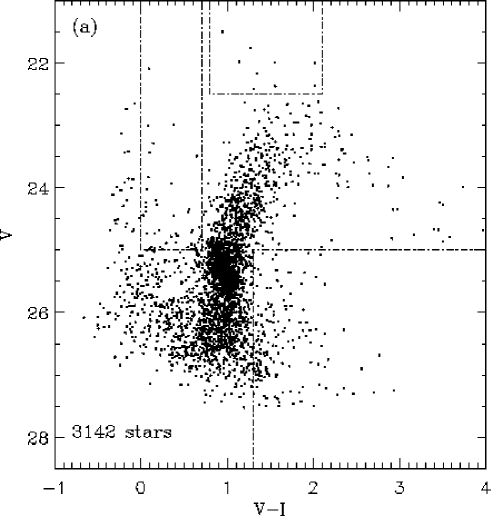
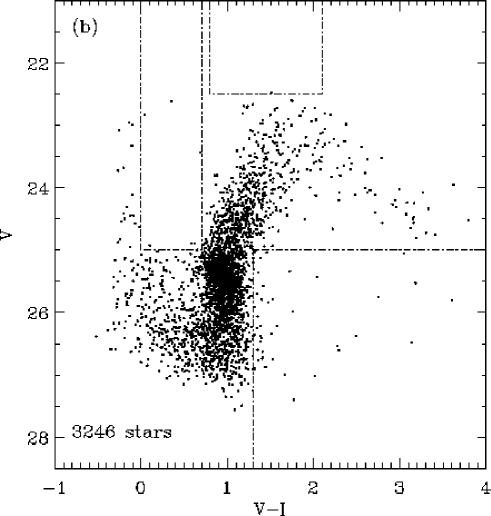
It is difficult to tell from visual inspection of Figure 3 alone what fraction of And IV has resolved on our deep images. In order to isolate the signature of And IV stars from those of the M31 disk, we constructed CMDs for stars lying within a box of 4060′′ centered on the brightest emission from And IV and for stars lying on the remaining area of WF3, which we will refer to as the M31 field’ (see Figure 6). This physical region was selected as it completely encompasses the area of diffuse’ emission which defines And IV in Figures 1 and 2. Taking account of the slighly differing areas (0.9:1), we find that the number of stars detected in each region of the chip is largely consistent with a uniform distribution of stars, and indicates only a 10% enhancement in star counts (at least to the limits of our photometry, V27.5) in the neighbourhood of And IV. This is a strong indication that only a fraction of And IV has resolved.
Comparison of the morphology of the CMDs in the different areas of the chip reveals some puzzling differences however. The boxes in Figure 6 indicate regions of the CMDs that are populated by stars in the vicinity of And IV but not in the M31 field. There are, for example, considerably more faint stars redward of the RGB (VI1.3, V25) on the And IV CMD than on that of the M31 field (159 stars versus 44). Likewise, the region in between the blue plume and the RGB (V25, 0VI0.7) is also more populated on the And IV CMD (45 versus 7 stars) as is the region just above the RGB (V2.5, 0.8VI2.1, 9 versus 1 star). These overdensities are significant, especially when account is made for the slightly differing physical areas that the stars on each CMD are drawn from.
We first investigate whether the stars detected in the vicinity of And IV simply have larger photometric errors than those in the surrounding M31 field, causing them to exhibit broader blue plumes and red giant branches and scatter to both brighter and fainter magnitudes. The increased and more variable sky background in the And IV region of the chip could possibly lead to this effect, as could increased crowding. To test for this, we calculated the mean photometric errors returned by ALLSTAR in 0.5 magnitude bins for stars lying on and off the And IV area. While the magnitude errors are very similar over most of the magnitude range, they start to diverge towards faint magnitudes. Still, the effect is small. At V27, photometric errors for stars near And IV differ by only 0.05 mag from stars located elsewhere on WF3. Thus, while increased photometric scatter can partially explain some of the faint stars redward of the RGB, it cannot explain all of them. Furthermore, increased photometric uncertainties seem an unlikely explanation for the excess populations of stars seen in other regions of the CMD.
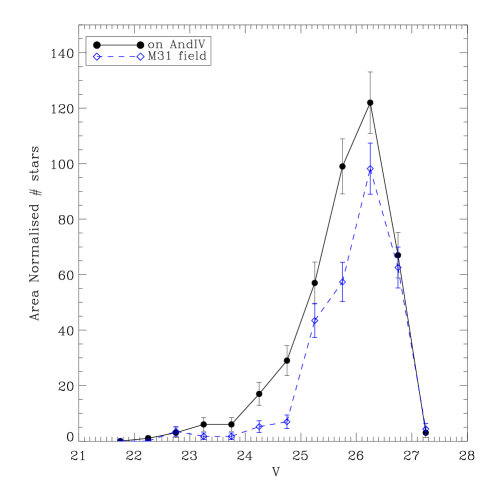
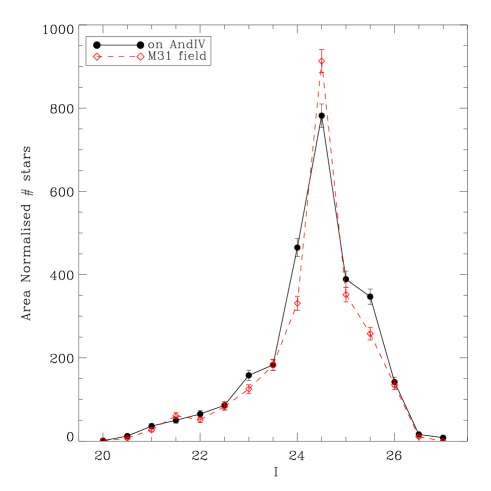
We then address the issue of whether the excess’ populations of stars seen in the And IV CMD could be the signature of a distinct, partially resolved stellar population lying at a significant distance beyond M31? Indeed, the stars lying within the marked boxes of the CMD in Figure 6 account for roughly half the observed stellar overdensity seen towards And IV. These stars could appear offset from the M31 main sequence and RGB due to internal extinction within either the galaxy itself, or due to variable small-scale extinction in the foreground disk of M31. We constructed RGB and main-sequence luminosity functions (LFs) in 0.5 mag bins for stars lying within the box centered on And IV and those lying elsewhere on the chip (Figure 7). We crudely define RGB stars as those with VI0.6 and main-sequence stars as those with VI0.6 (this definition will also allow the inclusion of blue horizontal branch stars into the main sequence’ sample) and normalise the counts in each region for their slightly different areas. Comparison of the main-sequence LFs indicates a genuine excess of blue stars in the vicinity of And IV with respect to the M31 field over the entire magnitude range probed. On the other hand, inspection of the bottom panel of Figure 7 reveals no obvious excess of red stars towards And IV, but does show an intriguing bump’ on the tail of the And IV RGB LF beyond the red clump, at I 2525.5. This feature also appears in the V-band RGB LF at V 2626.5, but it is not present in the M31 field LF. Quantitative study of this bump is difficult. In this magnitude range, incompleteness is an important factor. In fact, it is probably more of a serious issue in the immediate area of And IV, where the background is higher, than it is elsewhere on the chip; the fact that the bump remains prominent in both passbands suggests it is real. The colour of the feature, VI 1, is suggestive of a population of red giants and we are tempted to speculate that the bump represents a detection of the tip of the red giant branch, or possibly a slightly more luminous extended asymptotic giant branch, in a stellar system located at some distance behind M31. We will return to this issue in more detail in Section 4.
From the analysis of number counts, CMDs and LFs for stars detected in our WFPC2 images, we therefore conclude that there is evidence for only a small enhancement in stellar density towards And IV. Furthermore, a significant fraction of this excess population appears displaced from the main sequence and red giant branch of M31 field stars. While this may imply that And IV is not a star cluster lying in M31’s disk, we are not able to rule out the possibility of a highly-skewed mass function which would allow And IV to still be associated with M31 but not to resolve to the same extent. We therefore turn our attention to other aspects of the WFPC2 data, as well as to other data, in order to derive additional constraints on the nature of the object.
3.1.2 Unresolved Emission
One of the outputs of the ALLSTAR PSF-fitting photometry package is a residual image where all detected and photometered stars have been fit with the adopted PSF and subtracted out. Figure 8 shows the residual WF3 F555W image, which has been smoothed with a box of 10 pixels ( 1′′) to remove the residuals of subtracted stars and to increase the signal-to-noise of the faintest emission. A large fraction of unresolved light very clearly remains around And IV; the light distribution appears to be somewhat centrally-concentrated with a regular structure. By comparing the emission remaining in the residual image with that in the original image, we find that only 40% of the F555W light in the And IV region of WF3 has resolved, as compared with 70-80% of the light elsewhere on the chip. For the F814W image, these numbers are 50% and 8090% respectively. This confirms our earlier conclusion that only a small fraction of And IV has resolved compared to the M31 field. From the smoothed image, we are able to define a more accurate centre for And IV, which we report here as 00h42m32.3s and 40∘34′18.7″.
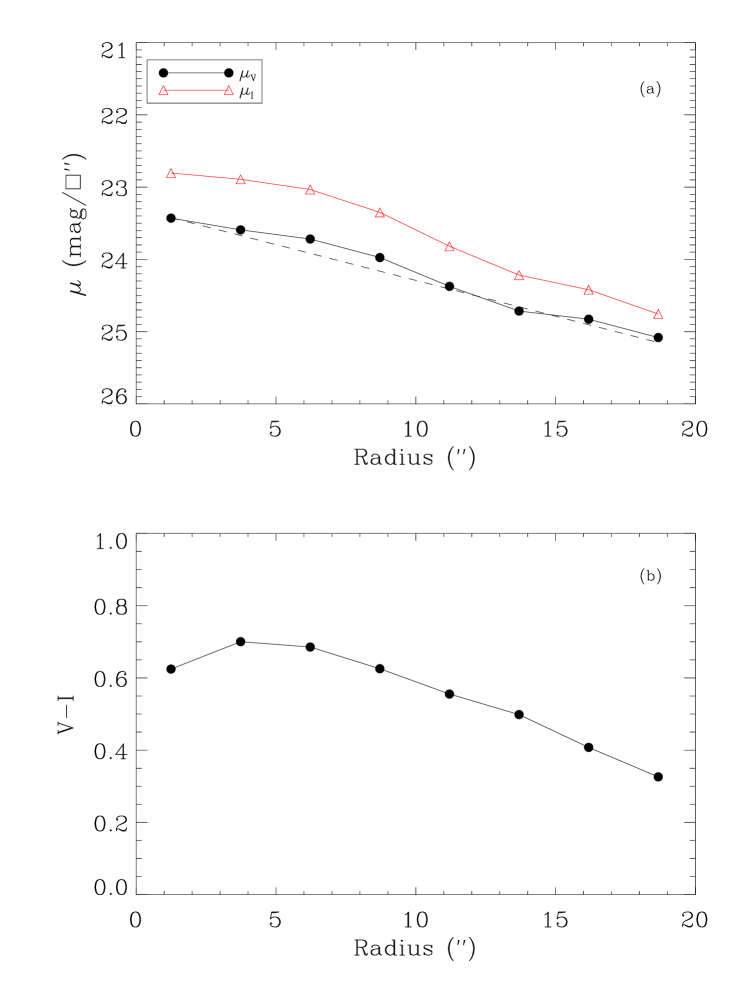
The unresolved emission of And IV is of moderately low surface brightness and very blue colour. Using the residual F555W and F814W images, we measure 24.0, 23.4 and 0.64 within a 3034′′ box centered on And IV. We have constructed crude surface brightness profiles for And IV using the 1010 pixel boxcar-smoothed images. Elliptical aperture photometry was carried out using a fixed position angle and ellipticity, both of which were determined by eye to best match the poorly-defined And IV isophotes. The upper panel of Figure 9 shows the V and I-band surface brightness profiles derived out to a radius of 20″ (the extent of the bright residual emission on our WFPC2 image) from the center of And IV. The profiles are observed to decline slowly and smoothly with increasing galactocentric radius. A model of an exponential disk with 23.3 and 11″ is overplotted; such a light profile appears to provide a good match to the V-band light of And IV. The lower panel of Figure 9 shows the VI radial colour gradient and indicates a gradual trend of bluer colours towards larger radii, although the S/N ratio becomes very low in these regions.
Surface brightness profiles of open clusters are well-fit by King profiles (eg. Mathieu (1984)), reflecting their tidal limitations. On the other hand, small dwarf irregular galaxies are typically characterised by approximately exponential profiles and small colour gradients (eg. Bremnes, Bingelli & Prugniel (1999)). It thus seems that the exponential profile we find here is further evidence against And IV being an open star cluster in M31; instead, it may support the idea that it is a background dwarf galaxy.
3.2 Ionized Gas
Our deep H images reveal eight compact emission-line sources in the general vicinity of And IV, five of which lie within 1′ of our new adopted centre (Figure 3). This clustering of emission-line sources represents a significant overdensity compared to the rest of the field contained in our wide-field images, and suggests a connection between at least some of the sources and the faint diffuse continuum emission which defines And IV. Table 1 lists the positions and fluxes of the H sources, their projected distances from the adopted centre of And IV and indicates whether the source appears to be resolved on our images and whether it has a continuum counterpart. The H fluxes have been measured within a circular aperture of radius 5″, and have been corrected for both Galactic extinction using Burstein & Heiles (1984) and [NII] contamination using the mean [NII]/H ratio from our spectra (see below). The H fluxes range from 1910-15 erg s-1 cm-2; if at the distance of M31, these sources would have only modest H luminosities of 9681034 erg s-1 which, for reference, are 10100 times fainter than that of the Orion nebula (Kennicutt, 1984). Assuming they are ionization-bounded, such objects would be powered by Lyman continuum luminosities, Q0, of 7501046 photons s-1 (Leitherer & Heckman, 1995), which could possibly be provided by either early B stars666Unfortunately, predictions of ionizing fluxes for stars of spectral types later than B0 do not yet exist, and the few direct observations of the Lyman continuum spectral region in B stars have produced very ambiguous results (see discussion in Schaerer & de Koter (1997)). The latest spectral type considered by Schaerer & de Koter (1997) is a B0.5 V star, which they predict produces an ionizing flux of log Qo(s 47.8. or the luminous central stars of planetary nebulae (Schaerer & de Koter, 1997; Vacca, Garmany & Shull, 1996; Mendez & Soffner, 1997). A concentration of PNe within such a small area of the sky seems rather unlikely however.
If we assume ionization by a single massive star in M31, the most luminous star we could expect to find associated with each nebula would be of type B0.5V with a magnitude of V20 at that distance (Vacca, Garmany & Shull, 1996; Schaerer & de Koter, 1997). We would not expect to find stars much fainter than this, due to the rapid drop-off in ionizing flux as a function of spectral type. Four of the emission-line sources around And IV (#3,4,5,6) lie in the area of the sky covered by our WFPC2 image and so we were able to search our images for luminous and/or very blue stars and compact clusters in the vicinity of each nebula. Objects #3, 4 and 6 are easily recognizable on Figure 3 as being very blue, and in the case of #3 and 4, also extended. As the F555W filter contains the emission lines [OIII]4959,5007 and H, with even a small transmission at H, the nebular morphologies seen at these positions is not surprising. We base our search on the results of aperture photometry, as opposed to PSF-fitting photometry, since the possibility exists that the ionizing sources may be clusters that would not be well-fit by the PSF model; indeed such objects have been deliberately excluded from our final stellar photometry lists (see Section 2.2). The brightest blue sources identified lying within 2″ of the position of each nebula are found to have magnitudes V22.4, 22.6 (Object #3), 23.0 (Object #4) and 24.0 (Object #6), all with VI 0.1. At the distance of M31, these sources would have spectral types ranging from mid to late-B, and as such, would have difficulty in producing the required ionizing fluxes. There are no very blue stars lying within 2″ of Object #5 however there is a luminous red star with V22.4 and VI1.6. Interestingly, this object lies in one of the areas of excess’ stars identified in Figure 6. Given the considerable stellar density in our WFPC2 field, the likely uncertainties in our absolute positions of the emission line sources and the possibility of differential reddening across the face of And IV, it is difficult to draw firm conclusions regarding the properties of the individual stars which are responsible for the ionization of the nebulae. It would appear safe to conclude however, that unless the ionizing stars are highly obscured, they do not lie at the distance of M31. This provides another piece of evidence for And IV lying a significant distance beyond M31.
3.3 Gas-Phase Metallicities
Optical spectra of four of the emission-line sources reveal those in the immediate vicinity of And IV (#3,4,5,6) to be high-excitation HII regions, displaying the usual bright [OII] and [OIII] lines and, in some cases, even marginal detections of the faint temperature-sensitive [OIII]4363Å line (see Figure 4). Objects #7,8, which lie further away from the centre of And IV, appear to be a possible symbiotic nova and a high excitation planetary nebula respectively. No spectra were obtained for Objects #1 and 2.
Emission line fluxes were measured via Gaussian fits to the line profiles. The logarithmic extinction at H, C(H), was derived from measurements of the Balmer lines, using the equation
where Iλ is the intrinsic line flux, Fλ is the observed line flux, and f( is the Galactic reddening function normalized to H. The reddening function of Seaton (1979), was adopted, as parametrized by Howarth (1983), and assuming R=AV/E(BV)=3.1. Intrinsic case B Balmer line ratios were taken from Osterbrock (1989), assuming an electron density of Ne=100 cm-3 and an electron temperature Te=104 K. The values of C(H) derived from the H/H, H/H and H/H ratios agreed within the formal errors and no trend was apparent to indicate the presence of Balmer absorption in the underlying continuum. Given its higher accuracy, we adopt the value of C(H) determined from the H/H ratio in our analysis. The derived values of the logarithmic extinction translate into E(BV) 0.00.11, and indicate that the line-of-sight extinction towards And IV is very low and almost entirely Galactic.
Formal errors in the derived line ratios were determined by summing in quadrature the statistical noise from the photon counts, the uncertainty in the continuum placement (proportional to the width of the line times the rms in the nearby continuum) and the uncertainty in the flux calibration. In addition, the error in C(H) was accounted for in deriving the reddening-corrected line ratios. Table 2 presents the reddening-corrected line strengths (relative to H) for the three brightest HII regions as well as some relevant line ratios. Formal errors are indicated in parentheses.
Oxygen and nitrogen abundances for the HII regions were derived using the well-established semi-empirical’ abundance calibrations proposed by McGaugh (1991, 1994) and Thurston, Edmunds & Henry (1996) via the procedures described in Ferguson, Gallagher & Wyse (1998). These calibrations are based on the strengths of the bright oxygen, nitrogen and Balmer lines of hydrogen via the parameter
A single value of R23 uniquely specifies O/H over most of the range in metallicity, however there is a turnover region (20–50% solar) where the relationship becomes double valued. McGaugh (1994) advocates the use of the [NII] 6584/[OII] 3727 ratio as a way to discriminate between upper and lower branches, noting that it varies monotonically with O/H and is not very sensitive to the ionization parameter since both ions have similar ionization potentials. The division between upper and lower branches is fairly well-defined, with the reddening-corrected log([NII]/[OII])1 indicating the upper branch and log([NII]/[OII])1 indicating the lower branch. Measurements of this line ratio in the HII regions under study here place them all securely on the lower, metal-poor branch of the R23 relation (see Table 2). In most cases, the [NII]6548 line was too faint to measure accurately so we have assumed the theoretical value of [NII]6548[NII]6584/2.95 (Mendoza & Zeippen, 1982) in calculating the N/O ratio. The derived oxygen abundances and nitrogen-to-oxygen ratios are low, ranging from 79% and 916% the solar value respectively. The dominant uncertainties in these estimates are the uncertainties in the model calibrations themselves, which are estimated to be 0.2 dex for log(O/H) and 0.1 dex for log(N/O) (see Ferguson, Gallagher & Wyse (1998) for a detailed discussion). With this in mind, there would appear to be little evidence for an intrinsic metallicity dispersion amongst these HII regions, although Obj #4 does seem marginally enhanced in N/O compared to the other two objects.
How do these chemical abundances compare to those of the M31 disk at deprojected location of And IV? Assuming a position angle of 35∘ and an inclination of 77.5∘ for the M31 disk, we calculate that And IV would have a deprojected radius of 108.4′ or 25 kpc if in the disk. The chemical abundance gradient at large radii in M31 is surprisingly poorly constrained, with the most distant measured HII region lying at only 16 kpc (Dennefeld & Kunth, 1981). Zaritsky, Kennicutt & Huchra (1994) quote values of 12+log(O/H)9.03 at R0.4R25 and a gradient of 0.28 dex/R25 for M31 (normalised to their adopted value of R77.4′ ) derived from the measurements of Dennefeld & Kunth (1981) and Blair, Kirshner & Chevalier (1982). Simple extrapolation of this gradient predicts a gas-phase oxygen abundance of 70% solar at the location of And IV. The HII regions in the vicinity of And IV therefore have metallicities which are roughly an order of magnitude lower than that expected for M31 disk gas at that radius. This finding adds to the mounting evidence that the emission line sources in the vicinity of And IV are not associated with the disk of M31.
3.4 Radial Velocities
Our long-slit spectra also provide a measurement of the radial velocity of each emission-line source. The average velocity and standard deviation determined from the observed wavelengths of the well-detected bright H, [OIII]5007 and H lines are reported for each HII region in Table 2 and are in excellent agreement. These velocities have been corrected by 15.5 km/s to account for the motion of the Earth around the sun. The mean of these averages is 2569 km/s, which can be compared to the value of 24847 km/s derived from the absorption lines in the underlying galactic continuum (see Figure 4). Both velocities differ significantly from the radial velocity of 375 km/s expected for M31’s disk at the projected location of And IV (Emerson, 1974), which is also the velocity reported previously in the literature for And IV. Our results therefore not only establish a direct association between the HII regions and underlying galactic continuum emission, but also provide the final piece of evidence that And IV is unassociated with the disk of M31. We adopt a heliocentric radial velocity of 2569 km/s for And IV.
It is tempting to speculate on whether the spread of velocities that we measure in the And IV HII regions can be considered real. Interestingly, there does appear to be a systematic change of 30 km/s in the radial velocity across the face of And IV going from Objects #3 through 4 to 6, all of which were measured with a single slit position. Given the uncertainties in centroiding the emission lines, as well as the rms residuals of the wavelength solution ( 0.5Å), and the moderate resolution of our spectra, the significance of this gradient should be considered marginal at present.
4 Discussion
We have presented a set of new observations which constrain the nature of the enigmatic object And IV. We find compelling evidence that And IV is not a star cluster lying in the disk of M31. This evidence includes: (i) the fact that the stellar population of And IV does not resolve to the same extent as that of the M31 field population, (ii) the discovery of individual HII regions in the vicinity of And IV which do not appear to be ionized by stars at the distance of M31, (iii) the metallicities of these HII regions are an order of magnitude lower than that expected for the M31 disk at the projected location of And IV, and (iv) the radial velocity of And IV differs by 600 km/s from that expected for the SW side of the M31 disk. Furthermore, the large velocity difference between And IV and M31 also makes it very unlikely that And IV is even a bound satellite of M31. The radial velocities of the known Andromeda satellites generally lie within 100 km/s of the systemic velocity of M31 (Mateo, 1998), whereas And IV differs from that by more than 500 km/s.
Two questions therefore remain: what is the true nature of And IV and where exactly does it lie? We begin by addressing the second issue, since it has bearing on the first. Given our measured heliocentric velocity, it is possible to use dynamical considerations to place a limit on the distance of And IV. Adopting the linear Virgocentric infall model of Schechter (1980) with parameters , Vhelio(Virgo)=976 km s-1, =220 km s-1 (Binggeli, Tammann & Sandage, 1987) and Dvirgo=15.9 Mpc (i.e. Ho=75 km s-1 Mpc-1), And IV’s position and heliocentric velocity imply a distance of 7.0 Mpc. Changing the heliocentric velocity of And IV by km s-1 (ie. the typical magnitude of peculiar motion velocities) has the effect of changing the derived distance by Mpc, ie. by .
Next, we return to the intriguing bump’ seen in the RGB LF of the stars in the vicinity of And IV, which we tentatively associate with the tip of the red giant branch (TRGB) population for a distant stellar system. The TRGB magnitude is known to be very stable at M4 over a wide range of ages (2–15 Gyr) and metallicities, and is widely used as a distance indicator for resolved stellar systems (Lee, Freedman & Madore, 1993). In galaxies with a significant intermediate-age population, the presence of luminous asymptotic giant branch stars above the RGB tends to smear out the edge defining the tip; this effect is very likely to be present in And IV and implies that the distance we derive should be considered as a lower limit to the true distance. From visual inspection, we identify the TRGB from the I-band LF to lie at I25.00.5 and derive a distance modulus of 290.5, corresponding to a linear distance of 6.31.5 Mpc. The agreement between this distance determination and that from a dynamical argument is extremely encouraging, especially given the significant uncertainties in each. Taking the average of these estimates, we therefore place And IV at a distance of Mpc. Reassuringly, this distance implies that the most luminous blue stars detected in the vicinity of the And IV HII regions would have absolute magnitudes in the range of M to , and would therefore correspond to luminous OB stars and clusters, broadly consistent with the observed ionization.
We now turn to clarifying the nature of And IV. The properties established in this paper – moderately low surface brightness, very blue colour and low metallicity – are reminiscent of those observed in typical’ low mass dwarf irregular galaxies (eg. Mateo (1998); Miller (1994)). And IV’s extent of ″ and disk scalelength of ″ correspond to linear sizes of kpc and 360 pc respectively at a distance of 6.7 Mpc, confirming that the galaxy is indeed physically small. Many dwarf irregulars exhibit a small amount of ongoing star formation, with rates ranging from 0.00010.01 M⊙ yr-1 (Mateo, 1998; Miller, 1994; Hunter, Hawley & Gallagher, 1993). Summing the H flux (corrected for Galactic reddening but not that internal to And IV itself) from the 5 HII regions detected within 1′ of And IV, we derive a current star formation rate of 2.6 (D/Mpc)2 M⊙ yr-1 using the proportionality between SFR and H luminosity derived by Kennicutt, Tamblyn & Congdon (1994). At our derived distance of 6.7 Mpc, this translates into 0.001 M⊙ yr-1 and is therefore highly consistent with the rates measured in local dwarfs. Yet another constraint is provided by the gas-phase metallicity of And IV. Based on the mean oxygen abundance of solar measured for the And IV HII regions, the metallicity-luminosity relation of Skillman, Kennicutt & Hodge (1989) predicts M15 which, once again, supports the identification of And IV as a dwarf galaxy.
In terms of properties such as star formation rate, metallicity, central surface brightness and inferred luminosity, And IV appears very similar to Local Group dwarf irregulars IC 1613 and Sextans A (Mateo, 1998). High-quality HST CMDs have recently been published for both of these systems (Dohm-Palmer et al., 1997; Cole et al., 1999), and we consider how these diagrams may help us to better understand the nature of the excess’ resolved stars seen towards And IV (Section 3.1.1). One of the most striking features of the Sextans A CMD is the population of massive core helium-burning stars (the so-called blue loop’ stars) seen just redward of the main sequence; this feature is also seen, albeit to a slightly lesser degree, in IC 1613. As the prominence of blue loop stars is greatest at low metallicites, and as (at least) the gas-phase metallicity of And IV and Sextans A/IC 1613 are all similarly low, it is reasonable to expect that such stars are also present in the And IV CMD. The excess’ stars seen lying between the M31 blue plume and RGB on the And IV CMD, but not on that of the M31 field, could be the signature of this component. Furthermore, IC 1613 shows a sizeable population of red supergiants extending to I16.5 (or V18), which corresponds to M for a distance modulus of 24.27 (Cole et al., 1999). Given that the excess’ luminous red stars identified on the And IV CMD would have absolute magnitudes in the range to at our derived distance, it appears likely that these stars are red supergiants belonging to And IV.
An interesting question is whether And IV is an isolated dwarf galaxy or whether it belongs to some larger group environment. There are no catalogued galaxy groups in the vicinity of And IV but a search with NED reveals 14 galaxies in the range 22, 20 and 150 km/sV350 km/s. Of these, the most luminous are IC 1727, NGC 784 and UGC 64. We suspect that And IV may be one of the many low-luminosity galaxies inhabiting this environment.
5 Conclusions
We have presented deep HST WFPC2 and ground-based observations of the enigmatic object And IV. The true nature of this object – old star cloud’ in the outer disk of M31 or background galaxy – has remained a mystery since it was first discovered by van den Bergh (1972) during his search for dwarf spheroidal companions to M31. From the analysis of our WFPC2 images and complementary H imaging and long-slit optical spectroscopy, we find compelling evidence that And IV is a background galaxy seen through the disk of M31. The moderate surface brightness (24), very blue colour (VI0.6), low current star formation rate (0.001 M⊙ yr-1) and low metallicity (10% solar) reported here are consistent with And IV being a dwarf irregular galaxy, perhaps a more distant analog of Local Group members IC 1613 and Sextans A. Indeed, such objects are very common in the nearby Universe, and perhaps it is not surprising to find one projected behind M31. The distance to And IV is not tightly constrained by our current dataset, but arguments based on both the observed radial velocity and on a tentative detection of the RGB tip suggest it lies in the range 5D8 Mpc, placing it well outside the confines of the Local Group. At this distance, the physical extent of And IV is consistent for what is expected of small dwarf galaxies. And IV may belong to a loose, previously uncatalogued group, containing major members UGC 64, IC1727 and NGC 784.
References
- Armandroff, Davies & Jacoby (1998) Armandroff, T. E., Davies, J. E. & Jacoby, G. H. 1998, AJ, 116, 2287
- Armandroff, Jacoby & Davies (1999) Armandroff, T. E., Jacoby, G. H. & Davies, J. E. 1999, AJ, 118, 1220
- Binggeli, Tammann & Sandage (1987) Binggeli, B. , Tammann, G. A. & Sandage, A. 1987, AJ, 94, 251
- Blair, Kirshner & Chevalier (1982) Blair, W. P., Kirshner, R. P. & Chevalier, R. A. 1982, ApJ, 254, 50
- Bremnes, Bingelli & Prugniel (1999) Bremnes, T., Bingelli, B. & Prugniel, P. 1999, A&AS, 137, 337
- Burstein & Heiles (1984) Burstein, D. & Heiles, C. 1984, ApJS, 54, 33
- Cole et al. (1999) Cole, A. A., et al. 1999, AJ, 118, 1657
- Cool & King (1995) Cool, A. M. & King, I. R. 1995, in Calibrating HST: Post Servicing Mission, eds. A. Koratkar & C. Leitherer (Baltimore:STScI), 290
- Dennefeld & Kunth (1981) Dennefeld, M. & Kunth, D. 1981, AJ, 86, 989
- Dohm-Palmer et al. (1997) Dohm-Palmer, R. C., et al. 1997, AJ, 114, 2514
- Emerson (1974) Emerson, D. T. 1974, MNRAS, 169, 607
- Ferguson, Wyse, Gallagher & Hunter (1996) Ferguson, A. M. N., Wyse, R. F. G., Gallagher, J. S. , III & Hunter, D. A. 1996, AJ, 111, 2265
- Ferguson, Gallagher & Wyse (1998) Ferguson, A. M. N., Gallagher, J. S. & Wyse, R. F. G. 1998, AJ, 116, 673
- Gilmore (1981) Gilmore, G. 1981, MNRAS, 195, 183
- Hodge (1981) Hodge, P. W. 1981, Atlas of the Andromeda Galaxy (Seattle:XX)
- Holland, Fahlman & Richer (1996) Holland, S. , Fahlman, G. G. & Richer, H. B. 1996, AJ, 112, 1035
- Holland (1998) Holland, S. 1998, AJ, 115, 1916
- Holtzman et al. (1995b) Holtzman, J. A., Burrows, C. J., Casertano, S. , Hester, J. J. , Trauger, J. T., Watson, A. M. & Worthey, G. 1995, PASP, 107, 1065
- Holtzman et al. (1995a) Holtzman, J. A., et al. 1995, PASP, 107, 156
- Howarth (1983) Howarth, I. D. 1983, MNRAS, 203, 301
- Huchtmeier & Richter (1989) Huchtmeier, W. K. & Richter, O. G. 1989, A General Catalgue of HI Observations of Galaxies (Springer, New York)
- Hunter, Hawley & Gallagher (1993) Hunter, D. A., Hawley, W. N. & Gallagher, J. S. , III 1993, AJ, 106, 1797
- Jones (1993) Jones, J.H. 1993, AJ, 105, 933
- Kennicutt (1984) Kennicutt, R. C. , Jr. 1984, ApJ, 287, 116
- Kennicutt, Tamblyn & Congdon (1994) Kennicutt, R. C. , Jr., Tamblyn, P. & Congdon, C. E. 1994, ApJ, 435, 22
- Lee, Freedman & Madore (1993) Lee, M. G. , Freedman, W. L. & Madore, B. F. 1993, ApJ, 417, 553
- Leitherer & Heckman (1995) Leitherer, C. Heckman, T. M. 1995, ApJS, 96, 9
- Massey, Strobel, Barnes & Anderson (1988) Massey, P. , Strobel, K. , Barnes, J. V. & Anderson, E. 1988, ApJ, 328, 315
- Mateo (1998) Mateo, M. L. 1998, ARA&A, 36, 435
- Mathieu (1984) Mathieu, R. D. 1984, ApJ, 284, 643
- McGaugh (1991) McGaugh, S. S. 1991, ApJ, 380, 140
- McGaugh (1994) McGaugh, S. S. 1994, ApJ, 426, 135
- Mendez & Soffner (1997) Mendez, R. H. & Soffner, T. 1997, A&A, 321, 898
- Mendoza & Zeippen (1982) Mendoza, C. & Zeippen, C. J. 1982, MNRAS, 198, 127
- Miller (1994) Miller, B. W., 1994, Ph.D Thesis, University of Washington
- Osterbrock (1989) Osterbrock, D. E. 1989, Astrophysics of Gasesous Nebulae and Active Galactic Nuclei (Mill Valley, CA: Univ. Sci)
- Schaerer & de Koter (1997) Schaerer, D. & de Koter, A. 1997, A&A, 322, 598
- Schechter (1980) Schechter, P. L. 1980, AJ, 85, 801
- Schlegel, Finkbeiner & Davis (1998) Schlegel, D. J., Finkbeiner, D. P. Davis, M. 1998, ApJ, 500, 525
- Seaton (1979) Seaton, M. J. 1979, MNRAS, 187, 73P
- Skillman, Kennicutt & Hodge (1989) Skillman, E. D., Kennicutt, R. C. & Hodge, P. W. 1989, ApJ, 347, 875
- Sofue & Kato (1981) Sofue, Y. & Kato, T. 1981, PASJ, 33, 449
- Stanek & Garnavich (1998) Stanek, K. Z. & Garnavich, P. M. 1998, ApJ, 503, L131
- Stetson (1987) Stetson, P. B. 1987, PASP, 99, 191
- Thurston, Edmunds & Henry (1996) Thurston, T. R., Edmunds, M. G. & Henry, R. B. C. 1996, MNRAS, 283, 990
- Unwin (1980) Unwin, S. C. 1980, MNRAS, 190, 551
- van den Bergh (1972) van den Bergh, S. 1972, ApJ, 171, L31
- Vacca, Garmany & Shull (1996) Vacca, W. D., Garmany, C. D. Shull, J. M. 1996, ApJ, 460, 914
- Whitmore, Heyer & Casertano (1999) Whitmore, B. , Heyer, I. & Casertano, S. 1999, PASP, 111, 1559
- Wyse & Gilmore (1989) Wyse, R. F. G. & Gilmore, G. 1989, Comments on Astrophysics, 13, 135
- Zaritsky, Kennicutt & Huchra (1994) Zaritsky, D. , Kennicutt, R. C. , Jr. & Huchra, J. P. 1994, ApJ, 420, 87
| ID | RA (2000) | DEC (2000) | F(H)bbF(H) in erg s-1 cm-2. Reported values are corrected for [NII] contamination and Galactic extinction. | RprojccProjected distance (measured in ″) from the centre of And IV. | CommentsddComments refer to whether the source is resolved (r) or unresolved (u) on our images, and to whether it has a continuum counterpart (c). |
|---|---|---|---|---|---|
| 1 | 00:42:37.6 | 40:38:12 | 3.5810-15 | 241 | u,c |
| 2 | 00:42:36.6 | 40:34:04 | 1.6110-15 | 51 | r,c |
| 3 | 00:42:32.3 | 40:33:57 | 9.2610-15 | 22 | r,c |
| 4 | 00:42:31.8 | 40:34:10 | 2.9510-15 | 11 | r |
| 5 | 00:42:32.8 | 40:34:16 | 1.2810-15 | 6 | r,c? |
| 6 | 00:42:30.6 | 40:34:46 | 2.1110-15 | 34 | r |
| 7 | 00:42:20.3 | 40:32:30 | 2.7110-15 | 175 | u |
| 8 | 00:42:21.2 | 40:33:48 | 3.7810-15 | 131 | u |
| Line | Obj #3 | Obj #4 | Obj # 6 |
|---|---|---|---|
| 3727 | 2.56(0.14) | 1.81(0.10) | 1.88(0.12) |
| H 4101 | 0.31(0.02) | 0.30(0.02) | 0.20(0.02) |
| H 4340 | 0.50(0.02) | 0.49(0.03) | 0.51(0.03) |
| H 4861 | 1.00(0.06) | 1.00(0.06) | 1.00(0.07) |
| 4959 | 0.60(0.03) | 1.06(0.06) | 0.57(0.04) |
| 5007 | 1.94(0.11) | 3.05(0.18) | 1.96(0.14) |
| H 6563 | 2.86(0.18) | 2.86(0.18) | 2.58(0.19) |
| 6583 | 0.09(0.01) | 0.08(0.01) | 0.06(0.01) |
| 6717 | 0.13(0.01) | 0.13(0.01) | 0.14(0.02) |
| 6731 | 0.09(0.01) | 0.09(0.01) | 0.10(0.02) |
| EW(H)(Å) | 171. | 684. | 148.3 |
| F(H (erg s-1 cm-2) | |||
| C(H | 0.16(0.06) | 0.0(0.06) | 0.0(0.07) |
| log() | -1.47(0.02) | -1.34(0.02) | -1.53(0.03) |
| log() | 0.00(0.03) | -0.36(0.03) | -0.13(0.04) |
| log(R23) | 0.71(0.02) | 0.77(0.02) | 0.65(0.02) |
| log(O/H) | -4.10 | -4.12 | -4.25 |
| log(N/O) | -1.83 | -1.66 | -1.93 |
| Vhelio (km/s) | 244(15) | 250(13) | 273(19) |