FUSE OBSERVATIONS OF DIFFUSE INTERSTELLAR MOLECULAR HYDROGEN
Abstract
We describe a moderate-resolution FUSE mini-survey of H2 in the Milky Way and Magellanic Clouds, using four hot stars and four AGN as background sources. FUSE spectra of nearly every stellar and extragalactic source exhibit numerous absorption lines from the H2 Lyman and Werner bands between 912 and 1120 Å. One extragalactic sightline (PKS 2155-304) with low N(H I) shows no detectable H2, and could be the “Lockman Hole of molecular gas”, of importance for QSO absorption-line studies. We measure H2 column densities in low rotational states ( = 0 and 1) to derive rotational and/or kinetic temperatures of diffuse interstellar gas. The higher- abundances can constrain models of the UV radiation fields and gas densities. In three optically thick clouds toward extragalactic sources, we find cm-3 and cloud thicknesses pc. The rotational temperatures for H2 at high Galactic latitude, K (seven sightlines) and K (three optically thick clouds), are higher than those in the Copernicus sample composed primarily of targets in the disk. We find no evidence for great differences in the abundance or state of excitation of H2 between sight lines in the Galaxy and those in the SMC and LMC. In the future, we will probe the distribution and physical parameters of diffuse molecular gas in the disk and halo and in the lower-metallicity environs of the LMC and SMC.
Subject headings:
ISM: clouds, molecules — ultraviolet: ISM — galaxies: individual (LMC, SMC)1. INTRODUCTION
As the most abundant molecule in the Universe, molecular hydrogen (H2) comprises the bulk of the mass of dense interstellar molecular clouds and is the main ingredient of star formation (Shull & Beckwith 1982). The first steps of star formation assemble dense interstellar clouds from diffuse gas, but the formation mechanism for giant molecular clouds from diffuse diffuse gas is still unknown. Little is known about the distribution of diffuse H2 in the interstellar medium (ISM) of our Galaxy, and major uncertainties remain about its formation, destruction, and recycling into dense clouds and stars. H2 also plays a central role in our understanding of interstellar chemistry.
Here, we describe early results on H2 in the Milky Way and the Magellanic Clouds obtained with the NASA Far Ultraviolet Spectroscopic Explorer (FUSE) satellite. The FUSE mission and the capabilities of its spectrograph are described by Moos et al. (2000) and Sahnow et al. (2000). Over its mission lifetime, FUSE will probe hundreds of sight lines through the Galactic disk and halo. We expect a large fraction of these sight lines to exhibit absorption from the Lyman and Werner rotational-vibrational bands of H2, some 400 absorption lines between 912 and 1120 Å, arising from rotational levels = 0 – 7 in the ground vibrational state. With FUSE, our team will map the distribution of H2 in the diffuse ISM, measure its abundance, state of excitation, and rates of formation and destruction. In § 2 we summarize our initial observations and describe our analysis methods. In § 3 we describe results from 8 targets. In § 4 we summarize our results and discuss future directions of FUSE H2 research.
2. OBSERVATIONS AND ANALYSIS
Our FUSE observations were obtained from 1999 September to 1999 November during the commissioning phase of satellite operations. A summary of the observations appears in Table 1. The resolution of the spectrograph across the band was R 12,000 for all observations, based on studies of sharp interstellar lines of H2, Ar I, and Fe II. The data were prepared for analysis by the FUSE data pipeline as described in Moos et al. (2000). Once the two-dimensional spectra were extracted to one dimension, a wavelength solution was applied and the oversampled data were smoothed by a 15-pixel running boxcar to 30 km s-1 resolution.
In typical interstellar conditions, excited H2 quickly decays to the ground vibrational state of the ground electronic state (Black & Dalgarno 1973). Observations of H2 with the Copernicus satellite occasionally detected rotational lines up to , and we search for . However, lines above are difficult to detect in diffuse interstellar clouds, with our typical limiting equivalent width of 30–40 mÅ and the corresponding column density limit of cm-2. We use all available H2 lines, except where they are blended with other interstellar absorption or airglow lines. Typically we neglect the Lyman (6-0) band, which is lost in interstellar Ly, and the Lyman (5-0) band, which is coincident with resonance absorption lines C II and C II and with O I airglow.
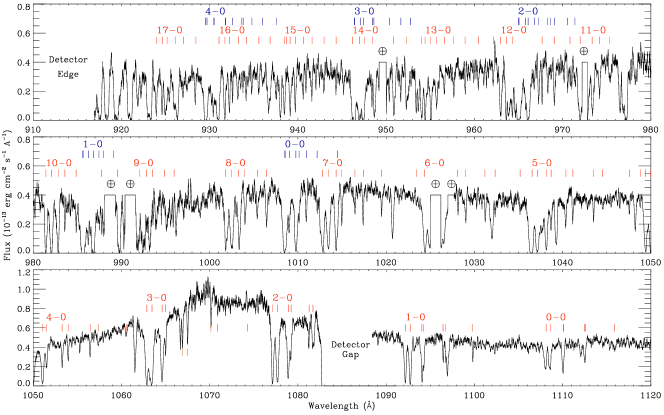
We illustrate our data in Figure 1, which displays the FUSE spectrum of ESO 141-G55, a Seyfert 1 galaxy at Galactic latitude . We detect one H2 Galactic component with N(H cm-2. This spectrum is typical of our FUSE data both in data quality and the abundance of H2 lines.
We employ a complement of techniques to analyze H2 absorption. The final products are column densities in rotational levels, N(), from which we can infer the gas density, UV radiation field, and H2 formation and destruction rates. For high column density absorbers with damping wings in the R(0) and R(1) lines, we fit the line profiles to derive N(0) and N(1) and use a curve of growth to derive column densities for . For absorbers with cm-2, we measure equivalent widths of all H2 lines and produce a curve of growth to infer a doppler -parameter and N( – see Fig. 2. We produce initial estimates of the column densities and excitation temperatures by fitting all lines simultaneously with parameters , , and , assuming a Boltzmann distribution at rotational temperature for and an excitation temperature for .
The Copernicus H2 survey (Spitzer & Jenkins 1975; Savage et al. 1977) showed that the molecular fraction, 2N(H2)/[N(H I) + 2N(H2)], is correlated with E(B-V) and with total H column density. They found that undergoes a transition from low values () to high values () at E(B-V) . Other Copernicus studies indicate that the populations in = 0, 1 and cannot always be described by a single excitation temperature (Spitzer, Cochran, & Hirshfeld 1974). is generally higher than and reflects the fluorescent pumping of the rotational levels by incident UV radiation (Jura 1975a,b). The ratio, N(1)/N(0), is usually set by collisional mixing of the ortho- and para-H2 states (Shull & Beckwith 1982), but these rotational levels may not yet have reached equilibrium in lower density clouds.
3. RESULTS FOR INDIVIDUAL SIGHT LINES
3.1. Magellanic Cloud Targets
We report observations of one star in the LMC and three stars in the SMC. In the cases of AV 232 and HD 5980, we detect H2 in both the Galaxy and the SMC (at +119 km s-1 and +124 km s-1; see Table 2). Our survey contains two Magellanic Cloud targets with no detected H2 at LMC or SMC velocities. Sk -67 111 (LMC) and Sk 108 (SMC) show Galactic H2 absorption near but have no detected H2 at the MC velocities. Our limiting equivalent width of 60 mÅ () in the Sk -67 111 spectrum sets limits N(0) cm-2 and N(1) cm-2 from the (7-0) R(0) and R(1) lines. For Sk 108, the limit of 30 mÅ yields N(0) cm-2 and N(1) cm-2. The absence of H2 in these sight lines may be due to low H I columns, to intense UV radiation fields that destroy H2, or to reduced rates of H2 formation on grain surfaces in warm low-metallicity gas. Abundances for such gas are given by Welty et al. (1999).
The SMC stars HD 5980 and AV 232 are separated by 75′′ on the sky. Thus, these sight lines may probe the same interstellar clouds in the Galaxy and SMC. With similar column densities and rotational temperatures, the Galactic components appear to arise in the same gas. However, the AV 232 SMC component exhibits a high rotational temperature = K and a higher excitation temperature = K, compared with = K and = K for the HD 5980 absorber. The level populations likely arise from differing excitation rates in separate clouds, pc apart at the SMC.
The only detections of Magellanic Cloud H2 absorption prior to FUSE were observations with ORFEUS (Richter et al. 1998; de Boer et al. 1998), at low signal to noise but comparable () resolution. With a longer mission lifetime and higher effective area, FUSE offers significant improvement for H2 studies. For example, with higher S/N, we do not confirm the claimed ORFEUS detections of H2 (J = 5, 6, 7) at +160 km s-1 toward HD 5980 (Richter et al. 1998). Our observations of H2 column densities in the +120 km s-1 component differ considerably, owing to a better curve of growth (Fig. 2) with km s-1 compared to km s-1 with ORFEUS. Based on 28 FUSE lines () compared to 8 ORFEUS lines, we derive log N(0) = 15.10 (compared to 16.57) and log N(1) = 15.30 (compared to 15.90). Within error bars, both studies agree on and . Our data yield K for the SMC gas.
3.2. Extragalactic Targets
Our four extragalactic targets at Galactic latitude probe a large volume of the Galaxy and its halo and allow us to measure the abundance and physical properties of molecular gas outside the disk for the first time. The Copernicus disk result, K (Savage et al. 1977), was drawn from 61 stars with . From seven FUSE sightlines, we derive = 107 17 K. In the three optically thick extragalactic sightlines, = 120 13 K. These results may indicate a higher level of rotational excitation in the upper disk and low halo, which could arise from more intense UV pumping or photoelectric heating from grains in the infrared cirrus. However, these interpretations are still speculative, since the the levels may not be in equilibrium with the kinetic temperature as a result of UV radiative pumping.
In general, the H2 rotational populations can be modeled (Jura 1975a,b) to provide physical diagnostics of H2-bearing clouds, such as , , thermal pressure, and UV radiation field. We also derive internally consistent values of N(H2) and for these clouds, which could indicate the presence of warm H2-bearing gas in the lower Galactic halo. For the three AGN sightlines with detectable H2, we find = 50, 50, and 36 cm-3 for Mrk 876, ESO 141-G55, and PG 0804+761 respectively, which yields cloud thicknesses of 1.9, 2.4, and 3.3 pc. The line of sight to ESO 141-G55 intersects a region of enhanced IRAS 100 m emission (Sembach, Savage, & Hurwitz 1999). The other extragalactic sightlines lie behind high-velocity cloud Complex C (Mrk 876) and weak infrared cirrus (PG 0804+761). Our H2 results suggest that these clouds are also compressed.
4. SUMMARY AND FUTURE DIRECTIONS
The major results of these early FUSE observations are: (1) the ubiquity of H2 in nearly all sightlines; (2) the generally warmer rotational temperatures, toward high-latitude gas; and (3) the presence of one low-H2 extragalactic sightline (PKS 2155-304). We have not detected H2 in the high velocity clouds (HVCs) toward Mrk 876 or PKS 2155-304, although we intend to continue our HVC searches toward other targets. The HD molecule was not detected in any diffuse cloud, but results from a complementary program (Snow et al. 2000; Ferlet et al. 2000) detect H2 and HD toward the reddened star HD 73882. Detections of H2 in other FUSE sight lines are analyzed by Friedman et al. (2000), Mallouris et al. (2000), and Oegerle et al. (2000).
The lack of detectable H2 toward PKS 2155-304 is quite interesting, in contrast to the general presence of H2 at high Galactic latitudes. Extragalactic sight lines with low H2 are valuable for studies of QSO absorption lines (Shull et al. 2000; Sembach et al. 2000), since H2 line blanketing can add confusion to line identifications (Fig. 1). The observed low N(H2) may reflect the intrinsic patchiness of the ISM, but can also be influenced by H2 formation/destruction in regions of high UV radiation fields and low hydrogen column density. PKS 2155-304 has the lowest column density, log N(H I) , of any of our targets. The Sk 108 sight line shows no H2 at SMC velocities, and the Sk -67 111 sight line shows no H2 at LMC velocities. Although H2 formation may not reach equilibrium with UV destruction in these diffuse clouds, the H2 formation rate could depend on the metallicity through the content of dust grains, whose surfaces catalyze H2 formation. In the Galactic halo, some clouds may be exposed to strong UV dissociating radiation from OB associations in the disk. With more sight lines, we should be able to correlate regions lacking H2 with regions of low N(H I) and low metallicity (LMC, SMC). Close sight lines such as those to HD 5980 and AV 232 present an opportunity to probe the size of diffuse H2-bearing interstellar clouds.
The primary product of future FUSE diffuse H2 studies will be a map of the distribution of diffuse clouds in the disk and halo of the Milky Way, using a large sample of sight lines toward Galactic and extragalactic targets. Multiple sight lines to the Magellanic Clouds will permit the study of CO/H2 and possibly HD/H2 in lower-metallicity environs, including high-velocity clouds in the Galactic halo and Magellanic Stream (Gibson et al. 2000). Observations of multiply-intersected absorbers and H2 associated with infrared cirrus and high velocity clouds can constrain the size of these diffuse interstellar clouds.
References
- (1) Black, J. H., & Dalgarno, A. 1973, ApJ, 184, L101
- (2) de Boer, K. S., et al. 1998, A&A, 338, L5
- (3) Dickey, J., & Lockman, F. J. 1990, ARA&A, 28, 215
- (4) Ferlet, R., et al. 2000, ApJ, this issue
- (5) Friedman, S. D., et al. 2000, ApJ, this issue
- (6) Gibson, B. K., Giroux, M. L., Penton, S. V., Putman, M., Stocke, J. T., & Shull, J. M. 2000, AJ, submitted
- (7) Jura, M. 1975a, ApJ, 197, 575
- (8) Jura, M. 1975b, ApJ, 197, 581
- (9) Mallouris, C., et al. 2000, ApJ, in preparation
- (10) Moos, H. W., et al. 2000, ApJ, this issue
- (11) Oegerle, W. R., et al. 2000, ApJ, this issue
- (12) Richter, P., et al. 1998, A&A, 338, L9
- (13) Sahnow, D. et al. 2000, ApJ, this issue
- (14) Savage, B. D., & deBoer, K. S. 1981, ApJ, 243, 460
- (15) Savage, B. D., Bohlin, R. C., Drake, J. F., & Budich, W. 1977, ApJ, 216, 291
- (16) Sembach, K. R., et al. 2000, ApJ, in preparation
- (17) Sembach, K. R., Savage, B. D., & Hurwitz, M. 1999, ApJ, 524, 98
- (18) Shull, J. M., Giroux, M. L., et al. 2000, ApJ, this issue
- (19) Shull, J. M., & Beckwith, S. V. W. 1982, ARA&A, 20, 163
- (20) Snow, T. P., et al. 2000, ApJ, this issue
- (21) Spitzer, L., Jr., Cochran, W. D., & Hirshfeld, A. 1974, ApJS, 28, 373
- (22) Spitzer, L., Jr., & Jenkins, E. B. 1975, ARA&A, 13, 133
- (23) Welty, D., et al. 1999, ApJ, 512, 636
- (24)
| Target | Channels 11Detectors LiF (L1 and L2 channels) and SiC (S1 and S2 channels) have wavelength ranges described by Moos et al. (2000). | (N) 22Exposure time and number (N) of sub-exposures. | S/N 33Signal-to-noise ratio per smoothed (30 km s-1) bin between 1040–1050 Å. |
|---|---|---|---|
| (ksec) | |||
| Mrk 876 | L1 L2 S1 | 45.9 (10) | 15 |
| ESO 141-G55 | L1 L2 S2 | 35.8 (20) | 15 |
| PG 0804+761 | L1 L2 S1 | 39.6 (12) | 15 |
| Sk -67 111 (LMC) | L1 | 13.8 (7) | 15 |
| AV 232 (SMC) | L1 | 10.3 (5) | 12 |
| HD 5980 (SMC) | L1 | 3.2 (8) | 15 |
| Sk 108 (SMC) | L1 | 13.3 (8) | 30 |
| PKS 2155-304 | L1 L2 S2 | 37.1 (22) | 20 |
| Name (Type) | (∘) | (∘) | N(H2) | N(H I) | |||||
|---|---|---|---|---|---|---|---|---|---|
| (km s-1) | (cm-2) | (cm-2) | (K) | (K) | (km s-1) | ||||
| Magellanic Cloud Sight Lines | |||||||||
| Sk -67 111 (LMC, O7) | 277.75 | -32.97 | 0 | 122 | 300 | 8 | |||
| +270 | |||||||||
| AV 232 (SMC, O9) | 302.06 | -44.94 | 0 | 86 | 195 | 5 | |||
| +119 | 300 | 520 | 7 | ||||||
| HD 5980 (SMC, WR) | 302.07 | -44.95 | 0 | 98 | 195 | 5 | |||
| +124 | 98 | 300 | 10 | ||||||
| Sk 108 (SMC, WR) | 301.63 | -44.99 | 0 | 85 | 180 | 7 | |||
| +120 | |||||||||
| Extragalactic Sight Lines | |||||||||
| Mrk 876 (Seyf1) | 98.27 | 40.38 | 0 | 135 | 200 | 5 | |||
| ESO 141-G55 (Seyf1) | 338.18 | -26.71 | 0 | 113 | 540 | 10 | |||
| PG 0804+761 (QSO) | 138.28 | 31.03 | 0 | 113 | 180 | 8 | |||
| PKS 2155-304 (BL Lac) | 17.73 | -52.27 | |||||||