Radio Galaxy Clustering at
Abstract
Radio galaxies are uniquely useful as probes of large-scale structure as their uniform identification with giant elliptical galaxies out to high redshift means that the evolution of their bias factor can be predicted. As the initial stage in a project to study large-scale structure with radio galaxies we have performed a small redshift survey, selecting 29 radio galaxies in the range from a contiguous 40 deg2 area of sky. We detect significant clustering within this sample. The amplitude of the two-point correlation function we measure is consistent with no evolution from the local () value. This is as expected in a model in which radio galaxy hosts form at high redshift and thereafter obey a continuity equation, although the signal:noise of the detection is too low to rule out other models. Larger surveys out to should reveal the structures of superclusters at intermediate redshifts and strongly constrain models for the evolution of large-scale structure.
1 Introduction
Powerful radio sources are almost exclusively associated with giant elliptical galaxies, and appear to be in richer than average environments (e.g. Hill & Lilly 1991). This suggests that they should be more biased tracers of the mass distribution than normal galaxies. A study of the clustering of local () radio galaxies by Peacock & Nicholson (1991) showed that this was indeed the case, with radio galaxies having a cross correlation function of the usual form (assumed throughout this paper), , with a correlation length of Mpc. 111We assume a cosmology with , and throughout This can be compared to Mpc for normal galaxies (Loveday et al. 1992); for IRAS-selected galaxies (Fisher et al. 1994), and Mpc for rich clusters of galaxies (Dalton et al. 1994). Radio galaxies thus cluster with a strength intermediate between normal galaxies and clusters (Bahcall & Chokshi 1992). The associated cosmological bias factor is lower than for clusters, but about twice as high as that for IRAS-selected galaxies (Peacock & Dodds 1994).
Studies of the angular correlation function of radio sources by Magliocchetti et al. (1999) and Cress & Kamionkowski (1998) show that the data from radio surveys such as FIRST are consistent with little evolution in the clustering amplitude in the range . However, these conclusions are based on extrapolating the luminosity functions of Dunlop & Peacock (1990; hereafter DP), to the faint flux densities near the limit of the FIRST survey, mJy. At these levels the DP luminosity functions are constrained by source count data only, as direct redshift surveys were only available at mJy. In particular, at faint flux levels the radio source population is a mix of nearby star-forming galaxies and AGN-powered radio sources with a range in redshifts from 0 to 4 (Condon et al. 1998), which have quite different clustering properties. It is therefore important to test the results of the angular correlation function studies with direct measurements of clustering from radio galaxy redshift surveys.
Studies of the clustering of radio-quiet AGN seem to show a generally similar correlation length, but there is a wide range in estimates of from different samples. This can probably be explained if the correlation function depends both on redshift and AGN luminosity [e.g. Sabbey et al. (2000), La Franca, Andreani & Christiani (1998)].
Magliocchetti et al. (1999) discuss theoretical predictions for the evolution of the two-point correlation function of radio sources. Perhaps the most appropriate case to take is that where radio galaxies form at high redshift (). We can trace the evolution of the host population out to , and find that the hosts vary little with redshift, apart from some passive evolution. The host magnitudes are also only weakly dependent on radio luminosity (Lacy, Bunker & Ridgway 2000). Hence uncertainties in the evolution in the bias factor are unlikely to be as important an issue for radio galaxies as they are for normal galaxies or radio-quiet quasars. Fry (1996) shows that in this “galaxy conservation” scenario, the bias factor increases with redshift according to , where is the bias factor at the present epoch. This is because fluctuations in the galaxy density field are fixed at the epoch of formation, but the fluctuations in the matter density field grow with time. The decrease in the bias factor with time is mostly compensated for by the clustering of matter under gravity, for which the growth factor for an , cosmology. The two-point correlation function, , should therefore show little evolution.
To test this model, and to examine the nature of intermediate redshift superclusters, we therefore decided to begin a survey of large-scale structure at moderate redshifts (). This paper describes the initial result from this survey and also the prospects for future surveys.
2 Survey strategy and observations
We tried to optimize the survey to detect supercluster-scale objects at . We therefore picked a point on the radio luminosity function where the space density of objects close to the flux limit would be Mpc-3, thus obtaining several objects in structures of linear sizes Mpc. This corresponds to a radio luminosity of WHz-1sr-1, or a flux limit of mJy at 1.4 GHz. This is comfortably above the completeness limits of the FIRST and NVSS radio surveys (Becker et al. 1995; Condon et al. 1998).
Initial selection was made from the NVSS catalogue, each NVSS source was examined in FIRST to check for confusion, and to estimate the position of the identification. This technique combines the sensitivity to extended flux of the NVSS survey with the positional accuracy of FIRST. The sample discussed in this paper consists of 322 objects within right ascension and declination ranges of and (an area of ).
Identifications were made on the UK Schmidt Telescope plates using the Cambridge APM. The plates were approximately calibrated onto -band using CCD images of star fields close to each of the plate centres. Initially, only the 34 objects classed as non-stellar in and with were considered for spectroscopy (one of these turned out to be a misclassified high redshift quasar). Six stellar objects were also selected later as checks on the APM classifier. For compact sources, or those with identifiable central components the probability of a chance misidentification is low. In the survey region the density of objects with is arcmin-2. The error on a FIRST position is , so there is only an % chance of a misidentification. For double sources with no central component, (18 out of 36 objects) the probability of a misidentification is larger. For these objects we followed the prescription of Lacy et al. (1993) by searching an ellipse with a major axis equal to the radio source size and minor axis of . The number of objects falling into the search region by chance, is given in Table 1, and is for all our objects, and for most of them. There are very unlikely to be any quasars in the sample – the fraction of quasars in complete samples drops rapidly at radio luminosities below WHz-1sr-1 (Willott et al. 2000).
Spectra were obtained on the Shane 3-m Telescope at Lick Observatory on 1999 October 13-14, 1999 November 12-14 and 1999 December 11-12 and at the Nordic Optical Telescope (NOT) on 2000 January 5 (all dates UT). The plate calibration observations were made on the Shane on 1999 September 15. The Kast spectrograph was used for all observations on the Shane, and the Andalucia Faint Object Spectrograph (ALFOSC) for the NOT observations. Redshifts were determined from emission lines where present, otherwise absorption features were matched both by eye and by a cross-correlation of the spectrum with that of a nearby elliptical; the dominant error sources were the accuracy of the wavelength calibration, and centroiding of spectral features, both nm, resulting in a typical redshift error of . Full details and the spectra will be presented in a future paper.
| Galaxy | Cl | |||
|---|---|---|---|---|
| 010151+011414 | 0.438 | 19.0 | nn | 0.015 |
| 010236005007 | 0.243aaRedshift from other FIRST follow-up projects | 17.5 | nn | 0.002 |
| 010242005032 | 0.244aaRedshift from other FIRST follow-up projects | 17.4 | nn | 0.002 |
| 010403002437 | 0.280aaRedshift from other FIRST follow-up projects | 17.2 | nn | 0.002 |
| 010456+000422 | 0.276 | 18.4 | nn | 0.13 |
| 010454+000400 | 0.280 | 17.6 | nn | 0.005 |
| 010610+005153 | 0.262 | 18.2 | nn | 0.002 |
| 010620+000843 | 0.271 | 18.4 | nn | 0.027 |
| 011012004747 | 0.565 | 19.6 | sn | 0.002 |
| 011341+010609 | 0.281 | 18.0 | nn | 0.002 |
| 011425+002932 | 0.355 | 18.5 | nn | 0.002 |
| 011429+000037 | 0.389 | 18.8 | nn | 0.017 |
| 011527000000 | 0.381 | 20.1 | nn | 0.013 |
| 011811+010211 | 0.278 | 17.3 | nn | 0.002 |
| 012012003837 | 0.236 | 17.2 | nn | 0.002 |
| 012020002124 | 0.354 | 19.0 | nn | 0.002 |
| 012030001950 | 0.352 | 18.7 | nn | 0.002 |
| 012101+005100 | 0.237 | 18.1 | nn | 0.033 |
| 012156002930 | 0.437 | 19.2 | nn | 0.23 |
| 012411+004050 | 0.366 | 18.9 | ns | 0.002 |
| 012927+000524 | 0.392 | 18.8 | nn | 0.002 |
| 013352+011345 | 0.308 | 17.8 | nn | 0.002 |
| 013506+011913 | 0.358 | 18.2 | nn | 0.004 |
| 013602+001016 | 0.344 | 17.8 | nn | 0.007 |
| 01380701452 | 0.640 | 18.8 | ss | 0.010 |
| 013942000618 | 0.197aaRedshift from other FIRST follow-up projects | 17.9 | ns | 0.002 |
| 014057+001053 | 0.523 | 19.9 | nn | 0.002 |
| 014213001326 | 0.526 | 19.2 | nn | 0.002 |
| 014227+001139 | 0.326 | 17.7 | nn | 0.015 |
| 014251000028 | 0.272 | 18.2 | nn | 0.30 |
| 014300000245 | 0.428 | 19.0 | sn | 0.43 |
| 014317011859 | 0.520 | 19.5 | nn | 0.013 |
| 014347+004546 | 0.218 | 18.0 | nn | 0.002 |
| 014714+005834 | 0.638 | 19.0 | nn | 0.020 |
| 014714012603 | 0.158 | 17.0 | nn | 0.55 |
| 014752+000658 | 0.448 | 19.3 | nn | 0.002 |
Note. — Entries in the column labelled ‘Cl’ are ‘nn’ for non-stellar on both UKST plates, ‘ns’ for non-stellar on the plate and stellar on the plate, ‘sn’ for stellar on the plate and non-stellar on the plate, and ‘ss’ for stellar on both. is the expected number of objects with falling into the search region by chance.
3 Analysis
To measure the two-point correlation function simulated surveys were constructed with the same selection function as the original survey, but with randomly assigned coordinates. The redshift selection function was estimated by using the scatter in the observed relation to estimate the probability of an object with redshift having a magnitude within the selected range (Fig. 1). A least deviation fit to the relation for radio galaxies from the 8C-NEC redshift survey (Lacy et al. 1999) was used to establish a mean relation:
This is close to that derived for the 100-times radio-brighter 3C sample (Eales 1985). The scatter about this relation was measured to be 0.57 mag, using the actual and values obtained for sources in the survey. A selection function was then constructed by taking the luminosity-density evolution model of DP and integrating to obtain a redshift distribution. This was then multiplied by the effect of the photometric selection, which was modelled as a pair of oppositely-tailed error functions with a width in log redshift corresponding to the scatter in the relation, and half-power points corresponding to the predicted redshifts for objects at the bright and faint magnitude limits of the survey.

In practice an upper cutoff of was placed on the sample. Up to this redshift the agreement with the predicted redshift distribution is good, with 28.7 objects predicted in the range compared to 29 observed. Above , however, the predicted selection function and the observed redshift distribution diverge rapidly (Fig. 1), and of 47.5 objects predicted to be present in the redshift range , only 36 are found. This could be due either to the mistaking of high redshift galaxies for quasars by the APM classification program, a problem with the assumed luminosity function or a genuine underdense region.
We next estimate the possible effect of incompleteness due to misclassification at . There are 12 objects within the survey selection criteria but with stellar identifications on the UKST plates for which spectra have not yet been obtained. With one exception all have radio morphologies more consistent with being quasars than galaxies (i.e. unresolved, triple or core-halo structures). Of the 13 plate stellar identifications in the range for which we have spectra in this region of sky, from both this work and the FIRST spectroscopic database, three are in fact galaxies, but only one is at . We therefore think it very unlikely that more than 2-3 objects below are missing from the sample other than those accounted for in the selection function.
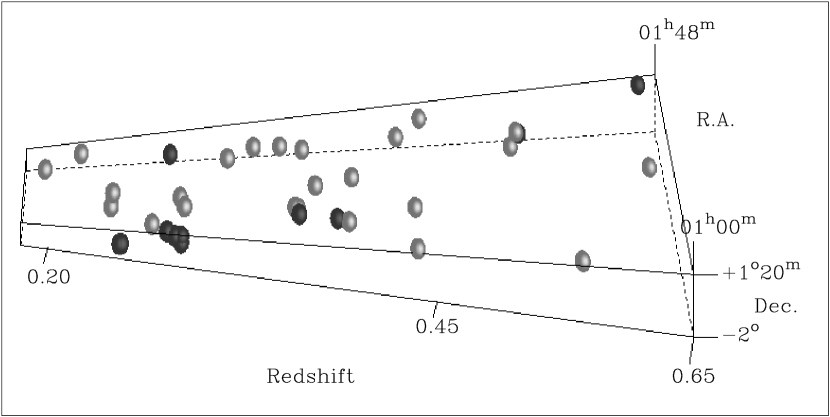
In Fig. 2 we show a three dimensional representation of the survey volume. Although this figure needs to be interpreted with caution as the space density of objects is dropping with redshift, there is a clump at and R.A. , which seems to be comprised mostly of FRI sources. There is also a looser association at , and a group of three at . The sizes of the associations seem to be , comparable to low redshift superclusters.
We have estimated the statistical significance of our detection of clustering in the complete sample (median redshift ) by binning the distribution of pair separations in 10 Mpc bins, and comparing with the mean distribution obtained from 10000 Monte-Carlo simulations of the survey using a test. This gives the probability of our distribution arising by chance as ( with 53 degrees of freedom). However, a large part of the is contributed by the first bin which contains two pairs with separations Mpc. This is close enough that the members of each pair could be in the same galaxy cluster. We therefore removed these two from the first bin and recalculated the statistic, this gave a probability of 0.006 ( with 53 degrees of freedom).
To estimate the two-point correlation function, the numbers of data-data (DD), data-random (DR) and random-random (RR) pairs were measured from the data and the simulations and the two-point correlation function calculated according to the formula espoused by Landy & Szalay (1993):
The results for the complete sample are shown in Fig. 3. The correlation function was fit over the range 0-100 Mpc, the best value for was Mpc, with a range of 5–24Mpc over which the probability of obtaining the was 5 % (assuming Poisson errors).
As a check on the effect of possible incompleteness we added three galaxies (the largest number we expect based on the discussion above) to the sample with redshifts drawn at random from the selection function, and with random sky positions within the survey region. This reduced to 14Mpc. Incompleteness is thus unlikely to affect our estimate by more than the random error.

4 Conclusions and future surveys
We have succeeded in developing an effective method for studying the clustering of moderate redshift radio galaxies directly, and have detected clustering of radio galaxies at . The amplitude of the cross-correlation function we measure is consistent with that for radio galaxies locally. This is as expected in the simple model discussed in the introduction, in which radio source hosts evolve little with redshift, and is higher than that for normal galaxies at , for which Small et al. (1999) measure . At present, however, the small size of our survey prevents us ruling out all but the most extreme evolution in the correlation function. Expansion of this survey to redshifts will allow a measurement of the two-point correlation function to be made which has comparable accuracy to that for normal galaxies at these redshifts. The relatively large volume probed by a larger survey will allow us to define a sample of superclusters and to examine their structures and the evolution of those structures to the present day.
The discovery of redshift clustering in deep pencil beam galaxy surveys, e.g. that of the HDF (Cohen et al. 2000) has raised the possibility that large-scale structures continue to be present in the Universe at least to . Therefore the evolution of these structures should place interesting constraints on cosmology. Crucially, however, because we can trace the evolution of radio galaxy hosts to , we can, in principle, predict how the bias should evolve with redshift, removing an important uncertainty from the interpretation of the results of correlation function studies.
References
- Bahcall & Chokshi (1992) Bahcall N.A., Chokshi A., 1992, ApJ, 385, L33
- Becker, White & Helfand (1995) Becker R.H., White R.L., Helfand D.J., 1995, ApJ, 450, 559
- Cohen et al. (2000) Cohen J., Hogg D., Blandford R., Cowie L., Hu E., Songaila A., Shopbell P., Richberg K., 2000, ApJ in press (astro-ph/9912048)
- Condon et al. (1998) Condon J.J., Cotton W.D., Greisen E.W., Yin Q.F., Perley R.A., Taylor G.B., Broderick J.J., 1998, AJ, 115, 1693
- Cress & Kamionkowski (1998) Cress C.M., Kamionkowski M., 1998, MNRAS, 297, 486
- Dalton et al. (1994) Dalton G.B., Croft R.A.C., Efstathiou G.P., Sutherland W.J., Maddox S.J., Davis M., 1994, MNRAS, 271, L47
- Dunlop & Peacock (1990) Dunlop J.S., Peacock J.A., 1990, MNRAS, 247, 19 (DP)
- Eales (1985) Eales S.A., 1985, MNRAS, 217, 179
- Fisher et al. (1994) Fisher K.B., Davis M., Strauss M.A., Yahil A., Huchra J., 1994, MNRAS, 266, 50
- Fry (1996) Fry J.N., 1996, ApJ, 461, L65
- Hill & Lilly (1991) Hill G.J., Lilly S.J., 1991, ApJ, 367, 1
- Lacy et al. (1993) Lacy M., Hill G.J., Kaiser M.E., Rawlings S., 1993, MNRAS, 263, 707
- Lacy et al. (1999) Lacy M., Kaiser, M.E., Hill G.J., Rawlings S., Leyshon G., 1999, MNRAS, 308, 1087
- Lacy, Bunker & Ridgway (2000) Lacy M., Bunker A.J., Ridgway S.E., 2000, AJ, in press (astro-ph/0003290)
- La Franca et al. (1998) La Franca F., Andreani P., Christiani S., 1998, ApJ, 497, 529
- Landy & Szalay (1993) Landy S.D., Szalay A.S., 1993, ApJ, 412, 64
- Loveday et al. (1992) Loveday J., Efstathiou G.P., Peterson B.A., Maddox S.J., 1992, ApJ, 400, L43
- Magliocchetti et al. (1999) Magliocchetti M., Maddox S.J., Lahav O., Wall J.V., 1999, MNRAS, 306, 943
- Peacock & Dodds (1994) Peacock J.A., Dodds S.J., 1994, MNRAS, 267, 1020
- Peacock & Nicholson (1991) Peacock J.A., Nicholson D., 1991, MNRAS, 253, 307
- Sabbey et al. (2000) Sabbey C.N., et al., ApJ, submitted (astro-ph/9912108)
- Small et al. (1999) Small T.A., Ma C.-P., Sargent W.L.W., Hamilton D., 1999, ApJ, 524, 31
- Willott et al. (2000) Willott C., Rawlings S., Blundell K.M., Lacy M., 2000, MNRAS, in press (astro-ph/0003461)