Abstract
We have carried out a deep infrared imaging survey (1.1m and 1.6m) of the Hubble Deep Field North (HDF–N) using NICMOS on board the Hubble Space Telescope. The combined WFPC2+NICMOS data set lets us study galaxy morphologies, colors and luminosities at common rest frame wavelengths over a broad range of redshifts, e.g., in the –band out to . Here, I illustrate some applications of this data set for studying the evolution of giant galaxies, on and off the Hubble Sequence. Large, relatively ordinary spiral galaxies are found out to at least . Morphological irregularities seen in many distant HDF galaxies tend to persist from ultraviolet through optical rest frame wavelengths, suggesting that these are genuinely peculiar, structurally disturbed systems. Red giant ellipticals are found out to (photometric) redshifts , implying that some such galaxies probably formed the bulk of their stars at . However, there are also bluer early type galaxies at , which may have experienced extended star formation histories. Finally, there appears to be a substantial deficit of high luminosity galaxies of all types at compared to lower redshifts. However, this result must be considered with caution given the small volume of the HDF, its susceptibility to line–of–sight clustering variations, and the heavy reliance on photometric redshifts at .
GALAXY EVOLUTION AT FROM THE NICMOS HDF–NORTH
STScIBaltimore, USA
1 Introduction
The Hubble Deep Fields (North and South, or HDF–N and HDF–S) currently offer the deepest optical images of the distant universe, and their exquisite angular resolution provides the opportunity to study the morphologies of galaxies in detail and explore how the galaxy population has transformed with cosmic time. When considering the properties of HDF galaxies, it is important to keep some facts/limitations of the data set in mind. The co–moving volume probed by the central, deepest WFPC2 fields (i.e., neglecting the shallower but wider flanking fields) is quite small. For the currently popular “supernovae + Cepheids” cosmology, i.e., , , km/s/Mpc, which I will adopt here, the comoving volumes out to and 2 are approximately 5000 and 20000 Mpc3, respectively. Multiplying these by the normalization of the local galaxy luminosity function (using Mpc-3, from [25]) gives a rough estimate of the number of galaxies (or their progenitors) expected within the HDF volume. This is only at . Thus, small number statistics alone limit the utility of the HDF for a reliable census of bright galaxy properties at , and given real galaxy clustering the possible uncertainties are greater still.
At there is room enough for galaxies, still small but much better for statistical purposes. However, at , the optical rest frame, where we are most familiar with local galaxy properties, redshifts into the near–infrared. WFPC2 imaging therefore measures the rest frame ultraviolet properties of many (probably most) faint HDF galaxies, and thus primarily traces the light of hot, short–lived stars, modulated by the possible effects of extinction. Systematically comparison of HDF galaxies to those at therefore requires deep, near–infrared data. The HDF–N was observed in the near–infrared from the ground in several different programs ([29], [3], [16]). The depth and angular resolution (typically ) of these data are a poor match to that of the optical WFPC2 HDF images. Two programs therefore targeted the HDF–N with NICMOS on board HST, providing much deeper images with high angular resolution. The NICMOS GTOs [47] imaged one NIC3 field () for 49 orbits each at F110W (1.1m) and F160W (1.6m). We, on the other hand, took the “wide field” approach, mosaicing the complete HDF–N with a mean exposure time of 12600s per filter in F110W and F160W. Sensitivity varies over the field of view, but the mean depth is at in an diameter aperture. The drizzled PSF has FWHM = , primarily limited by the NIC3 pixel scale.
The NICMOS data, then, offer the opportunity to study the photometric and morphological properties of HDF galaxies at rest frame optical wavelengths out to . The bandpass111I will use AB magnitudes here throughout, and notate the six WFPC2+NICMOS bandpasses by , , , , and . samples the rest frame , , and bands at , 2, and 2.8, respectively. The combined WFPC2+NICMOS data set offers several attractive new options for studying distant galaxies. Given the redshift (or a photometric estimate thereof) for an object, we can measure magnitudes and colors at fixed rest frame wavelengths, and even generate fixed rest frame images to study galaxy morphologies in a common manner over a very broad range of redshifts. I will try to demonstrate here how this can be quite an educational way to study distant galaxies.
For this review, I will discuss the morphologies, colors, and space densities of giant galaxies in the HDF, on and off the Hubble sequence, at , where the NICMOS images probe rest frame optical wavelengths at the rest frame band or redder. The spectroscopic redshift sample (primarily from [9] and [38]) becomes thin (nil, in fact) at , and I will rely on photometric redshifts fit to our 7–band WFPC2+NICMOS+ data by Tamas Budavári and collaborators ([7], [15]). The near–infrared photometry should substantially improve the reliability of photometric redshifts ([12], [22]), but it is nevertheless important to remember that there are, as yet, no spectroscopic calibrators for the estimates in this redshift range. I will restrict the sample to , where we believe the photometry, completeness and reliability to be good.
2 Spiral and irregular galaxies
WFPC2 imaging established the apparent overabundance of distant, morphologically irregular galaxies falling outside the standard Hubble sequence “tuning fork.” Galaxy number counts divided by morphological type from the Medium Deep Survey ([8], [19], [27]) found spiral and elliptical galaxies in numbers roughly comparable to predictions from no–evolution or pure luminosity evolution (PLE) models. However, irregular galaxies were far more common than expected, suggesting that they are primarily responsible for the faint blue galaxy excess. In the HDF, 40% of galaxies at fall into the irregular/peculiar/merging category [1]. WFPC2 images, however, did not resolve the question of how much the so–called “morphological –correction” might influence these assessments. At , the median redshift in the HDF [10] is , and at a substantial majority of objects should be at , where WFPC2 samples rest frame ultraviolet light. Thus the observed morphologies could primarily map the distribution of young, UV–bright star forming regions and the obscuring effects of dust rather than the overall structure of the stellar mass. Early efforts to simulate the appearance of high redshift galaxies by artificially redshifting vacuum UV images of nearby galaxies demonstrated both that irregular morphologies might be expected, and that the lower surface brightness features of “normal” galaxies today might be hard to see at high redshift due to dimming ([5], [26], [28]).
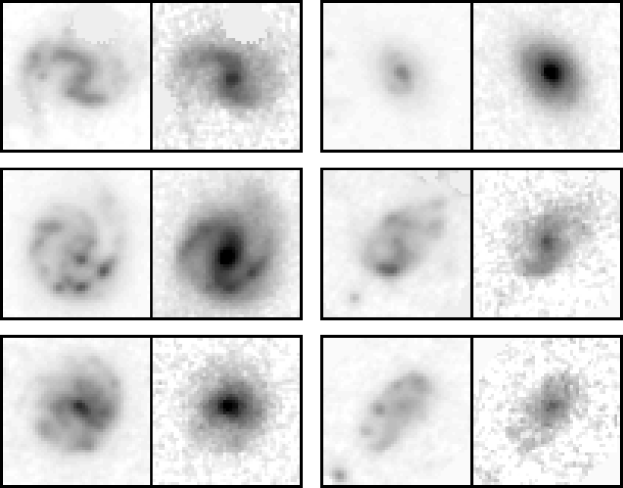
Such questions can largely be resolved by directly examining how the morphology of distant galaxies changes with wavelength. The WFPC2+NICMOS HDF data set allows us to form images of galaxies at fixed rest frame wavelengths over a wide range of redshifts. Figure 1 illustrates several disk galaxies, interpolating between bandpasses to rest frame wavelengths 3000Å and 6500Å. Here, the morphological differences are much as one would expect: the spiral arms and HII regions are prominent in the UV rest frame images. In the rest frame –band, the inter–arm disk light is stronger, the spiral arms tend to regularize, and prominent bulges and bars often appear that are all but invisible in the WFPC2 images.
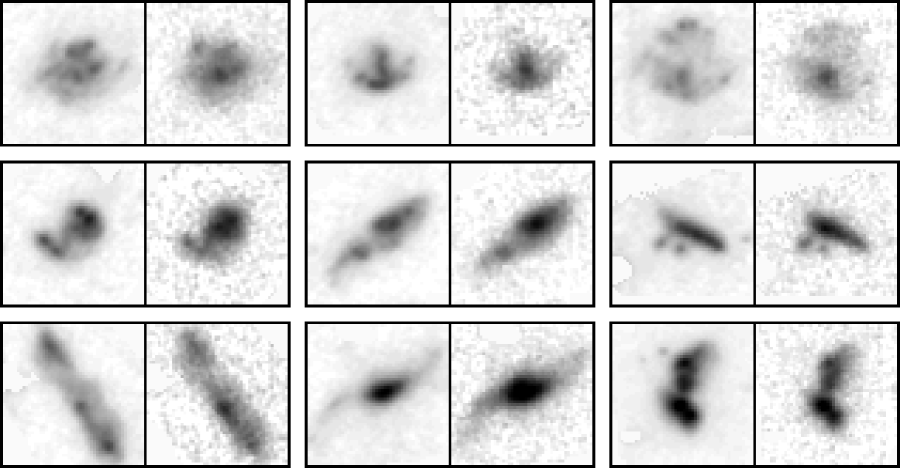
Some examples of galaxies with peculiar WFPC2 morphologies are shown in Figure 2. The irregularities in these objects tend to be preserved across the UV–to–optical wavelength baseline: dramatic transformations, where peculiar objects are revealed to be comparatively ordinary galaxies at longer wavelengths, are comparatively rare. The structure of “chain galaxies” like 2-736.1 (, lower right in Figure 2) is almost entirely unchanged from 1300Å to 6800Å in the rest frame. Some authors (e.g., [14]) have noted that these structures were unlikely to be stable and persist for long given the nominal dynamical time scales for these galaxies, and suggested that therefore they must be inherently young objects. For very blue objects like 2-736.1 this is quite likely true: the observed light from the UV through the IR is apparently dominated by the same, relatively young generation of stars, and if there is an older stellar component it is either well mixed with the younger stars, or its light is entirely swamped by the dominant, younger population out to long wavelengths. Some of the irregular galaxies appear to be simply very late type disks, with weak or absent bulges and without well–ordered spiral structure. There are also red, asymmetric galaxies [13], a comparative rarity in the local universe: these may be objects where recent encounters or mergers have disturbed the morphologies without inducing much star formation, or in some cases dust–reddened systems.
From a preliminary analysis of structural parameters for the overall HDF population at , we find [13] that galaxies in the NICMOS images tend to have smaller half–light radii, to be more centrally concentrated, and to exhibit greater symmetry in the the WFPC2 data. At fainter magnitudes, any trends are more difficult to discern because the mean galaxy size in the NICMOS data becomes small enough that the PSF dominates structural measurements. Other studies [46] have noted similar trends in among galaxies in NICMOS parallel images, although few fields had both optical and infrared HST imaging to permit direct comparisons on a galaxy–by–galaxy basis. In general, it appears that the morphological peculiarities seen in deep WFPC2 images arise from a variety of effects. Giant spiral and elliptical galaxies are present out to at least and perhaps beyond (see below), and look comparatively normal in the NICMOS data. But in general, the impression that the distant universe is rich in irregular and disturbed objects is preserved when considering the NICMOS images.
3 Elliptical galaxies
The myth of the passively evolving elliptical galaxy, formed in situ at high redshift in a dissipationless collapse and starburst, then burning its main sequence away for billions of years thereafter, has held sway since the scenario was postulated [20] and its photometric consequences were first modeled ([34], [48]). The broad homogeneity of giant elliptical galaxy photometric and structural properties in the nearby universe has compelled many investigators to hold this “monolithic” formation scenario as a rare example of a clearly stated null hypothesis for galaxy evolution against which to compare detailed measurements and computations. With HST imaging, we can directly observe the evolutionary history of the elliptical galaxy population. Until recently, much of this work has been done using rich clusters, where early type galaxies dominate the population. I will not review the cluster work here, except to note that most observers have favored the broad interpretation of quiescent, nearly passive evolution among cluster ellipticals out to .222The introduction to [39] provides a recent, succinct and comprehensive review of the literature concerning elliptical galaxy evolution at , both in clusters and in the field.
It is more challenging to uniformly select and study samples of high redshift field ellipticals. Attempts to do so have variously used selection criteria based on morphology, color, or both, and only a few have incorporated redshift information. There is little evolution in the luminosity function of intrinsically red galaxies from the CFRS [35], but this appears to contradict basic expectations from PLE models, where galaxies should be brighter at higher redshift [31]. This might imply that elliptical galaxies assemble late by merging processes, or that some fraction of distant ellipticals are blue enough to drop out of color–selected samples. Indeed, morphologically defined samples from HST imaging (e.g., [39], [33]) have identified bluer field ellipticals which might account for the decline in number density at higher redshifts seen in the color–selected samples.
At , the strong –correction for early–type galaxies means that infrared data are required to take an unbiased census. In the HDF, studies using ground–based infrared data have found a deficit of red ellipticals at ([50], [24], [3]), although other infrared surveys have found higher surface densities of red galaxies ([36], [21]), raising concerns about field–to–field variations. The most extensive optical–infrared color surveys incorporating WFPC2 [37] or NICMOS [49] morphologies have also concluded that there are fewer bright, red ellipticals at than would be expected from PLE models. Individual examples of red, high redshift ellipticals have been found in deep HST images (e.g., the HDF–S NICMOS field [45], [4]), although very few such galaxies have spectroscopic redshifts (see [18], [41], [40] for rare examples).
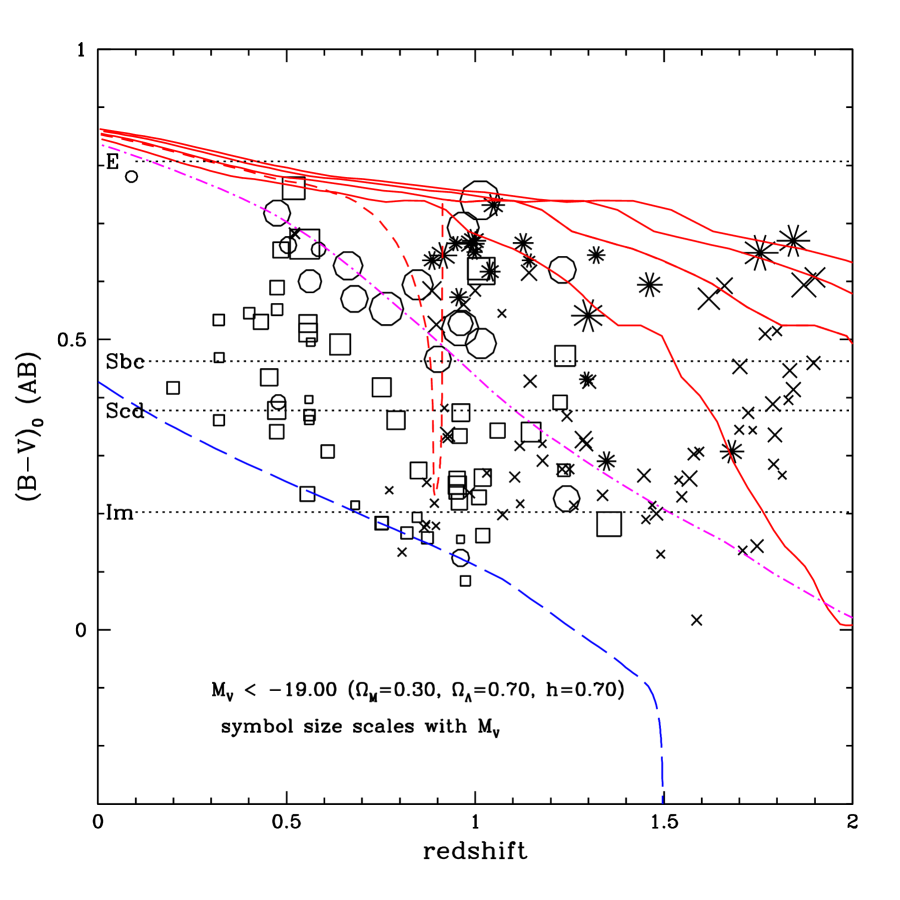
Figure 3 shows the rest frame colors of HDF galaxies out to , derived by interpolation between observed bandpasses to the fixed rest frame wavelengths. Spectroscopic redshifts are used wherever possible, and photometric redshifts otherwise. A “volume limited” sample of galaxies is plotted, selected to have at all redshifts. The galaxies mostly span a range of at all redshifts, as do present–day galaxies. At , an increasing fraction of galaxies bluer than present–day Scd spirals are found.
Using a combination of visual classifications, surface brightness profile fitting, and concentration/asymmetry measurements, we have defined a subsample of morphologically selected “early type” galaxies (roughly T–types -7 to -2), which are indicated by circle and asterisk symbols in the plots. The “red envelope” of the color distribution is largely defined by early type galaxies, and becomes gradually bluer at higher redshifts, as would be expected from passively evolving models. Galaxies with colors consistent with purely passive evolution and a high formation redshift are found out to (photometric) redshifts . Taking the spectral synthesis models at face value, these most distant ellipticals must have formed the bulk of their stars at . They are quite luminous: with passive fading and no further merging or star formation, they would become galaxies by (see Figure 4). The giant elliptical HDF 4–752, perhaps the most intrinsically luminous/massive galaxy in the HDF, would fade to today. Curiously, there are few good NICMOS–selected candidates for red ellipticals in the HDF at ; perhaps the only one is the so–called “J dropout” object [17], which might conceivably be a maximally old elliptical at to 4.
At the same time, there are many galaxies which we have classified as “ellipticals” which are substantially bluer than the PLE predictions, particularly at . This has also been noted previously from investigations of the CFRS+LDSS sample and the HDF itself ([39], [33]). Metallicity variations may account for part of the range of colors, but many of these “blue ellipticals” appear to be genuinely outliers from the color–magnitude relation. The rms scatter in colors at is approximately twice that seen among present–day ellipticals, even when the most extreme outliers are excluded. This is quite different than the situation found in rich cluster environments at similar redshifts [42]. The bluer colors can easily be accommodated with trace amounts of later star formation in otherwise old galaxies (see Figure 3).
4 Galaxy space densities
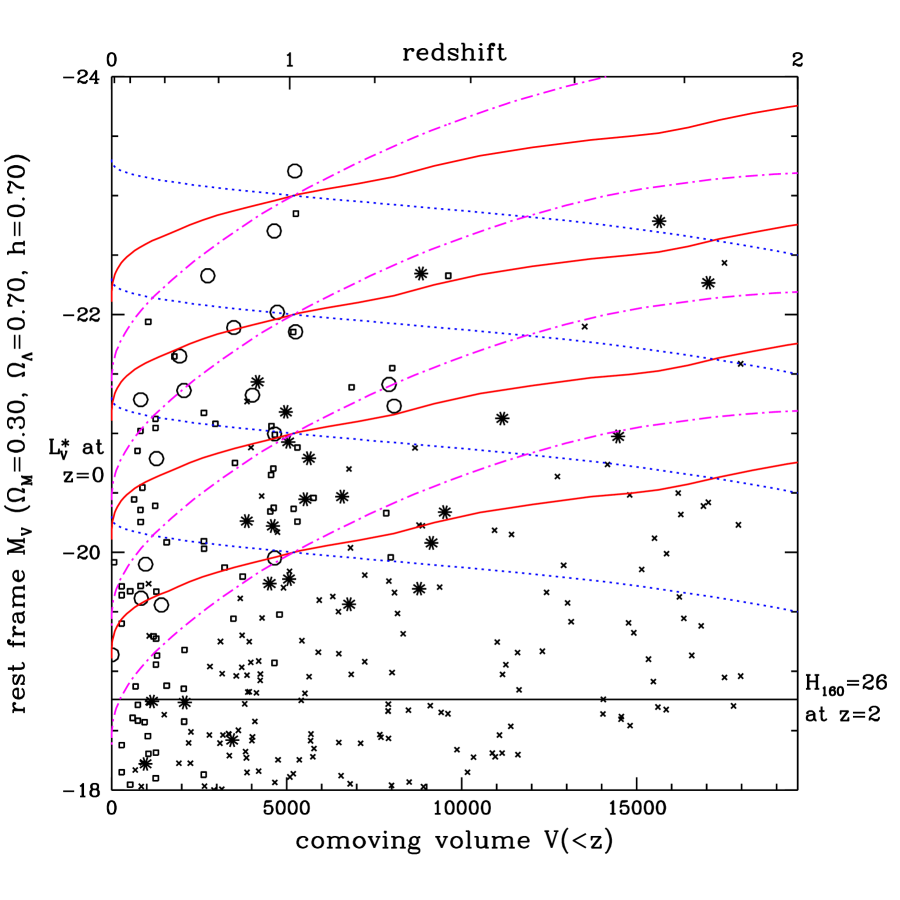
Some authors, using infrared–selected galaxy redshift surveys, have suggested that there are not enough bright galaxies at to account for the present–day population if galaxy number density is conserved with redshift (e.g., [32]). The small volume of the HDF makes it less than ideal for studying this question, but with a deep NICMOS–selected sample we may at least address it in the most broad–brush manner. Figure 4 shows rest frame –band luminosities for HDF galaxies at , plotted against co–moving volume . In such a plot, a constant density of points represents a constant co–moving space density (e.g., [10]), making it easy to “see” trends in the evolution of the luminosity function. Models for luminosity evolution given various possible star formation histories are indicated. If galaxies evolved according to such models, then counting objects between the parallel tracks would measure their space density with redshift. Let us take the simple exercise of dividing the volume out to in half: the midpoint is at for the adopted cosmology. Consider the single burst models (solid lines in Figure 4): the bottom–most of these lines corresponds to an object with luminosity today, and apparent magnitude at . Our morphological classifications should be complete at all redshifts brighter than this line. There are 84 HDF galaxies at more luminous than this model: the number ratio between the “low–” and “high–” volumes is 76:9. Considering only the morphological early type galaxies, the ratio is 27:4, similar to the population as a whole. Of course “single burst” models cannot describe the real history of most galaxies, but the same situation holds for virtually any scenario in which galaxy number is conserved. Even if we were to assume a negative luminosity evolution model where galaxies are less luminous at high redshift (e.g., constant SFR histories, the dotted lines in Figure 4), the same result holds. Considering the bottom–most of the constant SFR models, the low– to high– number ratio is 66:21.
Detection and photometry biases due to cosmological surface brightness dimming may contribute to this apparent high redshift deficit, but are unlikely to be the dominant effect. We have carried out simple simulations, taking bright () HDF galaxies at , artificially redshifting them to without any luminosity evolution, and re–inserting them into the NICMOS images at common rest frame wavelengths. Most would still be easily detectable; their recovered magnitudes can be somewhat biased, although careful choice of photometric procedures (e.g., using constant metric apertures or “Kron”–style photometry based on moments of the light profile) should minimize the impact of this effect.
Several important caveats must be kept in mind, however. First, there are no HDF galaxies with spectroscopic redshifts : this is exactly the “redshift desert” where spectroscopy is most difficult, and thus our comparison depends entirely on the reliability of our photometric redshifts. Although we believe they are good, there could conceivably be some sort of systematic “depopulation” of this uncalibrated region. This, however, would have to be a dramatic effect to account for the difference: only if all galaxies without spectroscopic redshifts and with were instead assigned would the number densities balance out, and photometric redshifts at have been shown to be generally quite reliable [30]. Objects assigned might also be at lower redshifts, although in general the Lyman break signature makes such redshift estimates fairly robust. Second, the HDF–N is only a single sight line, and large–scale structure may affect results to a much greater degree than Poisson statistics. E.g., there are substantial overdensities in the HDF redshift distribution at , 0.96, and 1.02 [10]. The latter two are rich in early type galaxies, and indeed there are too many bright ellipticals at in the HDF compared to extrapolations from the present–day luminosity function or by comparison with other faint field surveys ([39], [43]). In fact, 23% of the rest frame 5400Å luminosity density in the HDF at comes from just four galaxies (three of which are ellipticals) in the redshift spikes at and 1.02. These overdensities appear to be “walls” or “sheets” whose transverse sizes substantially exceed the WFPC2 field of view. Similar structures are now known to be ubiquitous at ([44], [2]). Although I have split the HDF volume out to evenly at , the line–of–sight co–moving path length intervals are very different, roughly 4:1. The number of bright galaxies, even in these seemingly broad redshift intervals, might just indicate the luck of the draw with encountering the most overdense redshift “spikes.”
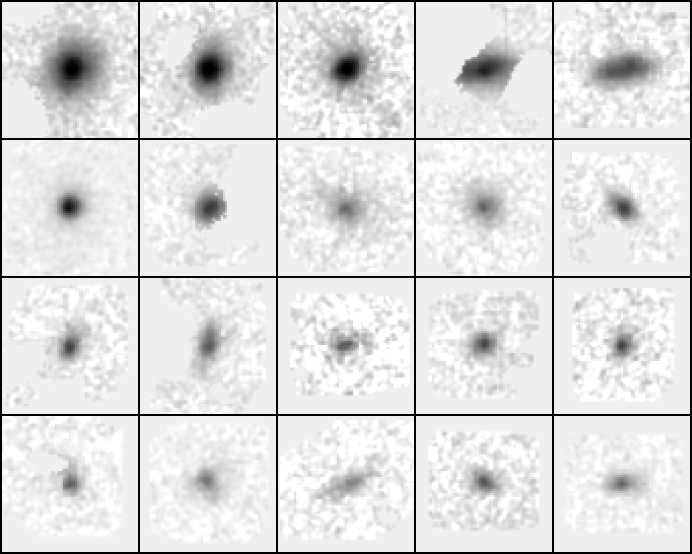
The deficit of bright, high redshift galaxies in the HDF–N seems to apply not only to ellipticals ([50], [24]) but to all galaxy types. Spectroscopic verification of the photometric redshifts in this redshift range is clearly critical. Only similar analyses of other sight lines will tell whether this is a universal situation or whether it is a feature of this particular sight line. Although the quality and depth of the combined optical+infrared data for the HDF–N is unmatched elsewhere, photometric redshift analyses of other ground–based and HST deep survey fields have also suggested bright galaxy deficits at [23]. At the same time, it is notable that even at , the most luminous HDF galaxies are evidently mature giant elliptical galaxies, with SEDs that suggest large formation redshifts (), and which even with passive luminosity evolution would fade to objects today. The 20 brightest galaxies with are shown in Figure 6. The red ellipticals are among the brightest objects. Several appear to be disk galaxies, although few seem to be as large as the comparably bright HDF spirals shown in Figure 1, or to have prominent, high surface brightness spiral arms.333In a few cases from Figure 5, spiral structure is seen more clearly in the rest–frame UV WFPC2 data, which has better angular resolution. However, a more careful analysis accounting fully for surface brightness dimming is needed before reaching firm conclusions.
5 Conclusions
Deep, high resolution optical–infrared imaging, together with spectroscopy and (where needed) photometric redshifts, offers the means for studying galaxy properties at common rest frame wavelengths over a broad redshift baseline. At present, the HDF–N is the only place where all the ingredients are available for a single field. Even there, our NICMOS map is neither as deep (to minimize surface brightness dimming losses) nor as sharp (to match WFPC2 angular resolution) as we would like. Moreover, with only a single field covering a small cosmic volume, it is risky to generalize HDF–N results to the universe as a whole. Nevertheless, several trends are apparent. We find giant disk galaxies with prominent spiral structure, red bulges, and bars out to , and red, apparently mature giant ellipticals out to . The latter probably formed the bulk of their stars at much higher redshift. However, bluer early type galaxies are also found at , suggesting that some field ellipticals had extended star formation histories, in contrast with what has been observed in rich clusters. The morphological peculiarities of most irregular HDF galaxies persist in the NICMOS images, suggesting that they are genuinely disturbed or immature objects. Finally, there seem to be far fewer high luminosity galaxies of all types at compared to lower redshifts, although this result must be treated with caution given the small volume of the HDF, its susceptibility to clustering variations, and the reliance on photometric redshifts. With a revived NICMOS in Cycle 10 we can extend such work to other fields. Better still, the infrared channel of WFC3, scheduled for installation on HST in 2003, will have a substantially wider field of view and smaller pixel scale, providing improved angular resolution compared to the undersampled NICMOS Camera 3. Deeper and wider surveys will become enormously more efficient, permitting a much better census of the distant universe in the near infrared, and helping to pave the way for NGST.
6 Acknowledgements
I would like to thank my collaborators on the HDF/NICMOS GO program for their contributions to this project, and for allowing me to present results in advance of publication. I especially thank Tamas Budavári for deriving the photometric redshifts used here, and Adam Stanford for analysis and discussions about HDF elliptical galaxies, and for compiling the morphological classifications. I also thank the organizers of this meeting for their hospitality, generous travel support, and patience editing these proceedings. Support for this work was provided by NASA grant GO-07817.01-96A.
References
- [1] Abraham, R.G., Tanvir, N.R., Santiago, B.X., Ellis, R.S., Glazebrook, K., & van den Bergh, S., 1996, MNRAS 279, L47
- [2] Adelberger, K.L., Steidel, C.C., Giavalisco, M., Dickinson, M., Pettini, M., & Kellogg, M., 1998, Astrophys. J. 505, 18
- [3] Barger, A.J., Cowie, L.L., Trentham, N., Fulton, E., Hu, E.M., Songaila, A., & Hall, D. 1999, Astron. J. 117, 102
- [4] Benítez, N., Broadhurst, T., Bouwens, R., Silk, J., & Rosati, P., 1999, Astrophys. J. 515, 65
- [5] Bohlin, R.C., et al. 1991, Astrophys. J. 368, 12
- [6] Bruzual, A.G., & Charlot, S., 1996, private communication
- [7] Budavári, T., Szalay, A.S., Connolly, A.J., Csabai, I., & Dickinson, M. 1999, in Photometric Redshifts and the Detection of High-Redshift Galaxies, eds. R. Weymann, L. Storrie–Lombardi M. Sawicki & R. Brunner, (San Francisco: ASP), in press (astro–ph/9908008)
- [8] Casertano, S., Ratnatunga, K.U., Griffiths, R.E., Im, M., Neuschaefer, L.W., Ostrander, E.J., & Windhorst, R.A., 1995, Astrophys. J. 453, 599
- [9] Cohen, J.G., Cowie, L.L., Hogg, D.W., Songaila, A., Blandford, R., Hu, E.M., & Shopbell, P., 1996, Astrophys. J. 471, L5
- [10] Cohen, J.G., Hogg, D.W., Blandford, R., Cowie, L.L., Hu, E.M., Songaila, A., & Shopbell, P., 2000, Astrophys. J. ,, submitted
- [11] Coleman, G.D., Wu, C.-C., & Weedman, D.W., 1980, Astrophys. J. Suppl. Ser. 43, 393
- [12] Connolly, A.J., Szalay, A.S., Dickinson, M., Subbarao, M.U., & Brunner, R.J., 1997, Astrophys. J. 486, L11
- [13] Conselice, C., et al., 2000, in preparation
- [14] Cowie, L.L., Hu, E.M., & Songaila, A., 1995, Astron. J. 110, 1576
- [15] Csabai, I., Szalay, A.S., Connolly, A.J. Budavári, T., 1999, Astron. J. in press (astro–ph/9910389)
- [16] Dickinson, M., 1998, in The Hubble Deep Field, eds. M. Livio, S. M. Fall & P. Madau (Cambridge: Cambridge Univ. Press), 219
- [17] Dickinson, M., et al. 2000, Astrophys. J. in press (astro–ph/9908083)
- [18] Dunlop, J., Peacock, J., Spinrad, H., Dey, A., Jimenez, R., Stern, D., & Windhorst, R., 1996, Nature 381, 581
- [19] Driver, S.P., Windhorst, R.A., & Griffiths, R.E., 1995, Astrophys. J. 453, 48
- [20] Eggen, O.J., Lynden–Bell, D., & Sandage, A., 1962, Astrophys. J. 136, 748
- [21] Eisenhardt, P., Elston, R., Stanford, S.A., Dickinson, M., Spinrad, H., Stern, D., & Dey, A., 1998, in The Birth of Galaxies, eds. B. Guiderdoni, F. Bouchet, T.X. Thuan, & J.T.T. Van, (Paris: Edition Frontieres), in press
- [22] Fernández–Soto, A., Lanzetta, K.M., & Yahil, A. 1999, Astrophys. J. 513, 34
- [23] Fontana, A., Menci, N., D’Odorico, S., Giallongo, E., Poli, F., Moorwood, A., & Saracco, P., 1999, MNRAS in press (astro–ph/9909126)
- [24] Franceschini, A., Silva, L., Fasano, G., Granato, G.L., Bressan, A., Arnouts, S., & Danese, L., 1998, Astrophys. J. 506, 600
- [25] Gardner, J., Sharples, R.M., Frenk, C.S., & Carrasco, B.E., 1997, MNRAS 282, L1
- [26] Giavalisco, M., Livio, M., Bohlin, R.C., Macchetto, F.D., & Stecher, T.P., 1996, Astron. J. 112, 369
- [27] Glazebrook, K., Ellis, R.S., Santiago, B., & Griffiths, R.E., 1995, MNRAS 275, L19
- [28] Hibbard, J.E., & Vacca, W.D., 1997, Astron. J. 114, 1741
- [29] Hogg, D.W., Neugebauer, G., Armus, L., Matthews, K., Pahre, M.A., Soifer, B.T., & Weinberger, A.J. 1997, Astron. J. 113, 2338
- [30] Hogg, D.W., et al., 1998, Astron. J. 115, 1418
- [31] Kauffmann, G., Charlot, S., & White, S., 1996, MNRAS 283, L117
- [32] Kauffmann, G., & Charlot, S., 1998, MNRAS 297, L23
- [33] Kodama, T., Bower, R.G., & Bell, E.F., 1999, MNRAS 306, 561
- [34] Larson, R.B., & Tinsley, B.M., 1974, Astrophys. J. 192, 293
- [35] Lilly, S.J., Tresse, L., Hammer, F., Crampton, D., & Le Fèvre, O., 1995, Astrophys. J. 455, 108
- [36] McCracken, H.J., Metcalfe, N., Shanks, T., Campos, A., Gardner, J.P., & Fong, R., 1999, MNRAS in press (astro–ph/9904014)
- [37] Menanteau, F., Ellis, R.S., Abraham, R.G., Barger, A.J., & Cowie, L.L., 1999, MNRAS 309, 208
- [38] Phillips, A.C., Guzman, R., Gallego, J., Koo, D.C., Lowenthal, J.D., Vogt, N.P., Faber, S.M., & Illingworth, G.D., 1997, Astrophys. J. 489, 543
- [39] Schade, D., et al., 1999, Astrophys. J. in press (astro–ph/9906171)
- [40] Soifer, B.T., Matthews, K., Armus, L., Cohen, J.G., & Persson, S.E., 1999, Astron. J. in press (astro–ph/9906464)
- [41] Spinrad, H., Dey, A., Stern, D., Dunlop, J., Peacock, J., Jimenez, R., & Windhorst, R. 1997, Astrophys. J. 484, 581
- [42] Stanford, S.,A., Eisenhardt, P.,R., & Dickinson, M., 1998, Astrophys. J. 492, 461
- [43] Stanford, S.,A., Dickinson, M., et al., 2000, in preparation
- [44] Steidel, C.C., Adelberger, K.L., Dickinson, M., Giavalisco, M., Pettini, M., & Kellogg, M., 1998, Astrophys. J. 492, 428
- [45] Stiavelli, M., et al., 1999, Astr. Astrophys. 343, L25
- [46] Teplitz, H., Gardner, J., Malmuth, E., & Heap, S., 1998, Astrophys. J. 507, L17
- [47] Thompson, R.I., Storrie–Lombardi, L.J., Weymann, R.J., Rieke, M., Schneider, G., Stobie, E., & Lytle, D. 1999, Astron. J. 117, 17
- [48] Tinsley, B.M., & Gunn, J.E., 1976, Astrophys. J. 203, 52
- [49] Treu, M., & Stiavelli, M., 1999, Astrophys. J. 524, L27
- [50] Zepf, S., 1997, Nature 390, 377