The first galaxies: structure and stellar populations
Abstract
early universe — galaxies: evolution — galaxies: morphology – galaxies: stellar content — infrared: galaxies
The Hubble Deep Fields continue to be a valuable resource for studying the distant universe, particularly at where their comoving volume becomes large enough to encompass several hundred galaxies or their progenitors. Here I present recent results from a near–infrared imaging survey of the HDF–North with NICMOS, which provides structural and photometric information in the optical rest frame (4000–5500Å) for hundreds of ordinary galaxies at , and which offers the means to search for still more distant objects at . Lyman break galaxies at are compact and often irregular in the NICMOS images; ordinary Hubble sequence spirals and ellipticals seem to be largely absent at these redshifts, and apparently reached maturity at . The Lyman break galaxies have UV–optical spectral energy distributions like those of local starburst galaxies. Population synthesis models suggest typical ages few years and moderate UV extinction ( mag at 1700Å), but the constraints are fairly weak and there may be considerable variety. Considering a near–IR selected galaxy sample, there is little evidence for a significant number of galaxies at that have been missed by UV–based Lyman break selection. Using the well–characterized galaxy population as a point of reference, I consider Lyman break galaxy candidates at , as well as one remarkable object which might (or might not) be at . The space density of UV–bright galaxies in the HDF appears to thin out toward larger redshifts, although surface brightness selection effects may play an important role.
1 Introduction
1.1 The first galaxies?
The past five years have seen remarkable breakthroughs in our ability to identify and systematically study ordinary galaxies at very large redshifts, not just as isolated case studies, but en masse as a galaxy population. To date, nearly 1000 galaxies have been spectroscopically confirmed at , mostly identified via broad–band color selection techniques (Steidel et al. 1996, i.e., the Lyman break galaxies, or LBGs), but with other important and complementary methods also coming into play (sub–mm and radio surveys, emission line searches, QSO absorption systems, etc.). A broad census of galaxy properties at now seems within reach, covering star formation rates (SFRs), dust content, morphologies, spatial clustering, and perhaps even chemical abundances and internal kinematics.
Although I have retained my assigned title, ‘The First Galaxies…,’ it is far from clear that we know when, where, or how to find the ‘first’ galaxies. The LBGs may or may not be the first major wave of galaxy formation. If anything, current data favors a roughly constant global SFR (as traced by cosmic UV luminosity density, at least) from , with no certain evidence for a decline at higher redshifts (Steidel et al. 1999). The sub–mm population detected by SCUBA (cf. Cowie, this volume) may or may not represent the bulk of early star formation, and the upper redshift bound to SCUBA sources remains unknown. The reionization of the intergalactic medium at and the presence of metals in the Ly forest at point toward earlier epochs of star and galaxy formation, at least in trace amounts. A handful of galaxies now have plausible spectroscopic confirmation at , but too few for any systematic census.
For this reason, I cannot promise to live up to my title: I do not know what the first galaxies are or what they look like. Given this ignorance, I will focus the first part of this article on the structure and stellar populations of the most distant well studied galaxies, the Lyman break objects. This is not meant as a comprehensive review, but will instead concentrate on new imaging and photometric data from NICMOS on HST that extend our knowledge of LBG properties to the optical rest frame. In his contribution to this volume, Max Pettini provides a complementary discussion of recent efforts to measure chemical abundances and internal kinematics for these same galaxies. In the second part of my article, I will describe efforts to extend Lyman break color selection to still larger redshifts, approaching (or perhaps even exceeding) . In this way I hope to at least provide a look into the epoch when ‘the first galaxies’ might plausibly have been formed, and to catalog what we can find right now, in the pre–NGST era, given the best available survey data.
1.2 Infrared observations of the Hubble Deep Field
For the past five years, the Hubble Deep Fields (HDFs) have provided the most exquisitely deep, high angular resolution optical census of the distant universe. It is important (if somewhat pedantic) to consider what an HDF is actually good for. One WFPC2 field covers 5 arcmin2, and probes a very small co–moving volume at , enough to hold only –30 galaxies, depending on the cosmology. Given small number statistics and concerns about clustering, the central HDF is therefore not the best place study massive galaxies in the ‘low’ redshift universe, despite the fact that most of cosmic time and most bright galaxies with spectroscopic redshifts are at . There is far more volume at high redshift: 10.5 to 40 more at than at for plausible cosmologies, room enough for several hundred galaxies or their progenitors.
At , the optical light emitted from galaxies shifts into the near–infrared. Thus in order to compare galaxies to their local counterparts, and to search for still more distant objects at , it is important to extend the wavelength baseline. The HDF–North was observed in the near–IR from the ground in several different programs (e.g., Hogg et al. 1997; Barger et al. 1998; and our own KPNO 4m imaging, cf. Dickinson 1998). The depth and angular resolution (typically ) of these data are a poor match to that of the optical WFPC2 HDF images. Two programs therefore targeted the HDF–North with NICMOS on board HST, providing much deeper images with high angular resolution. The NICMOS GTOs (Thompson et al. 1999) imaged one NICMOS Camera 3 field () for 49 orbits each at F110W (1.1m) and F160W (1.6m). Our own program mosaiced the complete HDF with a mean exposure time of 12600s per filter in F110W and F160W. Sensitivity varies over the field of view, but the average depth is AB at in an diameter aperture. The drizzled PSF has FWHM = , primarily limited by the NIC3 pixel scale. Because most galaxies have spectral energy distributions (SEDs) which brighten (in units) at redder wavelengths, our images detect roughly half of the galaxies from the WFPC2 HDF, despite their short exposure times. We have also reanalyzed our KPNO images to optimally extract photometry matched to the WFPC2+NICMOS data. These data are not as deep as one would like, which is unfortunate because they provide the only access to rest frame optical wavelengths for objects at , but they are the best presently available.
Thanks to the dedicated efforts of the observers, a remarkably high density of spectroscopic redshifts is available in the HDF–N: galaxies (plus a few stars) in the central WFPC2+NICMOS field alone, with 33 objects at . Taking advantage of the high quality photometric data, many investigators have used multicolor selection (e.g. the two color Lyman break criteria of Steidel et al. 1996, Madau et al. 1996, and others) or photometric redshifts (e.g., Fernández–Soto et al. 1999) to identify high redshift galaxy candidates. There are advantages and drawbacks to both approaches, but both have demonstrated remarkable successes. In this discussion, I will make use of both methods. For the photometric redshifts, I will use fits to our 7–band HDF photometry by Budavári et al. (2000), whose ‘adaptive template’ method is a modification of an otherwise straightforward spectral template fitting scheme. I will use AB magnitudes here throughout, and notate the six WFPC2 + NICMOS bandpasses by , , , , and . Unless stated otherwise, I will assume a cosmology with , , and .
2 Galaxy morphologies at
The NICMOS images sample rest frame wavelengths in the optical to bands from to 2.8. This upper bound is about the midpoint of the redshift range where –dropout Lyman break selection in the HDF is most efficient. Therefore, at these redshifts we may use the NICMOS data to study the morphologies of LBGs at wavelengths where long–lived stars, if they are present, may dominate the light from the galaxy, and where dust obscuration should play a significantly lesser role than it does in the ultraviolet. For LBGs at , the NICMOS bandpass slips into the rest frame ultraviolet, and the NICMOS images once again tell us more about the distribution of star formation within galaxies than about that of their stellar mass.
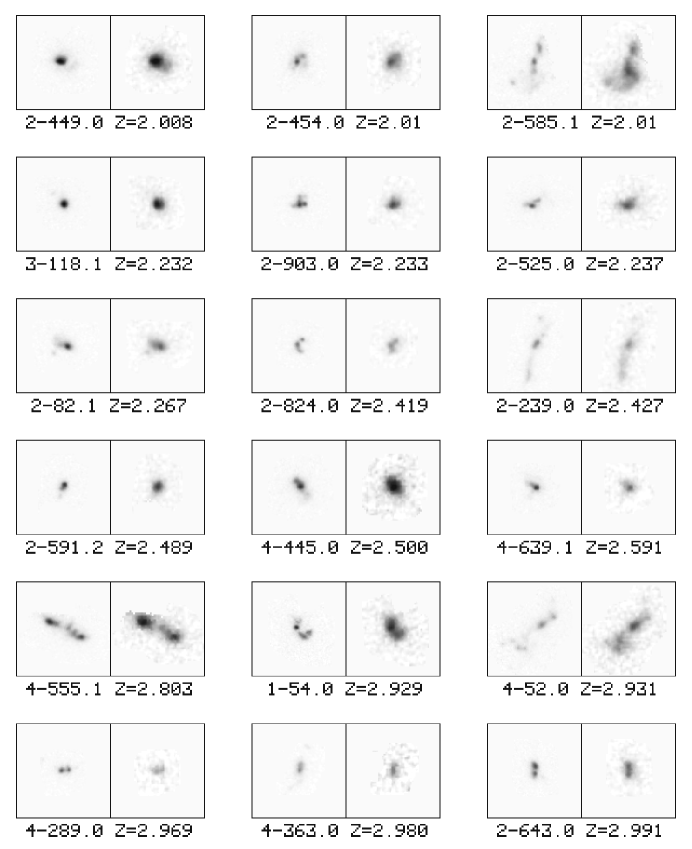
Figure 1 compares rest frame UV and optical images of a set of HDF LBGs with spectroscopic redshifts . The NICMOS data have somewhat poorer angular resolution (022 compared to 014 for WFPC2), but otherwise the most striking thing is the broad similarity of the UV and optical morphologies. Giavalisco et al. (1996) and Lowenthal et al. (1997) have emphasized the very small sizes of LBGs in WFPC2 images, and the same is true at NICMOS wavelengths. Accounting for PSF differences, the half–light radii of the galaxies measured from the NICMOS images are the same as (or in some cases, slightly smaller than) those from the WFPC2 data. Notable morphological differences are seen in only a few cases, e.g., 2–585.1 () and 4–52 (), two of the largest LBGs in the HDF. Each has a region of diffuse emission in the WFPC2 images which lights up in the NICMOS data, with quite red colors. It is not clear whether this is due to the presence of dust, older and redder starlight, or possibly strong line emission.1114–52 is one of the few galaxies detected at 8.5 GHz by Richards et al. 1998. The radio centroid is coincident with the diffuse, red, IR–bright region in the galaxy.
In general there is no evidence that the UV–bright regions seen by WFPC2 are just star–forming ‘fragments’ embedded within some larger, mature host galaxy. On the whole, one or more of the following appears to be true: (1) the stars which dominate the light at 1200–1800Å also dominate at 4000–5500Å; (2) if components with substantially different ages and colors are present, then they are fairly well mixed, spatially; (3) dust extinction does not play a dominant role in shaping the morphologies of LBGs at these wavelengths. All of this should be taken modulo the important caveat that at FWHM resolution, most of the LBGs are not exquisitely resolved: they are typically very small, having only a few resolution elements within their isophotally detectable areas, and thus many details are surely lost except perhaps for the few, largest objects.
It is striking that among the NICMOS images of HDF LBGs (those with and without spectroscopic redshifts), virtually none resembles a ‘classical’ Hubble sequence spiral galaxy. Giant disk galaxies are found in the HDF and elsewhere out to at least (see, e.g., examples from NICMOS in Bunker 1999 and Dickinson 2000), and various studies have found that their structural properties and comoving abundances have not changed dramatically since (Lilly et al. 1998; Simard et al. 1999). At , however, there appear to be no objects with immediately recognizable spiral structure, no bulges surrounded by symmetric, diffuse disks, nor even good candidates for thin, edge–on disks (some LBGs are fairly elongated, but none really could be mistaken for an edge–on spiral). Among the objects shown in figure 1, perhaps 2–585.1 () appears closest to showing spiral structure at rest frame optical wavelengths, but this requires some imagination. Given the evidence from NICMOS, the absence of classical spiral morphologies cannot be attributed solely to rest frame wavelength effects. We have carried out simulations using optical rest frame images of Virgo cluster spirals and of HDF disk galaxies at , artificially inserted into the NICMOS images at high redshift with the appropriate surface brightness dimming and PSF convolution. Although low surface brightnesses and limited angular resolution wipe out many of the details of spiral structure, giant () disk galaxies should be detectable and recognizable at even with no luminosity or surface brightness evolution. This is not to say that LBGs cannot be disk galaxies: as already noted, the small angular sizes of most LBGs preclude detailed resolution, and some of these objects could well be small disks. Indeed, Giavalisco et al. (1996) noted exponential surface brightness profiles among some LBGs.
Giavalisco et al. also found that some LBGs have law profiles, although it is not clear whether to interpret this as indicating a relation between LBGs and present–day ellipticals and bulges. It is worth noting, however, that there are few candidates for intrinsically red elliptical galaxies at in the HDF, i.e., objects which would be recognized as elliptical galaxies today both by morphology and by the characteristic color signature of an older stellar population. In fact, considering objects with spectroscopic or photometric redshifts in the range , where the NICMOS+KPNO infrared data still reach the optical rest frame, there are only a handful of galaxies with rest frame colors redder than that of a present–day Scd spiral (i.e., an actively star forming galaxy), even in an infrared–selected sample which should have no bias against such objects. I return to this point in §4 below. Nearly every HDF galaxy at which is detectable at m appears to be forming stars, and most quite vigorously. We do find apparently red, dead ellipticals in the HDF out to (photometric) redshifts (cf. Dickinson 2000; Stanford et al. in prep.), but only one (marginally) viable candidate for a red elliptical at higher redshift. This is the so–called ‘–dropout’ object HDFN–JD1 (see §6), whose colors might be matched by those of a maximally old elliptical galaxy at (Dickinson et al. 2000).222In fact, HDFN–JD1 is probably too red for an old stellar population at high redshift without invoking dust, an unusual IMF, or an unfashionable cosmological model.
Overall, it seems that the maturation of the giant spiral and elliptical galaxies took place at . Even with extremely deep, high angular resolution infrared images like the HDF/NICMOS data, we find few (if any) mature spirals or ellipticals (or candidates for such) at higher redshift. By , many (if not necessarily all) large spirals and red giant ellipticals were already in place, pointing to the redshift range as an important ‘golden age’ for the formation of the Hubble sequence.
3 Galaxy colors at
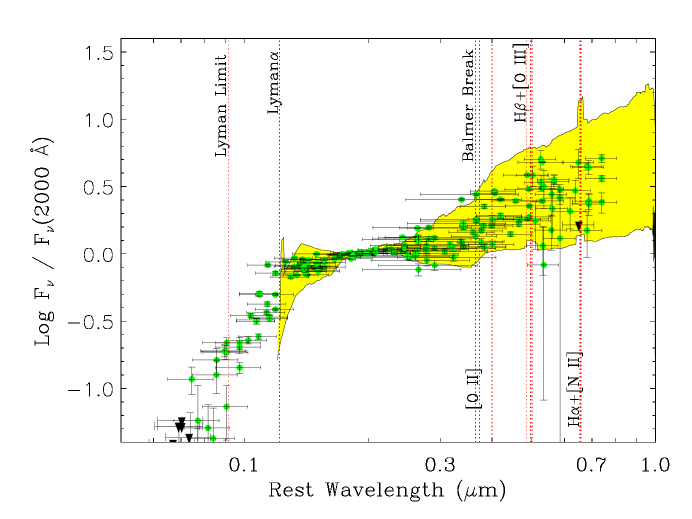
Figure 2 shows a photometric compendium of spectroscopically confirmed HDF galaxies at , all shifted to the rest frame and normalized to a common flux density at 2000Å. The shaded envelope is defined by local UV–to–optical starburst galaxy spectral templates from Kinney et al. (1996), which span a broad range in optical/UV extinction. The HDF LBGs fall comfortably within the range of SED shapes defined by the local starbursts. They have relatively blue (but usually not flat spectrum) UV continua, with a flux increase and spectral inflection around the Balmer/4000Å break region that indicates the presence of older (A and later) stars which apparently contribute a significant fraction of the rest frame optical light. The fact that the UV continuum slope for LBGs is nearly always redder than flat spectrum has generally been interpreted as an indication of dust extinction (e.g., Meurer et al. 1997, 1999; Dickinson 1998; Pettini et al. 1998), although for some objects it might also result from an aging stellar population with declining or inactive star formation. Considered individually, the large majority of HDF LBGs are reasonably well fit by the Kinney et al. starbursts with modest reddening (). Few approach the more heavily reddened templates. This may be true by definition/selection, of course, since we are considering the brighter objects for which redshifts were successfully measured, and which were selected for spectroscopy by their UV colors (but see §4 below).
With photometry spanning the UV–to–optical rest frame it becomes interesting to compare the LBG photometry to population synthesis models to look for constraints on galaxy ages, reddening, and star formation histories. Very roughly, if the UV spectral slope provides a measure of extinction (modulo an assumed reddening law), then the UV–optical flux ratio, and particularly the amplitude of any inflection around the Balmer/4000Å break region, may help constrain the past star formation history, particularly the ratio of older stars to ongoing star formation. This was first done by Sawicki & Yee (1998) using ground–based photometry for LBGs in the HDF. Their results favored young ages (median value Myr) and fairly heavy reddening (typical , or 3 mag extinction at 1600Å assuming Calzetti 1997 starburst dust attenuation). We have carried out a similar exercise using the NICMOS data and –band fluxes rederived from the KPNO data using a technique (much like that of Fernández–Soto et al. 1999) which properly matches photometry from images with very different angular resolutions. A complete presentation will be given in Papovich et al. (in prep.) and is beyond the scope of the present discussion, but I summarize some important points here.
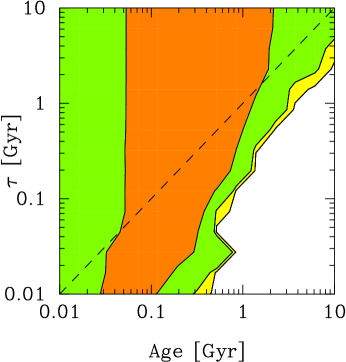
Even with precise NICMOS photometry, constraints on ages and reddening are quite loose. This is in part because of the usual degeneracies in fitting models to broad band colors (age vs. metallicity vs. extinction), but also because the available photometry simply does not reach long enough rest frame wavelengths. At , only the lower– ground–based data extend redward of the Balmer/4000Å break region; for this reason, here I consider only galaxies at . For each galaxy, we may define confidence intervals in the multidimensional space of the various fitting parameters such as age, SFR e–folding timescale, reddening, metallicity, and IMF. The color degeneracies allow fairly broad ranges in acceptable parameters for each object, and the variety among the galaxy SEDs (figure 2) scatters the best–fitting parameters throughout a range of values. Nevertheless, taken as an ensemble, certain regions of model parameter space are preferred.
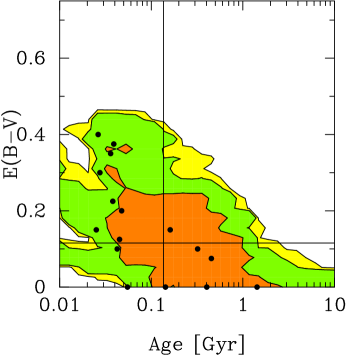
Figure 3 shows a composite distribution for 16 galaxies with , where model fits for each object have been averaged, weighted by their likelihoods in the multi–parameter space. The contours thus indicate a distribution of likely parameter values for the ensemble of UV–selected LBGs. The best–fitting values of vs. age for individual objects are marked by dots. Some galaxies can be fit reasonably well by parameter values falling toward the outer contours of the ensemble distribution, but the majority occupy the higher confidence regions. The most favored age range spans 0.03–1 Gyr, with extinction . The extinction values agree well with the comparison to the Kinney et al. starburst templates (figure 2), which is not unexpected given that the Calzetti attenuation law is derived in part from the same UV spectral data on local starburst galaxies. The range of likely age and extinction values becomes slightly smaller and can shift somewhat if restrictions on metallicity or IMF are adopted, although in general the broad band photometry offers little constraint on these parameters. Younger ages and larger extinction are allowed and even favored for some objects, but in general the most likely values are somewhat older and less reddened than those found by Sawicki & Yee. This may be due to more precise photometry from NICMOS, or to better control of the relative optical–IR colors (particularly in the –band) from our photometric method.
It is not clear whether the apparent anticorrelation between age and extinction in figure 3 is significant. We expect degeneracy between the age and extinction values fit to individual objects, but the overall trend seen in the population may be greater than would be expected from the fitting uncertainties alone. The ‘most favored’ extinction value, , corresponds to mag, or a factor of . The net UV extinction for the sample (and hence the correction to any derived global star formation rate) would be larger, however, driven by the objects with the greatest reddening.
A characteristic timescale for Lyman break galaxies can be defined from their sizes (median half–light radii kpc for the HDF LBGs) and typical velocity dispersions ( km s-1; see Pettini, this volume). This yields Myr. If the UV light is due to ongoing star formation, we would not expect SFR lifetimes , and indeed this is roughly the lower bound of the best–fit model age range, with the most favored value being Myr, or . This range is not dissimilar to that estimated for star formation in galactic–scale starburst events (e.g., ULIRGs) locally.
4 Rest frame UV selection: what do we miss?
Using an infrared–selected catalog, we may ask what galaxies might be missed altogether by Lyman break color selection keyed to the rest frame UV light. In particular, one might expect some red high redshift galaxies, either because they are not actively forming stars or because of extinction, that would ‘drop out’ of the dropout samples. Here I restrict my analysis to , where we believe our catalogs are highly complete, uncontaminated by spurious sources, and where the NICMOS photometry has . At , corresponds to rest frame for the adopted cosmology, or mag fainter than present–day . The typical LBG at has , the practical limit for HDF –dropout selection using standard 2–color criteria, but red galaxies with similar rest frame optical luminosities might be fainter or absent in the UV.
At there is only one object which is undetected with in or (both, in this case): this is the ‘–dropout’ HDFN–JD1 (see also §§2 and 6). In fact, this is the only NICMOS–selected object with and . Two other objects have ; both are –dropout candidates identified by Lanzetta et al. (1996) and Fernández–Soto et al. (1999), one of which (3–951) was spectroscopically confirmed at (Spinrad et al. 1999). Thus the only possible candidate for a NICMOS–selected, ‘UV–invisible’ galaxy at is HDFN–JD1.

Next let us consider UV–bright objects which might nevertheless have been missed by the LBG color criteria, using the 7–band photometric redshift estimates for all galaxies. In principle, these may identify plausible candidates at that otherwise fall outside a given set of UV color criteria, as long as their intrinsic SEDs are ‘recognizably similar’ to those of galaxies at lower redshift which define the templates used for the phot– fitting.
Figure 4 shows the distributions for all HDF galaxies with , and for those that meet the dropout criteria and from Dickinson (1998). There are 43 objects with which do not meet the LBG color criteria. However, nearly all are at or , and lie just outside the color selection boundaries defined here: either slightly too blue at low , or slightly too red at high . This is expected: the selection efficiency of the 2–color method is not uniform with redshift, and falls off at the extremes of the range for which it is optimized (cf. Steidel et al. 1999). Only 7 ‘missed’ objects fall at intermediate photometric redshifts, , and most of these are also just outside the color selection box. Some are quite interesting, including a Jy radio source with very red colors which may be a dusty starburst or a fading post–starburst galaxy at . Others may be scattered out of the box by photometry errors (especially in ), or might not be at the indicated . But all are well detected in the optical HDF.
Overall, there is no evidence for a substantial population (by number) of galaxies at that are missed by UV Lyman break color selection but which are detectable in the near–infrared. If there are energetically important but highly obscured galaxies at these redshifts like those detected by SCUBA, then they are either also detectable with optical imaging data, or they are so heavily enshrouded that even NICMOS cannot easily see them. For the five sub–mm sources detected in the HDF by Hughes et al. (1998), our NICMOS images do not reveal any new counterparts previously undetected by WFPC2, nor do any of the candidate identifications have particularly unusual optical–IR colors.
5 Galaxies at
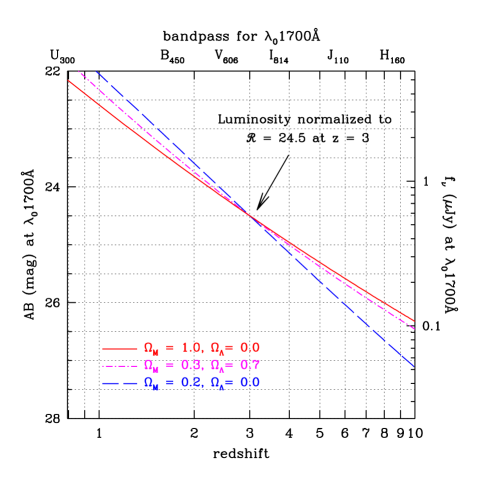
The successes of color selection techniques at make it tempting to extend the methods to higher redshifts, i.e., to search for – or –dropouts. Doing so properly requires deep near–infrared data to provide at least one color longward of the redshifted 912Å and 1216Å breaks. Indeed, galaxies at should have virtually no detectable optical flux. Lanzetta et al. (1996) and Fernández–Soto et al. (1999) identified candidate HDF galaxies from colors supplemented by infrared limits from the KPNO data; two of these have subsequently been confirmed via spectroscopy (Weymann et al. 1999; Spinrad et al. 1999). With NICMOS we can extend this to fainter limits and larger redshifts: an Lyman break galaxy (i.e., in the rest frame UV at ) should be detectable in the NICMOS images with out to for spatially flat cosmologies with , and out to for an open universe (see figure 5).
Here we test the null hypothesis that the galaxy population at is similar to that of the –dropout LBGs at , whose observed characteristics are by now reasonably well known even if their intrinsic properties, such as dust content, star formation rate, mass, etc. are the subject of continued debate. In particular, we adopt the rest frame UV luminosity function and UV spectral slope (i.e., intrinsic color) distribution for LBGs at derived in Steidel et al. (1999), and use this to predict what should be seen in color–color diagrams if the same population were present at higher redshifts. We do this via Monte Carlo simulations, including realistic errors for the HDF WFPC2+NICMOS photometry, comparing the number of high– objects that are predicted to fall in some specified color–color box to the actual number of similar objects found in the HDF catalogs.
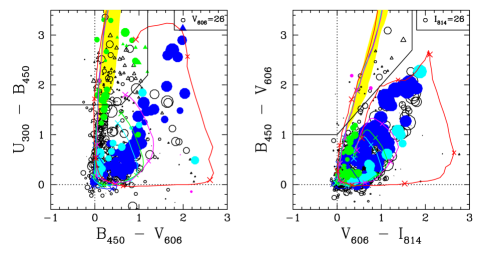
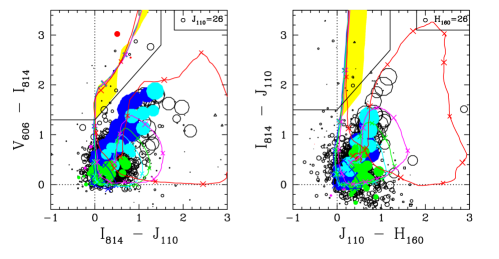
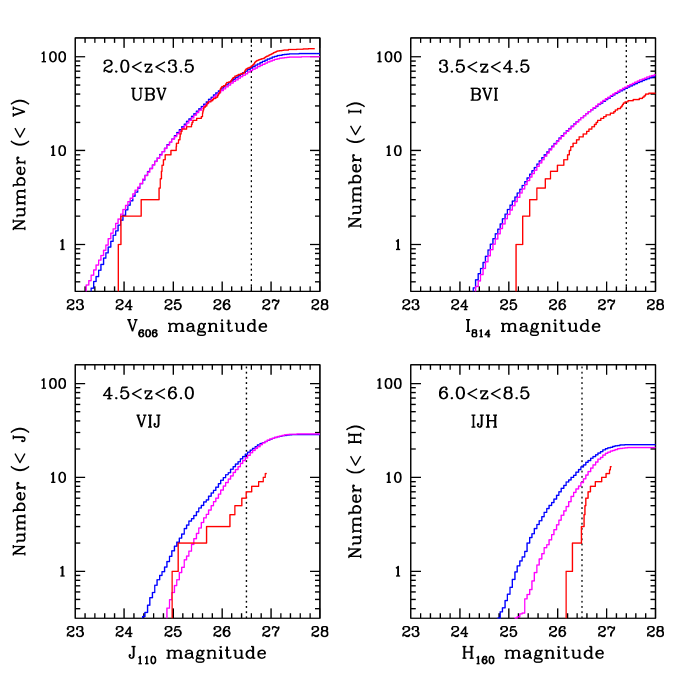
Figure 6 shows a series of 2–color diagrams for the HDF, each using combinations of three adjacent bandpasses, from (i.e., selection) through (i.e., ). In each case, I define somewhat arbitrary selection boxes based on the expected location of high redshift galaxies in color–color space (and also to avoid low redshift contaminants), then count the galaxies in those boxes and compare this to the ‘no evolution’ (NE) model predictions (figure 7).

The –dropout counts agree well with the models by construction, since the input luminosity function is partially based on HDF data. The –dropouts fall below the NE predictions. This is just the original Madau et al. (1996) result revisited: the HDF–N appears to have fewer galaxies at than at . Steidel et al. (1999), who surveyed larger solid angles in several fields, suggest that the bright end of the LF is actually compatible with that at . The HDF may just be an anomaly, indicating the importance of field–to–field fluctuations, or perhaps the faint end slope of the LF (to which the HDF number counts are quite sensitive) evolves with redshift. For the –dropouts, there are candidates with (including the two with spectroscopic confirmation), compared to a prediction of . Careful inspection of their images and SEDs suggests that they are all very plausible candidates. There are no –dropout candidates with , and only two with , one of which is clearly detected at and and thus is probably not at . The models predict 9 to 13 objects to this magnitude limit. Some of the fainter objects may be real galaxies, but on visual inspection many are rather dubious, with very low ; only a few are persuasive to a skeptical eye. At we are reaching or passing the useful depth limits of our NICMOS data for this purpose.
This analysis is in qualitative agreement with one based on photometric redshift estimates. Figure 8 plots rest frame 1700Å luminosities of galaxies vs. redshift (spectroscopic when available, photometric otherwise) for an HDF sample limited to . The photometric redshifts are generally in good agreement with the simple 2–color selection illustrated in figure 6. There are a few objects with that ‘fall in the gap’ between the – and –dropout samples. At there is only partial overlap between the –dropout and photometric redshift samples, but this is understandable since most of the candidates are very faint with low– photometry and poor photometric redshift constraints (i.e., relatively flat likelihood functions). The space density of the bright LBG candidates appears to thin at , and at there are no candidates with UV luminosities greater than the characteristic at , despite abundant volume to house them if they were present with similar space densities.333For an open universe, the higher candidates would be more luminous and the upper envelope to their UV luminosity would be nearly flat, but the space densities would be even more sparse compared to those at .
Ferguson (1998) and Lanzetta et al. (1999) have stressed the importance of cosmological surface brightness dimming when characterizing the galaxy population at . This can affect the likelihood of detecting high redshift galaxies, as well as the fluxes measured with isophotally–based photometry schemes. Lanzetta et al. show that the global rate of star formation occurring in the regions with the highest UV surface brightness rises steeply with redshift, and argue that far more UV light may be present in galaxies at fainter, unmeasured isophotal thresholds. We may partially address this by measuring fluxes and luminosities non–isophotally, e.g. by using apertures scaled by image moments or with fixed metric sizes. The photometry in figure 8 uses 12 kpc metric apertures, and thus is insensitive to surface brightness limits except as far as they affect galaxy detection in the first place: most faint object cataloging packages use isophotal detection thresholds. We have examined this by taking WFPC2 images of LBGs, artificially shifting them to higher redshifts, and re–inserting them into the NICMOS data to assess their detectability. Galaxies like the LBGs at should be detectable to at least at the depth of our GO NICMOS images, and more easily in the HDF–South NICMOS field or the HDF–North GTO NICMOS image, each of which goes magnitude deeper than the data set discussed here. But a general census at such redshifts might indeed be woefully incomplete.
Overall, the HDF data disfavor the null hypothesis that galaxies like the bright LBGs at are present at with similar space densities. The higher redshift galaxies are apparently either fainter, more rare, have lower surface brightness, or some combination thereof. At any rate, they are certainly more difficult to detect and study, at least in abundance, even with NICMOS.
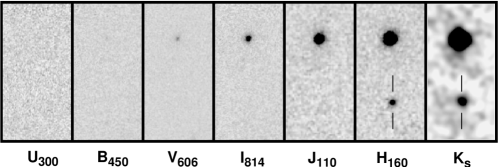
6 An object at ?
Although the few –dropout candidates in the HDF are very faint, paradoxically there is one comparatively bright ‘–dropout’ object, shown in figure 9. Lanzetta et al. (1998) identified five possible sources in the KPNO images of the HDF which were invisible in the WFPC2 data. Of these, four are undetected by NICMOS. One, however, which we call HDFN–JD1, has a robust 1.6m detection (), but is at best only marginally () detected at 1.1m and shorter wavelengths. This optical ‘detection,’ if real, would be important, as it would probably exclude the most exotic hypothesis for this object, i.e., that it is a galaxy or QSO at . It will be difficult, however, to obtain much deeper optical data than the existing HDF WFPC2 images to provide a stricter limit. The red color suggests under the high redshift hypothesis, with the Ly forest partially suppressing the flux. We obtained an –band spectrogram of HDFN–JD1 with CRSP at the KPNO 4m, and to our surprise detected a moderately convincing emission line at 1.65m that could plausibly agree with Ly at . The line did not reproduce, however, in a subsequent reobservation at higher dispersion (see Dickinson et al. 2000 for the spectra and further discussion).
If this is not a Lyman break object then it may be either heavily reddened and at arbitrary redshift (but most likely , given the colors), or possibly a maximally old elliptical galaxy at (see §2). If it is really at , then it is either a galaxy whose unobscured star formation rate (computed from the UV luminosity) is several hundred yr-1, or an AGN, perhaps one of the hypothesized population responsible for re–ionizing the universe. If so, however, such objects are rare at , with a space density several hundred times lower than that of present–day galaxies, and it is unlikely that most of today’s galaxies began their life in such a way.
Table 1 compares the UV luminosities of some confirmed and candidate galaxies at , compared to that of an Lyman break galaxy at . In some cases infrared data needed to measure fluxes at rest frame 1700Å are not available, and estimates based on published photometric or spectroscopic fluxes redward of Lyman have been used instead.444(1700Å) estimates for RD1 are derived in part from a –band measurement by Armus et al. (1998). For HDF 3–951 and 4-473 we use our own NICMOS photometry. ‘Raw’ star formation rates are computed from the UV luminosities assuming a Salpeter IMF and no dust obscuration.
Assumes , , , and that SFR = year-1 produces Å erg s-1 Hz-1. Magnitudes are on the AB scale. name z ‘raw’ SFR reference (UV at Å) ( yr-1) LBG 3.04 24.5 -21.1 12.8 Steidel et al. 1999 CDFa–G1 4.82 23.6 -22.8 4.7 60 Steidel et al. 1999 RD1 5.34 25.5: -21.0: 0.9: 12: Dey et al. 1998 HDF 3-951 5.33 25.0 -21.5 1.5 19.6 Spinrad et al. 1998 HDF 4-473 5.60 26.0 -20.6 0.66 8.5 Weymann et al. 1998 HCM1 5.74 25.5: -21.1: 1.1: 13.5 Hu, Cowie & McMahon 1999 A 6.68 23.9: -23: 5.8: 74: Chen et al. 1999 HDFN–JD1 12.5 ?? 23.9 -23.9 13.7 175 Dickinson et al. 2000
CDFa–G1 at is the most luminous Lyman break galaxy yet identified (among both – and –dropouts) in our large, ground–based survey. The spectroscopically verified galaxies have luminosities that are mostly fairly typical of LBGs, ranging from 0.66 to 1.5. The object from Hu, Cowie & McMahon (1999) has been described as ‘extremely luminous,’ but is actually quite typical for to 4 LBGs, and somewhat fainter than HDF 3–951 at . Chen et al. (1999) have identified a candidate galaxy at from STIS slitless spectra. The available photometry is limited, but based on the spectral continuum flux density estimate, this object appears to be significantly more luminous than other known LBGs at , or than any candidates from the HDF/NICMOS sample. This is a remarkable result, if true, since the solid angle covered by the STIS field is arcmin2. On the other hand, if the –dropout object HDFN–JD1 were really at , it would be more luminous still, nearly 3 brighter than CDFa–G1 at , with a ‘raw’ UV SFR = 175 yr-1.
7 Discussion
Overall, the HDF/NICMOS data demonstrate both the promise and the challenges which lie ahead for finding and studying the ‘first’ galaxies. The rest–frame optical view of Lyman break galaxies presented in §§2 and 3 strongly suggests that the galaxy population at had not yet achieved maturity. The giant, Hubble sequence spirals and ellipticals that dominate the high–mass end of the galaxy population today are not seen at . In a sample of HDF galaxies selected in the near–infrared, nearly all galaxies with spectroscopic or plausible photometric redshifts are evidently forming stars quite rapidly and can also be identified via their emitted–frame UV light. The evidence from SCUBA shows that there are occasional ‘monsters’ whose obscured star formation may be quite important to the global emissive energy budget from galaxies. The identification of these objects, relatively rare by number, remains an important dilemma.
Broad band color selection has been the most successful means for identifying high redshift galaxies, but we seem to be pushing the limits of what can be accomplished at with present–day capabilities. The NICMOS HDF images are the deepest near–IR data now available, and they do include plausible candidates for galaxies at , but they are relatively few, and most are quite probably too faint for spectroscopic confirmation. We probably should not expect to find galaxies much brighter than these candidates unless some of the ‘first’ galaxies were significantly more luminous than the boring old ‘later’ galaxies that we have now surveyed extensively at . This is not impossible of course: the Chen et al. object and HDFN–JD1 are both possible (but unconfirmed) candidates more luminous than any normal Lyman break galaxy at . Perhaps indeed there are very luminous, relatively unobscured proto–galaxies out there waiting to be found, a hope that was once quite widespread, but which seems to have gradually faded in the modern era of 25th magnitude LBGs and optically invisible SCUBA sources. Perhaps it will still make a comeback…
These few rather speculative candidates aside, the evidence from the HDF alone would suggest that the population of UV–bright LBGs may be thinning out at , at least for objects comparable to those at the bright end of the luminosity function. It should be remembered, however, that this was also the conclusion reached by Madau et al. (1996) at , a result that has since been challenged by larger surveys with extensive spectroscopy. It is undoubtedly dangerous to draw conclusions too strongly from one 5 arcmin2 field. However, extending this work to larger areas and more sightlines will be an expensive effort. Surface brightness dimming and limited solid angle coverage may limit our ability to see much more with NICMOS (assuming that it is successfully revived in 2001), and ground–based near–IR imaging may never go deep enough to detect any but the most luminous objects at . Wider fields imaged with the HST WFC3 near–IR channel (coming circa 2004) may offer the best survey opportunity until NGST, but a substantial investment of observing time will be needed to survey adequate solid angles to sufficient depth.
Alternatively, we may turn to other observing strategies, e.g., by taking advantage of gravitational lensing from foreground galaxy clusters to boost very distant objects to detectable magnitudes. Narrow band and blind multislit emission line searches are being carried out through airglow windows (e.g., at Å, corresponding to ; cf. Crampton & Lilly 1999; Stockton 1999). Or perhaps concerted efforts to identify SCUBA sources will indeed turn up objects at , where the advantage of the negative sub–mm –correction is enormous.
These data are offering a first glimpse into the so–called ‘dark ages,’ and giving hope that there may be luminous things there to find and study. In some sense, we may not know that we’ve found the first galaxies until we can find no more beyond them. Holding to that standard will ensure that a more challenging (and hence, more rewarding) threshold of proof always lies ahead.
Acknowledgements.
I thank my HDF/NICMOS collaborators for their contributions and for permission to show results in advance of publication, particularly Casey Papovich, Tamas Budavári, Jean–Marc Deltorn, Chris Hanley and Harry Ferguson. I also thank Chuck Steidel, Max Pettini, Mauro Giavalisco, Kurt Adelberger, and Alice Shapely for their long–standing and highly valued collaboration. I am grateful to the Royal Society for inviting me to this meeting and for supporting my travel and accommodations, and to the editors of the proceedings for their patience. This work was supported by NASA grant GO-07817.01-96A.References
- [1]
- [2] Armus, L., Matthews, K., Neugebauer, G., & Soifer, B.T., 1998, ApJ, 506, L89
- [3]
- [4] Barger, A.J., Cowie, L.L., Trentham, N., Fulton, E., Hu, E.M., Songaila, A., & Hall, D. 1999, AJ, 117, 102
- [5]
- [6] Bruzual, G., & Charlot, S. 1996, personal communication
- [7]
- [8] Budavári, T., Szalay, A.S., Connolly, A.J., Csabai, I., & Dickinson, M. 2000, AJ, submitted
- [9]
- [10] Bunker, A.J., 1999, in Photometric Redshifts and the Detection of High-Redshift Galaxies, eds. R. Weymann, L. Storrie–Lombardi, M. Sawicki & R. Brunner, (San Francisco: ASP), 317
- [11]
- [12] Calzetti, D., 1997, in The Ultraviolet Universe at Low and High Redshift, eds. W.H. Waller et al. , (New York: AIP), 403
- [13]
- [14] Chen, H.-W., Lanzetta, K.M., & Pascarelle, S., 1999, Nature, 398, 586
- [15]
- [16] Crampton, D., & Lilly, S., 1999, in Photometric Redshifts and the Detection of High-Redshift Galaxies, eds. R. Weymann, L. Storrie–Lombardi, M. Sawicki & R. Brunner, (San Francisco: ASP), 229
- [17]
- [18] Dey, A., Spinrad, H., Stern, D., Graham, J.R., & Chaffee, F.H., 1998, ApJ, 498, L93
- [19]
- [20] Dickinson, M. 1998, in The Hubble Deep Field, eds. M. Livio, S. M. Fall & P. Madau (Cambridge: Cambridge Univ. Press), 219
- [21]
- [22] Dickinson, M., 2000, in Building Galaxies: From the Primordial Universe to the Present, Proceedings of the XIXth Moriond Astrophysics Meeting, eds. F. Hammer, T.X. Thuan, V. Cayatte, B. Guiderdoni, & J. Tranh Than Van, Ed. Frontières, p. 257, in press
- [23]
- [24] Dickinson, M., et al. 2000, ApJ, 531, 624.
- [25]
- [26] Ferguson, H.C. 1998, in The Hubble Deep Field, eds. M. Livio, S. M. Fall & P. Madau (Cambridge: Cambridge Univ. Press), 181
- [27]
- [28] Fernández–Soto, A., Lanzetta, K.M., & Yahil, A. 1999, ApJ, 513, 34
- [29]
- [30] Giavalisco, M., Steidel, C.C., & Macchetto, D. 1996, ApJ, 470, 189
- [31]
- [32] Hogg, D.W., Neugebauer, G., Armus, L., Matthews, K., Pahre, M.A., Soifer, B.T., & Weinberger, A.J. 1997, AJ, 113, 2338
- [33]
- [34] Hu, E.M., McMahon, R.G., Cowie, L.L., 1999, ApJ, 522, L9
- [35]
- [36] Hughes, D., et al. 1998, Nature, 394, 241
- [37]
- [38] Kinney, A.L., Calzetti, D., Bohlin, R.C., McQuade, K., Storchi–Bergmann, T., & Schmitt, H.R. 1996, ApJ, 467, 38
- [39]
- [40] Lanzetta, K.M., Yahil, A., & Fernández–Soto, A. 1996, Nature, 381, 759
- [41]
- [42] Lanzetta, K.M., Yahil, A., & Fernández–Soto, A. 1998, AJ, 116, 1066
- [43]
- [44] Lanzetta, K.M., Chen, H.-W., Fernández–Soto, A., Pascarelle, S., Puetter, R., Yahata, N., & Yahil, A., 1999, in Photometric Redshifts and the Detection of High-Redshift Galaxies, eds. R. Weymann, L. Storrie–Lombardi, M. Sawicki & R. Brunner, (San Francisco: ASP), 223.
- [45]
- [46] Lilly, S., et al. 1998, ApJ, 500, 75
- [47]
- [48] Lowenthal, J.D., et al. 1997, ApJ, 481, 673
- [49]
- [50] Madau, P., Ferguson H. C. Dickinson, M., Giavalisco, M., Steidel, C.C., Fruchter, A.S. 1996, MNRAS, 283, 1388
- [51]
- [52] Meurer, G.R., Heckman, T.M., Lehnert, M.D., Leitherer, C., & Lowenthal, J., 1997, AJ, 114, 54
- [53]
- [54] Meurer, G.R., Heckman, T.M., & Calzetti, D., 1999, ApJ, 521, 64
- [55]
- [56] Pettini, M., Kellogg, M., Steidel, C.C., Dickinson, M., Adelberger, K.L., Giavalisco, M., 1998, ApJ, 508, 539.
- [57]
- [58] Richards, E.A., Kellerman, K.I., Fomalont, E.B., Windhorst, R.A., & Partridge, R.B. 1998, AJ, 116, 1039
- [59]
- [60] Sawicki, M., & Yee, H.K.C., 1998, AJ, 115, 1329
- [61]
- [62] Simard, L., et al. , 1999, ApJ. 519, 563
- [63]
- [64] Spinrad, H., Stern, D., Bunker, A., Dey, A., Lanzetta, K.M., Yahil, A., Pascarelle, S., & Fernández–Soto, A. 1998, AJ, 116, 2617
- [65]
- [66] Steidel, C.C., Giavalisco, M., Pettini, M., Dickinson, M., & Adelberger, K.L. 1996, ApJ, 462, L17
- [67]
- [68] Steidel, C.C., Adelberger, K.L., Giavalisco, M., Dickinson, M., & Pettini, M. 1999, ApJ, 519, 1
- [69]
- [70] Stockton, A., 1999, in Toward a New Millenium in Galaxy Morphology, eds. D.L. Block, I. Puerari, A. Stockton, and D. Ferreira, (Dordrecht: Kluwer), in press (astro–ph/9911342)
- [71]
- [72] Thompson, R.I., Storrie–Lombardi, L.J., Weymann, R.J., Rieke, M., Schneider, G., Stobie, E., & Lytle, D. 1999b, AJ, 117, 17
- [73]
- [74] Weymann, R.J., Stern, D., Bunker, A., Spinrad, H., Chaffee, F.H., Thompson, R.I., & Storrie–Lombardi, L.J. 1998, ApJ, 505, L95
- [75]