Weak Lensing by Large-Scale Structure: A Dark Matter Halo Approach
Abstract
Weak gravitational lensing observations probe the spectrum and evolution of density fluctuations and the cosmological parameters which govern them but are currently limited to small fields and subject to selection biases. We show how the expected signal from large-scale structure arises from the contributions from and correlations between individual halos. We determine the convergence power spectrum as a function of the maximum halo mass and so provide the means to interpret results from surveys that lack high mass halos either through selection criteria or small fields. Since shot noise from rare massive halos is mainly responsible for the sample variance below 10′, our method should aid our ability to extract cosmological information from small fields.
Subject headings:
cosmology: theory — large scale structure of universe — gravitational lensing1. Introduction
Weak gravitational lensing of faint galaxies probes the distribution of matter along the line of sight. Lensing by large-scale structure (LSS) induces correlation in the galaxy ellipticities at the percent level (e.g., Miralda-Escudé 1991; Blandford et al 1991; Kaiser 1992). Though challenging to measure, these correlations provide important cosmological information that is complementary to that supplied by the cosmic microwave background and potentially as precise (e.g., Jain & Seljak 1997; Bernardeau et al 1997; Kaiser 1998; Schneider et al 1998; Hu & Tegmark 1999; Coooray 1999; Van Waerbeke et al 1999; see Bartelmann & Schneider 2000 for a recent review). Indeed several recent studies have provided the first clear evidence for weak lensing in so-called blank fields (e.g., Van Waerbeke et al 2000; Bacon et al 2000; Wittman et al 2000).
Weak lensing surveys are currently limited to small fields which may not be representative of the universe as a whole, owing to sample variance. In particular, rare massive objects can contribute strongly to the mean power in the shear or convergence but not be present in the observed fields. The problem is compounded if one chooses blank fields subject to the condition that they do not contain known clusters of galaxies. Our objective in this Letter is to quantify these effects and to understand what fraction of the total convergence power spectrum should arise from lensing by individual massive clusters as a function of scale.
In the context of standard cold dark matter (CDM) models for structure formation, the dark matter halos that are responsible for lensing have properties that have been intensely studied by numerical simulations. In particular, analytic scalings and fits now exist for the abundance, profile, and correlations of halos of a given mass. We show how the convergence power spectrum predicted in these models can be constructed from these halo properties. The critical ingredients are: the Press-Schechter formalism (PS; Press & Schechter 1974) for the mass function; the NFW profile of Navarro et al (1996), and the halo bias model of Mo & White (1996). Following Seljak (2000), we modify halo profile parameters, specifically concentration, so that halos account for the full non-linear dark matter power spectrum and generalize his treatment to be applicable through all redshifts relevant to current galaxy ellipticity measurements of LSS lensing. This calculational method allows us to determine the contributions to the convergence power spectrum of halos of a given mass.
Throughout this paper, we will take CDM as our fiducial cosmology with parameters for the CDM density, for the baryon density, for the cosmological constant, for the dimensionless Hubble constant and a scale invariant spectrum of primordial fluctuations, normalized to galaxy cluster abundances ( see Viana & Liddle 1999) and consistent with COBE (Bunn & White 1997). For the linear power spectrum, we take the fitting formula for the transfer function given in Eisenstein & Hu (1999).
2. Lensing by Halos
2.1. Halo Profile
We model dark matter halos as NFW profiles with a density distribution
| (1) |
The density profile can be integrated and related to the total dark matter mass of the halo within
| (2) |
where the concentration, , is defined as . Choosing as the virial radius of the halo, spherical collapse tells us that , where is the overdensity of collapse (see e.g. Henry 2000) and is the background matter density today. We use comoving coordinates throughout. By equating these two expressions, one can eliminate and describe the halo by its mass and concentration . Finally, we can determine a relation between and such that halo distribution produces the same power as the non-linear dark matter power spectrum, as outlined in Seljak (2000).
2.2. Convergence Power Spectrum
For lensing convergence, we need the projected surface mass density, which is the line-of-sight integral of the profile
| (3) |
where is the line-of-sight distance and is the perpendicular distance. As in equation (2), the cut off here at the virial radius reflects the fact that we only account for mass contributions out to (see Bartelmann 1996 for an analytical description when ). The convergence on the sky is related to surface mass density through
| (4) |
where the extra factor of from the familiar expression comes from the use of comoving coordinates to define densities and distances, e.g. , and are the comoving angular diameter distances from the observer to lens, observer to source, and the lens to source, respectively.
The total convergence power spectrum due to halos, , can be split into two parts: a Poisson term, , and a term involving correlations between individual halos, . This split was introduced by Cole & Kaiser (1988) to examine the power spectrum of the Sunyaev-Zel’dovich (SZ; Sunyaev & Zel’dovich 1980) effect due to galaxy clusters (see Komatsu & Kitayama 1999 and references therein for more recent applications).
The Poisson term due to individual halo contributions can be written as,
| (5) |
where is the redshift of background sources, is the comoving differential volume, and
| (6) |
is the 2D Fourier transform of the halo profile. The halo mass distribution as a function of redshift [] is determined through the PS formalism.
Here, we have assumed that all sources are at a single redshift; for a distribution of sources one integrates over the normalized background source redshift distribution. The minimum, , and maximum, , masses can be varied to study the effects of rare and excluded high mass halos.
The clustering term arises from correlations between halos of different masses. By assuming that the linear matter density power spectrum, , is related to the power spectrum of halos over the whole mass range via a redshift-dependent linear bias term, , we can write the correlation term as
| (7) | |||||
Here we have utilized the Limber approximation (Limber 1954) by setting . Mo & White (1996) find that the halo bias can be described by , where is the peak-height threshold, is the rms fluctuation within a top-hat filter at the virial radius corresponding to mass , and is the threshold overdensity of spherical collapse (see Henry 2000 for useful fitting functions).
3. Results
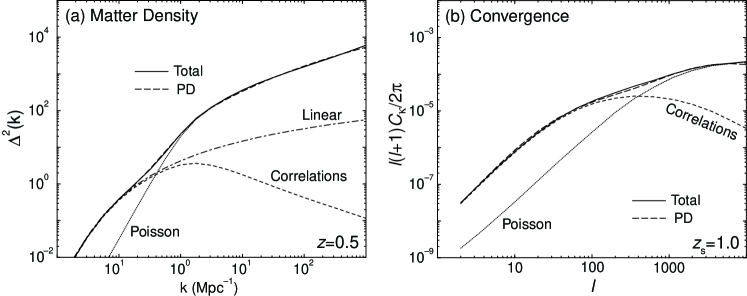
Following the approach given in Seljak (2000), we first test the halo prescription against the full non-linear density power spectrum found in simulations and fit by Peacock & Dodds (PD, 1996). In Fig. 1a, as an example, we show the comparison at . A good match between the two power spectra was achieved by slightly modifying the concentration relation of Seljak (2000) as
| (8) |
Here, is the non-linear mass scale at which , while and can be considered as adjustable parameters. The dark matter power spectrum is well reproduced, to within 20% for Mpc-1, out to a redshift of 1 with the parameters , and , which agree with the values given by Seljak (2000) for the NFW profile at . The two power spectra differ increasingly with scale at Mpc-1, but the Peacock and Dodds (1996) power spectrum is not reliable there due to the resolution limit of the simulations from which the non-linear power spectrum was derived. Note that the above relation is only valid for the cosmology used here and for the NFW profile; moreover, it should not necessarily give the true mean density profile of halos, since other effects not considered in our halo prescription, such as halo substructure, would affect the relation between the dark matter power spectrum and the spatial distribution and mean density profiles of halos. A detailed study of as generally applied to all cosmologies, profile shapes and power spectra is currently in progress (Seljak, private communication).
In general, the behavior of dark matter power spectrum due to halos can be understood in the following way. The linear portion of the dark matter power spectrum, Mpc-1, results from the correlation between individual dark matter halos and reflects the bias prescription. The fitting formulae of Mo & White (1996) adequately describes this regime for all redshifts. The mid portion of the power spectrum, around Mpc-1 corresponds to the non-linear scale , where the Poisson and correlated term contribute comparably. At higher ’s, the power arises mainly from the contributions of individual halos (see Seljak 2000 for a discussion of the detailed properties of the density and galaxy power spectra due to halos).
In Fig. 1b, we show the same comparison for the convergence power spectrum. The LSS power spectrum was calculated following Hu & Tegmark (1999) using the Peacock & Dodds (1996) power spectrum for the underlying mass distribution and using the same Limber approximation as the correlation calculation presented here. The lensing power spectrum due to halos has the same behavior as the dark matter power spectrum. At large angles (), the correlations between halos dominate. The transition from linear to non-linear is at where halos of mass similar to contribute. The Poisson contributions start dominating at .
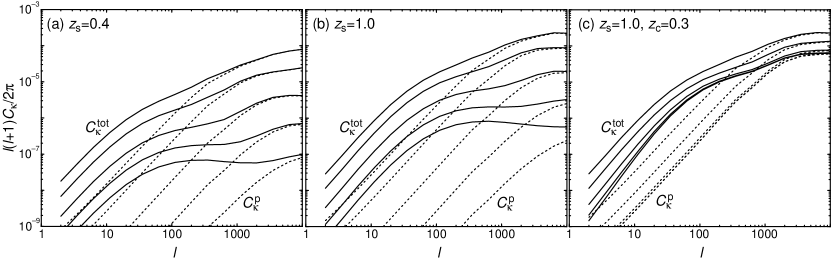
In order to establish the extent to which massive halos contribute, we varied the maximum mass of halos, , in the convergence calculation. The results are shown in Fig. 2. We use a background source redshift of 1 and 0.4, corresponding to deep lensing surveys and to a shallower survey such as the ongoing Sloan Digital Sky Survey111http://www.sdss.org. In Fig. 2a,b we exclude masses above a certain threshold at all redshifts and in c only for halos below redshift , reflecting the fact that current observations of galaxy clusters are likely to be complete only out to such a low redshift. Assuming the latter, we find that a significant contribution comes from massive clusters at low redshifts (see Figs. 2b & c). Ignoring such masses, say above 1014 M☉ can lead to a convergence power spectrum which is a factor of 2 lower than the total. Note that such a high mass cut off affects the Poisson contribution of halos more than the correlated contributions and can bias the shape not just the amplitude of the power spectrum.
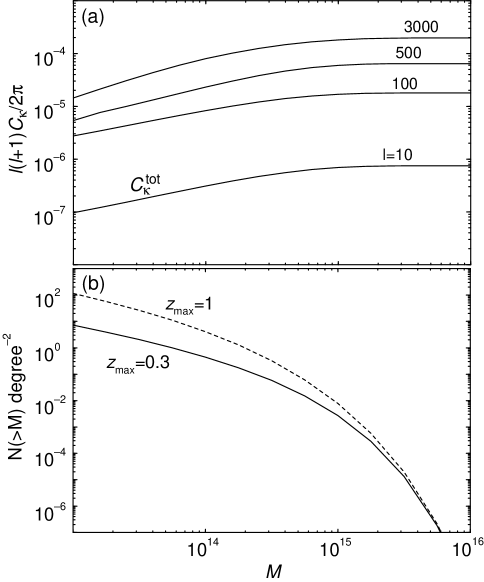
In Fig. 3a, we show the dependence of , for several values. If halos are well represented in a survey, then the power spectrum will track the LSS convergence power spectrum for all values of interest. The surface number density of halos determines how large a survey should be to possess a fair sample of halos of a given mass. We show this in Fig. 3b as predicted by PS formalism for our fiducial cosmological model for halos out to ( and ). Since the surface number density of halos out to a redshift of 0.3 and 1.0 is 0.03 and 0.08 degree-2 respectively, a survey of order 30 degree2 should be sufficient to contain a fair sample of the universe for recovery of the full LSS convergence power spectrum.
One caveat is that mass cuts may affect the higher moments of the convergence differently so that a fair sample for a quantity such as skewness will require a different survey strategy. From numerical simulations (White & Hu 1999), we know that shows substantial sample variance, implying that it may be dominated by rare massive halos. When calculated with hyper-extended perturbation theory (HEPT, see Hui 1999) but using the halo power spectrum instead of non-linear density power spectrum, the skewness decreased by a factor of 2.5 to 3 with a mass cut off at M☉. Since it is unclear to what extent HEPT ansatz remains valid for the halo description, these results should be taken as provisional and will be the subject of future study.
While upcoming wide-field weak lensing surveys, such as the MEGACAM experiment at Canada-France-Hawaii Telescope (Boulade et al 1998), and the proposed wide field survey by Tyson et al. (2000, private communication) will cover areas up to 30 degree2 or more, the surveys that have been so far published, e.g., Wittman et al (2000), only cover at most 4 degree2 in areas without known clusters. The observed convergence in these fields should be biased low compared with the mean and vary widely from field to field due to sample variance from the Poisson contribution of the largest mass halos in the fields, which are mainly responsible for the sample variance below (see White & Hu 1999).
Our results can also be used proactively. If properties of the mass distribution such as the maximum mass halo in the observed lensing fields are known, say through prior optical, X-ray, SZ or even internally in the lensing observations (see Kruse & Schneider 1999), one can make a fair comparison of the observations to theoretical model predictions with a mass cut off in our formalism. Even for larger surveys, the identification and extraction of large halo contributions can be beneficial: most of the sample variance in the fields will be due to rare massive halos. A reduction in the sample variance increases the precision with which the power spectrum can be measured and hence the cosmological parameters upon which it depends.
References
- (1) Bacon, D., Refregier, A., Ellis R. 2000, MNRAS submitted, astro-ph/0003008
- (2) Bartelmann, M. 1996, A&A, 313, 697
- (3) Bartelmann, M., Schnerider, P. 2000, Physics Reports in press, astro-ph/9912508
- (4) Bernardeau, F., van Waerbeke, L., Mellier, Y. 1997, A&A, 322, 1
- (5) Blandford, R. D., Saust, A. B., Brainerd, T. G., Villumsen, J. V. 1991, MNRAS 251, 60
- (6) Boulade, O., Vigroux, L., Charlot, X. et al. 1998, SPIE, 3355.
- (7) Bunn, E. F., White, M. 1997, ApJ, 480, 6
- (8) Cole, S., Kaiser, N. 1988, MNRAS, 233, 637
- (9) Cooray, A. R. 1999, A&A, 348, 673
- (10) Eisenstein, D.J. & Hu, W. 1999, ApJ, 511, 5
- (11) Henry, J. P. 2000, ApJ in press, astro-ph/0002365
- (12) Hu W., Tegmark M. 1999, ApJ 514, L65
- (13) Hui, L. 1999, ApJ, 519, L9
- (14) Jain B., Seljak U. 1997, ApJ 484, 560
- (15) Kaiser, N. 1992, ApJ, 388, 286
- (16) Kaiser, N. 1998, ApJ, 498, 26
- (17) Komatsu, E. Kitayama, T., 1999, ApJ, 526, L1
- (18) Kruse, G., Schneider, P. 1999, MNRAS, 302, 821
- (19) Limber, D. 1954, ApJ, 119, 655
- (20) Miralda-Escudé J. 1991, ApJ 380, 1
- (21) Mo, H. J., White, S. D. M. 1996, MNRAS, 282, 347
- (22) Navarro, J., Frenk, C., White, S. D. M., 1996, ApJ, 462, 563
- (23) Peacock, J.A., Dodds, S.J. 1996, MNRAS, 280, L19
- (24) Press, W. H., Schechter, P. 1974, ApJ, 187, 425
- (25) Schneider P., van Waerbeke, L., Jain, B., Guido, K. 1998, MNRAS, 296, 873
- (26) Seljak, U. 2000, PRD submitted, astro-ph/0001493
- (27) Sunyaev, R.A., Zel’dovich, Ya. B. 1980, MNRAS, 190, 413
- (28) Van Waerbeke, L., Bernardeau, F., Mellier, Y. 1999, A&A, 342, 15
- (29) Van Waerbeke, L., Mellier, Y., Erben, T. et al. 2000, A&A submitted, astro-ph/0002500
- (30) Viana, P. T. P., Liddle, A. R. 1999, MNRAS, 303, 535
- (31) White, M., Hu, W. 1999, ApJ, in press, astro-ph/9909165
- (32) Wittman, D. M., Tyson, J. A., Kirkman, D., Dell’Antonio, I., Bernstein, G. 2000, Nature submitted, astro-ph/0003014