The 2dF QSO Redshift Survey.
Abstract
With 6000 QSO redshifts, the 2dF QSO redshift survey is already the biggest complete QSO survey. The aim for the survey is to have 25000 QSO redshifts, providing an order of magnitude increase in QSO clustering statistics. We first describe the observational parameters of the 2dF QSO survey. We then describe several highlights of the survey so far, including new estimates of the QSO luminosity function and its evolution. We also review the current status of QSO clustering analyses from the 2dF data. Finally, we discuss how the complete QSO survey will be able to constrain the value of by measuring the evolution of QSO clustering, place limits on the cosmological constant via a direct geometrical test and determine the form of the fluctuation power-spectrum out to the 1000h-1Mpc scales only previously probed by COBE.
University of Durham, South Road, Durham, DH1 3LE, UK.
AAO, PO Box 296, Epping, NSW 2121, Australia.
Imperial College, Prince Consort Road, London SW7 1BH, UK
University of Oxford, 1 Keble Road, Oxford, OX1, UK.
MSSSO, Private Bag, Weston Creek, ACT 2611, Australia
1. Introduction
The observational aim of the 2dF QSO Survey is to use the new AAT 2dF fibre-optic coupler to obtain redshifts for 25000 B20.85, 0z3 QSO’s in two deg2 strips of sky in the RA ranges 21h50 - 03h15 at = -30∘ and 09h50 - 14h50 at = +00∘. The 2dF instrument allows spectra for up to 400 QSO candidates to be obtained simultaneously. The input catalogue is based on APM UBR magnitudes for stars to B=20.85 on 30 UKST fields. The final QSO catalogue will be an order of magnitude bigger than previous complete QSO surveys. The prime scientific aims of the 2dF QSO survey are:
-
1.
To determine the QSO clustering power spectrum, P(k), in the range of spatial scales, .
-
2.
To measure from geometric distortions in clustering.
-
3.
To trace the evolution of QSO clustering in the range, 0z3, to obtain new limits on and QSO bias.
Other aims include determining the evolution of the QSO LF evolution to z=3, cross-correlating the QSO’s with 2dF Galaxy Survey groups to measure via gravitational lensing (cf. Croom & Shanks, 1999a) and constraining by finding the sky density of close (6-20′′) lensed QSO pairs.
Previous QSO clustering results have generally been based on the following complete QSO surveys - the Durham/AAT survey of Boyle et al (1988) comprising 392 B21 QSO’s, the CFHT survey of Crampton et al (1989) with 215 B20.5 QSO’s, the ESO survey of Zitelli et al (1992) with 28 B22 QSO’s, the LBQS survey of Hewett et al (1995) with 1053 B18.8 QSO’s and the ESO survey of LaFranca et al (1998) with 300 B20.5 QSO’s. These have produced results on QSO clustering at small (r Mpc) scales which are consistent with an r-1.8 power-law with amplitude Mpc which shows no evolution in comoving coordinates (Shanks et al 1987, Andreani & Cristiani, 1992, Shanks & Boyle, 1994, Georgantopoulos & Shanks, 1994, Croom & Shanks, 1996). At larger scales (10Mpc), no clustering has previously been detected in .
2. 2dF QSO Redshift Survey Status and Current Results.
We now have redshifts for 6000 QSO’s where 5600 QSO’s have been observed using 2dF itself. A further 400 QSO’s selected from the input catalogue have been observed on different telescopes for associated projects. Observations have included bright 1718.25 QSO’s using UK Schmidt Telescope FLAIR fibre coupler, radio-loud QSO’s identified in the NRAO VLA Sky Survey (NVSS) and observed at Keck and finally 30 QSO’s in close pairs () from the ANU 2.3-m telescope. This makes the 2dF survey already the biggest, complete QSO survey by a factor of 6.

From these observations, we know that 53.5% of candidates are QSO’s which means there will be 26000 QSO’s in final survey. The QSO number count, n(B), has been found to be in good agreement with previous surveys. The QSO redshift distribution, n(z), extends to z3 because of our multi-colour UBR selection. In Fig. 1 we show the current Northern and Southern redshift cone plots from the 2dF survey. The rectangles shows the sky distribution of the fields that have already been observed.
We have detected 8 close () QSO pairs. Only one is a candidate gravitational lens; the separation is (see Fig. 6 of Croom et al., 1999).
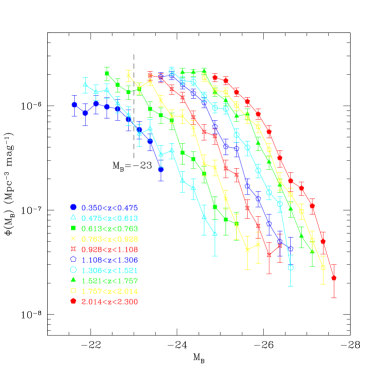
The new 2dF results for the QSO Luminosity Function continue to be consistent with Pure Luminosity Evolution models throughout the range 0.35z2.3 (Boyle et al.,1988,1991,1999a). The luminosity function based on the current 6000 QSOs of the 2dF survey combined with 1000 LBQS QSOs are shown in Fig. 2. The large sample size makes it possible to define the QSO Luminosity Function in much smaller redshift bins than used previously and the accuracy of pure luminosity evolution as a description of QSO evolution is clear. Indeed, this accuracy is so high that it has prompted a new investigation of pure-luminosity evolution as a physical, as well as a phenomenological, model for QSO evolution. (Done & Shanks, 1999, in prep.)
The most interesting individual QSO that has been discovered from the 2dF QSO survey is UN J1025-0040, a unique, post-starburst radio QSO at z=0.634, identified in the 2dF-NVSS catalogue and followed up spectroscopically at the Keck (Brotherton et al., 1999). As well as broad emission lines, the spectrum also shows strong Balmer absorption lines indicative of a post-starburst galaxy. The starburst component of the spectrum at MB=-24.7 dominates the AGN continuum spectrum by 2mag. This 2dF-NVSS collaboration has previously also uncovered a new class of radio-loud BAL QSO’s (Brotherton et al., 1998) and clearly has great potential for further exciting discoveries.
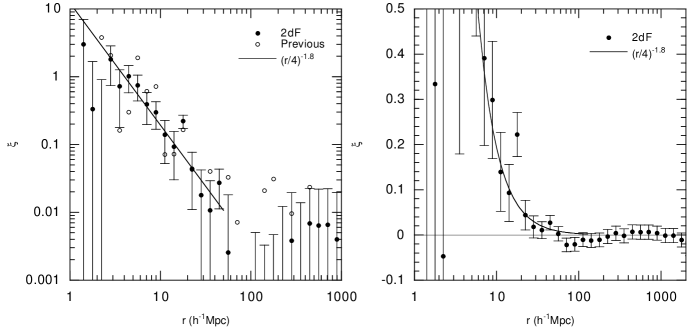
Finally, we present a preliminary 2dF QSO correlation function from our most complete subset of 4115 QSO’s. We have taken into account the current incompleteness of the 2dF survey as best we can; however, this process is complicated by the fact that many observed areas still have overlapping 2dF ‘tiles’ as yet unobserved. We show the preliminary correlation function in Fig. 3(a) as a log-log plot and in Fig. 3(b) as a log-linear plot. As can be seen the correlation function is consistent with being a -1.8 power-law with Mpc and in good agreement with previous results (eg Croom and Shanks, 1996). The QSO correlation function thus appears to be remarkably similar to the correlation function for local, optically selected galaxies and continues to show no evolution in comoving coordinates. This behaviour is consistent with evolution due to gravitational clustering either in a low model or in a biased, model. The correlation function is consistently positive out to about 20h-1Mpc at 3 and out to about 50h-1Mpc at 1, thus giving a hint of power extending to larger scales. At Mpc the errors in are now as low as 0.016. There is also a suggestion of anti-correlation at r100h-1Mpc but still only at 1.5 significance. At all scales in the range 100r1000h-1Mpc the correlation function is within 1 of zero.
3. Future Results.
We have used mock catalogues drawn from simulations using the Zeldovich approximation to demonstrate the accuracy of P(k) estimates at large scales that will be obtainable from the full survey (Croom et al., in prep.). The results from this simulation show that our estimates of the power spectrum can recover the input spectrum up to scales of several hundreds of Mpc (k0.01hMpc-1) where the power spectrum is expected to turn over to its primordial form (see Boyle et al., 1999b).
We are now using the Hubble Volume N-body simulation from the Virgo Consortium with of order 109 particles to produce mock QSO survey catalogues. We have ‘light cone’ output for a model with =0.7, =0.3 and =1.0 to test the potential of the geometric test of Alcock & Paczynski (1979) for directly in a biased CDM model (Hoyle et al., 1999 in prep.). We shall be using these simulations to see how robust the test is against different models for the bias. Constraints on these bias models come from the QSO-galaxy cross-corrrelation function (Ellingson et al., 1991, Smith et al., 1995, Croom & Shanks, 1999b) which suggest radio-quiet QSO’s inhabit similar environments to average galaxies out to z=1.5. We are now extending QSO environment tests out to z2 using the INT Wide Field Camera at B26 and the AAT Taurus Tunable Filter (Croom & Shanks, in prep.) and these results will further constrain possible models of QSO bias at high redshift.
4. Conclusions
-
1.
The 2dF QSO Survey has obtained redshifts for 6000/26000 B20.85, z3 QSOs which means it is already the biggest complete QSO survey by a factor of 6.
-
2.
Previous surveys detected QSO clustering at 4 level for r10h-1Mpc where the QSO clustering appears stable when measured in comoving coordinates, suggesting either a low model or a biased, =1 model. Previous surveys detected no significant clustering in at larger scales.
-
3.
The 2dF QSO survey confirms the accuracy of the PLE model of Boyle et al (1991) for the evolution QSO Luminosity Function for 0z2.2.
-
4.
The 2dF QSO survey has already detected many individually interesting objects, including a post-starburst QSO and several close QSO pairs.
-
5.
A preliminary 2dF QSO correlation function based on 4115 QSOs shows results consistent with previous surveys and consistent with the correlation function of local, optically selected galaxies but with a hint of extended power to 50h-1Mpc.
-
6.
Mock catalogues from the Hubble Volume suggest the 2dF QSO survey will be able to determine QSO power spectrum out to 1000h-1Mpc and so detect the expected turnover to the primordial, n=1, slope.
-
7.
The potential of 2dF QSO survey to constrain from both geometric distortions and gravitational lensing is being tested in the Hubble Volume mock catalogues.
Acknowledgments.
We thank Fiona Hoyle, Carlton Baugh and Adrian Jenkins for allowing us to use the results from their analyses of the mock catalogues from the Hubble Volume simulation. The Hubble Volume is provided courtesy of the Virgo Consortium.
References
Alcock, C. & Paczynski, B., 1979, Nature, 281, 358.
Andreani, P. & Cristiani, S., 1992, ApJ, 398, L13.
Boyle, B.J., Shanks, T. & Peterson, B.A., Mon. Not. R. astr. Soc., 1988, 235, 935.
Boyle, B.J., Jones, L.R., & Shanks, T., 1991. MNRAS, 251 , 482.
Boyle B.J., Shanks, T., Croom, S.M., Smith, R.J., Miller, L., Loaring N. & Heymans, C. 1999a, MNRAS, submitted.
Boyle, B.J., Smith, R.J., Croom, S.M. , Shanks, T. , Miller, L. & Loaring, N., 1999b. Phil. Trans R. Soc. Lond. A., 357, 185.
Brotherton, M.S., Van Breugel, Smith, R.J., Boyle, B.J., Shanks, T., Croom, S.M., Miller, L. & Becker, R.H. 1998, ApJ, 505, L7.
Brotherton, M.S., Van Breugel, W. Stanford, S.A., Smith, R.J., Boyle, B.J., Miller, L., Shanks, T., Croom, S.M. & Filippenko, A.V., 1999, ApJ, 520, L87.
Crampton, D., Cowley, A.P. & Hartwick, F.D.A., 1989, ApJ, 345, 59.
Croom & Shanks, 1996, MNRAS, 281, 893.
Croom, S.M. & Shanks, T., 1999a, MNRAS, 307, L17.
Croom, S.M., Shanks, T. , Boyle, B.J., Smith, R.J., Miller, L. & Loaring, N.S., 1999. In ”Evolution of Large Scale Structure: From Recombination to Garching”, eds. Banday, A.J. & Sheth, R.K. E32.
Croom, S.M. & Shanks, T., 1999b, MNRAS, 303, 4.
Ellingson, E., Yee, H.K.C. & Green, R.F., 1991, ApJ, 371, 49.
Georgantopoulos, I. & Shanks, T., 1994 MNRAS, 271, 773.
Hewett, P.C., Foltz, C.B. & Chaffee, F.H., 1995, AJ, 109, 1498.
La Franca, F., Andreani, P. & Cristiani, S., 1998, ApJ, 497, 529.
Shanks, T., Fong, R., Boyle, B.J. & Peterson, B.A., MNRAS, 1987, 227, 739.
Shanks, T. & Boyle, B.J., 1994, MNRAS, 271, 753.
Smith, R.J., Boyle, B.J., & Maddox, S.J. 1995, MNRAS, 277, 270.
Zitelli, V., Mignoli, M., Zamorani, G., Marano, B. & Boyle, B.J., 1992 MNRAS, 260, 925.