Primordial Lithium Abundance as a Stringent Constraint on the Baryonic Content of the Universe
Abstract
We have refined the estimate of the primordial level of 7Li abundance to an accuracy better than 10%, based on high-precision Li abundances for metal-poor halo stars, and a recent model of post-BBN (Big Bang Nucleosynthesis) chemical evolution that provides a quantitative explanation of the detected gentle ascent of the Spite Plateau for stars with metallicities [Fe/H]. Our maximum likelihood analysis obtains an estimate for the primordial Li abundance of , after taking into account possible systematic errors in the estimation of Li abundances, with the exception of a still-controversial issue regarding stellar depletion. The inferred value of (the baryon-to-photon number-density ratio in the universe) based on this estimate is more consistent with that derived from the set of reported “low He” + “high D” from extragalactic sites than that derived from reported “high He” + “low D” measurements. Since, within current models of stellar depletion processes, it is difficult to account for the observed very small scatter of Li abundance in metal-poor stars, our estimate of should be taken as an independent constraint on the baryonic mass density parameter in the universe, giving with km s-1Mpc-1.
1 Introduction
The absolute abundances of 4He, 2D, and 7Li synthesized in the first three minutes following the hot Big Bang provide the key to a determination of the universal baryon density via its relationship to the parameter. In order to refine observational estimates of the primordial levels of these light elements, previous attempts have been made to measure 4He and 2D abundances in extragalactic sites, where potential problems associated with correction for the effects of post-BBN chemical evolution could be minimized or avoided. However, the “low” value of 4He/H reported for metal-poor extragalactic HII regions by Pagel et al. (1992) and Olive, Skillman, & Steigman (1997) stands in contrast to the “high” value of 4He/H reported by Izotov & Thuan (1998). The “high” value for 2D/H reported for high-redshift intergalactic HI clouds by Songaila et al. (1994), Carswell et al. (1994), and Rugers & Hogan (1996) appears at odds with the “low” values for 2D/H from Tytler et al. (1996), Burles & Tytler (1998ab), and Burles et al. (1999). Detection of a high 2D/H abundance (Webb et al. 1997; Tytler et al. 1999) for a gas cloud at rather low redshift (0.7) has made the problem more complicated, because this is opposite to the expectation, based on one-zone models of chemical evolution, that the amount of 2D is should decrease following BBN as the result of various destruction processes.
Given that two different values for both the primordial levels of 4He and 2D, leading to two distinguishable values of , remain tenable at present, there is a pressing need for accurate estimate of the primordial level of 7Li, which provides an independent constraint on . Obtaining such a constraint has proven difficult for two reasons. First, the prediction of the primordial 7Li abundance is a non-linear function of , which formally permits the assignment of two values for at each level of measured primordial 7Li. Second, 7Li is several orders of magnitude less abundant than the other two light elements, so that high-precision observations of surface Li abundances are not possible except for nearby stars, which might have experienced the effects of chemical evolution in the Galaxy.
Despite these apparent difficulties, ever since the discovery of a roughly constant value of Li (6Li + 7Li) abundance in a small sample of metal-poor dwarf stars by Spite & Spite (1982, the so-called “Spite Plateau”), many groups (e.g., Ryan et al 1996; hereafter RBDT; Bonifacio & Molaro 1997) have attempted to better determine the appropriate primordial level of this element (see Spite 2000 for a recent review). The recent high precision (and homogeneously analyzed) data of Ryan, Norris, & Beers (1999, hereafter RNB) showed that the Spite plateau is in fact incredibly “thin,” with an intrinsic star-to-star scatter in derived Li abundance dex.
RNB also claimed the existence of a statistically significant slope of (Li) versus [Fe/H] in the Spite Plateau at low metallicity (first detected by Thorburn 1994), apparently due to the influence of early Galactic chemical evolution. Ryan et al. (2000, hereafter RBOFN) have shown that the observed slope in the Spite plateau can be used to empirically constrain the total expected contribution from Galactic Cosmic Rays (GCRs) and supernovae (SNe). These authors showed that a simple one-zone model for chemical evolution produces a slope which is of similar magnitude to that which is observed. However, their evaluation is necessarily tied to the presently uncertain relationship between O and Fe abundances in the early Galaxy. Furthermore, their evaluation is based on a model which ignores the expected stochastic nature of early star formation which is likely to apply during the first 107 to 109 years of chemical evolution in the early Galaxy.
In this paper we employ the SN-induced chemical evolution model presented by Tsujimoto, Shigeyama, & Yoshii (1999; hereafter TSY) and Suzuki, Yoshii, & Kajino (1999; hereafter SYK), which has the great advantage of treating the production of heavy and light elements consistently in the inhomogeneous early Galaxy (§2). We recover the observed slope of (Li) versus [Fe/H], and obtain an estimate of the primordial level of lithium (§3). We discuss the impact of our results in the context of the standard BBN model (§4).
2 The Model for Galactic Chemical Evolution
Recent observations of the most metal-deficient stars in the Galaxy reveal that the elemental abundance patterns in these stars seem to reflect the contributions from single SN events (Audouze & Silk 1995; McWilliam et al. 1995; Ryan, Norris, & Beers 1996; Norris, Beers, & Ryan 2000). These stars may have been formed in individual SN remnant (SNR) shells, at a time when the interstellar gas was not well-mixed throughout the halo. Based on this scenario, TSY presented a SN-induced chemical evolution model which successfully explains the observed large scatter of Eu abundances in very metal-poor stars. An important prediction of this model is that metallicity, especially [Fe/H], cannot be used as an age indicator at early epochs. Similar models of early Galactic chemical evolution have been studied by Argast et al. (2000). The clear implication is that when one considers elemental abundances of metal-poor stars a distribution of stellar abundances must be constructed in the context of an explicit model, rather than taking the evolution of elements assuming a well-mixed ISM, as is often done in simple one-zone models (e.g., Fig.4 in TSY).
SYK extended the SN-induced chemical evolution model for analysis of the evolution of the light elements produced by both primary and secondary processes involving GCRs, and demonstrated that this model also reproduces the observed trends of 9Be and B (10B + 11B) data. Thus, a SN-induced chemical evolution model appears suitable for a self-consistent investigation of the evolution of various elements in an inhomogeneous Galactic halo.
For the purpose of comparison with previous work, we here consider the evolution of Li (6Li + 7Li) as predicted using the same model presented in SYK and TSY. Spallative and fusion reactions of GCRs produce both 6Li and 7Li, while the -process of SNe produces 7Li alone. The predictions of Woosley & Weaver (1995) for progenitors of different mass are used for the yields of the -process, but the absolute values of these yields are reduced in order to match the observed 11B/10B ratio (Vangioni-Flam et al. 1996; Vangioni-Flam et al. 1998). The transport of GCRs is calculated by the leaky box model (Meneguzzi et al. 1971), and the source spectrum of energetic particles of each element associated with SNe is taken from SYK:
| (1) |
where , is the mass of the -th heavy element synthesized and ejected from a star with mass , and is the star formation rate at time . GCRs are assumed to come from both swept-up material (accelerated in the SN shock front) and SN-ejecta; is a free parameter which represents the contributions to GCRs from these two sources. In order to reproduce the observed data of 9Be (Boesgaard et al. 1999) and 6Li (Smith, Lambert, & Nissen 1998), the value of the GCR spectral index is set to , and the GCR composition parameter is set to (Suzuki & Yoshii 2000). This parameter corresponds to the situation where 3.5% of the total GCRs arise directly from SNe ejecta. The absolute value of is chosen so that the predicted 9Be abundance agrees with log(Be/H)= at [Fe/H] as observed by Boesgaard et al. (1999).
3 Results
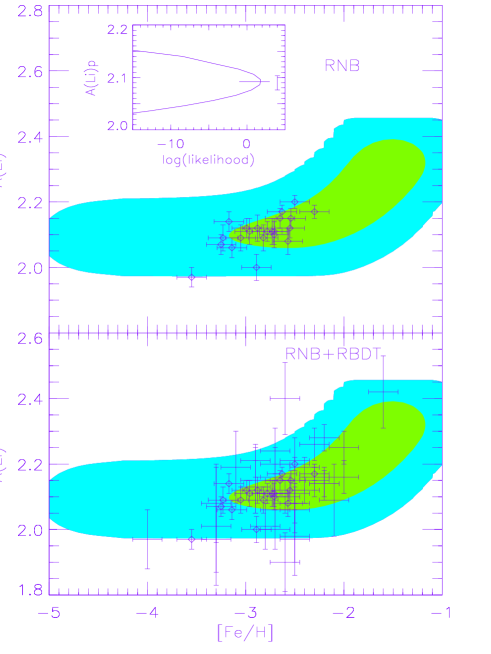
Figure 1 presents a comparison of the observations of (Li) from the compilation of RBDT, and the more recent observations of RNB, to the theoretical prediction of the frequency distribution of long-lived stars in the (Li)–[Fe/H] plane. In this comparison we have used our best estimate of the primordial Li abundance (justified below), and have selected only the data for stars with and [Fe/H]. Because the two data sets exhibit rather different random errors, we plot the data of RNB only in the top panel of Fig. 1, and the data of both RNB and RBDT in the bottom panel, with the same theoretical predictions overlayed.
The effects due to early Galactic chemical evolution of Li (which produces levels in excess of ) are seen already at [Fe/H]; the predicted trend is quite consistent with the data. Our model confirms the existence of the slope of Li abundances toward the metal-rich side of the Spite Plateau, a result which be tested further once a larger sample of precision data are obtained for more metal-rich stars (Ryan et al. 2000). It should be emphasized that this increasing trend of Li abundance is naturally derived by use of the same model which fits the data of the other light elements such as 6Li, 9Be and B (10B+11B) in metal-poor halo stars. The average excess of total Li over the primordial 7Li value amounts to 0.03 dex at [Fe/H] , 0.09 dex at [Fe/H] , and 0.24 dex at [Fe/H] . We note that the contribution of 7Li production through the -process is less than 10% of the total production rate of Li, which indicates that most of Li in our model of the early Galaxy is produced by GCR reactions.
Since our model gives a reasonable amount of Li produced by post–BBN processes, it can be used to predict the precise quantity of Li synthesized during the BBN era. We estimate the primordial Li abundance by constructing likelihood plots as a function of . To establish this likelihood function, the data (including random errors) are compared with the predicted stellar distribution for alternative values of in the (Li)–[Fe/H] plane. The predicted probability distribution for stars located at =([Fe/H], is then calculated independently on each [Fe/H] grid. If we take to represent the Gaussian distribution at for the -th star observed at with errors of , the likelihood on each can be calculated as
| (2) |
The inset of the top panel of Fig. 1 shows the likelihood function established by using the data in RNB and RBDT. Based on our likelihood analysis, the 95% confidence region on the primordial Li abundance occurs for
| (3) |
We have examined the results using the RNB data and the RBDT data respectively, but there is little ( dex), if any, difference between them in the derived estimate of .
So far we have not included any systematic errors in the determination of Li abundances which might arise from a variety of sources. Following RBOFN, we now explicitly include estimates of these errors, except for the still-controversial issue of stellar depletion. The estimated value and confidence interval for then becomes
| (4) |
where we have considered the errors arising from the use of 1-D model atmospheres (+0.10 dex), the adopted convection treatment (+0.08 dex), non-LTE effects ( dex), and uncertainties in adopted -values ( dex). The estimation of stellar abundances of Fe and Li also depends crucially on the adopted temperature scale. However, the [Fe/H] values we have taken from RNB and RBDT come from a variety of sources, with slightly different temperature scales, so a global correction is not practical. Note that a 100 K difference in temperature scales yields a 0.065 dex difference in derived lithium abundance (RNB). In particular, if one adopts the temperature scale of Alonso, Arribas, & Martinez-Roger (1996), which is on average 120K hotter than the scale in RNB, the derived Li abundances might be on the order of +0.08 dex higher. Except for the dex offset from non-LTE effects, we take quadratic sums for these positive and negative errors separately, and have derived in equation 4 as our estimate with the 95% confidence levels including systematic errors.
4 Summary and Discussion
The importance of our new estimates of the primordial level of 7Li is that they are derived, for the first time, from a self-consistent model which explains both the 6LiBeB observations and the small, but real, increasing trend of Li appearing at [Fe/H]. Figure 2 shows our preferred value of with a horizontal line, and the allowed 95% confidence intervals by a box, along with previous estimates of 4He and 2D. The theoretical prediction of standard BBN (Thomas et al. 1994; Fiorentini et al. 1998) is superposed. It is interesting to note that our preferred value lies at the very bottom of the valley of the function of 7Li abundance against , which means that we can assign a single value for , independent of the results from 4He and 2D. Our analysis indicates , which corresponds to a universal baryonic density parameter111If taking into accout uncertainties ( errors) of nuclear reaction rates for the theoretical BBN calculation, the constraints become and . with the Hubble constant expressed as km s-1Mpc-1.
The range of we obtain appears to agree best with that inferred from the reported “low 4He” + “high 2D” measured from extragalactic sites, rather than the pair of reported “high 4He” + “low 2D”. This range is also consistent with that inferred from the primordial value of 4He obtained from recent observations of HII regions in the Magellanic Clouds (Peimbert & Peimbert 2000).
However, the possible effects of stellar depletion, which are not taken into account here, might still play a role. If one adopts the reported “high 4He” and “low 2D” values as the correct ones with which to estimate , then it follows that 7Li has been destroyed through stellar evolution during the long lifetimes of metal-poor halo stars. From our Li constraint one might conclude that Li has been depleted by a factor of as a result of stellar processing.
The required depletion factor, 23, is much larger than the prediction (; Deliyannis et al. 1990) of so-called standard stellar evolution models which only take into account classical surface convection as the origin of mixing in stellar interiors. In order to destroy lithium in deeper and hotter regions extra mixing processes are necessary. Among such processes, stellar rotation is thought to be one of the most effective candidates, but depletion factors dex inferred by rotation-induced mixing depend sensitively on the initial conditions of stellar rotation (Pinsonnealt et al. 1992). So, in general, this process predicts that one might expect to see a scatter about the Spite Plateau as large as the depletion factor itself, reflecting star-to-star differences in stellar rotation and other properties. Although recent models of rotation-induced mixing obtain more moderate depletion factors dex (Pinsonnealt et al. 1999), the expected scatter in the Spite Plateau would still seriously contradict the very small intrinsic scatter ( dex) observed by RNB.
All the above considerations indicate that, unless a novel process which is capable of significant and uniform depletion of stellar Li abundance is identified, our preferred value of should be taken as a stringent constraint on or . The inferred value of the baryonic contribution to the density parameter is ().
This work has been supported in part by the Grant-in-Aid for the Center-of-Excellence research (07CE2002) of the Ministry of Education, Science, Sports, and Culture of Japan. TCB acknowledges partial support for this work from grant AST 95-29454 from the National Science Foundation.
References
- (1) Alonso, A., Arribas, S., & Martinez-Roger, C. 1996, A&AS, 117, 227
- (2) Argast, D., Samlund, M., Gerhard, O.E., & Thielemann, F.-K. 2000, A&A, in press, astro-ph/9911178
- (3) Audouze, J., & Silk, J. 1995, ApJ, 451, L49
- (4) Boesgaard, A. M., Deliyannis, C. P., King, J. R., Ryan, S. G., Vogt, S. S., & Beers, T. C. 1999, AJ, 117, 1549
- (5) Bonifacio, P., & Molaro, P. 1997, MNRAS, 285, 847
- (6) Burles, S., & Tytler, D. 1998a, ApJ, 499, 699
- (7) Burles, S., & Tytler, D. 1998b, ApJ, 507, 732
- (8) Burles, S., Kirkman, D., & Tytler, D. 1999, ApJ, 519, 18
- (9) Carswell, R. F., Rauch, M., Weymann, R. J., Cooke, A. J., & Webb, J. k. 1994, MNRAS, 268, L1
- (10) Deliyannis, C. P., Demarque, P., & Kawaler, S. D. 1990. ApJS, 73, 21
- (11) Fiorentini, G., Lisi, S., Sarkar, S., & Villante, F. L. 1998, phys.rev.D, 58, 063506
- (12) Izotov, Y. I., & Thuan, T. X. 1998, ApJ, 500, 188
- (13) Meneguzzi, M., Audouze, J., & Reeves, H. 1971, A&A, 15, 337
- (14) McWilliam, A., Preston, G. W., Sneden, C., & Searle, L. 1995, AJ, 109, 2757
- (15) Norris, J. E., Beers, T. C., & Ryan, S. G. 2000, ApJ, in press
- (16) Olive, K. A., Skillman, E. D., & Steigman, G. 1997, ApJ, 483, 788
- (17) Pagel, B. E. J., Simonson, E. A., Terlevich, R. J., & Edmunds, M. G. 1992, MNRAS, 255, 325
- (18) Peimbert, M., & Peimbert, A. 2000, Proceedings of IAU Symp. 198 “Light Elements and Their Evolution,” eds. L. da Silva, M. Spite, & J. R. de Medeiros, in press, astro-ph/0002120
- (19) Pinsonnealt, M. H., Deliyannis, C. P., & Demarque, P. 1992 ApJS, 78, 179
- (20) Pinsonnealt, M. H., Walker, T. P., Steigman, G., & Narayanan, V. K. preprint, astro-ph/9803073
- (21) Rugers, M., & Hogan, C. J. 1996, AJ, 111, 2135
- (22) Ryan, S. G., Beers, T. C., Deliyannis, C. P., & Thorburn, J. A. 1996, ApJ, 458, 543 (RBDT)
- (23) Ryan, S. G., Beers, T. C., Olive, K., Fields, B., & Norris, J. E. 2000, ApJ, in press (RBOFN)
- (24) Ryan, S. G., Kajino, T., Beers, T. C., Suzuki, T. K., Romano, D., Matteucci, F., & Rosolankova, K. 2000, in preparation
- (25) Ryan, S. G., Norris, J. E., & Beers, T. C. 1996, ApJ, 471, 254
- (26) Ryan, S. G., Norris, J. E., & Beers, T. C. 1999, ApJ, 523, 654 (RNB)
- (27) Smith, V. V., Lambert, D. L., & Nissen, P. E. 1998, ApJ, 506, 405
- (28) Songaila, A., Cowie, L. L., Hogan, C. J., & Rugers, M. 1994, Nature, 368, 599
- (29) Songaila, A., Wampler, E. J., & Cowie, L. L. 1997, Nature, 385, 137
- (30) Spite, F. 2000, in First Stars, Proceedings of the Second MPA/ESO Workshop, eds. A. Weiss, T. Abel, & V. Hill (Heidelberg: Springer), in press
- (31) Spite, F., & Spite, M. 1982, A&A, 115, 357
- (32) Suzuki, T. K., Yoshii, Y., & Kajino, T. 1999 ApJ, 522, L125 (SYK)
- (33) Suzuki, T. K. et al. 2000, in preparation
- (34) Thomas, D., Schramm, D. N., Olive, K. A., Mathews, G. J., Meyer, B. S., & Fields, B. D. 1994, ApJ, 430, 291
- (35) Thorburn, J. A. 1994, ApJ, 421, 318
- (36) Tsujimoto, T., Shigeyama, T., & Yoshii, Y. 1999, ApJ, 519, L63 (TSY)
- (37) Tytler, D., Fan, X.-M., & Burles, S. 1996, Nature, 381, 207
- (38) Tytler, D., Burles, S., Lu, L., Fan, X.-M., & Wolfe, A. 1999, ApJ, 117, 63
- (39) Vangioni-Flam, E., Cass, M., Fields, B. D., & Olive, K. A. 1996, ApJ, 468, 199
- (40) Vangioni-Flam, E., Ramaty, R., Olive, K. A., & Cass, M.1998, A&A, 337, 714
- (41) Webb, J. K., Carswell, R. F., Lanzetta, K. M., Ferlet, R., Lemoine, M., Vidal-Madjar, A., & Bowen, D. 1997, Nature, 388, 250
- (42) Woosley, S. E., & Weaver, T. A. 1995, ApJS, 101, 181