The vertical extent and kinematics of the HI in NGC 2403
Abstract
The neutral hydrogen line profiles along the major axis of the nearby spiral galaxy NGC 2403 show a wing towards the systemic velocity. This asymmetry can be explained with the presence of an abnormally thick HI disk (FWHM 5 kpc) or with a two-component structure: a thin disk and a slowly rotating, thicker (1-3 kpc) HI layer. The latter model gives a better representation of the observations. These results throw a new light on the disk-halo connection in spiral galaxies. In particular, the decrease of rotational velocity with height above the plane may be the result of a galactic fountain flow. A vertically extended, slowly rotating HI layer may be common among spiral galaxies with high levels of star formation.
Key Words.:
Galaxies: individual: NGC 2403 – Galaxies: kinematics and dynamics – Galaxies: structure1 Introduction
In recent years there has been a growing interest for the vertical structure of the HI disks of spiral galaxies and for the disk-halo connection. Evidence for HI gas flows between disk and halo comes from the detection of large vertical motions in several galaxies viewed close to face-on (Dickey et al. 1990; Kamphuis 1993; Schulman & Bregman 1994) and the connection of this high velocity gas with HI holes and star formation activity in the disk (Kamphuis & Sancisi 1993). More evidence comes from the study of edge-on galaxies like NGC 891 in which the HI has been found to extend up to at least 5 kpc into the halo, where it seems to rotate about 25 km more slowly than in the plane (Swaters et al. 1997). The combination of the results from face-on and edge-on galaxies leads to the picture of effervescent galaxies (Sancisi et al. 1996), consistent with galactic fountains models (Bregman 1980; Spitzer 1990).
The galaxy studied here, NGC 2403, has an intermediate inclination (i=). The consequence is that the measured line-of-sight velocities are a combination of rotational, radial and vertical motions and the column densities are integrated along an oblique line-of-sight. Therefore, the interpretation is less straightforward than in face-on or edge-on galaxies. However, there is the advantage that information is obtained on both the vertical density structure and the vertical kinematics of the HI for the same object.
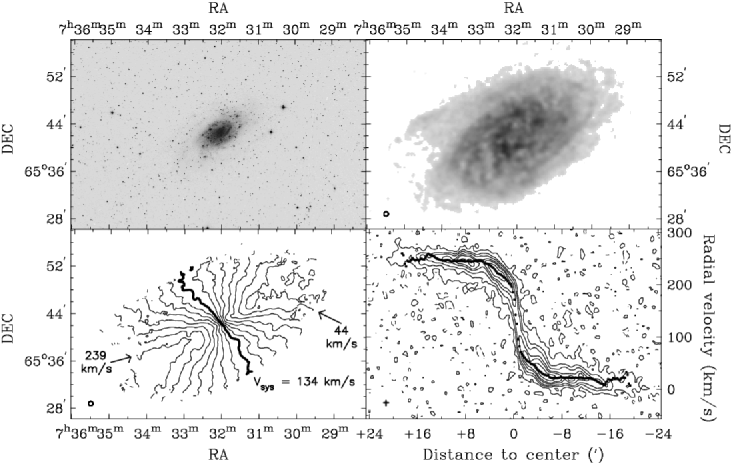
For this study we have used the HI observations obtained by Sicking (1997) with the Westerbork Radio Telescope, which have about a factor of 2 better sensitivity and a higher velocity resolution than those of Wevers et al. (1986). Fig. 1 shows the optical image, the total HI density distribution, the velocity field and the HI position-velocity map along the major axis. The latter shows that the HI line profiles at any position along the major axis are not symmetrical with respect to the rotation velocities, as they would be if they were determined by random motions only. Instead, they are systematically more extended towards the systemic velocity. This striking asymmetry is particularly obvious in the lowest contour and extends systematically over almost the whole major axis. It was already noticeable in the maps produced by Wevers et al. (1986) and by Begeman (1987) and the puzzle presented by those early observations has motivated this study. The presence of such a ‘beard’ is remarkable considering the size of the beam (see lower left in fig. 1) with respect to the size of the galaxy. Usually such an asymmetry is seen in edge-on galaxies or in galaxies which are not well resolved. In such cases the telescope beam ‘sees’ not only the emission from a small area on the major axis but also larger areas away from it which have lower line-of-sight velocities and therefore cause the observed asymmetry. NGC 2403 is neither highly inclined nor poorly resolved.
What is the origin of the ‘beard’? It is clear that it cannot simply be explained by gas moving perpendicularly away from or towards the disk, because that would produce extensions symmetric with respect to the rotation velocity. Neither can it be the result of deviations from axial symmetry or circular motion. These would affect the kinematics of the disk and produce visible effects in the velocity field, but not a low density asymmetry as observed. A likely explanation for the observed asymmetry is that not all of the HI is concentrated in a thin disk, but that part of it is in a vertically extended component. In this case, given the inclination of 61 degrees, a line-of-sight to a point on the major axis will also intercept the HI located above and below the plane which has line-of-sight velocities lower than those in the plane. This will produce a systematic broadening of the HI profiles towards the systemic velocity of the kind seen in fig. 1. It is this effect that we study here with 3-D models of the density distribution and kinematics of the HI in NGC 2403.

2 Modelling
We consider the possibilities of both a thick HI disk (as opposed to the usually assumed thin layer), and of a two-component structure, with a thin layer and a thicker but less dense one. This thick layer may be corotating with the thin one or may be rotating more slowly. Both cases are examined. The reason for considering the slower rotation is that a non-corotating disk and halo have been proposed by Swaters et al. (1997) as the most likely interpretation for the HI observations of the edge-on galaxy NGC 891.
Axial symmetry and circular motions are assumed throughout. This assumption is supported by the results of Schoenmakers et al. (1997) who found from their harmonic analysis of the HI velocity field of NGC 2403 that non-circular motions are not important in this galaxy. Therefore, we have modelled NGC 2403 with a set of concentric rings, each ring characterized by a radius, a circular velocity, a velocity dispersion and a column density. Centre, systemic velocity, inclination and position angle, scaleheight and vertical density profile were chosen to be the same for all rings. The values adopted here are, unless specified otherwise, those derived by Sicking (1997).
The thin component always has a FWHM thickness of 0.5 kpc, the thickness of the thick layer is a free parameter. For the vertical density profile we have assumed a Gaussian distribution. We have also tried an exponential distribution, but the results do not seem to change significantly. In the case of non-corotation the circular velocity of the thicker component has been lowered by a fixed amount, for example 25 km , in the flat part of the curve and a proportionally smaller one in the inner parts. For the velocity dispersion we have used a value of 7 km as derived for the profile widths in the regions of the flat part of the rotation curve. We have also constructed models with higher velocity dispersions for the thick components, up to 30 km , but the results do not differ significantly.
The two-component models have been constructed by adding two one-component models. This is obviously an oversimplification as it is more likely that any vertical decrease of density and velocity would be gradual.
3 Results
The model data cubes have been inspected and analyzed in the same way as the observed cubes. For the comparison of the models and the observations we have used the channel maps and the position-velocity maps along the major and minor axes. Here we present only the position-velocity maps along the major axis and only a small number of models, but we have explored the whole relevant parameter space.
Initially, we tried a model with a one-component gas layer. Cuts along the major axis for various thicknesses are shown in the first column of fig. 2. The observations are in the top right panel. It is immediately clear that a thin disk model does not reproduce the observed asymmetry. A thickness of about 5 kpc (FWHM) would be needed to explain it. It is obvious that such a layer would be unrealistically thick, much thicker than that of our Galaxy, which according to Dickey and Lockman (1990) has a FWHM of only 220 pc, or that of NGC 891, for which most of the HI is in an unresolved layer with a FWHM thickness of less than 1 kpc (Swaters et al. 1997).
Therefore, we explored the possibility of having, instead of one very thick Gaussian disk, a relatively thin disk of high density and in addition a vertically more extended but lower density layer. For this we have built a model with two components, one thin and one thick, both rotating at the same velocity. The FWHM of the thick component and the column density ratio between the two components are free parameters. We found, however, that there is little freedom in the choice of this ratio and we fixed it tentatively at 1:1. With a lower density for the thick component only a weak asymmetry would appear. The best model seems the one with a thick component of FWHM close to 5 kpc (see fig. 2). Hence this model is not significantly different from the one-component model and is equally unrealistic as it requires unreasonable amounts of HI at large distances from the plane.
Finally, we released the condition of corotation and explored the effects of a decrease of the rotational velocity with distance to the plane. For this we have constructed models with a slowly rotating thick component. Again, the FWHM of the thick component and the column density ratio are free parameters. But here as an additional parameter we have the velocity decrease. A thin-to-thick disk density ratio of 4:1 was found to give the best comparison with the data. With a higher ratio the asymmetry would tend to disappear, whereas a lower ratio would not reproduce the observed density contrast between the profile peak and its wings. For the thick component a FWHM of 1 kpc was adopted. For this thickness the best agreement with the observations is obtained with the 25 km decrease (see fig. 2). Models with a thick component of larger FWHM than 1 kpc were also tried. For example, in the lower right of fig. 2, we show a model that also reproduces the observed asymmetry well, and in which the thick component, still with a 25 km decrease in rotation velocity, has a thickness of 3.5 kpc. For this thickness the optimal column density ratio of the thin and thick disk is 6:1. This illustrates that it is difficult to distinguish between an extended, low density and a less extended, higher density vertical distribution.
4 Discussion and conclusion
From section 3 it is clear that all three types of models can explain the observed asymmetry to some extent. However, the first two models require unrealistic amounts of HI above the plane. The third model has a much more realistic vertical distribution, with less than 20% of the gas in the thick component, and it requires that the gas above the plane rotates more slowly than the gas in the disk, by about 25 km . This model also appears to reproduce the observed position-velocity diagram better than the other models, in particular near the center, where the HI has a narrow and peaked distribution, and at large radii, where low level wings are visible.
Note that in the observed position-velocity diagram (fig. 1) the wings near the center extend almost to the systemic velocity. Clearly, such features cannot be reproduced in models with corotation, and not even in those with a velocity decrease as high as 35 km . To explain these extended wings a much larger velocity decrease is needed, probably at least 50 km .
What produces such a thick HI layer and what causes its slower rotation? Galactic fountain models (Bregman 1980; Spitzer 1990) may provide the framework for an answer. The fountain is formed by hot gas rising from the disk, its energy derived from stellar winds and supernova explosions. In the halo region the gas cools and condenses into clouds that fall back onto the disk. As the gas moves up, the centrally directed gravitational force decreases, and the gas moves outwards. Due to conservation of angular momentum the azimuthal velocity decreases. This decrease will be most pronounced in the central parts of the galaxy, where a fixed radial displacement will result in a larger velocity decrease than in the outer regions. Using thermohydrodynamic models, Struck & Smith (1999) have recently shown that a reduced circular velocity above and below the plane is expected to be present in turbulent disks as a result of radial motions driven by star formation activity.
NGC 2403 appears to have sufficient star formation activity to drive a galactic fountain. This is for instance indicated by its large number of HII regions (Sivan et al. 1990). Four of these are exceptionally bright, comparable to the most massive starburst region in the Local Group, the 30 Doradus complex (Drissen et al. 1999). Furthermore, Thilker et al. (1998) have found that the surface of NGC 2403 is covered by shells and fragmentary structures which are likely to have formed as a result of star formation activity. They have also found that these structures are part of a diffuse component of neutral hydrogen extending at least 400 pc from the plane.
The overall picture of NGC 2403, as suggested by the modelling, is reminiscent of that of NGC 891. For this galaxy it was found (Swaters et al. 1997) that the thick component has a FWHM of about 4 kpc, and this gas appears to rotate more slowly than the gas in the disk by about 25 km . In the central parts the velocity decrease was found to be much larger, perhaps up to 100 km .
In conclusion, we have presented evidence that the thin hydrogen disk of NGC 2403 is surrounded by a vertically extended layer of HI, which rotates more slowly than the disk. The observational picture is very similar to that found for NGC 891. These results suggest that a vertically extended, slowly rotating HI layer may be common among spiral galaxies, at least among those with high levels of star formation. Such extended HI layers have, however, very low surface densities and therefore very sensitive observations are needed to detect them.
5 Acknowledgements
We thank F.J. Sicking for kindly making available the data and U.J. Schwarz for helpful discussions.
References
- (1) Begeman K., 1987, PhD Thesis, University of Groningen
- (2) Bregman J.N., 1980, ApJ, 236, 577
- (3) Deul E.R., van der Hulst J.M., 1987, A&AS, 67, 509
- (4) Dickey J.M., Lockman F.J., 1990, ARA&A, 28, 215
- (5) Dickey J.M., Murray Hanson M., Helou G., 1990, ApJ, 352, 522
- (6) Drissen L., Roy J.-R., Moffat A.F.J., Shara M.M., 1999, AJ, 117, 1249
- (7) Kamphuis J.J., 1993, PhD Thesis, University of Groningen
- (8) Kamphuis J.J., Sancisi R., 1993, A&A, 273, L31
- (9) Sancisi R., Kamphuis J.J., Swaters R.A., 1996, In: Kunth D. et al. (eds.) The Interplay between Massive Star Formation, the ISM and Galaxy Formation. Editons Frontieres, Gif-sur-Yvette Cedex, p. 205
- (10) Schoenmakers R.H.M., Franx M., de Zeeuw P.T., 1997, MNRAS, 292, 349
- (11) Schulman E., Bregman J.N., 1994, ApJS, 423, 180
- (12) Sicking F.J.,1997, PhD Thesis, University of Groningen
- (13) Sivan J.P., Mauchevat A.J., Petit H., Comte G., 1990, AA, 237, 23
- (14) Spitzer L., 1990, ARA&A, 28, 71
- (15) Struck C., Smith D.C., 1999, ApJ, 527, 673
- (16) Swaters R.A., Sancisi R., van der Hulst J.M., 1997, ApJ, 491, 140
- (17) Thilker D., Braun R., Walterbos R., 1998, AA, 332, 429
- (18) Wevers B.M.H.R., van der Kruit P.C., Allen R.J., 1986, A&AS, 66, 505