Star Clusters and the Duration of Starbursts
Abstract
The duration of starbursts is important for determining how they are regulated and the impact they have on their environment. Starbursts contain numerous prominent star clusters which typically comprise in total 20% of the ultraviolet light, embedded in a diffuse glow of recently formed stars responsible for the dominant %. Hubble Space Telescope images have been obtained for four starburst galaxies in order to determine their burst duration from the ages of their star clusters. Preliminary results for NGC 3310 are reported here. The colors of its clusters and diffuse light give consistent results. The clusters have a broad range of colors, consistent with a population of instantaneous bursts with ages ranging from 0 to a few 100 Myr. The diffuse light has a narrow range of color consistent with continuous star formation over timescales ranging from to 100 Myr. Hence NGC 3310’s starburst has lasted Myr, or about 10 times the crossing time. Other results noted in the literature also indicate bursts lasting several times longer than the crossing time. These results suggest that starbursts are not self-extinguishing flashes. Rather they are sustainable, perhaps self-regulated.
Department of Physics and Astronomy, The Johns Hopkins University, Baltimore, MD 21218, USA
1. Introduction
Over the past few decades starbursts, brief intense episodes of massive star formation, have been recognized as important agents of galaxy evolution. However, despite many journal pages per year of attention, there is much we do not know about the inner workings of starbursts. In particular: how long do they last? Estimates in the literature have been obtained from a variety of techniques and range from Myr to Gyr time scales (Mas-Hesse & Kunth & 1999, and Coziol, Barth & Demers 1995). A priori the minimum expected duration is the crossing time : the time it would take for a disturbance to travel from one end of the starburst to the other. Local starbursts typically have size scales of Kpc and velocity dispersions of km/s, and hence crossing times ranging from Myr to Myr, with 10 Myr being typical.
Starburst duration is important for determining the efficiency that metals are released into the IGM, and for determining the total number of bursts that a galaxy can undergo. Knowing the duration of starbursts will give us a better understanding about how bursts evolve. If the durations are similar to it would suggest that they are self-extinguishing explosions, destroyed by their energy output produced in a non-equilibrium fashion. Conversely, durations much longer than would indicate that starbursts are sustainable, perhaps even being in equilibrium: i.e. ISM inflow star formation rate (SFR) + outflow.
2. Starbursts and star clusters.
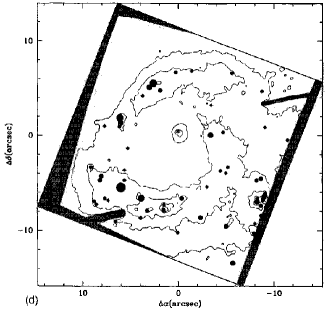
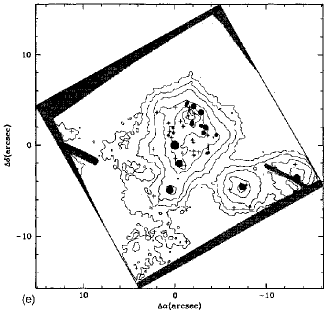
In the mid-1990’s we obtained HST ultraviolet (UV) images of starburst galaxies with the Faint Object Camera imaging at Å in order to examine the distribution of high mass stars which power starbursts. The results of our imaging study are given in Meurer et al. (1995; hereafter M95). The UV structure of starbursts is well exemplified by NGC 3310 and NGC 3690 as shown in Fig. 1. Immediately striking are numerous prominent and compact star clusters. However, the total UV emission is dominated by a diffuse distribution of stars. Typically, this amounts to about 80% of the UV light within starbursts (M95). The nearest starbursts in our sample start to resolve into individual high mass stars which trace the diffuse light isophotes, demonstrating that the diffuse light is not a product of scattered light from the clusters, nor is it a figment of the pre-COSTAR optics of HST. These images reveal that a starburst is not the same thing as a star cluster. Nor, is it the sum of multiple clusters. The natural conclusion is that there are two modes of star formation in starbursts: a very significant 20% of the star formation is in compact star clusters while the dominant mode is diffuse star formation.
The Myr crossing time of starbursts is set by the dimensions of the diffuse light. It is difficult to verify whether the star formation timescales are consistent with such large crossing times. Broad band photometric indexes are degenerate in terms of population age and duration (Mas-Hesse & Kunth 1991). This is because for extended duration star formation it is the youngest stellar populations that dominate the bolometric output. Hence the light from the onset of the burst has relatively little weight.
The clusters within starbursts are very compact, having effective radii typically of a few pc (M95, Whitmore et al. 1999). They have velocity dispersions of typically km s-1(Ho & Fillipenko, 1996; Smith & Gallagher, 2000), and hence crossing times less than a Myr. Since their photometric ages are usually at least a few Myr, they are well mixed systems. It is fair to assume that they were each formed in a single short duration burst. If so, one can determine good photometric ages; since is very small the degeneracy is broken.
This is the basis of our project to measure the the duration of starbursts as a whole using star clusters as chronometers. The duration of the entire starburst is the width of the cluster distribution. We have been granted HST time in cycle 6 to measure the starburst duration in four systems. The sample is listed in Table 1, which lists the distance (), effective radius of the entire starburst (), velocity dispersion, , and crossing time ().
| Galaxy | ||||
|---|---|---|---|---|
| [Mpc] | [pc] | [km/s] | [Myr] | |
| NGC 4670 | 15 | 220 | 42 | 10 |
| NGC 3310 | 18 | 680 | 128 | 10 |
| Tol1924-416 | 37 | 480 | 38 | 25 |
| NGC 3690 | 44 | 680 | 306 | 4 |
These galaxies were imaged with WFPC2 using the F336W (), F435W (), and F814W () filters. While our own data on Tol1924-416 has not yet been obtained, Östlin et al. (1998) have obtained equivalent data for this system, known in Europe as ESO 338-IG04. Three color images of these systems can be found on the web 111http://www.pha.jhu.edu/meurer/research/starburst_dt.html. Most of the rest of this talk will focus on NGC 3310 for which the analysis has progressed the furthest.
3. NGC 3310
NGC 3310 is a nearly face-on spiral with a prominent ring of star formation encircling its mildly active nucleus (LINER or transition spectrum: Heckman & Balick 1980; Pastoriza et al. 1993). In ground based images the ring is very clumpy, with the brightest clump described as a “Jumbo” Hii region by Balick and Heckman (1981). NGC 3310’s outer structure is disturbed (van der Kruit & de Bruyn, 1976) suggesting that an interaction or merger has triggered the present starburst. The spectroscopy of Pastoriza et al. (1993) reveals both the Wolf-Rayet feature at 4686Å and the Caii triplet, which arises in red supergiants, indicating that star formation has proceeded for 10 Myr.
The band Planetary Camera chip image of NGC 3310’s center is shown in Fig. 2. The structures detected from the ground are clearly revealed including the starburst ring and the Jumbo Hii region. Numerous compact clusters are prominent in these structures. NGC 3310 is close enough, and the images deep enough that some of the faintest sources are probably individual high-mass stars.
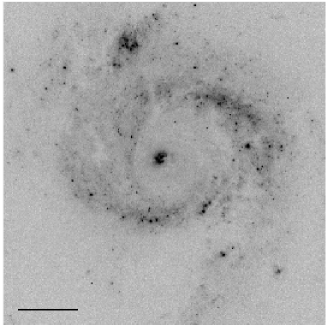
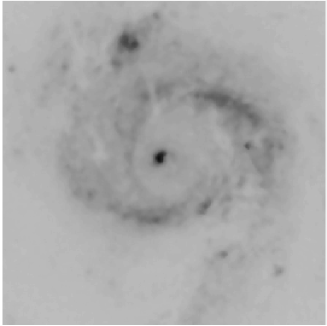
Photometry was done on the clusters using DAOPHOT. Isolated clusters on the frame were used to construct the “point spread function”. So, it is better described as a “cluster spread function”, since the clusters are comparable in size to the pixels, noticeably broadening the PSF width (Whitmore et al. 1999; M95). The clusters were separated from the diffuse light and the photometry was refined in an iterative fashion. The resulting total and diffuse light images are shown in Fig. 2. A comparison of the two panels clearly shows the dominance of the diffuse light. The fractional flux of NGC 3310 contributed by the clusters in the different bands is 0.07 (UV; M95), 0.092 (), 0.073 (), and 0.065 (). Despite the improved optical performance of WFPC2 compared to pre-COSTAR FOC, starbursts do not resolve out into an ensemble of star clusters.
The clusters span a wide range of colors, as is apparent in the color composite image presented at the meeting (see footnote 2). While dust lanes are apparent in the image, the lack of correlation between cluster color and proximity to the dust lanes shows that dust is not causing the effect. This can also be seen in the versus two-color diagrams shown in Fig. 3 where the clusters form an like locus; they are not all strung out on a reddening vector.
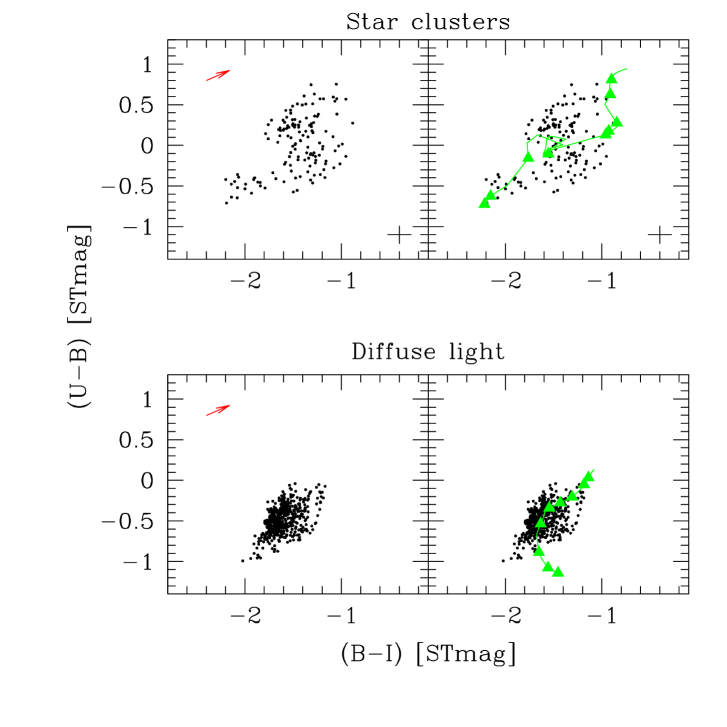
In Fig. 3 the cluster data are compared with Starburst99 (Leitherer et al. 1999) single burst models. A range of metallicities and IMF parameters were examined. While none exactly matches the cluster two color diagram (better models are needed), the data matches the general sense of how photometric evolution proceeds. Clusters start out at the lower left (blue in each color) and evolve more rapidly in than as the main sequence widens and red evolved stars appear. After about 30 Myr, evolution becomes more rapid in than , tracing the evolution of the main-sequence turn-off. The reddest clusters in NGC 3310 are on the order of a few hundred Myr old.
In contrast to the clusters, the diffuse light spans a vary narrow range of colors. This agrees well with continuous star formation models. The model comparison suggest durations range from 5 to 300 Myr for the diffuse light, with most of the emission implying to 100 Myr durations.
The overall picture is fairly star formation in both the clusters and consistent: the diffuse light has been ongoing for several tens or up to a few hundred Myr. This is several crossing times of the starburst ring.
4. Discussion
Other researchers have also reported extended star formation durations within starbursts. The work of Whitmore et al. (1999) on the spectacular merging “Antenna” system (NGC 4038/4039; discussed in these proceedings by Miller, 2000) reveals clusters with ages up to Myr within the starburst. This is largely consistent with the merger timescale of 200 Myr, and a few times the disk crossing timescale of Myr (Barnes 1988). Calzetti et al. (1997; 2000) report clusters in the blue compact dwarf (BCD) galaxy NGC 5253 with photometric and spectroscopic ages up to 10 Myr, a few times larger than the starburst crossing timescale of Myr. Walborn & Blades (1997) discuss in detail the complex age distribution of stars and star clusters in the nearest external starburst: 30 Doradus. Grebel & Chu (2000) expand on a case in point, reporting an age of 25 Myr for Hodge 301, a neighbor of R136a which has an age of 2.5 Myr. The projected turbulent velocity dispersion crossing time between these clusters is Myr. Clearly even small starbursts have an extended history.
Ground based observations of BCDs and Hii galaxies yield similar results. Their strong emission line spectra indicate that they must contain a substantial young ionizing population. However, the colors of their starbursts (determined after carefully subtracting the underlying populations, and correcting for extinction), are clearly too red to have been produced by a young ( Myr) instantaneous burst. Instead they are consistent with continuous star formation over 10 to 100 Myr timescales (Telles & Terlevich 1997; Marlowe et al. 1999). This amounts to at least a few crossing times in most starbursts.
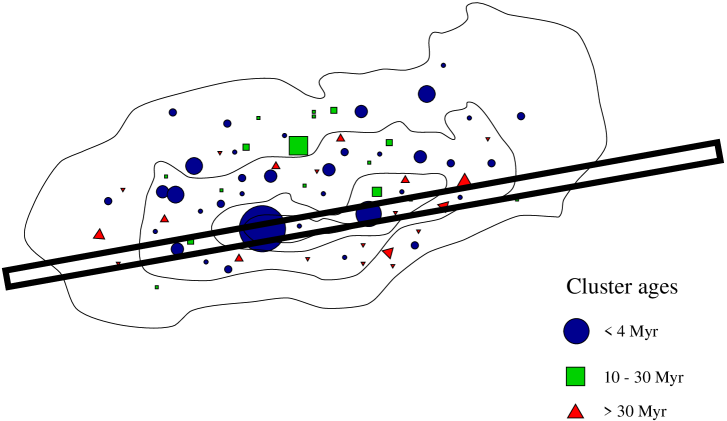
Contrary claims for relatively short burst durations have been made, particularly with regard to Wolf-Rayet galaxies (Schaerer, Contini, & Kunth, 1999) and BCDs (Mas-Hesse & Kunth 1999) which have star formation durations estimated to be Myr222Mas-Hesse & Kunth note that in several cases BCD data are consistent with 20 Myr continuous star formation.. In these studies timescales are often spectroscopically constrained by the presence of WR features, which are washed out for durations Myr. However, the spectroscopy can be misleading as suggested by Fig. 4. An observer would usually center the slit on the brightest source within the galaxy, which is likely to be a cluster, and preferably a young one. Such a cluster could dominate the entire spectrum, the majority of the starburst being outside of the slit. This would give the impression that the whole starburst is dominated by a short duration burst. Cases in point are NGC 5253 (Walsh & Roy, 1987; Schaerer et al. 1997) and NGC 3310 (Pastoriza et al. 1993), both of which show WR spectra, but only over a fraction of the starburst.
Another strong voice for short burst durations is Elmegreen (2000) who claims that star formation occurs over a timescale of only one or two crossing times, citing various results in the Galaxy and LMC. The difference here may in part be due to the velocity used to calculate the crossing time. Elmegreen uses the sound velocity whereas I have quoted measured velocity dispersions of the ISM of the starbursts. The latter is supersonic, resulting in lower crossing times, and a better representation of the true speed that a disturbance travels within the star forming medium.
If starbursts do last many crossing times there are some important implications. Firstly, starbursts are sustainable, perhaps even self-regulating. The upper-limit to the effective surface brightness of starbursts reported by Meurer et al.(1997) and Lehnert & Heckman (1996) is further evidence of this regulation, although it is not clear what the regulating mechanism is. Second, burst durations may be longer than the typical ISM expansion timescales seen in galactic winds (Martin 1998). Hence, galactic winds are likely to occur in a previously fractured ISM. This should increase the efficiency of metal ejection into the intergalactic medium compared to simulations which usually are modeled in smooth undisturbed media.
Acknowledgements. I gratefully acknowledge Tim Heckman and Claus Leitherer, my collaborators on this project.
References
Balick, B., & Heckman, T. 1981, A&A, 96, 271
Barnes, J.E. 1988, ApJ, 331, 699
Calzetti, D., Meurer, G.R., Bohlin, R.C., Garnett, D.R., Kinney, A.L., Leitherer, C., & Storchi-Bergmann, T. 1997, AJ, 114, 1834
Calzetti, D., Tremonti, C.A., Heckman, T.M. & Leitherer, C. 2000, this volume (astro-ph/9912504)
Coziol, R., Barth, C.S., & Demers, S. 1995, MNRAS, 276, 1245
Elmegreen, B.G. 2000, ApJ, 530, 277
Grebel, E.K., & Chu, Y.-H. 2000, AJ, 119, 79
Heckman, T.M., & Balick, B. 1980, A&A, 83, 100
Ho, L.C., & Fillipenko, A.V. 1996, ApJ, 466, L83
Lehnert, M., & Heckman, T.M. 1996, ApJ, 472, 546
Leitherer, C., Schaerer, D., Goldader, J.D., Gonzalez Delgado, R.M., Carmelle, R., Kune, D.F., de Mello, D.F., Devost, D., & Heckman, T.M. 1999, ApJS, 123, 3
Marlowe, A.T., Meurer, G.R., & Heckman, T.M. 1999, ApJ, 522, 183
Martin, C.L. 1998, ApJ, 506, 222
Mas-Hesse, J.M., & Kunth, D. 1991, A&AS, 88, 399
Mas-Hesse, J.M., & Kunth, D. 1999, A&A, 349, 765
Meurer, G.R., Heckman, T.M., Leitherer, C., Kinney, A., Robert, C., & Garnett D.R. 1995, AJ, 110, 2665 (M95)
Meurer, G.R., Heckman, T.M., Lehnert, M.D., Leitherer, C., & Lowenthal, J. 1997, AJ, 114, 54
Miller, B.W. 2000, this volume (astro-ph/9912453)
Östlin, G., Bergvall, N., & Rönnback, J. 1998, A&A, 335, 85
Pastoriza, M.G., Dottori, H.A., Terlevich, E., Terlevich, R., & Díaz, A.I. 1993, MNRAS, 260, 177
Schaerer, D., Contini, T., Kunth, D., & Meynet, G. 1997, ApJ, 481, L75
Smith, L.J., & Gallagher, J.S. 2000, this volume (astro-ph/0001529)
Telles, E., & Terlevich, R. 1997, MNRAS, 286, 183
van der Kruit, P.C., & de Bruyn, A.G. 1976, A&A, 48, 373
Walborn, N.A., & Blades, J.C. 1997, 112, 457
Walsh, J.R., & Roy, J.-R. 1987, ApJ, 319, L57
Whitmore, B.C., Zhang, Q., Leitherer, C., Fall, S.M., Schweizer, F., & Miller, B.W. 1999, AJ, 118, 1551
Comments and discussion
Grebel: The duration of a starburst appears to be determined by the angular resolution with which one looks at a starburst region. Consider for instance 30 Doradus, which can be observed with very high angular resolution: The massive central cluster R136 has an age of 1-2 Myr; Hodge 301 has an age of 25 Myr, and there are several other spatially distinct regions within 30 Dor that have ages between the above. The duration of formation in each of these clusters in this starburst region is only a few Myr. The entire 30 Dor region is composed of several smaller “starbursts” if they were seen at a distance of 40 or 100 Mpc.
Meurer: Yes this is a problem. Even with HST, our method works best on the nearest systems.
Lançon: It is generally accepted that you worry about internal extinction in young clusters, not in old clusters. At what time should one stop worrying about internal extinction? Is dust produced by red supergiant / AGB stars relevant?
Meurer: I expect that once a cluster ejects its natal ISM, that it shouldn’t be much affected by internal dust until the starburst region shuts down. Hot ( K) gas pervades the entire starburst at a high filling factor. Internally produced dust will be quickly swept away or destroyed.
Burgarella: From UV-2000Å observations with the balloon borne FOCA telescope, we estimated a diffuse light / point like sources to be closer to 50/50. This may not be consistent with the ratio that you find for NGC 3310. One point to note is that even with a resolution of arcsecs, we probably got smaller star forming regions. Do you find that this may be consistent with your view? We should be careful about what is diffuse light.
Meurer: I suspect that much of the difference is due to resolution. However much work needs to be done to see the clumpy fraction varies with properties such as metallicity, potential well depth, and star formation intensity (surface brightness) The best place to check may be the Magellanic clouds where UIT images directly resolve the UV continuum.
Zinneckar: You mentioned that in NGC 3690 20% of the UV light is in prominent clusters while 80% is in diffuse UV light. What is the nature of this diffuse light: scattered light from the prominent clusters or the superposition of unresolved light from a more distributed OB star poulation? What is the spectrum or color of the diffuse light?
Meurer: Calzetti et al. (2000) shows that the spectrum of NGC 5253’s diffuse light has narrower Civ and Siiv lines than seen in the WR clusters. Its diffuse light is starting to resolve into individual stars with HST imaging (e.g. M95), so it is unlikely to be dominated by scattered light.
Schaerer: Indeed it is important to clarify what kind of object/region is included in the observations when burst durations are studied. Although no exact quantification of this is usually done for WR “galaxies”, the short durations mostly found (cf. Schaerer et al. 1999; Mas-Hesse and Kunth 1999) is likely due to the fact that just one or a few clusters typically dominate the integrated light in these objects (most metal-poor BCDs).