The rise and fall of V4334 Sgr (Sakurai’s Object)
Abstract
CCD UBVRi photometry of the final helium flash object V4334 Sgr (Sakurai’s Object), carried out during 1997 – 1999, is presented, and the light curve from its pre-discovery rise to the dust obscuration phase is constructed. The optical light curve can be divided into four sections, the rise to maximum, the maximum, the dust onset, and the massive dust shell phase. The color indices show a general increase with time, first because of the photospheric expansion and cooling, and later because of the dust forming events. The energy distributions for the years 1996 – 1999 show that an increasing part of the energy is radiated at infrared wavelengths. In 1996, the infrared excess is likely caused by free-free radiation in the stellar wind. Starting from 1997 or 1998 at the latest, carbon dust grains are responsible for the more and more dramatic decrease of optical radiation and the growing infrared excess. Its photometric behavior in 1998 – 1999 mimics the “red declines” of R CrB variables, the amplitude, however, is more extreme than any fading ever observed in an R CrB star. Evidence is given that a complete dust shell has formed around V4334 Sgr. It therefore shows similarities with dust-forming classical novae, although evolving times more slowly. Its luminosity increased by a factor 4 between 1996 and 1998. A comparison of time scales of the final helium flash objects FG Sge, V605 Aql and V4334 Sgr shows that the observed photometric and spectroscopic features are similar, while V4334 Sgr is the most rapidly evolving object to date.
1 Introduction
After completing their core helium-burning phase, stars less massive than develop in their AGB phase electron-degenerate cores of carbon and oxygen, or oxygen and neon at the massive end, and alternately burn helium or hydrogen in shells. Each quiescent helium-burning phase is preceded by a thermonuclear runaway in the degenerate helium layer. In the aftermath of each of these “thermal pulses”, carbon and s-process elements are transported to the stellar surface (Iben & MacDonald 1995). Finally, these stars undergo extensive mass loss (“superwind phase”), and move in the Hertzsprung-Russell diagram to the region of central stars of planetary nebulae (PNN).
The peculiar variable star FG Sge, which is situated in the center of a planetary nebula, has inspired theoreticians to study the post-AGB evolution in more detail. It is now believed that in about 10% of all thermally pulsing stars, the last pulse can occur in a very late stage, when the star has already settled down as a PNN. In such a case, the last pulse is directly observable as a “final He flash”, which drives the star from the region of the PNN back to the top of the AGB. This happened to FG Sge in the course of the 20th century. Such a “born-again giant” phase can last decades, centuries or millennia, but the object will return finally to the PNN region. During the final He flash phase, the outer layers of the star undergo extensive nucleosynthesis, including more or less complete processing of the surficial hydrogen. A large fraction of the outer layers is ejected, leading to the formation of a hydrogen-poor, carbon-rich nebulosity in the center of the planetary nebula.
Planetary nebulae with central hydrogen-poor condensations like Abell 30 or Abell 80 (Jacoby 1979, Jacoby & Ford 1983), H-deficient post-AGB stars like Wolf-Rayet type central stars of planetary nebulae, or white dwarfs of the PG1159 type (e.g. Werner et al. 1999) are possible end-products of final He flash objects.
The evolution of a final He flash from the PNN to the giant stage may take decades (as in FG Sge) or only a few years, as concluded in recent years from the present state and a few historical observations of “Nova Aquilae No. 4” of 1919, also known as V605 Aql (Seitter 1985, Clayton & De Marco 1997). 77 years after the flareup of V605 Aql, a “novalike object in Sagittarius” was soon recognized as another one of these rare events. It offers the first opportunity to study in detail the evolution of a fast final He flash.
Sakurai’s object, later named V4334 Sgr, was discovered on 1996 February 20 as a star of magnitude by Yukio Sakurai (Nakano, Benetti & Duerbeck 1996). Prediscovery observations by Y. Sakurai and K. Takamizawa showed that it had been at magnitude 12.5 in early 1995, and possibly at magnitude 15.5 in late 1994. Several groups have monitored the optical brightness evolution: a Russian group (Arkhipova & Noskova 1997, Arkhipova et al. 1998, 1999), a US group using automatic photometric telescopes (Margheim, Guinan & McCook 1997, Guinan et al. 1998), and a Chilean-European group, whose results are presented here. Furthermore, scattered observations made with larger telescopes during interesting phases of its evolution will also be discussed.
The UBVRiz observations made in 1996 by the Chilean-European group were published (Duerbeck et al. 1997, hereafter quoted as D97). In the present paper, photometric observations for the years 1997, 1998, and 1999 are reported, covering the complete rise and decline of the brightness of V4334 Sgr in the optical region (Sect. 2). Its properties before the outburst are investigated and constraints are given on its distance (Sect. 3). The light and color curves are constructed and interpreted (Sect. 4). The observed fadings are explained by dust formation, and similarities and differences of these events with fadings of R CrB stars are outlined (Sect. 5). The development of the energy distribution between 0.36 and 15 m is investigated, and parallels to dust-forming classical novae are shown (Sect. 6). Finally, the time scales of the final He flashes in V4334 Sgr, V605 Aql and FG Sge are compared, and predictions for their future evolution are given (Sect. 7).
2 Observations
UBVRi observations of V4334 Sgr were carried out with the 0.91 m Dutch light collector at ESO La Silla, until its shutdown on April 1, 1999. Filters and comparison stars were the same as those used in D97 (the filters and refer to Cousins and Gunn , respectively). The object was also observed until 1998 October with the 0.2 m Schmidt telescope of W. Liller in Reaca, Via del Mar, Chile. Additional observations were obtained with the 3.5 m Telescopio Nazionale Galileo (TNG)111The Italian Telescopio Nazionale Galileo (TNG) is operated on the island of La Palma by the Centro Galileo Galilei of the CNAA (Consorzio Nazionale per l’Astronomia e l’Astrofisica) at the Spanish Observatorio del Roque de los Muchachos of the Instituto de Astrofisica de Canarias in July, 1999.
The early observations with the Dutch telescope were analyzed using ROMAFOT aperture photometry. The continuing decline in brightness, especially at short wavelengths, made it necessary to carry out DAOPHOT profile fitting photometry of V4334 Sgr from 1997 September 15 onward. Because of the increase of exposure times, comparison star (1) of D97 became too bright to be used as a local standard, and the average magnitude of stars (taken from D97) was used as the reference magnitude in all filters. The Reaca observations are based on CCD aperture photometry. Since they were always taken relative to star (1) through a non-standard filter which extends towards the red, a transformation was established from simultaneous Dutch () and Reaca () observations, which permits to convert the Reaca observations into the standard system:
where is the magnitude difference relative to the bright comparison star; the color is taken from the “Dutch” observations, taken near the time of the Reaca observations. The UBVRi data of 1997 – 1999 are listed in Table 1.
3 V4334 Sgr before its final He flash
V4334 Sgr before its final He flash was a faint blue star on the ESO/SERC Sky Atlas (Duerbeck & Benetti 1996, hereafter quoted as D96). In this section, the apparent magnitude is determined, the interstellar reddening is estimated, and upper and lower limits of its distance are given. This information is important for the derivation of the luminosity during the final He flash phase.
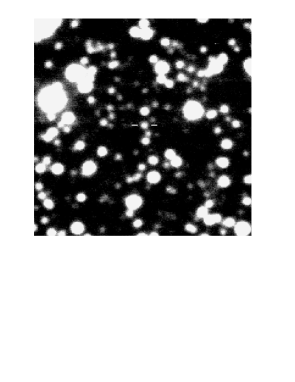
Deep images with the TNG telescope in 1999 July allow to establish a preliminary faint magnitude scale in the vicinity of V4334 Sgr (Fig. 1). A northern and a southern visual companion, each from V4334 Sgr, are seen on the Sky Atlas images (see plate 1 of D96). The northern companion has , the southern one . Due to the lack of -magnitudes in the TNG observations, pseudo--magnitudes were assigned to some stars with the help of the available and magnitudes. Using this preliminary scale, the visibility of some fainter field stars was checked on the Sky Atlas plates, and the pre-outburst photographic magnitudes of V4334 Sgr were estimated to be , .
The interstellar reddening of V4334 Sgr is still poorly known. While was estimated by D96, the value was derived by Pollacco (1999) from the observed H/H line ratio of the surrounding planetary nebula for case B. Another value, 1.15, was suggested by Eyres et al. (1998b). Kimeswenger & Kerber (1998) made a detailed study of interstellar reddening in the field around V4334 Sgr and found for 18 stars with distances kpc. Since we have reasons to believe that V4334 Sgr has a distance kpc (see Sect. 6), we adopted , which is compatible with both Pollacco’s and Kimeswenger & Kerber’s results.
The brightness of the pre-outburst magnitude of V4334 Sgr was compared with other PNNs. Absolute magnitudes of central stars of planetary nebulae were derived using information on trigonometric parallaxes given in Jacoby, De Marco & Sawyer (1998) and Acker et al. (1998). Apparent magnitudes were taken from the catalogue of Acker et al. (1992), the interstellar extinction was calculated with the model of Hakkila et al. (1997). Our sample is restricted to central stars in roundish bright and faint nebulae, while central stars inside irregular nebulae and stars which are obviously blended with field stars were not considered. The derived absolute magnitudes are listed in Table 2. Using the average value and its deviation, , and taking for the pre-outburst magnitude of V4334 Sgr, its distance is derived to pc, assuming a reddening . The value would increase the distance estimates by 20%. Jacoby et al. (1998) concluded that the distance remains poorly determined, with possible values lying in the range 1 to 4 kpc. This is in agreement with the present result. This issue will be taken up again in Sect. 6.
4 The optical outburst behavior of V4334 Sgr
4.1 The light curve
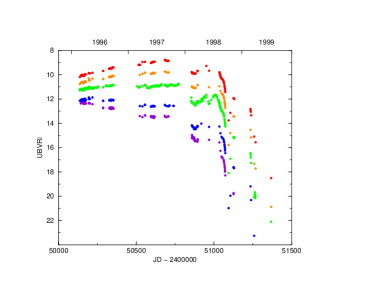
Figure 2 shows the complete light curve of V4334 Sgr. It can be divided into four characteristic stages, conveniently separated by the seasonal gaps when the star was too close to the sun.
The first stage is the “rise to maximum” of 1994 – 1995, which is covered only by Takamizawa’s 12 prediscovery observations (Takamizawa 1997; see D97 for a discussion of the prediscovery light curve); note that the 1994 point is possibly only an upper limit. The second one is the “maximum stage” of 1996 and 1997, when quasiperiodic brightness fluctuations were superimposed on an almost constant magnitude of . The third one is the “dust onset stage” of early and mid-1998, when the object dropped in brightness by , and continued to show quasiperiodic fluctuations. Finally, the fourth one is the “massive dust stage” of late 1998 and 1999, when the object suffered dramatic declines of 3 to in visible light, and when strong, erratic brightness fluctuations – unfortunately poorly documented – were present.
As already shown in D97, the first and second stages can be explained by an object with a slowly growing photosphere or pseudo-photosphere, radiating almost at constant luminosity. In contrast to a stable photosphere, a pseudo-photosphere is formed in a optically thick wind, which is driven by radiation pressure from an object radiating near Eddington luminosity (see, e.g. Bath & Harkness 1989). Such a behavior is found in classical novae at early outburst stages. Dynamical instabilities causing mass loss and dust formation have also been suggested for R CrB stars which radiate close to the Eddington limit (Asplund 1998). The photosphere of V4334 Sgr may be a true photosphere or a pseudo-photosphere, an attempt to decide between both cases will be made later (Sect. 6). The expansion and cooling of the photosphere is documented in the UBVRi light curves (Fig. 3), which show a shift of the radiation maximum towards longer wavelengths at later times.
Quasi-periodic or cyclic fluctuations are superimposed on this general photometric evolution. These variations can most easily be traced in the light curve, because the temporal coverage is highest, and because the effects of the temperature decline are least noticeable in V. Figure 4, which also includes observations of the Russian group (see Sect. 1), shows the fluctuations in detail. For each of the years 1996, 1997, and 1998, the linear long-term trend in brightness was removed. In 1996, oscillations of short duration (26, 22 and 16 days and some shorter ones) are superimposed on a 70 day oscillation. In 1997, a clear preference of a single oscillation with an amplitude of about in and a period of 56 days, prevailing over more than four cycles is seen. Secondary features are less important than in the year before (see also D97 and Duerbeck et al. 1998).
The 1998 observations belong already to the third stage, which is influenced by dust. It is difficult to decide whether the fluctuations seen in early and mid-1998 are still caused by a pulsation or by dust obscuration events, especially since the multicolor coverage is poor. A characteristic time scale of days is seen, but the periodicity is poorly defined, and masked by the strong brightness decline that occurred in the second half of 1998. The amplitude in has increased to .
In the fourth stage of late 1998 and of 1999, the object has faded dramatically. The poor temporal coverage, as well as the strong brightness fluctuations do not permit to study any underlying periodicities.
Summing up, the light curve between 1996 and mid-1998 can be described as being superimposed by quasiperiodic fluctuations of increasing cycle length and amplitude. Arkhipova et al. (1999) claim that the variations can be described with a single period that increases linearly with time. Their ephemeris
was used to calculate the moments of minimum light, which are shown as vertical bars for the years 1996 – 1998 in Fig. 4. While a trend towards longer periods and larger amplitudes at later times is clearly present, the representation of minima by the above formula is not satisfactory, and the occurrence of both well-expressed and marginal maxima and minima must be explained by the superposition of several pulsation modes, as was outlined in D87.
4.2 V4334 Sgr in the two-color diagrams
The growth of the photosphere and the dust formation is studied in the multi-color light curve (Fig. 3) and in two-color diagrams. The development of V4334 Sgr in the ( vs. ), ( vs. ) and ( vs. ) two-color diagrams is shown in Figs. 5 and 6. The colors are dereddened for . The observed averaged color indices for time intervals of days up to several weeks, and supplemented by observations of other authors at important phases, are given in Table 3.
The behavior of V4334 Sgr in the maximum stage is as follows. In 1996, the star was continuously cooling. In Fig. 5, it is moving along the two-color track of hydrogen-deficient carbon stars of hot to intermediate temperature, as calculated by Asplund (1997). This phase was interpreted by D97 as an object radiating at almost constant luminosity, while its photosphere is slowly moving outward with a velocity of . In 1997, the star had moved away from the two-color track, and kept similar color indices for about 150 days, indicating that the photosphere had become stationary. In the case of a pseudo-photosphere, whose location is determined by the actual mass-loss rate, this means that the mass-loss rate had stabilized.
During the dust onset and the massive dust stages, the colors show a reddening of increasing strength while the visible light of V4334 Sgr declined. The reddening increased noticeably in the deep decline of early October 1998, which is documented by observations of Jacoby & De Marco (1998). Since no magnitudes were reported, this episode is missing from Fig. 5 and is only illustrated in the other two-color diagrams (Fig. 6) and in the color-magnitude diagram (Fig. 7). In 1999, the star had become so faint in that no observations were obtained. For 1999 July, an upper limit of is derived, but the previously recorded color indices make it likely that the star was several magnitudes fainter. Our -observations show fluctuations around in 1999 March, and a minimum brightness of in 1999 July. Note that the very last and indices of 1999, which are not included in the Figures because of the lack of magnitudes, indicate a decrease in reddening in spite of the faintness of the star (see also Sect. 5).
5 Dust forming events as seen in the optical region
Theoretical, spectroscopic and photometric results have pointed out a possible relation between R CrB stars and final He flash objects like FG Sge (Gonzalez et al. 1998, Jurcsik & Montesinos 1999) and V4334 Sgr (Asplund et al. 1997, Arkhipova et al. 1999). Dust-forming events, similar to those seen in R CrB stars, have been suspected in the light curve of the rapidly evolving final He flash object V605 Aql (Harrison 1996), and have been observed in recent years in the slowly evolving final He flash object FG Sge. Already in the first papers on V4334 Sgr, a dust-forming phase was predicted (D96, Duerbeck & Pollacco 1996). The declines observed in V4334 Sgr (and first announced by Liller et al. 1998a,b) can readily be compared with those observed in the other well-observed final He flash object FG Sge and in R CrB-type variables. Fading events of R CrB and V854 Cen, observed by Cottrell, Lawson & Buchhorn (1990), Lawson & Cottrell (1989) and Lawson et al. (1992) using multicolor photometry, were useful in comparing photometric and spectroscopic characteristics of He flash objects and R CrB variables.
5.1 Pulsations and declines
R CrB and related hydrogen-deficient stars show pulsations at maximum light. Periods are days, with amplitudes of a few . A tendency towards longer periods in cooler objects is seen (Lawson et al. 1990). In the R CrB star V854 Cen, the onset of a brightness decline usually occurs near maximum light of the pulsation cycle (Lawson et al. 1992), while in RY Sgr, it occurs at minimum light (Menzies & Feast 1997).
The slowly evolving final He flash object FG Sge has shown pulsation periods ranging from 5 to 138 days, with a definitive trend to longer periods at later times, when the object had cooled (van Genderen & Gautschy 1995). After the first steep decline in 1992, FG Sge showed a nearly constant pulsation period of 115 days, and R CrB type fadings often occurred near maximum light of the pulsation (Gonzalez et al. 1998).
V4334 Sgr showed variations with cycles of days with a tendency of better defined, longer periods at later (cooler) stages, and amplitudes increasing from to . Apart from the rapid change of behavior, the pulsations of V4334 Sgr are comparable to those of R CrB stars, as well as to the pulsations of FG Sge. The three observed fading events of V4334 Sgr are separated by intervals of days, and do not seem to be related to the period of stellar pulsation. The well-documented second fading of 1998 September began around a minimum phase of pulsation.
5.2 Color evolution during declines
R CrB stars show both “blue” and “red” declines (Cottrell, Lawson & Buchhorn 1990). The blue events presumably occur when the obscuring cloud is smaller than the photosphere, as seen from the observer. In a red decline of R CrB, the star moved along the line in the two-color diagram. A well-observed red decline of V854 Cen had , , .
The slowly evolving final He flash object FG Sge has only shown “blue” declines (Jurcsik & Montesinos 1999). Thus, dust formation in FG Sge has been patchy until now.
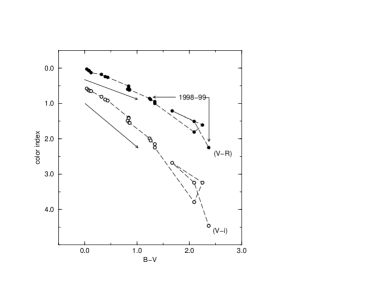
The color behavior of V4334 Sgr is complex, because the growth of the photosphere, the dust formation, and even the interstellar reddening cause similar effects in two-color diagrams. While interstellar reddening just produces a constant shift in the diagram, the first two effects can most easily be disentangled with the aid of the vs. diagram (Fig. 7). It shows that the initial dust formation episode in the line of sight did not begin until early 1998.
V4334 Sgr shows a “composite” of several red declines, indicating that in all cases the whole visible photosphere is obscured (Fig. 2). The first decline occurred at or before J.D. 2450853 (1998 February), and the star did not regain its former brightness; the second occurred around J.D. 2451045 (1998 September), and the star partly recovered; the third one occurred at or before J.D. 2451234 (1999 February), and after some fluctuations at , another decline followed, whose color characteristics are only poorly known. The value of appears to be always larger than in the case of R CrB stars. Following the onset of dust formation in 1998 February, a sequence of three normal points indicates the beginning of the fading of 1998 September (this is marked “early decline” in Fig. 5). After the deep decline in 1998 October, and the recovery in November, which was observed by Jacoby & De Marco (1998), another color index is available (marked “recovery after deep minimum”). The overall slope of the 1998 data is . This slope is substantially steeper than the slopes and observed in R CrB and V854 Cen. Whether this is caused by different dust properties or a different amount of “chromospheric emission” above the dust in these objects, cannot be decided on the basis of the available data.
The other color index ratios, , , derived for the interval 1998 – 1999 when dust obscuration was obviously present, are surprisingly similar to those observed in V854 Cen (and, cum grano salis, to the interstellar reddening lines), , . Both V854 Cen and V4334 Sgr show a tendency to yield steeper slopes at very red colors and very faint magnitudes.
Even during a “red” decline, all color indices of V854 Cen turn to smaller values at very faint magnitudes. The fragmentary data of V4334 Sgr indicate that a similar effect occurred in 1999 July, when the magnitude reached its observed minimum near , and the and indices were noticeably smaller than three months before. Whether this is also the signature of an imminent brightness recovery, as it is found in R CrB stars, cannot be said because of lack of data.
5.3 Depth and speed of declines
The deepest decline in R CrB or related stars ever observed in the visible region was (see the light curve of R CrB by Mattei, Waagen & Foster 1991). Such a level may be reached during a single fading event or by a superposition of several fading events. In the latter case, the star does not become fainter, but may simply remain for a longer time at minimum level. Concerning the speed of declines, a “red” decline of R CrB, observed by Fernie, Percy & Richer (1986), showed a maximum rate of decline of in its later stages; a rate of was observed by Cottrell et al. (1990) during a “blue” decline. During the deep red decline of V854 Cen in 1991, with a superposition of three fading events, gradients up to were observed (Lawson et al. 1992).
During 1998 – 1999, V4334 Sgr declined by in , i.e. the obscuration was at least an order of magnitude more efficient than ever observed for an R CrB star. This decline consists of several superimposed fading events, as described in Sect. 5.2. The object partially recovered from the first two events; the sparse data of 1999 indicate that V4334 Sgr is still obscured by the third fading event (it is also possible that a fourth fading event took place). The first decline was not covered by observations, the decline rates of the second and third declines were and . The speed and form of these declines resemble those of slow “red” declines of R CrB variables.
5.4 Spectroscopic features of dust shells
Dust that forms near an R CrB star experiences a strong radiation force, moves outward and drags gas with it, which is collisionally excited. R CrB, while recovering from a decline and at subsequent maximum light, showed a P Cyg line of He I 10830 extending to (Querci & Querci 1978).
In spectra of V4334 Sgr, a blueshifted absorption line of He I 10830 with an expansion velocity of was observed in 1998 March by Eyres et al. (1999), i.e. shortly after the onset of dust formation the line of sight. No line had been present in spectra taken in 1997 July. From 1998 August onward, the line shape changed to a P Cygni profile (Eyres et al. 1999, Tyne et al. 1999). During the deep minimum of 1999, the He I line was observed in emission only, and extended less to the red than the P Cyg line of the previous year. It showed a blueshift of about relative to the radial velocity of V4334 Sgr (limits and ). This indicates that (a) collisionally excited gas exists since early 1998, in agreement with the photometrically observed onset of dust formation; (b) while the stellar background faded, the line kept its strength and appeared as a P Cyg line in a semi-transparent shell; (c) after the massive dust formation, emission originating in the region moving away from the observer is almost completely obscured by dust, and only the emission originating in the hemisphere facing the observer is seen.
5.5 The infrared behavior
The infrared behavior of R CrB stars correlates poorly with dust forming events in the line of sight, which mainly influence the flux in the optical region. Since the dust cloud is small, it converts only a small fraction of the total light of the star into infrared radiation. The infrared output of an R CrB star is dominated by radiation from the overall circumstellar dust shell, which is heated by the star (and also shows the pulsational light variations observed in the star). On the other hand, the dust flux does not change significantly when the star goes into an obscuration minimum. These findings are the best evidence for the patchiness of dust formation in the atmospheres of R CrB stars (Forrest, Gillett & Stein 1972, Feast et al. 1997).
The descent to minimum in V4334 Sgr was accompanied by a complete change in its energy distribution, including a dramatic increase at infrared wavelengths (especially in the poorly observed range ). A more detailed study of the steady growth of the infrared excess is given in Sect. 6.
5.6 V4334 Sgr and R CrB stars: concluding remarks
Summing up, the fading events of V4334 Sgr in the years 1998 – 1999 show striking similarities with the “red” declines of R CrB stars. While there are differences between individual stars in the ratio, all objects show a similar behavior at longer wavelengths.
In contrast to R CrB stars, the unusually deep, long-lasting minimum, the evolution of the He I 10830 line structure, as well as the connection between optical fading and infrared brightening, indicate the formation of a complete dust shell around V4334 Sgr. The behavior of V4334 Sgr in 1998 and later should not necessarily be described as the “R CrB phase”, as Arkhipova et al. (1999) have done. R CrB stars form no complete dust shells. Its behavior shows as well striking similarities with dust-forming classical novae, as will be shown in Sect. 6.2.
6 Energy distribution and luminosity
The UBVRi photometry presented in this study can be combined with infrared photometry to a study of the overall energy distribution, the character of the infrared excess, and the time variation of the luminosity. Infrared photometry is available during each season: Feast & Whitelock (1999) for 20 well-distributed JHKL data sets, obtained between early 1996 to late 1999; Kamath & Ashok (1999) for 1996 and 1997 in JHK; Fouqué (in D96) for 1996 April in IJK; Arkhipova et al. (1998) for 1996 and 1997 in JHKLM; Kimeswenger et al. (1997) for 1997 March in IJK; Kerber et al. (1999) for 1997 and 1998 at 7 wavelengths between 4.5 and 12.0 m, observed with ISOCAM of ISO; Lynch et al. (1998) for 1998 March and May in , , ; Kaeufl & Stecklum (1998) for 1998 June in ; Jacoby (1999) for 1999 April at 1.083 and 2.230 m; Tyne et al. (1999) for 1999 April and May in JHKLM; Hinkle & Joyce (1999) for 1999 September in JHKLM.
A selection from these data was combined with quasi-simultaneous UBVRi data to construct twenty-one energy distributions of V4334 Sgr: seven for 1996, seven for 1997, three for 1998, and four for 1999. The magnitudes were dereddened for the value , and were converted into monochromatic irradiances . They are listed in Table 4. Integration over the irradiances yielded total irradiances which are also given. Selected results are shown in Fig. 8.
6.1 The evolution of the infrared excess
Figure 8 shows that an excess of radiation at wavelengths already exists during the earliest observations of 1996. This excess increases in strength in 1997, and starts to dominate the spectrum in 1998. The stellar continuum peaks at in 1996, at in 1997, between and in 1998, and possibly at in 1999. From 1998 onwards, the optical radiation of the star is extinguished and re-radiated at infrared wavelengths. In 1999, hardly a trace of the stellar contribution is visible in the energy distribution.
A preliminary discussion of the infrared energy distributions is given by Kipper (1999). Several test runs using Dusty (Ivezić, Nenkova & Elizur 1997) with parameters similar to those chosen by Kipper yielded non-optimal fits, which can possibly be explained by the different adopted value of the interstellar extinction and the different choice of the stellar atmosphere. A detailed analysis of the spectral energy distribution will be the subject of a future investigation.
Figure 8 permits estimates of the properties of the infrared excess, the character of the dust and the size of the dust forming region, and some qualitative estimates will be given. The radiation maximum of the infrared excess shifts towards longer wavelengths at later times. If the excess is approximated by a blackbody, its temperatures are 3500, 3000 2000, 830 and 725 K in 1996, 1997, 1998 and 1999, respectively. The temperatures of 1996 and 1997 are too high for the formation of carbon dust.
The infrared excess of 1996 may be explained by free-free emission in the wind or expanding atmosphere of V4334 Sgr, which at that time had a surface temperature of K. In 1997, the situation is not as clear. Woitke, Goeres & Sedlmayr (1996) have shown that carbon nucleation can take place in shocks that occur in pulsating R CrB stars with effective surface temperatures of 7000 K. Since V4334 Sgr provides similar conditions, patchy dust formation may be possible in 1997. From 1998 onward, observational evidence of dust formation is beyond doubt, as was shown in Sect. 5.2.
The angular radius of the infrared emission region, calculated from (Gallagher & Ney 1976) with in milli-arcsec and in , is 0.3, 0.8, 9.4 and 11.4 milli-arcsec for the years 1996 – 1999, respectively. Figure 9 indicates that a rapid growth of the dust shell occurred between late 1997 and early 1998.
Assuming a distance of 2 kpc for the object, the radius of the dust shell was about 19 AU in 1998, and 23 AU in 1999. If the ejection of material started in early 1995, at the time of the beginning of the final He flash, and if dust had condensed everywhere in the shell in mid-1998, the constant expansion velocity of dust-forming material is derived. Between mid-1998 and mid-1999, the shell grew with a linear velocity of , which is in good agreement with the previous value. This velocity is much larger than the rate of growth of the photosphere (about ), which was derived from the observations of 1996 (D97). Thus we may take it as evidence for a Eddington-driven outflow above the photosphere, which had been active since the beginning of the final helium flash, and had cooled to temperatures suitable for dust formation around the end of 1997.
On the other hand, we can assume that the material was ejected at a later phase of the outburst, when the outer layers had already been enriched with carbon, and that the condensing dust experienced an acceleration due to radiation pressure. Then the resulting expansion velocity is higher, and may be similar to the velocity of the central condensations of the remnant of V605 Aql ( with a FWHM of , Pollacco et al. 1992). More observations are necessary to decide between both scenarios.
6.2 The infrared evolution of V4334 Sgr and in classical novae
Final He flash objects and R CrB type stars have similar properties, as described in Sect. 5. Similarities, however, also exist between final He flash objects and dust-forming classical novae.
The infrared behavior of dust-forming classical novae consists of four phases: (a) the initial pseudo-photosphere blackbody, (b) a free-free phase, which leads to an infrared excess between 1 – 6 , (c) a rapid growth of dust, leading to a “red decline” in the optical and an increase of infrared flux, of angular diameter, and of a slight drop in dust temperature (), and (d) an exponential drop of the infrared flux and of the angular diameter, when dust is being dispersed and/or destroyed by radiation from the central source, accompanied by a recovery of UV and optical radiation (Ney & Hatfield 1978).
In 1996 and 1997, the derived blackbody temperature for the infrared excess of V4334 Sgr is too high for dust formation; it was already pointed out that the infrared excess of 1996 (and possibly 1997) is caused by free-free emission in the outflowing material that had passed the pseudo-photosphere and formed an extended atmosphere. Claims of the presence of dust with temperatures of 1500, 1800 and 680 K, in 1997 February, March and April (Kerber et al. 1999, Kimeswenger et al. 1997, Eyres et al. 1998a) are questionable and discrepant; part of the infrared excess may be carbon nucleation products, part of it may still be explained by free-free continuum emission.
At the end of 1997 or at the beginning of 1998, the temperature of the extended atmosphere had dropped below 2000 K, permitting the formation of carbon dust. This onset of dust formation lead to (1) a rapid growth of the angular size of the infrared emitting region (Fig. 9), (2) an increase of the infrared flux, and (3) several dust forming events in the line of sight, which caused first a gentle, then a dramatic drop in visible light output (Sect. 5.2).
Comparing the evolution of V4334 Sgr with that of a dust-forming classical nova, e.g. NQ Vul (Ney & Hatfield 1978) yields the following: Phase (a) occurred likely in 1995 but was not observed, phase (b) occurred in 1996 – 1997, and phase (c) in 1998 – 1999. The onset of phase (d), the destruction or dispersion of the dust, may still be far in the future: 80 years after outburst, the central object of V605 Aql is still deeply embedded in circumstellar dust, and we can expect a similar behavior for V4334 Sgr.
Tthe “speed” of a classical nova like NQ Vul to evolve through phases (a) to (c) is about 20 times faster than that of the final He flash object V4334 Sgr. One more noteworthy difference between a nova and a final He flash object exists: the spectrum emerging from the pseudo-photosphere of the nova near maximum light clearly reveals the speed of the outflowing material, and the expansion rate of the infrared dust shell (in milli-arcsecond ) can be used to determine the shell expansion parallax. High resolution spectra of V4334 Sgr described by D97, Kipper & Klochkova (1997) and Jacoby et al. (1998) show that the radial velocity of the photosphere is similar to that of the planetary nebula. In an echelle spectrum, however, taken 1996 April 23 by G. Wallerstein, the deep H absorption line shows an underlying shallow, broad absorption trough ranging from to relative to the star. This may be taken as evidence for optically thin, turbulent material which shows an average outflowing velocity of , with a wide spread in velocities. A careful study of spectral features of the wind, in combination with data of the growth of the dust shell, may permit the derivation of a shell expansion parallax.
Dust-forming novae show optically thick winds with high outflow velocities that exist for time scales of weeks; V4334 Sgr shows an optically thin wind with an outflow velocity of (or several times higher), which likely exists during all stages of the outburst. The increase of luminosity at later stages (Sect. 6.3), in combination with the cooling of the outer layers, may lead to a enhanced mass loss at later times.
6.3 Variations in luminosity and limits on the mass of V4334 Sgr
The data of Table 4 can be used to study the luminosity of V4334 Sgr at various stages of ite evolution. The total irradiances (in units of ) are also shown in Fig. 9. From 1997 onward, an ever increasing part of the luminosity is radiated at wavelengths longward of , and nothing quantitative can be said about the luminosity evolution after early 1998, because far infrared data are lacking.
The flux increased by a factor 4 from early 1996 to early 1998. This result depends only weakly on the assumed value of the interstellar extinction. It was already noted by D97 that the assumption of a constant luminosity of V4334 Sgr was not valid for the 1996 – 1997 light curve; the flux in the optical region increased by at least 30% over one year. A possible explanation of this behavior is that in early stages of the flash, a significant fraction of the energy release is used for the expansion of the object (this is also shown, implicitly, in theoretical tracks of final He flash objects, e.g. Figs. 14 and 15 in Blöcker 1995).
We take the “late”, 1997 – 1998 luminosity of V4334 Sgr as the luminosity emerging from the remnant after most of the expansional work had been done. A total irradiance of is assigned to V4334 Sgr. This can easily be converted into a radiant flux release of W, or
A high-mass post-AGB model of Blöcker (1995) has a mass of , and takes 50 years for its way from the planetary nebula nucleus back to the AGB during the final He flash; its mass may be taken as a lower limit to the mass of V4334 Sgr. The luminosity of the model is , which may serve as a reasonable lower limit to the luminosity, and thus to the distance of V4334 Sgr. Insertion in the above relation yields 5.4 kpc for V4334 Sgr. Even low-mass models of yield distances , and the assumption of Sect. 3, , is always fulfilled. If one would use the range of absolute -magnitudes of central stars of planetary nebulae as a way to estimate the mass of V4334 Sgr, the upper distance limit of 3 kpc yields a mass slightly above , which is somewhat unlikely in view of its fast evolution (see below and Sect. 7). Diagrams showing evolutionary speeds, envelope and core masses for born-again giants, as given by Blöcker & Schönberner (1997), do not cover the rapid evolution of V4334 Sgr. Nevertheless, an envelope mass of and a core mass around are reasonable guesses. The high luminosity of such an object may even give support to the “long” distance scale of 8 kpc as suggested by D97. Further research on post-AGB evolution is clearly needed to constrain the distance of V4334 Sgr.
7 Time scales
Data on the evolution of two previous final He flash objects exist: FG Sge and V605 Aql. We omit from our discussion the 17th century object CK Vul, whose nature is still not clear and whose light curve covers only the brightest stages (Harrison 1996). Data were taken from Harrison (1996), Clayton & De Marco (1997), and Jurcsik & Montesinos (1999), and compared with the present data. Table 5 gives the time scales involved.
The only existing high-quality spectrum of V605 Aql was described by Bidelman (1973) to be “very similar to the hydrogen-deficient carbon star HD 182040”, which has a type C2,2 in the old Keenan-Morgan classification, and C-HD1CH0 in the 1993 revised MK system of Keenan (Barnbaum, Stone & Keenan 1996). The appearance of the spectrum of V4334 Sgr, taken in May 1997, and analyzed by Pavlenko, Yakovina & Duerbeck (2000), is strikingly similar to that of V605 Aql, as illustrated by Clayton & De Marco (1997), and classified by Bidelman.
We compare the light curves of FG Sge, V605 Aql and V4334 Sgr in detail, taking the light curve of Harrison (1996) for V605 Aql, and assuming that maximum (or photographic) light occurred in 1968, 1919.6 and 1996.3, for the three objects, respectively. Note that Harrison’s light curve of V605 Aql shows a minimum already in 1920; this “first” dust event, however, seems to be poorly documented and will not be taken into consideration here. The following time intervals are derived: Rise from about to ( or photographic) maximum, took 74, 1.9 and 1.5 years, respectively. A comparable spectral type C2,2 was reached about 20 years, 2.1 and 1.0 years after maximum. Dust event onset, first dust event and first minor dust event were observed 24, 3 and 2.1 years after maximum. “Disappearance” due to a major dust event has not yet been observed for FG Sge, and occurred 4.4 and 2.9 years after maximum for the two other objects. The “total duration of visibility” (with moderate means) is thus 6.5 and 4.4 years for V605 Aql and V4334 Sgr, respectively. FG Sge has not yet entered the stage of faintness, and one can only compare the time from the onset of brightening to the onset of dust formation, which is 98 years for FG Sge, 4.9 years for V605 Aql, and 3.6 years for V4334 Sgr. “Averaging” the timescales of various events in the three objects, one finds that V4334 Sgr is the most rapidly evolving (and presumably the most massive) final He flash object known; V605 Aql is about 50% slower, and FG Sge is a factor of 25 – 50 slower. Extrapolating the lifetime of FG Sge to its expected disappearance due to a future major dust event yields a value of up to 220 years. Already one half of this time has elapsed; it will be interesting to monitor the future evolution of FG Sge.
8 Summary and outlook
The complete multi-color light curve of V4334 Sgr from its pre-discovery rise to the dust obscuration shows that the color indices increase quite smoothly. In 1995 – 1997, this is caused by the cooling of the expanding pseudo-photosphere of a mass-losing object that has a slowly increasing luminosity. Furthermore, the increasing infrared excess can be explained by free-free emission in an Eddington-driven outflow. Starting from 1998, brightness drops and their color characteristics mimic the “red declines” of R CrB variables. The increase in infrared flux and the behavior of the collisionally excited He I 10830 line indicate that a complete dust shell formed around the object in late 1998 – early 1999. Such a phenomenon also occurs in dust-forming classical novae.
The dust formation in V4334 Sgr, and possibly in most massive final He flash objects is “catastrophic”, i.e. a shell is formed which surrounds the whole star and which does not dissipate quickly. V605 Aql, after its disappearance in 1924, never recovered from its dust episode: plates of the Sonneberg sky patrol from 1928 – 1979, reaching (mostly photographic) magnitude 16 – 17.5, did not recover it (Fuhrmann 1981). It was only recovered at a very faint magnitude (Seitter 1985). It is quite certain that V4334 Sgr will behave in a similar way in the years to come.
Thus, final He flash objects show some similarity to R CrB stars, but apparently the onset of R CrB-like activity, at least for the quickly evolving objects like V605 Aql and V4334 Sgr, soon ends in a “catastrophic” decline, and does not extend over centuries of stellar evolution. The slowly evolving object FG Sge is also much more active than normal R CrB stars, but it has shown “blue declines”, indicating that only localized dust formation has occurred until now. It will be extremely interesting to follow the future behavior of FG Sge. Final He flash objects as we know them are obviously not settling down as “normal” R CrB stars. Possibly low-mass, very slowly evolving final He flash objects (with FG Sge possibly defining the high mass limit) are the ones that may show up as R CrB stars during extended evolutionary phases.
The rapid evolution of V4334 Sgr (and of V605 Aql) indicate that we observe here the massive objects undergoing post-AGB evolution. Models covering such masses and timescales are badly needed, in order to constrain masses, luminosities and distances of the observed events.
References
- (1) Acker, A., Ochsenbein, F., Stenholm, B., Tylenda, R., Marcout, J., Schohn, C. 1992, Strasbourg-ESO Catalogue of Galactic Planetary Nebulae, Garching: European Southern Observatory
- (2) Acker, A., Fresneau, A., Pottasch, S.R., Jasniewicz, G. 1998, A&A, 337, 253
- (3) Arkhipova, V.P., Noskova, R.I. 1997, Astronomy Letters, 23, 623
- (4) Arkhipova, V.P., Esipov, V.F., Noskova, R.I., Sokol, G.V., Tatarnikov, A.M., Shenavrin, V.I., Yudin, B.F., Munari, U., Rejkuba, M. 1998, Astronomy Letters, 24, 248
- (5) Arkhipova, V.P., Noskova, R.I., Esipov, V.F., Sokol, G.V. 1999, Astronomy Letters, 25, 615
- (6) Asplund, M. 1997, private communication
- (7) Asplund, M. 1998, A&A, 330, 641
- (8) Asplund, M., Gustafsson, B., Lambert, D.L., Rao, N.K. 1997, A&A, 321, L17
- (9) Barnbaum, C., Stone, R.P.S., Keenan, P.C. 1996, ApJS, 105, 419.
- (10) Bath, G.T., Harkness, R.P. 1989, in Classical Novae, eds. M.F. Bode and A. Evans, Chichester: J. Wiley, p. 61
- (11) Bidelman, W.P. 1973, BAAS, 5, 442
- (12) Blöcker, T. 1995, A&A, 299, 755
- (13) Blöcker, T., Schönberner, D. 1997, A&A, 324, 991
- (14) Clayton, G.C.,1996, PASP, 108, 225
- (15) Clayton, G.C., De Marco, O. 1997, AJ, 114, 2679
- (16) Cottrell, P.L., Lawson, W.A., Buchhorn, M. 1990, MNRAS, 244, 149
- (17) Duerbeck, H.W., Benetti, S., 1996, ApJ, 468, L111 (D96)
- (18) Duerbeck, H.W., Pollacco, D., 1996, IAU Circ., 6328
- (19) Duerbeck, H.W., Benetti, S., Gautschy, A., van Genderen, A., Kemper, C., Liller, W., Thomas, T. 1997, AJ, 114, 1657 (D97)
- (20) Duerbeck, H.W., van Genderen, A., Gautschy, A., Pavlenko, Ya.V., Brogt, E., Janson, M., Jones, A.F., Kurk, J., Liller, W., Sterken, C., Voskes, T. 1998, in Unsolved Problems in Stellar Evolution, poster papers from the STScI Symposium, ed. M. Livio, May 1998, p. 17
- (21) Eyres, S.P.S., Evans, A., Geballe, T.R., Salama, A., Smalley, B. 1998, MNRAS, 298, L37
- (22) Eyres, S.P.S., Richards, A.M.S., Evans, A., Bode, M.F. 1998, MNRAS, 297, 905
- (23) Eyres, S.P.S., Smalley, B., Geballe, T.R., Evans, A. Asplund, M., Tyne, V.H. 1999, MNRAS, 307, L11
- (24) Feast, M.W., Carter, B.S., Roberts, G., Marang, F., Catchpole, R.M. 1997, MNRAS, 285, 317
- (25) Feast, M., Whitelock, P.A. 1999, private communication
- (26) Fernie, J.D., Percy, J.R., Richer, M.G. 1986, PASP, 98, 605
- (27) Fuhrmann, B. 1981, Mitt. Veränd. Sterne (Sonneberg), 9, 13
- (28) Gallagher, J.S., Ney, E.P., 1976, ApJ, 204, L35
- (29) van Genderen, A.M., Gautschy, A. 1995, A&A, 294, 453
- (30) Gonzalez, G., Lambert, D.L., Wallerstein, G., Kameswara Rao, N., Smith, V.V., McCarthy, J.K. 1998, ApJS, 114, 133
- (31) Guinan, E.F., Dewarf, L.E., McCook, G.P., Dituro, P., Mittal, R., Margheim, S.J., 1998, BAAS, 193, 1510
- (32) Hakkila, J., Myers, J.M., Stidham, B.J., Hartmann, D.H. 1997, AJ, 114, 2043
- (33) Harrison, T.E. 1996, PASP, 108, 1112
- (34) Hinkle, K., Joyce, R. 1999, IAU Circ., 7266
- (35) Iben jr., I., MacDonald, J. 1995, in White Dwarfs, eds. D. Koester & K. Werner, Springer, Berlin, p. 48
- (36) Ivezić, Z., Nenkova, M., Elizur, M. 1997, User Manual for Dusty, University of Kentucky
- (37) Jacoby, G. 1979, PASP, 91, 754
- (38) Jacoby, G. 1999, IAU Circ., 7155
- (39) Jacoby, G., De Marco, O. 1998, IAU Circ., 7065
- (40) Jacoby, G., De Marco, O., Sawyer, D.G. 1998, AJ, 116, 1367
- (41) Jurcsik, J., Montesinos, B. 1999, New Astronomy Reviews, 43, 415
- (42) Kamath, U.S., Ashok, N.M. 1999, MNRAS, 302, 512
- (43) Kaeufl, H.U., Stecklum, B. 1998, IAU Circ., 6938
- (44) Kerber, F., Blommaert, J.A.D.L., Groenewegen, M.A.T., Kimeswenger, S., Käufl, H.U., Asplund, M., 1999, A&A, 350, L27
- (45) Kimeswenger, S., Gratl, H., Kerber, F., Fouqué, P., Kohle, S., Steele, S. 1997, IAU Circ., 6608
- (46) Kimeswenger, S., Kerber, F. 1998, A&A, 330, L41
- (47) Kipper, T. 1999, Inf. Bull. Variable Stars, 4707
- (48) Kipper, T., Klochkova, V.G. 1997, A&A, 324, L65
- (49) Lawson, W.A., Cottrell, P.L. 1989, MNRAS, 240, 689
- (50) Lawson, W.A., Cottrell, P.L., Kilmartin, P.M., Gilmore, A.C. 1990, MNRAS, 247, 91
- (51) Lawson, W.A., Cottrell, P.L., Gilmore, A.C., Kilmartin, P.M. 1992, MNRAS, 256, 339
- (52) Liller, W., Janson, M., Duerbeck, H.W., van Genderen, A.M. 1998a, IAU Circ., 6825
- (53) Liller, W., Duerbeck, H.W., van der Meer, A., van Genderen, A.M. 1998b, IAU Circ., 7049
- (54) Lynch, D.K., Russell, R.W., Rice, C.J., Sitko, M. 1998, IAU Circ., 6952
- (55) Margheim, S.J., Guinan, E.F., McCook, G.P. 1997, BAAS, 191, 4301
- (56) Mattei, J.A., Waagen, E.O., Foster, E.G. 1991, R Coronae Borealis light curves: 1843 – 1990, AAVSO Monograph No. 4, Cambridge, Mass.
- (57) Menzies, J.W., Feast, M.W. 1997, MNRAS, 285, 358
- (58) Nakano, S., Benetti, S., Duerbeck, H.W. 1996, IAU Circ., 6322
- (59) Ney, E.P., Hatfield, B.F. 1976, ApJ, 219, L111
- (60) Pavlenko, Ya.V., Yakovina, L.A., Duerbeck, H.W. 2000, A&A, in press
- (61) Pollacco, D. 1999, MNRAS, 304, 127
- (62) Querci, M., Querci, F. 1978, A&A, 70, L45
- (63) Takamizawa, K. 1997, VSOLJ Variable Star Bulletin, 25, 4
- (64) Seitter, W.C. 1985, Mitt. Astr. Ges., 63, 181
- (65) Tyne, V.H., Eyres, S.P.S., Geballe, T.R., Evans, A., Smalley, B., Duerbeck, H.W., Asplund, M. 1999, MNRAS, submitted
- (66) Werner, K., Dreizler, S., Rauch, T., Koesterke, L., Heber, U. 1999, in IAU Symp. 191, Asymptotic Giant Branch Stars, eds. T. Le Bertre, A. Lèbre, and C. Waelkens (San Francisco: ASP)
- (67) Woitke, P., Goeres, A., Sedlmayer, E. 1996, A&A, 313, 217
| J.D.hel. | observer | |||||
|---|---|---|---|---|---|---|
| 2450000+ | ||||||
| 504.884 | 10.95 | WL | ||||
| 514.867 | 11.05 | 9.18 | TV | |||
| 515.877 | 11.04 | 9.18 | TV | |||
| 516.889 | 11.04 | 9.18 | TV | |||
| 516.913 | 11.04 | WL | ||||
| 517.882 | 11.04 | 9.19 | TV | |||
| 518.875 | 11.04 | 9.19 | TV | |||
| 519.889 | 11.04 | 9.20 | TV | |||
| 520.901 | 11.02 | 9.20 | TV | |||
| 521.907 | 11.02 | 9.18 | TV | |||
| 521.906 | 10.99 | WL | ||||
| 522.884 | 11.02 | 10.01 | 9.18 | TV | ||
| 523.861 | 11.02 | 9.18 | TV | |||
| 539.914 | 13.49 | 12.60 | 10.92 | 9.93 | 8.96 | MT |
| 555.896 | 13.32 | 12.46 | 10.86 | 9.82 | 8.94 | SB |
| 556.924 | 13.37 | 12.50 | 10.86 | 9.86 | 8.94 | SB |
| 557.728 | 10.82 | WL | ||||
| 563.769 | 10.95 | WL | ||||
| 570.701 | 11.10 | WL | ||||
| 574.710 | 11.12 | WL | ||||
| 581.679 | 11.06 | WL | ||||
| 587.803 | 11.09 | WL | ||||
| 590.705 | 11.03 | WL | ||||
| 593.660 | 13.40 | 12.61 | 11.00 | 9.93 | 9.04 | EB |
| 595.795 | 13.47 | 12.64 | 10.97 | 9.92 | 9.02 | EB |
| 596.723 | 13.49 | 12.60 | 10.96 | 9.91 | 9.04 | EB |
| 600.822 | 12.57 | 10.96 | 9.91 | 8.98 | EB | |
| 601.608 | 13.51 | 12.62 | 10.96 | 9.90 | 8.98 | EB |
| 601.640 | 10.94 | WL | ||||
| 604.577 | 10.93 | WL | ||||
| 605.771 | 13.53 | 12.61 | 10.96 | 9.87 | 8.97 | EB |
| 605.644 | 10.93 | WL | ||||
| 606.857 | 13.41 | 12.58 | 10.95 | 9.86 | 8.94 | EB |
| 607.670 | 13.43 | 12.57 | 10.94 | 9.84 | 8.94 | EB |
| 608.824 | 13.48 | 12.57 | 10.97 | 9.86 | 8.94 | EB |
| 613.763 | 13.55 | 12.58 | 10.98 | 9.89 | 8.95 | EB |
| 615.630 | 13.44 | 12.61 | 10.98 | 9.88 | 8.95 | EB |
| 615.656 | 10.97 | WL | ||||
| 616.840 | 13.44 | 12.61 | 10.97 | 9.86 | 8.94 | EB |
| 617.614 | 10.93 | WL | ||||
| 618.712 | 13.46 | 12.60 | 10.97 | 9.88 | 8.94 | EB |
| 621.648 | 10.89 | WL | ||||
| 623.748 | 10.96 | WL | ||||
| 624.506 | 10.96 | WL | ||||
| 625.496 | 10.93 | WL | ||||
| 626.501 | 10.93 | WL | ||||
| 627.486 | 10.88 | WL | ||||
| 628.510 | 10.93 | WL | ||||
| 629.539 | 10.96 | WL | ||||
| 630.503 | 10.93 | WL |
| J.D.hel. | observer | |||||
|---|---|---|---|---|---|---|
| 2450000+ | ||||||
| 632.515 | 10.89 | WL | ||||
| 633.546 | 10.91 | WL | ||||
| 634.499 | 10.88 | WL | ||||
| 640.569 | 10.97 | WL | ||||
| 642.503 | 10.91 | WL | ||||
| 643.482 | 10.92 | WL | ||||
| 644.482 | 10.91 | WL | ||||
| 645.478 | 10.92 | WL | ||||
| 646.474 | 10.96 | WL | ||||
| 649.478 | 10.94 | WL | ||||
| 651.516 | 10.86 | WL | ||||
| 652.500 | 10.86 | WL | ||||
| 653.497 | 10.89 | WL | ||||
| 655.512 | 10.87 | WL | ||||
| 661.476 | 10.85 | WL | ||||
| 662.484 | 10.77 | WL | ||||
| 683.548 | 13.38 | 12.50 | 10.85 | 9.74 | 8.77 | JK |
| 684.542 | 13.45 | 12.49 | 10.86 | 9.74 | 8.79 | JK |
| 685.506 | 10.86 | 8.80 | JK | |||
| 686.502 | 10.84 | 8.80 | JK | |||
| 687.520 | 10.86 | 8.82 | JK | |||
| 687.597 | 10.87 | 8.82 | JK | |||
| 689.496 | 10.87 | 8.82 | JK | |||
| 690.509 | 10.88 | 8.82 | JK | |||
| 692.468 | 10.92 | 8.83 | JK | |||
| 694.496 | 13.50 | 12.58 | 10.92 | 9.80 | 8.87 | JK |
| 696.506 | 10.94 | 8.86 | JK | |||
| 697.493 | 10.95 | 8.86 | JK | |||
| 698.495 | 10.97 | 8.87 | JK | |||
| 699.490 | 10.96 | 8.87 | JK | |||
| 700.487 | 10.96 | 8.86 | JK | |||
| 701.488 | 10.95 | 8.86 | JK | |||
| 703.490 | 10.94 | 8.85 | JK | |||
| 704.491 | 10.94 | 8.86 | JK | |||
| 705.508 | 13.40 | 12.60 | 10.94 | 9.83 | 8.86 | JK |
| 706.502 | 10.93 | 8.86 | JK | |||
| 707.498 | 13.44 | 12.60 | 10.93 | 9.81 | 8.86 | JK |
| 712.468 | 12.56 | 10.88 | CS | |||
| 713.463 | 12.54 | 10.85 | CS | |||
| 714.471 | 12.53 | 10.85 | CS | |||
| 722.535 | 10.79 | WL | ||||
| 725.486 | 10.86 | WL | ||||
| 727.522 | 10.80 | WL | ||||
| 728.494 | 10.80 | WL | ||||
| 737.477 | 12.56 | 10.87 | CS | |||
| 741.485 | 12.58 | 10.90 | CS | |||
| 743.500 | 10.86 | WL | ||||
| 743.506 | 10.92 | CS | ||||
| 745.517 | 10.92 | WL | ||||
| 746.496 | 10.93 | WL |
| J.D.hel. | observer | |||||
|---|---|---|---|---|---|---|
| 2450000+ | ||||||
| 750.511 | 10.90 | WL | ||||
| 752.499 | 10.90 | WL | ||||
| 761.513 | 10.88 | WL | ||||
| 765.519 | 10.84 | WL | ||||
| 769.520 | 10.75 | WL | ||||
| 773.522 | 10.76 | WL | ||||
| 853.850 | 11.88 | WL | ||||
| 853.886 | 12.20 | WL | ||||
| 854.853 | 12.15 | WL | ||||
| 856.885 | 12.22 | 9.78 | MJ | |||
| 857.900 | 15.21 | 14.17 | 12.27 | 10.97 | 9.83 | MJ |
| 858.842 | 14.96 | 14.17 | 12.30 | 10.98 | 9.84 | MJ |
| 859.882 | 15.04 | 14.24 | 12.34 | 11.03 | 9.87 | MJ |
| 860.877 | 15.20 | 14.27 | 12.36 | 11.04 | 9.88 | MJ |
| 862.858 | 15.10 | 14.26 | 12.34 | 11.05 | 9.90 | MJ |
| 865.899 | 14.32 | 12.36 | 11.05 | 9.85 | MJ | |
| 866.864 | 99.00 | 12.34 | 11.05 | 9.86 | MJ | |
| 868.882 | 15.31 | 14.31 | 12.36 | 11.04 | 9.89 | MJ |
| 869.894 | 15.22 | 14.35 | 12.37 | 11.06 | 9.89 | MJ |
| 870.399 | 15.24 | 14.37 | 12.40 | 11.07 | 9.89 | MJ |
| 871.894 | 15.16 | 14.46 | 12.40 | 11.08 | 9.90 | MJ |
| 872.393 | 15.16 | 14.40 | 12.41 | 11.09 | 9.91 | MJ |
| 873.893 | 15.37 | 14.41 | 12.41 | 11.10 | 9.92 | MJ |
| 874.897 | 15.28 | 14.45 | 12.43 | 11.11 | 9.91 | MJ |
| 875.841 | 12.40 | WL | ||||
| 875.899 | 15.36 | 14.47 | 12.43 | 11.11 | 9.92 | MJ |
| 876.901 | 15.48 | 14.48 | 12.46 | 11.11 | 9.92 | MJ |
| 877.909 | 15.42 | 14.46 | 12.46 | 11.10 | 9.92 | MJ |
| 878.906 | 15.47 | 14.48 | 12.45 | 11.11 | 9.91 | MJ |
| 879.883 | 12.54 | WL | ||||
| 880.876 | 12.55 | WL | ||||
| 881.911 | 15.44 | 14.48 | 12.43 | 11.08 | 9.89 | MJ |
| 887.847 | 14.33 | 12.30 | CS | |||
| 888.843 | 14.31 | 12.29 | CS | |||
| 890.825 | 12.33 | WL | ||||
| 890.869 | 14.28 | 12.17 | CS | |||
| 891.888 | 12.34 | WL | ||||
| 891.896 | 14.26 | 12.23 | CS | |||
| 892.811 | 14.25 | 12.22 | CS | |||
| 893.915 | 15.52 | 14.28 | 12.22 | 10.86 | 9.71 | HD |
| 894.850 | 12.34 | WL | ||||
| 894.921 | 15.38 | 14.22 | 12.20 | 10.85 | 9.68 | HD |
| 895.885 | 15.31 | 14.23 | 12.20 | 10.85 | 9.68 | HD |
| 896.809 | 12.29 | WL | ||||
| 897.816 | 12.36 | WL | ||||
| 899.837 | 12.20 | WL | ||||
| 901.818 | 12.22 | WL | ||||
| 909.872 | 12.22 | WL | ||||
| 910.788 | 12.25 | WL | ||||
| 918.881 | 14.02 | 12.01 | TA |
| J.D.hel. | observer | |||||
|---|---|---|---|---|---|---|
| 2450000+ | ||||||
| 919.871 | 12.11 | WL | ||||
| 921.753 | 12.19 | WL | ||||
| 922.793 | 11.97 | TA | ||||
| 923.693 | 12.14 | WL | ||||
| 925.670 | 12.19 | WL | ||||
| 926.782 | 12.11 | WL | ||||
| 927.701 | 12.02 | WL | ||||
| 931.770 | 11.93 | WL | ||||
| 934.764 | 11.84 | WL | ||||
| 937.716 | 11.79 | WL | ||||
| 941.741 | 11.84 | WL | ||||
| 949.801 | 11.88 | WL | ||||
| 950.723 | 11.65 | 9.28 | PW | |||
| 963.625 | 12.20 | WL | ||||
| 965.711 | 12.39 | WL | ||||
| 971.701 | 12.36 | WL | ||||
| 980.628 | 12.07 | WL | ||||
| 994.498 | 11.86 | WL | ||||
| 996.647 | 11.77 | WL | ||||
| 997.508 | 11.78 | WL | ||||
| 1000.505 | 11.71 | WL | ||||
| 1004.522 | 11.66 | WL | ||||
| 1007.495 | 11.65 | WL | ||||
| 1011.517 | 11.65 | WL | ||||
| 1012.478 | 11.66 | WL | ||||
| 1013.542 | 11.71 | WL | ||||
| 1014.466 | 11.67 | WL | ||||
| 1016.520 | 11.72 | WL | ||||
| 1019.506 | 11.84 | WL | ||||
| 1020.491 | 11.77 | WL | ||||
| 1023.484 | 12.02 | WL | ||||
| 1026.517 | 12.06 | WL | ||||
| 1029.486 | 12.27 | WL | ||||
| 1031.489 | 12.12 | WL | ||||
| 1034.510 | 12.36 | WL | ||||
| 1034.717 | 15.58 | 14.26 | 12.29 | 10.95 | 9.80 | JA |
| 1035.531 | 12.33 | 9.80 | JA | |||
| 1036.481 | 12.48 | WL | ||||
| 1036.773 | 12.38 | 9.86 | JA | |||
| 1037.520 | 12.30 | WL | ||||
| 1037.640 | 12.47 | 9.94 | JA | |||
| 1038.527 | 12.55 | WL | ||||
| 1038.664 | 12.54 | 9.99 | JA | |||
| 1039.492 | 12.68 | WL | ||||
| 1039.637 | 12.61 | 10.04 | JA | |||
| 1040.752 | 12.63 | 10.07 | JA | |||
| 1041.610 | 16.26 | 14.81 | 12.72 | 11.34 | 10.15 | JA |
| 1042.700 | 12.76 | 10.15 | JA | |||
| 1043.519 | 12.76 | WL | ||||
| 1043.549 | 12.80 | 10.19 | JA |
| J.D.hel. | observer | |||||
|---|---|---|---|---|---|---|
| 2450000+ | ||||||
| 1044.696 | 12.84 | 10.23 | JA | |||
| 1045.677 | 12.88 | 10.26 | JA | |||
| 1046.666 | 12.92 | 10.28 | JA | |||
| 1047.647 | 12.94 | 10.30 | JA | |||
| 1048.664 | 16.74 | 15.11 | 12.98 | 11.54 | 10.30 | JA |
| 1049.549 | 12.98 | 10.32 | JA | |||
| 1051.624 | 16.82 | 15.18 | 13.01 | 11.56 | 10.35 | JA |
| 1052.724 | 12.98 | 10.36 | JA | |||
| 1053.481 | 13.04 | 10.38 | JA | |||
| 1054.541 | 13.07 | 10.38 | JA | |||
| 1055.549 | 16.84 | 15.22 | 13.07 | 11.64 | 10.40 | JA |
| 1059.668 | 15.28 | 13.14 | 11.68 | 10.46 | JA | |
| 1061.659 | 13.20 | 10.55 | JA | |||
| 1062.661 | 17.01 | 15.34 | 13.27 | 11.82 | 10.59 | JA |
| 1063.576 | 17.11 | 15.53 | 13.32 | 11.88 | 10.63 | CS |
| 1064.579 | 15.50 | 13.39 | CS | |||
| 1065.578 | 17.22 | 15.55 | 13.43 | 11.97 | 10.74 | CS |
| 1067.593 | 17.40 | 15.74 | 13.64 | 12.16 | 10.91 | CS |
| 1068.626 | 17.56 | 15.85 | 13.72 | 12.25 | 10.98 | CS |
| 1069.619 | 17.66 | 15.99 | 13.85 | 12.38 | 11.08 | CS |
| 1070.554 | 17.83 | 16.11 | 13.96 | 12.47 | 11.19 | CS |
| 1071.501 | 14.03 | WL | ||||
| 1071.625 | 17.98 | 16.24 | 14.10 | 12.55 | 11.29 | CS |
| 1072.617 | 18.28 | 16.45 | 14.26 | 12.73 | 11.42 | CS |
| 1074.475 | 14.23 | WL | ||||
| 1075.506 | [15. | WL | ||||
| 1078.515 | [15. | WL | ||||
| 1081.532 | [15. | WL | ||||
| 1094.529 | [15. | WL | ||||
| 1097.521 | [15. | WL | ||||
| 1101.509 | [15. | WL | ||||
| 1110.509 | [15. | WL | ||||
| 1115.529 | [15. | WL | ||||
| 1125.516 | 19.75 | 17.62 | 15.14 | 13.42 | 11.94 | AM |
| 1126.524 | 19.82 | 17.60 | 15.14 | 13.43 | 11.93 | AM |
| 1127.507 | 17.69 | 15.17 | 13.44 | 11.97 | AM | |
| 1128.514 | 15.20 | 11.98 | AM | |||
| 1129.507 | 17.69 | 15.21 | 13.45 | 11.98 | AM | |
| 1130.503 | 15.22 | 12.00 | AM | |||
| 1130.628 | 15.13 | WL | ||||
| 1234.87 | 19.187 | 16.45 | 14.54 | 12.82 | RD | |
| 1235.86 | 16.61 | 12.93 | RD | |||
| 1236.89 | 16.81 | 13.06 | RD | |||
| 1238.87 | 20.31 | 17.26 | 15.15 | 13.34 | RD | |
| 1260.837 | 20.10 | CS | ||||
| 1261.871 | 19.90 | CS | ||||
| 1262.857 | 19.67 | CS | ||||
| 1263.866 | 20.15 | CS | ||||
| 1264.876 | 19.92 | CS | ||||
| 1265.910 | 19.84 | CS | ||||
| 1267.865 | 20.08 | 17.72 | 15.56 | CS | ||
| 1368.06 | [23.48 | 22.10 | 20.87 | 18.51 | TN |
| Object | (pc) | source | comment | |||
|---|---|---|---|---|---|---|
| NGC 6720 | 704 | USNO | 15.3 | 0.21 | 5.85 | Ring nebula |
| NGC 6853 | 380 | USNO | 13.66 | 0.50 | 5.36 | |
| NGC 7293 | 213 | USNO | 13.10 | 0.08 | 6.38 | Helix nebula |
| Abell 31 | 211 | USNO | 15.20 | 0.07 | 8.51 | |
| Abell 36 | 243 | Hipp | 11.28 | 0.10 | 4.25 | |
| Abell 74 | 752 | USNO | 16.91 | 0.25 | 7.28 | |
| PHL 932 | 110 | Hipp | 11.83 | 0.09 | 6.53 | |
| PW1 | 433 | USNO | 15.3 | 0.29 | 6.83 | |
| Sh 216 | 130 | USNO | 12.3 pg | 0.26 | 6.47 |
| J.D. | reference | |||||
|---|---|---|---|---|---|---|
| 2450136 | 11.29 | 0.84 | 0.53 | 1.11 | ||
| 2450144 | 11.22 | 0.23 | 0.87 | 0.56 | 1.15 | |
| 2450173 | 11.15 | 0.28 | 0.89 | 0.58 | 1.17 | |
| 2450196 | 11.06 | 0.38 | 0.92 | 0.63 | 1.18 | |
| 2450287 | 11.03 | 0.58 | 1.12 | 0.68 | 1.34 | |
| 2450328 | 10.91 | 0.64 | 1.19 | 0.74 | 1.42 | |
| 2450350 | 10.86 | 0.67 | 1.24 | 0.76 | 1.45 | |
| 2450550 | 10.88 | 0.87 | 1.64 | 1.01 | 1.93 | |
| 2450595 | 10.98 | 0.83 | 1.64 | 1.06 | 1.95 | |
| 2450611 | 10.96 | 0.88 | 1.62 | 1.10 | 2.02 | |
| 2450684 | 10.85 | 0.92 | 1.65 | 1.12 | 2.07 | |
| 2450706 | 10.94 | 0.83 | 1.66 | 1.11 | 2.08 | |
| 2450895 | 12.21 | 1.16 | 2.04 | 1.36 | 2.52 | |
| 2451042 | 12.66 | 1.47 | 2.06 | 1.39 | 2.58 | |
| 2451059 | 13.22 | 1.64 | 2.14 | 1.45 | 2.68 | |
| 2451070 | 13.92 | 1.72 | 2.14 | 1.50 | 2.78 | |
| 2451094 | 18.09 | 2.89 | 2.31 | 4.32 | JDM | |
| 2451105 | 16.91 | 3.05 | 2.11 | 3.77 | JDM | |
| 2451126 | 15.14 | 2.18 | 2.47 | 1.71 | 3.21 | |
| 2451237 | 16.85 | 2.89 | 2.01 | 3.77 | ||
| 2451259 | 20.08 | 3.17 | 2.75 | 4.99 | J | |
| 2451267 | 20.08 | 2.36 | 4.52 | |||
| 2451368 | 22.10 | 1.23 | 3.59 | TNG |
| J.D. | LW1 | LW4 | LW5 | LW6 | LW7 | LW8 | LW9 | flux | flux | ||||||||||
|---|---|---|---|---|---|---|---|---|---|---|---|---|---|---|---|---|---|---|---|
| 0.36 | 0.44 | 0.55 | 0.67 | 0.81 | 1.25 | 1.62 | 2.2 | 3.5 | 4.5 | 5.0 | 6.0 | 6.8 | 7.7 | 9.6 | 11.3 | 14.9 | () | () | |
| 2450143 | 16.95 | 18.63 | 11.70 | 4.36 | 2.830 | 1.065 | 0.434 | 0.144 | 0.025 | 5.57 | |||||||||
| 2450148 | 17.75 | 19.69 | 12.59 | 4.70 | 2.963 | 1.126 | 0.459 | 0.151 | 0.027 | 5.90 | |||||||||
| 2450178 | 16.65 | 19.51 | 12.59 | 4.83 | 3.074 | 1.280 | 0.158 | 6.13 | |||||||||||
| 2450199 | 17.11 | 21.19 | 13.93 | 5.29 | 3.402 | 1.353 | 0.557 | 0.184 | 6.49 | ||||||||||
| 2450202 | 16.80 | 21.00 | 13.68 | 5.29 | 3.340 | 1.353 | 0.557 | 0.186 | 0.035 | 6.45 | |||||||||
| 2450326 | 11.62 | 18.80 | 15.56 | 6.98 | 4.784 | 2.145 | 0.925 | 0.315 | 0.059 | 7.54 | |||||||||
| 2450368 | 11.31 | 18.97 | 16.59 | 7.44 | 5.294 | 2.485 | 1.091 | 0.389 | 0.079 | 8.16 | |||||||||
| 2450536 | 5.99 | 12.08 | 15.85 | 8.79 | 7.939 | 4.240 | 1.592 | 0.21 | 0.10 | 0.068 | 0.044 | 0.020 | 0.0097 | 0.0033 | 12.05 | 0.46 | |||
| 2450557 | 6.69 | 13.25 | 16.75 | 9.37 | 8.086 | 4.780 | 3.236 | 1.811 | 0.813 | 12.72 | |||||||||
| 2450595 | 6.51 | 11.97 | 14.72 | 8.79 | 7.375 | 4.959 | 3.266 | 1.745 | 12.35 | ||||||||||
| 2450621 | 6.16 | 12.08 | 15.14 | 9.20 | 8.086 | 5.538 | 4.111 | 2.477 | 1.300 | 0.356 | 14.51 | ||||||||
| 2450680 | 6.63 | 13.25 | 16.91 | 10.47 | 9.457 | 7.505 | 5.081 | 3.295 | 1.845 | 0.534 | 17.34 | ||||||||
| 2450703 | 6.51 | 12.08 | 15.56 | 9.63 | 8.705 | 6.720 | 5.419 | 3.419 | 2.178 | 1.04 | 0.636 | 0.62 | 0.444 | 0.297 | 0.133 | 0.073 | 0.026 | 17.79 | 2.57 |
| 2450760 | 16.44 | 7.575 | 5.888 | 3.714 | 2.218 | 1.29 | 0.66 | 0.482 | 0.330 | 0.145 | 0.080 | 0.028 | 19.75 | 3.11 | |||||
| 2450883 | 0.994 | 2.14 | 3.94 | 3.05 | 3.371 | 4.823 | 5.224 | 4.425 | 3.034 | 1.82 | 1.07 | 0.835 | 0.550 | 0.260 | 0.138 | 0.047 | 15.71 | 4.99 | |
| 2450917 | 3.27 | 5.81 | 5.589 | 5.834 | 4.465 | 3.006 | 17.4: | ||||||||||||
| 2451115 | 0.019 | 0.120 | 0.325 | 0.353 | 0.510 | 0.710 | 2.042 | 3.205 | 3.716 | 10.8: | |||||||||
| 2451300 | 0.004 | 0.079 | 0.589 | 1.506 | 2.900 | 5.3: | |||||||||||||
| 2451328 | 0.069 | 0.490 | 1.336 | 2.643 | 4.9: | ||||||||||||||
| 2451380 | 0.0005 | 0.0004 | 0.0012 | 0.019 | 0.250 | 0.859 | 4.2: | ||||||||||||
| 2451456 | 0.232 | 0.908 | 2.667 | 2.0 | 4.2: |
| Object | FG Sge | V605 Aql | V4334 Sge |
|---|---|---|---|
| brightness increase (spectrum) | 1894-1975 [B-G2 I] | 1917.7-1918 | 1994.8-1995 |
| time of brightness maximum in (spectrum) | 1968 [A3 I] | 1919.6 | B 1996.3 [F0] |
| spectrum at later stage | G-K0 I in 1980s | C2,2 in 1921.7 | C2,2 in 1997.3 |
| onset of dust formation | 1992 | 1922.6 (?) | 1998.4 |
| dramatic decline (“disappearance”) | ? | 1924 | 1999.2 |