08.14.1; 08.16.7 PSR J02184232; 13.25.5 11institutetext: Istituto di Fisica Cosmica ed Applicazioni all’Informatica CNR, Via U. La Malfa 153, I-90146, Palermo, Italy 22institutetext: SRON-Utrecht, Sorbonnelaan 2, 3584 CA Utrecht, The Netherlands 33institutetext: Istituto Astronomico, Unita’ GIFCO Roma-1, Universita’ ”La Sapienza”, Via Lancisi 29, I-00161, Roma, Italy 44institutetext: Max-Planck-Institut für Extraterrestrische Physik, D-85740 Garching bei München, Germany 55institutetext: Astronomical Institute Utrecht University, P.O. Box 80000, 3508 TA Utrecht, The Netherlands 66institutetext: University of Manchester, Jodrell Bank, Macclesfield SK11 9DL, United Kingdom 77institutetext: Department of Physics, Yamagata University, Kojirakawa, Yamagata 990-8560, Japan
T. Mineo: mineo@ifcai.pa.cnr.it
The pulse shape and spectrum of the millisecond pulsar PSR J02184232 in the energy band 1-10 keV observed with BeppoSAX
Abstract
We present the results of a BeppoSAX observation of PSR J02184232 which, for the first time, provides detailed information on the pulsar’s temporal and spectral emission properties in the broad band 1–10 keV. We detected X-ray pulses with a pulsed fraction of 7312 %. The pulse profile is characterized by two peaks phase separated by . The pulsed spectrum is best described by a power–law of photon index 0.610.32 with an unabsorbed (2–10 keV) X-ray flux of 4.110-13 erg cm-2 s-1 implying a luminosity of erg s-1 and an X-ray efficiency of where is the solid angle spanned by the emission beam.
keywords:
Stars: neutron, Pulsar: individual: PSR J02184232, X-rays: stars1 Introduction
PSR J02184232 is a 2.3 ms pulsar in a two day orbit around a 0.2 M⊙ white dwarf companion (Navarro et al. 1995) with a period derivative of s s-1. The pulsar has a spin-down energy of erg s-1, a dipolar magnetic field component at the star surface of G and a spin-down age of years. The pulsar distance inferred from its dispersion measure and from the electron density model of Taylor & Cordes (1993) is kpc. A detection of the companion star at optical wavelength was reported recently by Van Kerkwijk (1996).
Soft X-ray emission from the pulsar was first detected by Verbunt et al. (1996) using the ROSAT HRI. A follow-up observation confirmed the detection and discovered X-ray pulsation at a significance of about 5 using 200 HRI counts (Kuiper et al. 1998). The X-ray pulse profile deduced from those data is characterized by a sharp main pulse with an indication of a second peak at a phase separation of . The pulsed fraction inferred from the ROSAT HRI data is 3713 %. Furthermore, Kuiper et al. (1998) show that the measured large DC component is consistent with a 14\arcsec diameter compact nebula surrounding the pulsar, but confirmation is required. However, it is interesting to note that also in the radio domain the source exhibits an unusually high DC component of 50 % (Navarro et al. 1995). The HRI provides no spectral information and the number of counts recorded in a serendipitous off–axis PSPC observation does not allow spectral modeling. Also ASCA detected this source, however, the observation was too short: no pulsation could be seen, and a spectral fit with a power–law photon index of 1.60.6 could only be made to the weak total excess (Kawai & Saito 1999). Therefore, no detailed spectral information on the pulsed X-ray emission was available prior to the BeppoSAX observation reported in this paper (see Becker & Trümper 1999 for a review of the X-ray properties of millisecond pulsars).
Noting the spatial coincidence of PSR J0218+4232 with the EGRET source 2EG J0220 + 4228, Verbunt et al. (1996) tentatively identified the pulsar with the high-energy -ray source. Using some additional EGRET observations, and applying a combination of spatial and timing analysis, Kuiper et al. (1999) conclude that 2EG J02204228 is probably a multiple source: between 0.1 and 1 GeV PSR J02184232 is the most likely counterpart, and above 1 GeV the bright BL Lac 3C 66A is the best candidate counterpart. The third EGRET catalog (Hartman et al. 1999), which is based on more viewing periods than the 2EG catalog, identifies 3EG J02224253 (2EG J02204228) with 3C 66A, rather than with the ms-pulsar. However, in a note on this source, they indicate that the identification with 3C 66A stems from the catalog position based on the 1 GeV map. Furthermore, they confirm that for lower energies (100-300 MeV) the EGRET map is consistent with all the source flux coming from the pulsar, 3C 66A being statistically excluded.
In this paper we present the results of a BeppoSAX observation of PSR J02184232 which, for the first time, provides detailed information on the pulsar’s temporal and spectral emission properties across a wide band from 1 to 10 keV.
2 Observation
PSR J02184232 was observed on January 1999 14–16 by the Narrow Field Instruments (NFIs) aboard BeppoSAX satellite (Boella et al. 1997a). We report in this paper only results from data collected with the MECS instrument (Boella et al. 1997b), sensitive in the energy range 1-10 keV; the net exposure time was 82 795 s. The LECS instrument (0.1–10 keV; Parmar et al. 1997) observed the source for a much shorter time due to the constraint on operating only during spacecraft night. The HPGSPC (4–60 keV; Manzo et al. 1997) was not working during the observation. A signal detected with the PDS (13–200 keV; Frontera et al. 1997) will be shortly discussed in Section 5. No pulsed signals have been detected in the LECS and PDS data.
During the observation only two of the three MECS detectors were operating (MECS2 and MECS3). MECS has a field of view of and an angular resolution of about 1\farcm2 at 6 keV. During the observation of PSR J02184232 the instrument operated in direct mode, transmitting to ground information on each individual photon. Standard procedures and selection criteria were applied on the observation data to avoid the South Atlantic Anomaly, solar, bright Earth and particle contaminations111see http://www.sdc.asi.it/software/cookbook as a reference about the data analysis software and reduction procedures.. Event reduction has been performed using the SAXDAS v.2.0.0 package.
3 Spatial analysis
A 100 ks ROSAT HRI (0.1–2.4 keV) observation of PSR J02184232 (see Kuiper et
al. 1998) revealed 7 X-ray sources within
a radius of around our target (see Fig. 1).
Given the extended tails of the MECS Point-Spread Function (PSF),
accurate spatial analysis is required to separate the signal of
PSR J02184232 from that of any neighbouring sources. We used a Maximum Likelihood
approach in searching for individual sources
on top of a background model, as well as for analyzing simultaneously several
sources and a background model.
The search is applied on various equidistant trial positions within a
selected part of the instrument field of view, where
it checks for the presence of a source taking into account the
Poissonian nature of the data.
Maximum Likelihood Ratio (MLR) tests are performed describing in the zero
hypothesis the 2-d
event distribution in terms of a flat background model only, while in the
alternative
hypothesis the data is described in terms of a point source
at the trial position and a flat background model (see e.g. Kuiper
et al. 1998 for a more detailed description).
The improvement in the likelihood between and computed from the quantity yields simultaneously the detection significance and strength of the source. The probability distribution of is that of a for degree of freedom (d.o.f.) where and are the d.o.f. for the and hypotheses, respectively. In searching for sources = 3, while in a detection test of a known source = 1. The distribution of Q as a function of trial position is the MLR–map.

We applied the above approach to the MECS data without energy selection allowing for maximum source statistics. We used an energy averaged PSF assuming a power–law spectral shape of index , given by the following expression:
where and are the sensitive areas of the two operating MECS units. The is modelled using the parametric form given in Boella et al. (1997b). Furthermore, we investigated the impact of the assumed power–law index on the MLR results and found that this is negligible, as expected by the moderate dependence on energy of the PSF.
The resulting MLR map/image is shown in Fig. 1a. The maximum value in this figure () is reached at a position consistent with that determined by the ROSAT HRI for PSR J02184232 (indicated by a star symbol). It is, however, evident that several of the sources detected by ROSAT below 2.4 keV (indicated by filled triangles) contribute significantly to the extended excess. We can show this better, by repeating the search for sources on top of a flat background model and a point source at the pulsar position (effectively “subtracting” the counts from PSR J02184232 from Fig. 1a). The remaining extended feature (Fig. 1b) clearly follows the distribution of the nearby sources, reaching detection significances up to about 10 . Figure 1c shows the MLR map resulting from a point source search on top of a flat background and 9 sources fixed at the ROSAT HRI source positions: no significant residual emission remains. The total number of counts assigned by this analysis to PSR J02184232 is 40329.
The position of PSR J02184232 determined from the MLR map shown in Fig. 1a
is shifted by 23\arcsec with respect to the radio position,
well within the systematic uncertainty of the accuracy of the BeppoSAX
pointing
reconstruction
222see http://www.sdc.asi.it/software/cookbook/attitude.html.
The spatial analysis allows also the evaluation of an optimum event
extraction radius
by computing the Signal-to-Noise ratio as a function of radial distance
from the source position. Taking as source radial profile the PSF,
and as noise the measured radial count distribution,
we obtained the value . Note that none of the nearby sources
fall within this radius.
The selected region contains 62 % (250 counts) of the MECS source signal;
the number of background
events in the same area is 92 with a contribution
from the neighbouring sources of 12 counts.
4 Timing analysis
The arrival times of all selected events were converted to the Solar System Barycentric Frame using BARYCONV333see http://www.sdc.asi.it/software/saxdas/baryconv.html, then folded according to the radio ephemeris (see Table 1), correcting for the pulsar binary motion. The pulse phase distribution deviates from a statistically flat distribution at a 6.8 level applying a test (Buccheri et al. 1983) using the first two harmonics.
The MECS timing resolution is dominated by the precision of the OBT (On Board Time)-UTC conversion: an inspection of the residuals of the OBT-UTC linear fit reveals a systematic scatter with an rms of the order of 0.2 ms that cannot be reduced by fitting higher order polynomials. This effect corresponds to an uncertainty in the photon phases of 0.087.
| Parameter | Value |
|---|---|
| Right Ascension (J2000) | 02h 18m 6\fs350 |
| Declination (J2000) | 42∘ 17\farcs44 |
| Epoch validity start/end (MJD) | 49092 – 50900 |
| Frequency | 430.4610674213 Hz |
| Frequency derivative | Hz s-1 |
| Epoch of the period (MJD) | 49996.000000023 |
| Orbital period | 175292.3020 s |
| apsin i | 1.98444 (lt-s) |
| Eccentricity | 0 |
| Longitude of periastron | 0 |
| Time of ascending node (MJD) | 49996.637640 |

The light curve resulting from folding all MECS events (1–10 keV)
with a phase resolution of 18 bins ( 0.13 ms)
is shown in Fig. 2 (top panel): two cycles are plotted for clarity.
The MECS background level, indicated with a grey band (1 errors),
is determined in the spatial analysis and therefore includes
the contributions from the neighbouring sources.
In the same figure (bottom panel) the 610 MHz profile as derived by Stairs et al.
(1999) is also presented. The phase relation between the two profiles
is unknown for the time being: they have been arbitrarily aligned.
Notice that, like in the radio light curve, the MECS profile is not simple:
it has a prominent double peak structure with a relative phase separation (centre
to centre) of 0.470.05, confirming the value derived by Kuiper et al. (1998)
from ROSAT data below 2.4 keV.
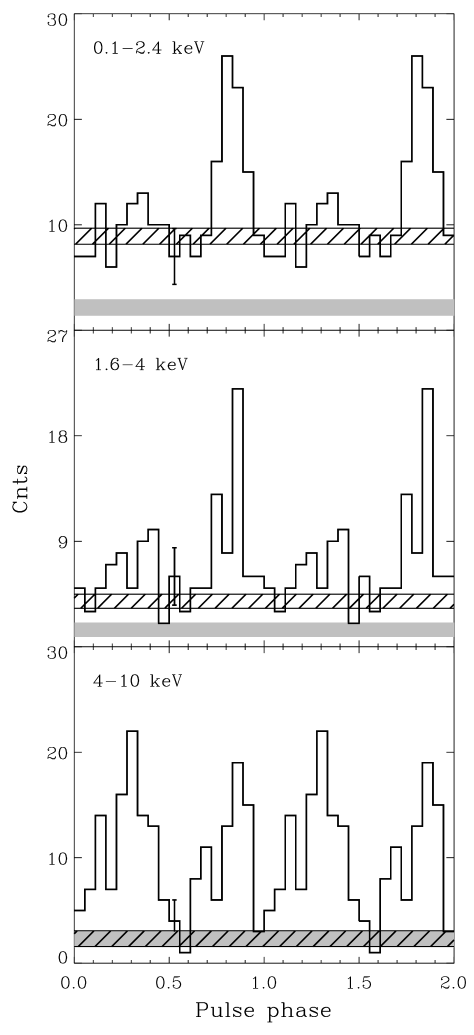
The phase histograms for 1.6–4 keV and 4–10 keV are shown respectively in
the middle and bottom panels of Fig. 3. The ROSAT (0.1–2.4 keV) profile
(Kuiper et al. 1998),
shifted in phase to obtain the highest peak coincident with the most
significant one in the MECS softer light curve (middle panel),
is also shown for
comparison in the top panel of Fig. 3. These profiles clearly show a change of the
relative peak intensities.
The peak at phase 0.8 is stronger in the low energy histograms
(top and middle panels),
while that at phase 0.3 is more prominent at high energies (bottom panel).
The structure measured in the MECS light curves of two peaks separated by narrow valleys and the uncertainty due to the OBT–UTC conversion residuals make it difficult to establish an unpulsed interval: slightly different values could affect the unpulsed level. Notice, moreover, that while in the ROSAT profile a DC component is apparent above the background level, the same does not hold for the 4–10 keV profile, where the background level is consistent with those measured in the valleys of the light curve. In the intermediate energy profile, at face value, there might be some evidence of a DC component but not as high as in the ROSAT profile. Such effect could be due to the presence of a quite soft unpulsed emission. In an attempt to quantify the evidence for a DC component, we applied the bootstrap method proposed by Swanepoel et al. (1996), which allows to estimate the DC level, and therefore also the pulsed fraction, working directly on the phases of individual photons. However, in the available form, this method is able to find only one unpulsed interval and cannot account for systematic errors. One should therefore realize that the quoted errors on the calculated parameters are only statistical. Using this algorithm we found, for the whole MECS energy band, an unpulsed interval of – and a corresponding pulsed fraction of 0.730.12 (1 error). Notice that the average count level in the interval – is statistically not different from that measured in the former interval. The resulting DC–fractions for the three bands of Fig. 3 are shown in Fig. 4. The decrease with energy is clearly visible, but the error bars are large and the trend deviates only at the 2.4 level from a flat distribution. Given the large error bars and the systematic uncertainties, we did not derive a detailed spectrum of the DC component.
The relatively high scatter in the residuals of our timing solution (up to 0.2 ms) does not allow to determine accurately the intrinsic widths of the two pulses. The total scatter in the event arrival times at the SSB might even be consistent with the measured width of P1 in Figure 2.
We defined the phase intervals containing the two pulses as follows: Peak 1 (P1) phase interval 0.61-0.95 and Peak 2 (P2) 0.10-0.47, where P1 is identified with the obvious ROSAT peak and appears to have a softer spectrum than P2. The statistical significance of the suggested change in morphology of the phase histogram with energy can be evaluated by the P2/P1 ratio. This ratio, computed in the energy bands 1.6–4 keV and 4–10 keV after background subtraction, is shown in Fig. 5. The ROSAT point derived from the data of Kuiper et al. (1998), indicated by a filled circle, is evaluated using the same phase definitions. Including the ROSAT point, a correlation of P2/P1 with energy is evident, but the statistical significance is only 2 , and confirmation is needed.

5 Spectral analysis
Spectral fits were performed on the background subtracted MECS data binned logarithmically after checking that each single energy channel contains at least 20 photons. The NH was fixed to the value of 51020 cm-2 (see Verbunt et al. 1996). We fitted the total pulsed spectrum, i.e. the excess counts above the unpulsed level in the phase histogram, with a power–law model, taking into account the energy dependent interstellar absorption. The resulting photon index is = 0.610.32, with a 2–10 keV flux erg cm-2 s-1, and a reduced of 0.7 (3 dof). A fit with a black body spectral distribution gives keV, with a (3 dof). Both the values are acceptable, the black body temperature K, however, is quite higher than the values measured for the thermal components of other pulsars that typically does not exceed K (Greiveldinger et al. 1996, Becker & Trümper 1997, 1999). Fig. 6 also shows the spectra for the pulses P1 and P2 separately, using the same energy bins as for the total pulsed spectrum. We fitted again power-law models for each of the spectra, but the low statistics result in large errors in the estimated parameters. The measured spectral indices of P1 and P2 are and respectively, in agreement with the trend seen in the P2/P1 ratio.
Finally, we determined the total spectrum (pulsed plus DC) applying
the Maximum
Likelihood approach to the spatial distributions in smaller energy intervals
(see also Fig. 6).
The fit with a power–law gives a photon
spectral index with a 2–10 keV
flux erg cm-2 s-1, about 10 %
higher than the pulsed value given above,
and a
reduced of 0.56 (8 dof).
Given the hard spectra found above,
we also analysed the PDS data to investigate whether there was any signal
from PSR J02184232 at higher energies, even though an extrapolation
of the total spectrum measured in the MECS to the PDS range predicts
a flux well below the PDS sensitivity threshold. Indeed, no pulsed signal
was found, but in the 17-25 keV band a
DC signal was detected at the 4 level.
Moreover the fit of MECS+PDS spectra with a power–law plus a
constant factor to take into account the intercalibration uncertainties
between the two instruments leads to a spectral index of
1.4 and to a value for the constant 8, well above the expected range
of variability (0.7-1, Cusumano et al. 2000).
Furthermore, the PDS light curve shows that most
of the source counts are concentrated in the first half of the observation.
Therefore, it is likely that we observed a variable source in the large
field of view of the PDS collimators ( FWHM).
Note that there are
several sources within a region in the soft X-ray
catalogs, but none in the hard X-ray ones.
6 Discussion
The BeppoSAX observation of PSR J02184232 provided the first detection of pulsed emission from this millisecond pulsar for energies up to 10 keV. The source shows a double peaked pulse shape with a remarkably flat (photon index 0.6) spectral distribution and indications that the peak intensity ratio depends on photon energy. In particular, the P2 peak, which is not prominent in the ROSAT low energy phase histogram, becomes the dominant feature above 5 keV.
Our fit for a black body spectrum gives the quite high value of 2.6 107 K for the temperature of the emitting region. If we assume that the radiation comes from the pulsar polar cap, heated, for instance, by the interactions with starward moving high energy particles, we can compute the expected luminosity. The polar cap area of PSR J02184232, defined as usual by the open field lines, is of the order of = 2.9 1011 cm2, where is the stellar radius; from the Stefan’s law we obtain a bolometric luminosity of 5 1036 erg s-1, a value that must be doubled if the other cap is taken into account. Such luminosity is several orders of magnitude higher than that derived from the phase averaged flux erg s-1 (corresponding to an X-ray efficiency of ) where is the solid angle spanned by the emission beam. It is moreover significantly greater than the spin-down energy loss rate. This inconsistency could be solved with the assumption that the emission spot covers a very small fraction, of the order of about 10-4 or even less, of the whole cap. The flux of heating particles should be then collimated within a very narrow angle of 00.2 or smaller. Furthermore, the heating flux into the two polar caps must be different to explain the spectral difference of the two peaks. A non–thermal origin of the X-ray emission seems therefore more convincing.
The variation of the peak ratio with energy recalls a similar effect observed for the Crab pulsar (see, for instance, the recent BeppoSAX data described by Mineo et al. 1997). The possibility of detecting such effect could be due to a particular orientation among the rotation and magnetic axes and the line of sight. The Crab has an orthogonal alignment, however, Navarro et al. (1995), on the basis of the radio pulse shape, inferred for PSR J02184232 a nearly aligned rotator. The same conclusion is reached by Stairs et al. (1999) who analyzed high-precision, coherently-dispersed polarization profiles at the two frequencies of 410 and 610 MHz. Their Rotating Vector Model (RVM) fits support the classification of PSR J02184232 as a nearly aligned rotator with magnetic inclination consistent with 00, namely (811) deg at 410 MHz and (815) at 610 MHz. Unfortunately, the impact angle parameters for their RVM fits have large uncertainties and therefore the line-of-sight inclination is unconstrained.

The Crab-like double pulse X-ray profile of PSR J0218+4232 and its hard non-thermal spectrum suggests a common magnetospheric origin of the high-energy emission. The comparison with Crab is additionally enforced by the similar values of the magnetic field at the light cylinder, as already pointed out by Kuiper et al. (1998) and Kawai & Saito (1999). This follows directly from the classical assumption that the pulsar braking is entirely due to the Poynting flux at the light cylinder, independently of the actual structure of the magnetic field in the magnetosphere:
where is the moment of inertia. For the two pulsars we obtain then:
where the suffix is referred to Crab. Assuming that the moments of inertia of the two pulsars are equal, we found Gauss.
The nature of the non-thermal mechanism responsible for the X-ray emission is still unclear. A possibility is that X-ray photons are produced by curvature radiation from relativistic electrons moving outwards along the field lines in proximity of the light cylinder. The Lorentz factor of these particles to radiate photons of frequency is given by
where is the curvature radius of the last closed line near the light cylinder in a dipole field. For Hz, corresponding to 4 keV, we have:
The radiative life time of the electrons is long enough to allow them to reach the light cylinder, namely:
where is the classical radius of the electron; for ms and Hz we have 5 s. These electrons could be accelerated either in the outer gaps or above the polar caps. In the latter case, we expect that a copious number of electron-positron pairs will reach, after suffering radiation losses, the light cylinder with energy high enough for X-ray emission.
An origin of the high-energy X-rays in a narrow outer gap can also explain the narrow profile (intrinsically 0.04 phase; Kuiper et al. 1998) measured in the ROSAT light curve, as well as the double peak profile, e.g. for the wide fan-beam geometry proposed by Romani (1996). However, an additional constraint is needed: the length of the gap over which the hard X-rays are produced should be small. In fact, the very strong curvature of the magnetic field lines would produce a broader pulse profile for a long gap. However, as Ho (1989) pointed out, strongly curved magnetic field lines, as in millisecond pulsars, enhance the production of non-thermal emission, allowing outer gaps shorter than those of normal radio pulsars.
According Kuiper et al. (1999), PSR J0218+4232 is the most likely counterpart of the high-energy EGRET source 2EG J0220+4232 / 3EG J0222+4253 for energies between 100 MeV and 1 GeV. This would suggest a cut-off energy at least four orders of magnitude higher than the maximum energy of 10 keV to which the BeppoSAX data showed evidence for the detection of this source. Further high sensitivity observations at hard X-ray energies up to the high-energy -rays are therefore particularly relevant for the understanding of the physics of this and other millisecond pulsars.

Acknowledgements.
TM acknowledges G.Vizzini for his technical support on data handling.References
- [Becker & Trümper 1997] Becker W., Trümper J., 1997, A&A 326, 682
- [Becker & Trümper 1999] Becker W., Trümper J., 1999, A&A 341, 803
- [Boella et al. 1997a] Boella G., Butler R.C., Perola G.C., et al., 1997a, A&AS 122, 299
- [Boella et al. 1997b] Boella G., Chiappetti L., Conti G., et al., 1997b, A&AS 122, 327
- [Buccheri et al. 1983] Buccheri R., Bennett K., Bignami G., et al., 1983, A&A 128, 367
- [Cusumano et al. 2000] Cusumano G., Mineo T., Guainazzi M., et al., 2000, in preparation
- [Frontera et al. 1997] Frontera F., Costa E., Dal Fiume D., et al., 1997, A&AS 122, 357
- [Greiveldinger et al. 1996] Greiveldinger C., Camerini U., Fry W., et al., 1996, ApJL 465, 35
- [Hartman et al 1999] Hartman R.C., Bertsch D.L., Bloom S.D., et al., 1999, ApJS, in press
- [Ho 1989] Ho C., 1989, ApJ 342, 396
- [Kawai et al. 1999] Kawai N., Saito Y., 1999, 3rd INTEGRAL Workshop ”The Extreme Universe”, Sept. 1998, Taormina, Italy, in press
- [Kuiper et al. 1998] Kuiper L., Hermsen W., Verbunt F., Belloni T., 1998, A&A 336, 545
- [Kuiper et al. 1998] Kuiper L., Hermsen W., Verbunt F., et al., 1999, 3rd INTEGRAL Workshop ”The Extreme Universe”, Sept. 1998, Taormina, Italy, in press
- [Manzo et al. 1997] Manzo G., Giarrusso S., Santangelo A., et al., 1997, A&AS 122, 341
- [Mineo et al. 1997] Mineo T., Cusumano G., Segreto A., et al., 1997, A&A 327, L21
- [Navarro et al. 1995] Navarro J., de Bruyn A.G., Frail D.A., Kulkarni S.R., Lyne A.G., 1995, ApJ 455, L55
- [Parmar et al. 1997] Parmar A.N., Martin D.D.E., Bavdaz M., et al., 1997, A&AS 122, 309
- [Romani 1996] Romani R.W., 1996, ApJ 470, 469
- [Stairs et al.] Stairs I.H., Thorsett S.E., Camilo F., 1999, ApJS 123, 627
- [Swanepoel et al. 1996] Swanepoel J.W.H., de Beer C.F., Loots H., 1996, ApJ 467, 261
- [Taylor & Cordes 1993] Taylor J.H., Cordes J.M., 1993, ApJ 411, 674
- [van Kerkwijk et al. 1996] Van Kerkwijk M.H., 1996, Proc. IAU Coll. 160, 489
- [Verbunt et al. 1996] Verbunt F., Kuiper L., Belloni T., et al., 1996, A&A 311, L9