Radio Properties
of the Shapley Concentration
III. Merging Clusters in the A3558 Complex
Abstract
We present the results of a 22 cm radio survey carried out with the Australia Telescope Compact Array (ATCA) covering the A3558 complex, a chain formed by the merging ACO clusters A3556-A3558-A3562 and the two groups SC1327312 and SC1323313, located in the central region of the Shapley Concentration. The purpose of our survey is to study the effects of cluster mergers on the statistical properties of radio galaxies and to investigate the connection between mergers and the presence of radio halos and relic sources.
We found that the radio source counts in the A3558 complex are consistent with the background source counts. The much higher optical density compared to the background is not reflected as a higher density of radio sources. Furthermore, we found that no correlation exists between the local density and the radio source power, and that steep spectrum radio galaxies are not segregated in denser optical regions.
The radio luminosity function for elliptical and S0 galaxies is significantly lower than than for cluster early type galaxies and for those not selected to be in clusters at radio powers logP1.4 22.5, implying that the probability of a galaxy becoming a radio source above this power limit is lower in the Shapley Concentration compared with any other environment. Possible explanations will be presented.
The detection of a head-tail source in the centre of A3562, coupled with careful inspection of the 20 cm NRAO VLA Sky Survey (NVSS) and of 36 cm MOST observations, allowed us to spot two extended sources in the region between A3562 and SC1329313, i.e. a candidate radio halo at the centre of A3562, and low brightness extended emission around a 14.96 magnitude Shapley galaxy. The relation between these two extended galaxies and the ongoing group merger in this region of the Shapley Concentration are discussed.
keywords:
Radio continuum: galaxies - Clusters: general - galaxies: clusters: individual: A3556 galaxies: clusters: individual: A3558 galaxies: clusters: individual: A3562 galaxies: clusters: individual: SC1327-312 galaxies: clusters: individual: SC1329-3131 Introduction
Cluster mergers are the most energetic and common phenomena in the Universe. They are the natural way of forming rich clusters of galaxies within cold dark matter scenarios, which imply a bottom-up hierarchy of structure formation. Cosmological numerical simulations indicate that the matter flows along preferential directions (defined by filaments or planar structures), where the subunits are accelerated to velocities of the order of km s-1. In particular, the formation of a rich cluster is expected at the intersections between filaments or walls. The merging process generates important perturbations in the intracluster medium (ICM) such as shocks, bulk flows and turbulence in the hot gas (see for instance Roettiger, Burns & Loken 1996). The observational signatures of these events are mainly seen in the X–ray band, where they appear as distorted isophotes (Slezak, Durret & Gerbal 1996) or as regions of significantly enhanced temperature outside the cluster centre (Markevitch 1996). It has also been assumed that these events must significantly affect the emission of the galaxy population. For instance, in the optical band merging seems to play a role in secondary star formation bursts (Caldwell & Rose 1997)
However, the most spectacular effect of merging is found at radio wavelength. Bulk motions of the ICM are invoked to be responsible for bending the wide-angle tail (WAT) objects (Roettiger, Burns & Loken 1993) and for the formation of the U-shape of narrow-angle tail (NAT) sources (Bliton et al. 1998), otherwise impossible to be explained in terms of ram pressure for these objects with low peculiar velocities with respect to the cluster centre. Moreover, the bulk motion of the intracluster gas may provide the energy for particle reacceleration as well as additional accretion material for the central engine.
Two other classes of merging related radio sources are “relics” and “halos”. Radio halos are cluster wide radio sources, typically found in the central regions of galaxy clusters. They usually exhibit a regular morphology and their dimensions may exceed the megaparsec. Relics are preferentially found in peripheral cluster regions, they are usually characterised by an elongated morphology and lack an obvious optical counterpart. Both types of radio sources are characterised by low brightness, steep radio spectra ( 1, for S) and are located in clusters showing evidence of a recent merger event (Feretti & Giovannini, 1996). It is now accepted that merging provides at least a large fraction of the energy required to reaccelerate the electrons deposited in the intracluster medium by extended radio galaxies (Blandford & Eichler 1987, Sarazin 1999).
The information on the dynamical state of merging clusters is crucial in order to understand how the radio properties of the galaxies and of the clusters are influenced by the merging itself. However, despite the well established connection between such radio sources and the merging phenomenon, an extensive multifrequency study of merging clusters is still missing.
The cores of rich superclusters are the ideal environments to study the merging phenomenon, since the high peculiar velocities induced by the enhanced local density favours cluster-cluster and cluster-group collisions. Among rich superclusters, the Shapley Concentration stands out for its most extreme properties. It is the richest nearby supercluster, with 25 member clusters at a density contrast (Zucca et al. 1993), and shows a percentage of interacting clusters a factor of three higher than elsewhere (Raychaudhury et al. 1991). It is therefore a unique laboratory to follow cluster merging and to study its signature in a wide range of astrophysical situations.
2 The A3558 cluster complex in the Shapley Concentration
The A3558 cluster complex is a remarkable chain formed by the three ACO clusters A3556, A3558 and A3562, located at a mean redshift z=0.048 ( 14500 km s-1) and spanning 7 h-1 Mpc (h = H0/100) almost perpendicular to the line of sight. Two smaller groups, SC 1327312 and SC 1329313 are located between A3558 and A3562. The distribution of the optical galaxies with magnitude b 19.5 is given in Figure 1 (upper panel). This structure is approximately located at the geometrical centre of the Shapley Supercluster and can be considered its core.
A detailed analysis of the velocity distribution, made possible by the 714 redshifts available in this region (Bardelli et al. 1998), has revealed that the whole structure is characterised by a large number of subcondensations, confirming that the region is dynamically very active. The most important properties of the clusters in the A3558 chain are summarised in Table 1, where we report the J2000 coordinates, the Bautz-Morgan type, the mean heliocentric velocity and the velocity dispersion.
| Cluster | RAJ2000 | DECJ2000 | B-M Type | R | kT | ||
|---|---|---|---|---|---|---|---|
| km s-1 | km s-1 | 0.1-2.4 KeV | |||||
| A3556 | 13 24 06 | 31 39 45 | I | 0 | 14130 | 411 | - |
| A3558 | 13 27 55 | 31 29 24 | I | 2 | 14262 | 992 | 3.31 |
| SC1327312 | 13 29 47 | 31 36 29 | - | - | 14844 | 691 | - |
| SC1329313 | 13 31 36 | 31 48 46 | - | - | 14790 | 377 | - |
| A3562 | 13 33 30 | 31 40 00 | I | 2 | 14492 | 913 | 3.82 |
Notes to Table 1.
and are taken from Bardelli et al. (1998).
The coordinates of the centre for A3556, A3558 and A3562 are taken from
Abell, Corwin & Orowin (1989).
Those for the SC groups are taken from Bardelli et al. (1998).
1 Bardelli et al. 1996; 2 Ettori et al. 1997.
A3558 is the dominant and most massive cluster in the complex, with richness class originally estimated as 4 (Abell, Corwin & Olowin, 1989), but lowered to 2 by Metcalfe et al. (1994). The overestimate of the optical richness arose from the inclusion of galaxies from nearby groups and clusters. It is dominated by a cD galaxy with bJ = 14.26 and v = 14037 km s-1, offcentered with respect to the cluster geometrical centre by 50 kpc (Bardelli et al. 1996). The mean velocity of the cluster is given in Table 1. The structure analysis revealed that substructure in A3558 is significant at level, and the presence of nearby groups in this region may have caused the overestimate in its optical richness. Indication of a complex situation comes also from the cluster X–ray emission. Bardelli et al. (1996) claimed the existence of a bridge of hot gas connecting A3558 and SC1327312 and possibly extending to SC1329313. The X–ray temperature measured by ASCA, k = 5.5 keV (Markevitch & Vikhlinin 1997), differs from that measured by ROSAT (see Table 1), and this could be interpreted as evidence of the presence of various co-existing components in the intracluster gas, at different temperatures. Moreover, Markevitch & Vikhlinin (1997) noted a significant enhancement of X–ray temperature in the north-eastern part of this cluster, corresponding to substructure detected in optical studies (Bardelli et al. 1998). Finally, a moderate cooling flow of 25 M⊙ yr-1 centred on the cD galaxy has been detected (Bardelli et al. 1996).
A3562 is the easternmost cluster in the chain, and it is dominated by the central bJ = 15.09 magnitude cD galaxy with a very extended asymmetric halo and velocity v = 14708 km s-1. Given the low number of redshifts in this region of the complex, a detailed analysis is not possible. The situation is complicated by possible contamination from SC 1329-313 and from a filamentary structure crossing the chain in the east-west direction in the velocity range km s-1 (Bardelli et al 1994). The cluster is an X–ray emitter, as all clusters in the A3558 complex (see Table 1).
A3556 is the westernmost cluster in the chain, with richness class R=0 and dominated by a central cD galaxy (, km s-1). Another cluster galaxy of similar luminosity (, km s-1) is located at a projected distance of from the cluster centre.
The projected angular separation between A3558 and A3556 is , less than two Abell radii (1 RA = 1.77′/z ). As noted by Metcalfe et al. (1994), this distance is less than the turnaround radius of A3558, meaning that the two clusters are interacting.
The substructure analysis carried out by Bardelli et al. (1998) shows that the velocity distribution is significantly better fitted by two gaussians with km s-1 and km s-1 and km s-1 and km s-1 respectively. Bardelli et al. (1998) found that the luminosity function of A3556 is very different from that of the other clusters in the chain, being rather flat and forming a plateau for magnitudes brighter than 16.
No direct measurement of the X-ray flux density is available for A3556. On the basis of the cluster dispersion velocity Ettori et al. (1997) estimated k=2.1 KeV.
A3556 has been surveyed at radio wavelengths by Venturi et al. (1997, hereinafter Paper I), finding that all the galaxies forming the bright plateau in the optical luminosity function are radio loud. Two extended radio galaxies were found, i.e. a very steep spectrum extended radio source and a wide-angle tail (WAT). The first, associated with a = 15.6 magnitude galaxy, is located in the subgroup with v = 15066 km s-1 infalling towards A3556, and it has been studied in detail in Venturi et al. (1998, hereinafter Paper II), where we concluded that this source is a possible relic. The WAT is notable because of its large distance from the centre of A3556, corresponding to 1 Mpc, while WAT sources are normally found close to the cluster centres. In order to explain the nature of this source, Venturi et al. (1997) proposed the existence of gas at such distance from A3556, in the far periphery of the complex. The presence of this hot gas was confirmed by an analysis of the ROSAT All Sky Survey X–ray data carried out by Kull & Böhringer (1999) .
The two SC groups are located between A3558 and A3562, as shown in Figure 1 (upper panel), in coincidence with the bridge of X–ray emission connecting the cluster centres (Breen et al. 1994). The structure analysis carried out in Bardelli et al. (1998) showed that SC1329313 is bimodal at 97% confidence level. The velocity derived for the second group is km s-1, with dispersion km s-1.
Bardelli et al. (1998) proposed that the A3558 complex is the remnant of a cluster-cluster collision seen just after the first core-core encounter, a scenario which is supported observationally by the substructures present between A3558 and A3562. In this region, where the position of the shock is expected, they found an enhanced fraction of of blue galaxies.
Very recently, Hanami et al. (1999), studying the apparent “blue-shift” of the iron X–ray lines, concluded that SC1329313 presents clear signs of ongoing or recent ( yrs) merging.
In this paper we will present and discuss the results of a radio survey of the A3558 complex carried out at 22 cm with the Australia Telescope Compact Array (ATCA). In addition we will present simultaneous 13 cm (2.3 GHz) observations for all sources with an optical counterpart on the Digitised Sky Survey (DSS).
The observations and data reduction are presented in Section 3; in Section 4 we discuss the 22 cm radio sample and its statistics, i.e. source counts and logN-logS diagram; in Section 5 we deal with the optical identifications; in Section 6 we present the properties of the Shapley radio galaxies and the relation with the merging environment; attention will be devoted to the extended radio sources in A3562 in Section 7; our results are summarised and discussed in Section 8.
We assume a Hubble constant H0 = 100 km s-1Mpc-1. At the average redshift of the Shapley Concentration, z=0.05, = 0.67 kpc. We will assume .
3 Observations and Data Reduction
3.1 The 22 cm ATCA observations
We observed the A3558 complex with the Australia Telescope Compact Array at 22 cm ( = 1380 MHz), covering the whole region with 16 different pointings and various array configurations. Table 2 reports the details on the observations and Figure 1 (lower panel) shows the coverage of the A3558 complex with the observations presented here, superimposed on the optical isodensity contours. The diameters of the circles are 35′, corresponding to the half power primary beam at 22 cm.
| Field | RAJ2000 | DECJ2000 | Array | u-v range | Int. Time | rms (22 cm) | rms (13 cm) |
|---|---|---|---|---|---|---|---|
| # | m | hr | mJy/b | mJy/b | |||
| 11 | 13 26 59 | 31 55 11 | 1.5B + 6C | 168 - 6000 | 4 2 | 0.1 | 0.09 |
| 12 | 13 27 59 | 31 30 33 | 6C | 260 - 6000 | 2 | 0.2 | 0.16 |
| 13 | 13 29 25 | 31 40 11 | 1.5B + 6C | 168 - 6000 | 4 2 | 0.1 | 0.09 |
| 14 | 13 31 25 | 31 47 57 | 6C | 260 - 6000 | 2 | 0.2 | 0.15 |
| 15 | 13 33 38 | 31 40 17 | 6C | 260 - 6000 | 2 | 0.2 | 0.15 |
| 16 | 13 35 25 | 31 44 59 | 1.5B + 6C | 168 - 6000 | 4 2 | 0.1 | 0.09 |
Pointings #1 to #10 were chosen in the A3556 region and the observations were carried out using the mosaicing facility of the ATCA. For details of those observations we refer to Paper I. Pointings #11, #13 and #16 were chosen respectively in order to cover the high density region south of A3558, the hot gas bridge between A3558 and SC1327312, and the outermost periphery of the complex, east of A3562. In order to cover the whole region of the A3558 chain we also reduced and analysed archive ATCA data centred on A3558, SC1329313 and on A3562, respectively #12, #14 and #15 in Table 1 (see also Reid, Hunstead & Pierre 1998 for details of these observations).


All the observations presented in Table 2 and used to cover the A3558 complex have the resolution of in p.a. . However, due to the different array configurations and to the different total time on source, the sensitivity to extended emission is not uniform. For example, for fields #11, #13 and #16, observed with the configurations 1.5B+6C, the shortest baseline is , while for the remaining fields the shortest spacing is .
Each observation was carried out with a 128 MHz bandwidth, and the correlation of the signal was carried out using 32 channels, each 4 MHz wide, in order to minimise bandwidth smearing effects at large distance from the pointing centres. The data reduction was carried out with the package MIRIAD (Sault, Teuben & Wright, 1995), which is particularly suited for the ATCA observations. Multifrequency synthesis techniques are implemented, which allow proper gridding of the data in order to reduce bandwidth smearing effects. B1934-638 was used as primary flux calibrator, with an assumed flux density S22 = 14.9 Jy. The image analysis was carried out with the AIPS package.
The noise in the final images varies from field to field (see Table 2). For the ten pointings in the A3556 region we assume an average noise of 0.2 mJy/beam (see Paper I). Given the non uniform noise in fields #11 to #16 we chose a detection limit of 1 mJy, corresponding to 5 for the fields with the highest noise. In order to compensate for the sensitivity loss towards the field edge due to the primary beam attenuation, we corrected the flux density of the sources in our survey using the analytical formula of the primary beam attenuation for the Australia Telescope Compact Array given in Wieringa & Kesteven (1992).
We estimated that the uncertainty associated with the flux density measurements is:
where is the map noise, is the residual calibration error, estimated to be of the order of 1%, and is the source flux density.
The radio positional accuracy depends on the beam size and the source flux density. Accordingly we estimate an uncertainty of the order of and for the weakest sources in the sample.
3.2 The 13 cm ATCA observations
13 cm observations were carried out simultaneously with the 22 cm observations presented in Sect. 3.1 in each configuration, and the data reduction was carried out as described in Sect. 3.1. The adopted flux density for the primary calibrator B1938-638 at this wavelength is S13 = 11.6 Jy. Given the different array configurations the rms noise in each field varies from 0.09 to 0.16 mJy/beam, as shown from Table 2.
We used the 13 cm observations to study the spectral index of the identified radio sources in the A3558 complex field (see Section 5). The full resolution of the 13 cm images is . However, for a more accurate computation of the spectral index (see also Section 6.2) we used natural weighted maps, restored with the 22 cm beam.
| Name | RAJ2000 | DECJ2000 | S22cm | R Morph |
|---|---|---|---|---|
| mJy | ||||
| J13253202b | 13 25 25.4 | 32 02 47 | 3.0 | unres. |
| J13253157 | 13 25 40.7 | 31 57 35 | 100.4 | unres. |
| J13263140a | 13 26 25.5 | 31 40 57 | 1.9 | unres. |
| J13263156 | 13 26 48.7 | 31 56 43 | 1.4 | unres. |
| J13263118 | 13 26 54.6 | 31 18 44 | 2.3 | unres. |
| J13263123b | 13 26 56.9 | 31 23 09 | 1.8 | unres. |
| J13273210 | 13 27 10.1 | 32 10 31 | 2.0 | unres. |
| J13273135 | 13 27 12.7 | 31 35 00 | 10.2 | unres. |
| J13273202 | 13 27 19.8 | 32 02 36 | 5.1 | unres. |
| J13273209 | 13 27 24.9 | 32 09 39 | 25.6 | res. |
| J13273158 | 13 27 26.3 | 31 58 15 | 1.2 | unres. |
| J13273157 | 13 27 28.3 | 31 57 08 | 1.5 | unres. |
| J13273123 | 13 27 29.6 | 31 23 22 | 2.0 | unres. |
| J13273159 | 13 27 38.5 | 31 59 01 | 1.3 | unres. |
| J13273201a | 13 27 43.1 | 32 01 09 | 3.2 | unres. |
| J13273201b | 13 27 46.7 | 32 01 40 | 1.9 | unres. |
| J13273200 | 13 27 46.8 | 32 00 30 | 3.4 | unres. |
| J13273153 | 13 27 48.7 | 31 53 17 | 5.9 | unres. |
| J13273152 | 13 27 50.9 | 31 52 22 | 1.7 | unres. |
| J13273121 | 13 27 50.0 | 31 21 01 | 19.7 | D |
| J13273129a | 13 27 50.1 | 31 29 20 | 43.9 | unres. |
| J13273208a | 13 27 51.2 | 32 08 30 | 5.9 | unres. |
| J13273151 | 13 27 51.6 | 31 51 16 | 3.0 | unres. |
| J13273208b | 13 27 53.1 | 32 08 52 | 4.4 | unres. |
| J13273132 | 13 27 54.9 | 31 32 18 | 5.7 | unres. |
| J13273129b | 13 27 56.8 | 31 29 43 | 6.2 | unres. |
| J13283133 | 13 28 00.9 | 31 33 09 | 1.1 | unres. |
| J13283145 | 13 28 02.6 | 31 45 20 | 22.9 | unres. |
| J13283127 | 13 28 03.1 | 31 27 43 | 3.6 | unres. |
| J13283129 | 13 28 10.1 | 31 29 19 | 10.7 | unres. |
| J13283204 | 13 28 11.3 | 32 04 01 | 14.6 | unres. |
| J13283206 | 13 28 11.8 | 32 06 38 | 3.2 | unres. |
| J13283148 | 13 28 16.4 | 31 48 20 | 64.7 | unres. |
| J13283210 | 13 28 20.7 | 32 10 56 | 5.1 | unres. |
| J13283134 | 13 28 21.2 | 31 34 39 | 1.1 | unres. |
| J13283111a | 13 28 25.5 | 31 11 20 | 2.5 | unres. |
| J13283119 | 13 28 29.3 | 31 19 30 | 66.3 | D |
| J13283135 | 13 28 31.4 | 31 35 03 | 119.9 | unres. |
| J13283111b | 13 28 34.8 | 31 11 55 | 2.6 | unres. |
| J13283124 | 13 28 36.2 | 31 24 07 | 1.6 | unres. |
| J13283139 | 13 28 36.1 | 31 39 42 | 2.8 | unres. |
| J13283146 | 13 28 44.2 | 31 46 27 | 2.7 | unres. |
| J13283157 | 13 28 49.7 | 31 57 02 | 13.9 | unres. |
| J13283209 | 13 28 52.6 | 32 09 45 | 13.1 | unres. |
| J13283155 | 13 28 56.5 | 31 55 24 | 2.5 | unres. |
| J13283151 | 13 28 57.6 | 31 51 36 | 2.0 | unres. |
| J13283144 | 13 28 59.4 | 31 44 15 | 2.2 | unres. |
| J13293126 | 13 29 00.5 | 31 26 45 | 88.1 | FRII |
| J13293131 | 13 29 04.6 | 31 31 09 | 82.5 | unres. |
| J13293129a | 13 29 05.6 | 31 29 41 | 4.1 | unres. |
| J13293113 | 13 29 08.5 | 31 13 05 | 8.6 | unres. |
| J13293133 | 13 29 13.0 | 31 33 22 | 31.5 | unres. |
| J13293121 | 13 29 13.2 | 31 21 54 | 22.5 | unres. |
| J13293139 | 13 29 28.7 | 31 39 25 | 2.6 | unres. |
| J13293129b | 13 29 29.5 | 31 29 46 | 19.3 | unres. |
| J13293116a | 13 29 30.9 | 31 16 50 | 7.2 | unres. |
| Name | RAJ2000 | DECJ2000 | S22cm | R Morph |
|---|---|---|---|---|
| mJy | ||||
| J13293116b | 13 29 31.9 | 31 16 55 | 4.2 | unres. |
| J13293117 | 13 29 33.5 | 31 17 00 | 7.3 | unres. |
| J13293158 | 13 29 41.8 | 31 58 42 | 56.7 | unres. |
| J13293154 | 13 29 41.9 | 31 54 14 | 4.7 | unres. |
| J13293200 | 13 29 43.7 | 32 00 42 | 82.8 | unres. |
| J13293122 | 13 29 49.3 | 31 22 20 | 4.3 | unres. |
| J13293123 | 13 29 51.0 | 31 23 00 | 17.3 | FRII |
| J13293129 | 13 29 55.3 | 31 29 40 | 8.9 | unres. |
| J13303145 | 13 30 04.8 | 31 45 13 | 3.6 | unres. |
| J13303144a | 13 30 05.3 | 31 44 57 | 3.9 | unres. |
| J13303143 | 13 30 05.7 | 31 43 50 | 3.5 | unres. |
| J13303144b | 13 30 08.8 | 31 44 17 | 3.9 | unres. |
| J13303122a | 13 30 19.1 | 31 22 59 | 421.7 | unres. |
| J13303156 | 13 30 26.9 | 31 56 51 | 3.1 | unres. |
| J13303130 | 13 30 30.9 | 31 30 01 | 14.2 | unres. |
| J13303138 | 13 30 37.2 | 31 38 31 | 2.3 | unres. |
| J13303134 | 13 30 38.7 | 31 34 56 | 3.1 | unres. |
| J13303141 | 13 30 53.5 | 31 41 34 | 4.3 | unres. |
| J13303204 | 13 30 55.9 | 32 04 06 | 9.0 | unres. |
| J13303122b | 13 30 59.1 | 31 22 54 | 8.7 | unres. |
| J13313144 | 13 31 00.8 | 31 44 54 | 1.6 | unres. |
| J13313155 | 13 31 06.5 | 31 55 08 | 7.1 | unres. |
| J13313139a | 13 31 11.3 | 31 39 38 | 2.6 | unres. |
| J13313139b | 13 31 12.1 | 31 39 26 | 8.9 | unres. |
| J13313138a | 13 31 14.4 | 31 38 04 | 7.4 | unres. |
| J13313128 | 13 31 16.8 | 31 28 28 | 18.7 | res. |
| J13313210 | 13 31 16.9 | 32 10 05 | 3.2 | unres. |
| J13313143 | 13 31 19.7 | 31 43 37 | 7.4 | res. |
| J13313149 | 13 31 21.4 | 31 49 03 | 1.3 | unres. |
| J13313145 | 13 31 22.9 | 31 45 27 | 1.7 | unres. |
| J13313137 | 13 31 22.9 | 31 37 39 | 1.7 | unres. |
| J13313121 | 13 31 29.8 | 31 21 51 | 11.7 | unres. |
| J13313138b | 13 31 31.6 | 31 38 36 | 6.9 | unres. |
| J13313125 | 13 31 31.6 | 31 25 11 | 4.9 | unres. |
| J13313206 | 13 31 42.7 | 32 06 38 | 113.2 | FRII |
| J13313147a | 13 31 43.9 | 31 47 39 | 3.1 | unres. |
| J13313201 | 13 31 48.9 | 32 01 14 | 2.0 | unres. |
| J13313142 | 13 31 51.0 | 31 42 48 | 2.4 | unres. |
| J13313156 | 13 31 53.7 | 31 56 09 | 1.7 | unres. |
| J13323146 | 13 32 03.1 | 31 46 47 | 4.7 | unres. |
| J13323141a | 13 32 04.6 | 31 41 34 | 7.9 | D |
| J13323153a | 13 32 16.0 | 31 53 02 | 3.3 | unres. |
| J13323152 | 13 32 17.6 | 31 52 49 | 14.6 | unres. |
| J13323215 | 13 32 17.1 | 32 15 35 | 25.1 | unres. |
| J13323123 | 13 32 27.5 | 31 23 55 | 15.0 | unres. |
| J13323141b | 13 32 31.8 | 31 41 54 | 4.8 | unres. |
| J13323153b | 13 32 33.7 | 31 53 14 | 2.4 | unres. |
| J13323202 | 13 32 40.0 | 32 02 03 | 16.4 | unres. |
| J13323201 | 13 32 42.5 | 32 01 43 | 6.1 | unres. |
| J13323158a | 13 32 44.0 | 31 58 18 | 3.1 | unres. |
| J13323158b | 13 32 45.2 | 31 58 29 | 15.4 | unres. |
| J13333117 | 13 33 05.3 | 31 17 48 | 4.4 | unres. |
| J13333141 | 13 33 31.6 | 31 41 01 | 99.0 | HT |
| J13333130 | 13 33 37.4 | 31 30 45 | 37.2 | unres. |
| J13333118 | 13 33 37.9 | 31 18 05 | 3.2 | unres. |
| J13333135 | 13 33 41.4 | 31 35 47 | 1.2 | unres. |
| Name | RAJ2000 | DECJ2000 | S22cm | R Morph |
|---|---|---|---|---|
| mJy | ||||
| J13333120 | 13 33 53.1 | 31 20 02 | 9.6 | unres. |
| J13343146 | 13 34 04.0 | 31 46 32 | 3.9 | unres. |
| J13343128 | 13 34 08.3 | 31 28 37 | 29.8 | D |
| J13343136 | 13 34 09.1 | 31 36 58 | 1.6 | unres. |
| J13343123 | 13 34 12.6 | 31 23 58 | 4.7 | unres. |
| J13343149 | 13 34 13.9 | 31 49 51 | 6.3 | unres. |
| J13343119 | 13 34 22.2 | 31 19 19 | 19.3 | res. |
| J13343139 | 13 34 22.5 | 31 39 07 | 16.0 | unres. |
| J13343137 | 13 34 30.8 | 31 37 45 | 1.4 | unres. |
| J13343141 | 13 34 35.8 | 31 41 04 | 2.0 | unres. |
| J13343132a | 13 34 36.7 | 31 32 42 | 3.9 | unres. |
| J13343132b | 13 34 37.4 | 31 32 49 | 14.7 | unres. |
| J13343132c | 13 34 40.5 | 31 32 45 | 2.2 | unres. |
| J13343125 | 13 34 51.2 | 31 25 35 | 2.1 | unres. |
| J13343151 | 13 34 52.2 | 31 51 15 | 2.5 | unres. |
| J13353139 | 13 35 03.0 | 31 39 18 | 15.8 | unres. |
| J13353130 | 13 35 07.9 | 31 30 42 | 1.6 | unres. |
| J13353118 | 13 35 07.3 | 31 18 07 | 12.8 | unres. |
| J13353133 | 13 35 12.7 | 31 33 43 | 1.5 | unres. |
| J13353124 | 13 35 16.4 | 31 24 57 | 8.6 | unres. |
| J13353125 | 13 35 17.8 | 31 25 08 | 4.3 | unres. |
| J13353126 | 13 35 20.4 | 31 26 20 | 3.2 | unres. |
| J13353143a | 13 35 27.3 | 31 43 05 | 1.8 | unres. |
| J13353153a | 13 35 42.6 | 31 53 53 | 14.4 | FRI |
| J13353117 | 13 35 42.6 | 31 17 52 | 6.6 | unres. |
| J13353140 | 13 35 43.5 | 31 40 58 | 1.4 | unres. |
| J13353153b | 13 35 49.5 | 31 53 45 | 4.8 | unres. |
| J13353143b | 13 35 49.1 | 31 43 44 | 1.3 | unres. |
| J13353146 | 13 35 54.3 | 31 46 34 | 9.4 | unres. |
| J13353200 | 13 35 54.6 | 32 00 06 | 6.0 | unres. |
| J13363144 | 13 36 01.3 | 31 44 00 | 3.3 | unres. |
| J13363146a | 13 36 02.8 | 31 46 52 | 3.0 | unres. |
| J13363122a | 13 36 05.4 | 31 22 28 | 4.3 | unres. |
| J13363140 | 13 36 09.6 | 31 40 07 | 12.8 | extended |
| J13363146b | 13 36 17.9 | 31 46 44 | 2.0 | unres. |
| J13363148 | 13 36 18.6 | 31 48 30 | 2.3 | unres. |
| J13363205 | 13 36 28.2 | 32 05 45 | 19.3 | unres. |
| J13363122b | 13 36 45.6 | 31 22 26 | 10.2 | unres. |
| J13373204 | 13 37 17.5 | 32 04 30 | 123.1 | D |
| J13373139 | 13 37 46.8 | 31 39 59 | 43.2 | unres. |
| Name | RAJ2000 | DECJ2000 | S22cm | R Morph | |
|---|---|---|---|---|---|
| mJy | y | ||||
| J13253157 | 13 25 36.5 | 31 57 04 | 1.6 | unres. | |
| J13263220 | 13 26 02.2 | 32 20 11 | 5.4 | unres. | |
| J13263200 | 13 26 16.1 | 32 00 31 | 1.0 | unres. | |
| J13263155 | 13 26 30.4 | 31 55 32 | 1.0 | unres. | |
| J13273209 | 13 27 00.9 | 32 09 22 | 1.1 | unres. | |
| J13273135b | 13 27 08.8 | 31 35 27 | 1.6 | unres. | |
| J13343143 | 13 34 06.6 | 31 43 39 | 1.6 | unres. | |
| J13353123 | 13 35 08.4 | 31 23 24 | 1.7 | unres. | |
| J13353134 | 13 35 18.9 | 31 34 57 | 1.1 | unres. | |
| J13363134 | 13 36 49.7 | 31 34 31 | 2.7 | unres. | |
| J13373135 | 13 37 05.1 | 31 35 35 | 3.2 | unres. | |
| J13373145 | 13 37 26.7 | 31 45 22 | 4.2 | unres. |
4 The sample of radio sources
The total number of sources detected at 22 cm above 1 mJy in the six fields presented in this paper is 151. The list is given in Table 3, where we report respectively their name, position, flux density at 22 cm and comments on the radio morphology. In Table 4 we list the sources detected in the fields with the lowest rms noise (fields #11 and #16 in Table 1), whose flux density is S 1 mJy (before the primary beam correction) but greater than 5, which we consider reliable detections. All flux densities given in Table 3 and 4 are corrected for the primary beam attenuation. Integrated flux densities are given for the extended radio sources.
As clear from Table 3, the majority of the radio sources detected in the present survey is unresolved; in particular only 15 radio sources are extended, i.e. 10% of the total. Nine of the extended radio sources are doubles. We found three classical FRII radio galaxies, one FRI (Fanaroff & Riley 1974) and one head-tail source, and the remaining four have asymmetric radio emission. For double and FR-type radio sources, the position given in Table 3 is the barycentre of the radio emission, while for extended and resolved sources we give the position of the radio peak.
Adding to the present sample all radio sources in the A3556 mosaic observations (see Paper I) above 1 mJy (the same flux density limit), we obtain a total of 263 radio sources in the whole A3558 complex. The total number of resolved radio sources is 31, i.e. % of the total.
4.1 Radio source counts
Given the much higher optical density in the A3558 complex compared to the background, and the cluster merger occurring in this region, we computed the source counts for our radio sample for comparison with the background counts (Prandoni et al. 1999), in order to study if the dynamical properties of this region result in an enhanced number of radio sources.
Due to the primary beam attenuation, the sensitivity of the fields we surveyed is not uniform (see Section 3), so our sample is not complete to the flux limit of 1 mJy. Therefore in order to carry out a statistical analysis we have selected a complete subsample, which we will refer to as the “reduced sample”. The “reduced sample” includes all radio sources published in Paper I and in the present paper with S mJy within a distance of 17.5 arcmin from the centre of their field. At such a distance the primary beam attenuation is reduced by a factor of two, so sources with flux density S mJy are seen as sources with S mJy before the correction.
The total number of sources in the “reduced sample” is 145 and the area covered is 3.25 deg2. The resulting logN - logS in the flux density range 1 - 512 mJy is reported in Figure 2, where the differential number of sources in each bin is given in N deg-2 and the errors are poissonian. The width of each bin is S = Slog(2.5). The reference line in Figure 2 represents the source counts taken from the ATCA survey of Prandoni et al. (1999), which covers an area of 25.82 deg2, for a total of 1752 radio sources to the flux density limit of 1 mJy at 22 cm. We assume that this survey, performed with a very similar instrumental configuration is representative of the source counts in our flux range and can therefore be used as reference background.
The plot in Figure 2 clearly shows that the counts in the two samples have the same shape and normalisation, suggesting that the numbers of sources found in the core of the Shapley Concentration are consistent with those predicted for the background. The consistency in normalisation between these two distributions also indicates that calibration error residuals in our sample are negligible. In Figure 2 our counts go significantly below the background for S 2 mJy, which independently confirms that our sample is incomplete below this limit. At the 2 mJy limit the expected number of radio sources in each field from the Prandoni et al. survey (1999) is 12. The maximum number of observed objects is 19 in field #13, which shows only a marginal excess, while the minimum is 8, found in field #15, consistent with the expected counts within the errors.
We have quantitatively estimated the similarity between the source counts in the A3558 complex and the background counts applying a KS test to the two distributions, and found that the probability that they are the same distribution is p=0.996. This result implies that the major optical overdensity in the core of the Shapley Concentration is not reflected into an overdensity of the radio sources down to 2 mJy, i.e. logP22 (W Hz-1) = 21.73.

5 Optical Identifications
We searched for optical counterparts of the radio sources detected in our 22 cm survey using the COSMOS/UKST Southern Sky Object Catalogue (Yentis et al. 1992), limited to = 19.5 (see also Paper I for a discussion on this limit). Even though the claimed positional accuracy of the catalogue is 0.25 arcsec, we adopt a mean positional error of 1.5 arcsec in order to take into account the error introduced by the transformation from the plate frame to the sky (Unewisse et al. 1993, Drinkwater et al. 1995).
In order to test the reliability of the optical counterparts we used the parameter defined as:
Here is the offset between the radio and optical positions, is the uncertainty in the galaxy position and is the uncertainty in the radio position. For point-like radio sources we consider reliable identifications those with .
After cross correlation between our radio sample and the COSMOS catalogue, we visually inspected the DSS to search for faint optical counterparts not included in the catalogue. For such cases we inspected the COSMOS catalogue at fainter limits, considering also objects not classified as galaxies. In two cases, J13273129b and J13333141, we found a bright optical counterpart (bJ=14.26 and 17.25 respectively) not included in the COSMOS catalogue. For these objects we adopted the magnitude given in Metcalfe et al. (1994). We found 40 optical counterparts, 26% of the total. Furthermore, four radio sources listed in Table 4, fainter than the 1 mJy limit, have a bright optical identification. If we include also the results given in Paper I, the total number of identified radio sources in the 1 mJy sample of the A3558 complex, is 69, again 26 % of the total.
We estimated the completeness and reliability of our sample of identifications following the method suggested by de Ruiter et al. (1977). With our limit on and using formulas (7) and (8) in their paper we obtained a completeness of 96.3% and a reliability of 99.6%.
The list of the identified radio sources for the present paper, together with the relevant optical information, is given in Table 5. Column 1 reports the radio and optical name as given in the COSMOS catalogue, with the exception of the two galaxies found only in the Metcalfe et al. (1994) list; in columns 2 and 3 the coordinates (J2000) of the radio source and its optical counterpart are given; in columns 4 and 5 we report the flux density of the radio source respectively at 22 cm and 13 cm, note that in column 4 the bJ magnitude of the counterpart is also reported; column 6 reports the spectral index ; in column 7 we give the monochromatic radio power at 22 cm for the radio galaxies with known redshift and the absolute magnitude BJ of the optical counterpart; column 8 gives the radio and optical morphologies; column 9 lists the value of the parameter R and the recession velocity.
There is a number of cases where the large optical extent of the galaxy and/or the extent of the radio emission lead to . In this case we consider the identification reliable if the optical counterpart falls within the radio isophotes. A note to Table 5 clarifies these cases.
In Figure 3 we show the histogram of the number of identified radio sources as a function of their flux density (shadowed bins). For comparison the distribution of all radio sources in the A3558 complex is also shown. The two distributions are remarkably similar, showing that the optical identification rate is uniform over the flux density range of our observations.

The redshift information for the optical counterparts is taken from the spectroscopic sample in Bardelli et al. (1994, 1998). The sample includes a total of 714 spectra and the global completeness of the spectroscopic survey at (corresponding to B at the distance of the Shapley Concentration) is %, even though it varies considerably from the position with respect to the cluster centres and the considered magnitude limit. As shown in Bardelli et al. (1998), all galaxies in the velocity range 11000 - 17200 km s-1 can be considered part of the complex. All the counterparts with pointlike optical morphology and fainter than = 18.5 without redshift information have been considered background quasars. The morphological classification of the optical counterparts given in Table 5 is done by inspection of the DSS images. No spectral or photometric information has been taken into account, therefore the classification is subject to uncertainties.
Among the 40 identifications, 19 are located at the redshift of the Shapley Concentration, one is a background galaxy (v = 58755 km s-1). For six objects with magnitude there is no redshift information, and the remainder are fainter objects. If we include the results published in Paper I on the A3556 region, we obtain a total of 28 radio galaxies belonging to the core of the Shapley Concentration.
With the exception of J13263118 and J13283209, which are associated with two extended Shapley members likely to be disk galaxies, all radio emitting galaxies are early type objects.
The location of the radio galaxies within the complex is well illustrated in Figures 4 and 5 (upper and lower panel). Figure 4 shows the location of the radio sources overlaid on the optical isodensities of the A3558 complex. The distribution of the radio galaxies belonging to the A3558 complex in velocity space is given in Figure 5, where dots are the optical galaxies and the Shapley radio galaxies are marked with a cross.


| Radio Name | RAJ2000 | DECJ2000 | S22 | S13 | logP22 | Radio Type | ||
|---|---|---|---|---|---|---|---|---|
| mJy | mJy | W Hz-1 | ||||||
| Opt. Name | RAJ2000 | DECJ2000 | BJ | Opt. Type | v (km s | |||
| J13253141b | 13 25 56.3 | 31 41 33 | 3.8 | 3.9 | - | unres. | 0.72 | |
| 13 25 56.2 | 31 41 33 | 20.52 | - | - | ||||
| J13263118 | 13 26 54.6 | 31 18 44 | 2.4 | 4.5 | 21.76 | unres. | 4.56 | |
| #7848 | 13 26 53.9 | 31 18 40 | 18.25 | -17.63 | S0? | 14245 | ||
| J13273123 | 13 27 29.6 | 31 23 22 | 2.0 | 1.8 | 0.17 | 21.69 | unres. | 1.79 |
| #8337 | 13 27 29.5 | 31 23 26 | 14.81 | -21.07 | E | 14300 | ||
| J13273152 | 13 27 50.9 | 31 52 22 | 1.7 | 1.1 | 0.76 | - | unres. | 0.98 |
| 13 27 50.8 | 31 52 24 | 22.04 | - | |||||
| J13273132 | 13 27 54.9 | 31 32 18 | 5.7 | 4.5 | 0.42 | 22.21 | unres. | 0.62 |
| #8640 | 13 27 54.9 | 31 32 19 | 15.13 | -20.75 | E | 15424 | ||
| J13273129b | 13 27 56.8 | 31 29 43 | 6.2 | 1.5 | 2.5 | 22.16 | unres. | 1.12 |
| #MT 1715 | 13 27 56.9 | 31 29 44 | 14.26 | -21.62 | E | 14037 | ||
| J13283145 | 13 28 02.6 | 31 45 20 | 22.9 | 15.7 | 0.68 | 22.65 | unres. | 1.15 |
| #8813 | 13 28 02.5 | 31 45 22 | 15.78 | -20.1 | E | 12801 | ||
| J13283157 | 13 28 49.7 | 31 57 02 | 13.9 | 13.3 | 0.08 | - | unres. | 1.71 |
| 13 28 49.9 | 31 57 00 | 17.15 | qso? | |||||
| J13283209 | 13 28 52.6 | 32 09 45 | 13.1 | - | - | 22.38 | res. | 2.71 |
| #9411 | 13 28 52.2 | 32 09 47 | 16.42 | -19.46 | S0? | 12450 | ||
| J13283151 | 13 28 57.6 | 31 51 36 | 2.0 | 0.9 | 1.50 | 21.81 | unres. | 0.34 |
| #9550 | 13 28 57.6 | 31 51 35 | 17.03 | -18.85 | E | 16532 | ||
| J13283144 | 13 28 59.4 | 31 44 15 | 2.2 | 5.3 | -1.56 | - | res. | 0.87 |
| #9541 | 13 28 59.2 | 31 44 16 | 17.98 | -17.9 | E | 13550 | ||
| J13293126 | 13 29 00.5 | 31 26 45 | 88.1 | 43.0 | 1.27 | - | FRII | |
| 13 29 00 | 31 26 34 | 18.00 | qso? | |||||
| J13293139 | 13 29 28.7 | 31 39 25 | 2.6 | 1.4 | 1.36 | 21.81 | unres. | 2.18 |
| #9931 | 13 29 28.4 | 31 39 26 | 17.07 | -18.81 | E | 14413 | ||
| J13293200 | 13 29 43.7 | 32 00 42 | 82.8 | - | - | - | unres. | 0.71 |
| 13 29 43.6 | 32 00 41 | 18.25 | qso? | |||||
| J13293122 | 13 29 49.3 | 31 22 20 | 4.3 | 3.6 | 0.30 | - | unres. | 0.58 |
| 13 29 49.3 | 31 22 19 | 18.54 | - | |||||
| J13293123 | 13 29 51.0 | 31 23 00 | 15.5 | - | - | 23.80 | FRII | |
| #10178 | 13 29 50.8 | 31 22 59 | 19.07 | E | 58755 | |||
| J13303144b | 13 30 08.8 | 31 44 17 | 3.2 | 2.3 | 0.56 | - | unres. | 0.46 |
| #10333 | 13 30 08.7 | 31 44 17 | 19.53 | - | ||||
| J13303122a | 13 30 19.1 | 31 22 59 | 421.7 | 800.0 | -1.13 | - | unres. | 0.35 |
| 13 30 19.1 | 31 22 59 | 18.46 | qso? | |||||
| J13303138 | 13 30 37.2 | 31 38 31 | 2.3 | 1.6 | 0.64 | - | unres. | 1.14 |
| 13 30 37.1 | 31 38 33 | 20.68 | - |
| Radio Name | RAJ2000 | DECJ2000 | S22 | S13 | logP22 | Radio Type | ||
|---|---|---|---|---|---|---|---|---|
| mJy | mJy | W Hz-1 | ||||||
| Opt. Name | RAJ2000 | DECJ2000 | bJ | Opt. Type | v (km s | |||
| J13313144 | 13 31 00.8 | 31 44 54 | 1.6 | 0.6 | 21.45 | unres. | 0.84 | |
| #11000 | 13 31 00.6 | 31 44 53 | 16.98 | -18.9 | E | 12141 | ||
| J13313139a | 13 31 11.3 | 31 39 38 | 2.6 | 0.7 | - | unres. | 1.41 | |
| 13 31 11.6 | 31 39 37 | 17.97 | qso? | |||||
| J13313128 | 13 31 16.8 | 31 28 28 | 18.7 | - | - | - | extended | 7.58 |
| 13 31 17.3 | 31 28 13 | 17.72 | qso? | |||||
| J13313125 | 13 31 31.6 | 31 25 11 | 4.9 | - | - | - | unres. | 2.81 |
| 13 31 31.5 | 31 25 05 | 17.34 | qso? | |||||
| J13313206 | 13 31 42.7 | 32 06 38 | 113.1 | 79.3 | 0.63 | - | FRII | 3.05 |
| 13 31 42.8 | 32 06 31 | 17.20 | qso? | |||||
| J13323146 | 13 32 03.1 | 31 46 47 | 4.7 | 3.0 | 0.81 | 21.98 | unres. | 1.17 |
| #11744 | 13 32 03.0 | 31 46 49 | 14.96 | -20.92 | E | 13107 | ||
| J13333141 | 13 33 31.6 | 31 41 01 | 99.0 | 61.3 | 0.85 | 23.39 | HT | 0.44 |
| #MT 4108 | 13 33 31.5 | 31 41 00 | 17.25 | -18.63 | E | 14438 | ||
| J13333130 | 13 33 37.4 | 31 30 45 | 37.2 | 19.5 | 1.15 | - | unres. | 0.89 |
| 13 33 37.2 | 31 30 46 | 22.42 | - | |||||
| J13343119 | 13 34 22.2 | 31 19 19 | 19.3 | - | - | - | extended | 0.91 |
| 13 34 22.3 | 31 19 18 | 20.63 | - | |||||
| J13343141 | 13 34 35.8 | 31 41 04 | 2.0 | 0.7 | 1.77 | 21.49 | unres. | 1.34 |
| #13198 | 13 34 35.9 | 31 41 07 | 16.48 | -19.4 | E | 11357 | ||
| J13343132c | 13 34 40.5 | 31 32 45 | 3.9 | 1.6 | 1.55 | 22.10 | res. | 5.88 |
| #13281 | 13 34 39.9 | 31 32 55 | 17.30 | -18.58 | E | 16490 | ||
| J13353139 | 13 35 03.0 | 31 39 18 | 15.8 | 11.1 | 0.63 | 22.63 | unres. | 1.07 |
| #13503 | 13 35 03.1 | 31 39 20 | 15.73 | -20.15 | E | 15077 | ||
| J13353130 | 13 35 07.9 | 31 30 42 | 1.6 | 1.4 | 0.28 | - | unres. | 0.73 |
| 13 35 07.8 | 31 30 41 | 16.22 | - | |||||
| J13353133 | 13 35 12.7 | 31 33 43 | 1.5 | 1.3 | 0.28 | 21.52 | unres. | 1.10 |
| #13629 | 13 35 12.6 | 31 33 45 | 16.36 | -19.52 | E | 13673 | ||
| J13353153a | 13 35 42.6 | 31 53 53 | 14.4 | 9.2 | 0.79 | 22.55 | FRI | 0.84 |
| #13815 | 13 35 42.5 | 31 53 55 | 16.02 | -19.86 | E | 14385 | ||
| J13353143b | 13 35 49.1 | 31 43 44 | 1.3 | 0.8 | 0.84 | - | unres. | 1.11 |
| 13 35 49.3 | 31 43 46 | 21.80 | - | |||||
| J13353146 | 13 35 54.3 | 31 46 34 | 9.4 | 6.5 | 0.66 | - | unres. | 1.26 |
| 13 35 54.4 | 31 46 37 | 22.05 | - | |||||
| J13353200 | 13 35 54.6 | 32 00 06 | 6.0 | - | - | - | unres. | 0.58 |
| 13 35 54.6 | 32 00 07 | 20.81 | - | |||||
| J13363140 | 13 36 09.6 | 31 40 07 | 12.8 | 7.0 | 1.07 | - | extended | 0.74 |
| 13 36 09.7 | 31 40 07 | 20.64 | - |
| Radio Name | RAJ2000 | DECJ2000 | S22 | S13 | logP22 | Radio Type | ||
| mJy | mJy | W Hz-1 | ||||||
| Opt. Name | RAJ2000 | DECJ2000 | bJ | Opt. Type | v (km s | |||
| J13363146b | 13 36 17.9 | 31 46 44 | 2.0 | 1.1 | 1.11 | 21.55 | unres. | 0.66 |
| #14198 | 13 36 18.0 | 31 46 46 | 16.06 | -19.82 | E | 12263 | ||
| J13363148 | 13 36 18.6 | 31 48 30 | 2.3 | 0.8 | 21.58 | unres. | 0.34 | |
| #14199 | 13 36 18.6 | 31 48 31 | 16.73 | -19.15 | E | 11839 | ||
| J13263155 | 13 26 30.4 | 31 55 32 | 1.0 | - | - | - | unres. | 1.30 |
| 13 26 30.4 | 31 55 35 | 19.42 | - | |||||
| J13343143 | 13 34 06.6 | 31 43 39 | 1.6 | - | - | - | unres. | 0.69 |
| #MT 4345 | 13 34 06.5 | 31 43 38 | 18.48 | - | ||||
| J13353134 | 13 35 18.9 | 31 34 57 | 1.1 | 0.63 | 0.99 | 22.64 | unres. | 0.33 |
| #13630 | 13 35 18.9 | 31 34 58 | 18.17 | E | 58050 | |||
| J13373145 | 13 37 26.7 | 31 45 22 | 4.2 | - | - | - | res. | 1.20 |
| 13 37 26.6 | 31 45 24 | 20.17 | - |
Notes to Table 4.
J13253141b: the source is included in Paper I, where the optical ID was missing.
J13263118: it is located at the east end of an extended edge-on spiral (or disk) galaxy.
J13293126: the candidate optical counterpart is a faint object misplaced with respect to
the barycentre of the radio emission.
J13293123: the optical identification is located in the barycentre of this double source.
J13313128: the radio source is extended and the optical counterpart falls within the radio
isophotes but it is not coincident with the peak.
J13313206: the optical counterpart is located in the barycentre of this double source.
J13343132c: the radio source is extended and the optical counterpart falls within the radio
isophotes but it is not coincident with the peak.
: these radio sources are reliable detections fainter than the sample flux density
limit (see Table 3).
The radio sources without 13 cm flux density lie at beyond the 13 cm field of view.
6 Properties of the Shapley radio galaxies
6.1 General comments on the radio galaxies
Two radio galaxies in the survey presented in this paper, both belonging to A3562, exhibit extended radio emission. In particular, J13333141 is a head-tail source located in the centre of the cluster, at a projected distance of arcmin ( 40 kpc) from the dominant cD galaxy, and J13353153 is located at the eastern periphery of the cluster and has a double morphology. These two radio galaxies will be presented in further detail in Section 7.
Considering that a further two extended galaxies were found in A3556, i.e. the tailed J13243138 (whose nature was discussed in Paper II) and the “mini” wide-angle tail J13223146 (Paper I), the total number of the extended galaxies in the A3558 complex is four. The remaining radio galaxies are point-like, or show only marginal extension.
As clear from Table 5 and from Paper I, all radio galaxies in the A3558 complex are faint, their power falling in the range logP22 (W Hz-1) = 21.45 - 23.39, typical of FRI objects. The strongest source is the head tail J13333141. These values suggest that the dominant mechanism for the radio emission has a nuclear origin. We point out that the detection limit of our survey, i.e. 1 mJy, corresponds to logP22 (W Hz-1) = 21.42, assuming an average recession velocity v = 15000 km s-1 for the Shapley Concentration. Such power is typical of low luminosity radio galaxies (ellipticals giving rise to FRIs) and of the strongest spirals.
6.2 Correlations with the local optical density
In order to explore the dynamical environment around our radio galaxies, we cross correlated our sample with the group list of Bardelli et al. (1998) obtained from their three dimensional sample. Two out of the 28 Shapley radio galaxies are located in a region not covered by the three dimensional analysis. Among the remaining 26, only five are not found in significant groups. However three of the five are part of a group just below the significance threshold and group could be considered an extension of the group T599 (see Table 2 in Bardelli et al. 1998). We found that the groups richest in radio galaxies are T337 (corresponding to the main component of A3558), T598 and T599, both located at the eastern periphery of A3562. The numbers of radio galaxies found in these groups are respectively 3, 3 and 4. This result reinforces the visual impression from Figure 4 that the region eastward of A3562 is particularly active at radio wavelengths. Conversely, it seems that groups in the regions of SC1329313 and SC1327312 are void of radio galaxies, although the statistics are poor.
It has been suggested (Gavazzi & Jaffe 1986) that there may be a correlation between the local optical density and the ratio between the radio and optical flux (RORF). In order to check if this behaviour holds also in the A3558 region, we correlated the local optical density obtained with the adaptive kernel method (Bardelli et al. 1998) with the RORF for our radio galaxies. The result of our analysis is given in Figure 6. No correlation is found between these two quantities. The radio galaxies in our sample are distributed in a stripe with constant RORF, independent of the local galaxy density, indicating that the power of the radio galaxies is not affected by the local galaxy density.

It is generally believed (Roland et al. 1985 and references therein) that cluster radio sources are characterised by a steeper spectrum than radio galaxies in other environments. This has been explained by invoking confinement of radiating electrons by the intracluster medium.
In order to see if any segregation effect in the distribution of the spectral index is present in the Shapley Concentration, we derived the spectral index for all radio galaxies in the A3558 complex. For this purpose we used the full resolution 22 cm images (Section 3.1) and made 13 cm natural weighted images convolved to the 22 cm HPBW (Section 3.2). These values are reported in Table 5. The average value of for those radio sources detected both at 22 cm and 13 cm is 0.79, well consistent with the typical values for radio sources of this class. We point out, however, that the presence of six lower limits for (see Table 5), may increase significantly the mean value. Note that among the four extended Shapley radio galaxies only the relic source J13243138 in A3556 has a steep spectrum (). We selected all the Shapley radio galaxies with (including the lower limits) and highlighted them in Figure 5 (lower panel) and in Figure 6. Quite surprisingly, the steep spectrum radio galaxies reside preferentially in low density regions at the border of the A3558 complex. The only exceptions to this behaviour are the cD galaxy J13273129b and J13293139, both in A3558. We also find that steep spectrum sources are not segregated in the density-RORF diagram with respect to the other sources (see Figure 6).
6.3 The radio luminosity function
The key question we wish to address is whether the ongoing merging in the A3558 complex has significant influence on the radio emission of the galaxies. The most direct method is to compute the radio-optical luminosity function for the galaxies in this region and compare it with the mean luminosity functions for cluster galaxies.
In order to compare our radio luminosity function (RLF) for the Shapley Concentration core to the results obtained by Ledlow & Owen (1996, LO96 hereinafter) for a complete sample of Abell clusters, we used only those radio galaxies with an optical counterpart brighter than bJ = 17.40 ( B) and with flux density S mJy. The magnitude limit corresponds to the limit M in LO96 using the standard conversion bJ = B - 0.2 (B-V) and the colours for early type galaxies given by Fukugita, Shimasaki & Ichikawa (1995). At the distance of the Shapley Concentration the flux density limit corresponds to logP22 (W Hz) = 21.78, the same lower limit as in LO96 after scaling for the different H0 adopted in their paper. These limits in flux density and magnitude reduced the number of radio galaxies used to compute the RLF to 17 out of the 28 detected in the whole A3558 chain (see Section 5).
The total number of optical galaxies in the A3558 region covered by our radio survey with b 17.40 is 216. To estimate the number of objects actually belonging to the Shapley Concentration, we corrected this number for the ratio between the number of the redshifts in the Shapley velocity range and the total number of redshifts available in this region, obtaining 203 galaxies. This includes all morphological types. For comparison with LO96, however, we need to know the fraction of early type galaxies. At this magnitude limit, a direct visual morphological classification is not possible, therefore for a reliable estimate of early type galaxies we followed two independent methods, which take into account respectively (a) the spectral information and (b) the colour index.
(a) Assuming that all spectra without emission lines correspond to early type galaxies, we corrected the total number of Shapley galaxies for the ratio between non emission line and the total number of spectra. We obtained 183 objects.
(b) Assuming that the subsample of Metcalfe et al. (1994) is representative of our survey, we corrected the total number of Shapley galaxies for the ratio between galaxies with B-R 1.46 and the total number, obtaining 187. The colour index limit is taken from Fukugita, Shimasaki & Ichikawa (1995) and includes ellipticals and S0.
We are aware of the limits of these two indirect methods, however the agreement obtained for the estimate of early type galaxies gives us confidence that it is realistic. In the computation of the luminosity function we adopted 185.
On the basis of a simple integration of the LO96 luminosity function, given this number of optical galaxies, we would expect 26 radio sources against the 17 observed. The fact that we have fewer radio sources than expected is confirmed when we compare the differential and integral luminosity function with LO96. The results of our analysis are given in Table 6, where we give the fractional and integral RLF in each power interval. The errors in each bin are poissonian. In Figure 7 the integral RLF for the A3558 complex is plotted together with the cluster RLF derived in LO96.
| logP22 | Fractional BLF | Integral BLF |
|---|---|---|
| 21.78 - 22.18 | 7/185 | 0.0918 |
| 22.18 - 22.58 | 6/185 | 0.0540 |
| 22.58 - 22.98 | 2/185 | 0.0216 |
| 22.98 - 23.38 | 1/185 | 0.0108 |
| 23.38 - 23.78 | 1/185 | 0.0054 |

It is clear that the two RLFs are significantly different, both in shape and scale, even taking into account the errors and the uncertainties in our estimate of the number of Shapley E+S0 galaxies. The cluster RLF shows a break at logP (W Hz-1) 24.4, while our RLF has a decreasing trend without break, and can be described by a single power law. Applying a KS test to the two distributions we find that the probability that they are the same is only %. Even allowing for the errors, the RLF derived for the A3558 complex is lower than LO96. This result suggests that the probability of a galaxy in the Shapley Concentration core to become a radio galaxy is lower than for the comparison sample of cluster galaxies from LO96, at least for logP1.4 22.5. After a statistical comparison with RLFs derived for galaxies not selected in clusters, LO96 confirmed the results already obtained by Fanti (1984) and concluded that the radio luminosity function does not depend on the local galaxy density. Our RLF is therefore different from those obtained in other environments.
7 The peculiar radio properties of A3562
7.1 The radio galaxies
As is clear from Table 5 and from Figures 4 and 5, nine of the 28 Shapley radio galaxies are located in A3562, the easternmost cluster in the chain, and most remarkably seven of them are located at the eastern edge of the cluster (see also Section 6.2). Two cluster radio galaxies, J13333141 and J13353153, exhibit extended emission. The other two extended radio galaxies in the A3558 complex, J13223146 and J13243138, are located in A3556, at the westernmost end of the chain, and have already been studied and discussed in Paper I and Paper II. In this Section we will concentrate on the radio properties of A3562.
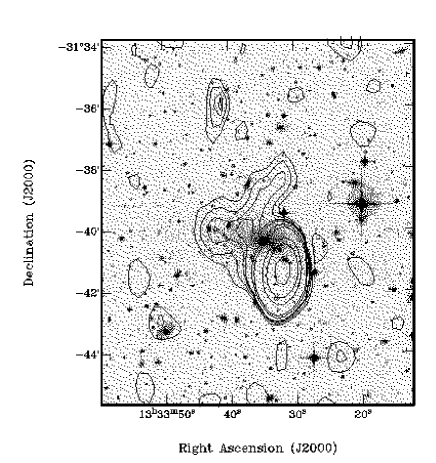
The 22 cm radio emission of A3562 is dominated by the head-tail source J13333141 shown in Figure 8, associated with a 17.25 magnitude elliptical galaxy (see Table 5), at a projected distance of ( kpc) from the cluster dominant cD. The bent shape of the tail suggests motion around the cD galaxy, possibly on a projected counter-clockwise orbit. The velocity difference between the cD galaxy and J13333141 is v = 110 km s-1. The total extent of this radio galaxy is , corresponding to a projected linear size 40 kpc.
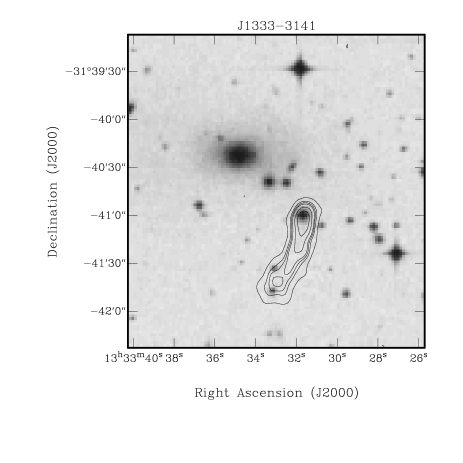
Our full resolution 22 cm and natural weighted 13 cm images give a total spectral index , typical for this type of sources. Assuming that the peak in the two images corresponds to the same region, we find that the spectral index is flattest in the peak, with , and steepens smoothly along the tail, increasing to a value at 43′′ from the peak. The brightness decreases smoothly along the tail, without secondary peaks of emission. The full resolution 13 cm image given in Figure 9 clearly shows that the surface brightness of the tail drops at 25 arcseconds from the core. This image also suggests that the nuclear region is complex, and that the peak in the 22 cm full resolution image and in the 13 cm natural weighted map are possibly the beginning of the bent twin jets not resolved by our observations rather than the core of the radio emission. In order to derive an estimate of the physical parameters in the tail, we used our value for the spectral index and we computed the magnetic field Beq in the source, the minimum non-thermal energy umin and the minimum non-thermal pressure Pnt under the hypothesis of equipartition and assuming cilindrical symmetry. We obtained BG, P dyne cm-2, u erg cm-3. Such values, which should be considered indicative, are in the range typical of tailed radio galaxies in clusters, though at the lower end (Feretti, Perola & Fanti, 1992).
A multifrequency and multiresolution study of this source is in progress and the results will be presented in a future paper.

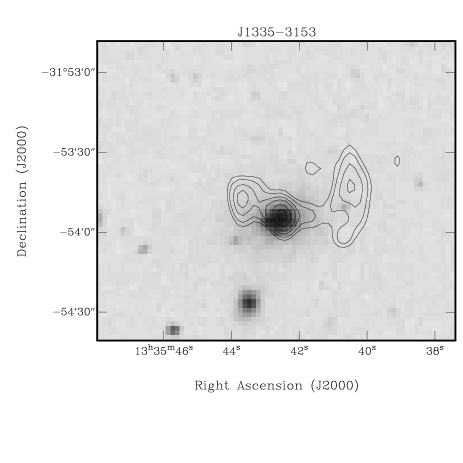
J13353153, shown in Figure 10, is a low luminosity radio source associated with a 16.02 magnitude galaxy with velocity v = 14385 km s-1. It is located at 31.4 arcmin from the centre of A3562 ( Mpc), towards the extreme eastern edge of the cluster. The lobes of this radio galaxy are not symmetric, the western one being more extended. From our ATCA observations we derived a total spectral index . The spectrum of the core is flatter, i.e. . With these values for the spectral index and assuming equipartition holds in this source we derived BG, P dyn cm-2 and u erg cm-3 while for the central component we obtained BG, P dyn cm-2, u erg cm-3.
The region where this source is located is at the extreme eastern edge of A3562, where the X–ray counts fall considerably. According to Kull & Böhringer (1999), the number of counts in the bin where this source is located correspond to an X–ray flux density of the order of erg s-1 cm-2. A multifrequency and multiresolution study of this source is being carried out.
7.2 A candidate radio halo at the centre of A3562 and extended radio emission around a peripheral cluster galaxy
The association between cluster radio halos, diffuse cluster X–ray emission, the presence of one or more head-tail sources near the cluster centre and a recent merging event are now widely accepted (see for instance Feretti & Giovannini 1996, Feretti et al. 1997, Feretti et al. 1990).
The presence of a head-tail radio galaxy located close to the centre of A3562, the X–ray emission coming from the centre itself and the ongoing merger in the A3558 complex led us to search for extended cluster emission in the centre of A3562 by inspecting the 1.4 GHz NRAO VLA Sky Survey (NVSS, Condon et al. 1998), whose sensitivity and resolution is well suited for the detection of extended low surface brightness emission.
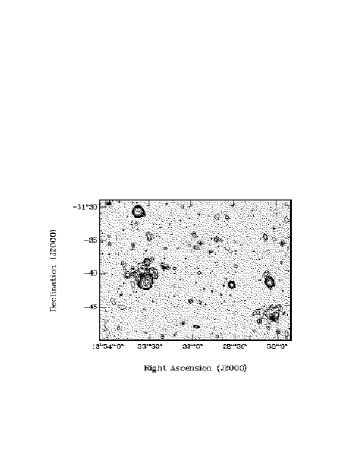
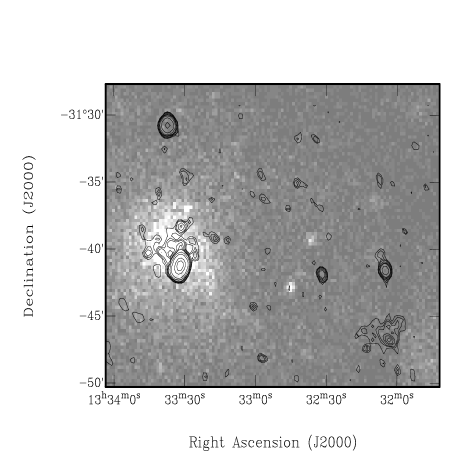
In Figure 11 we show the 20 cm (1.4 GHz) NVSS image of the field between the centre of A3562 and the group SC1329313 superimposed on the DSS optical frame, and in Figure 12 the same radio image is superimposed to the X–ray image taken from the ROSAT All Sky Survey archive. Both images show a wide field, i.e. , which includes the centre of A3562 and the galaxy #11744 (see below). Inspection of Figure 11 suggests that despite the presence of discrete sources, extended emission is indeed present at the centre of A3562, eastward of J13333141 in the direction of the dominant cD galaxy and superimposed on the X–ray cluster emission (Figure 12).
Given the large HPBW of the NVSS (), the head-tail J13333141 is only marginally resolved in the NVSS image. Extended emission is visible also in a 36 cm (843 MHz) image observed with the Molonglo Observatory Synthesis Telescope (MOST, Robertson 1991) by Hunstead et al. (in preparation), which we report in Figure 13, where the contours of the 36 cm MOST image are superimposed on the DSS optical image. The extension and morphology of the radio emission from the centre of A3562 at 20 cm (NVSS) and 36 cm (MOST) are in very good agreement, confirming that this feature is real.
This emission has an elongated structure, asymmetric with respect to the location of the head-tail, and from Figures 11 and 13 not obviously connected with J13333141. A detailed study on this radio extension and its possible connection with J13333141 is in progress.
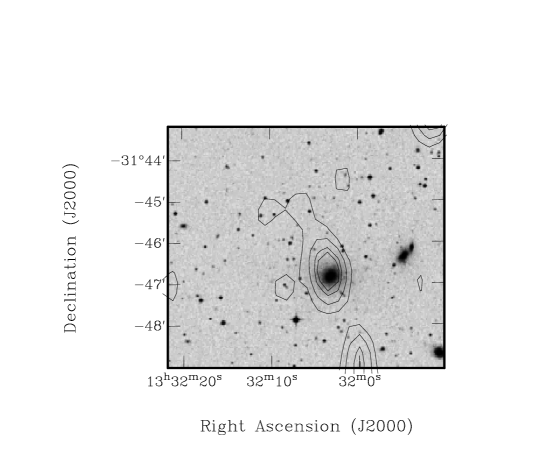
Another remarkable feature of the radio emission in A3562 evident from of Figure 11 and 12 is the existence of very low brightness extended emission around the radio galaxy J13323146, detected as a point-like source in our survey, and identified with the 14.96 magnitude galaxy #11744, with recession velocity v = 13107 km s-1 (see Table 5). This galaxy is located 21 arcmin ( 0.8 Mpc) westward of the A3562 centre, at a distance of 6 arcmin ( 240 kpc) from the dominant galaxy in SC1329313. This region of the A3558 complex is characterised by the presence of many peculiar and “disturbed” galaxies where a very high fraction of blue galaxies has been recently found by Bardelli et al. (1998). The projected angular size of this extended emission is , corresponding to kpc, and the flux density derived from the NVSS image is S20 = 21.4 mJy. The very low surface brightness of this source, coupled with its distance from the centre of the field where it was detected, i.e. #14, put the extended emission below the sensitivity limit of our survey. This source was also detected in the MOST 36 cm observations centred on A3562 (Hunstead et al., in preparation) and the 36 cm radio contours are given in Figure 14.
The possible radio halo in the centre of A3562 and the presence of an extended halo around a cluster radio galaxy are probably related to the merging state of the A3558 complex and further discussed in Section 8.
8 Discussion and Conclusions
The aim of this work is to investigate whether and how the cluster merging process is able to modify the radio properties of the galaxy population. From a theoretical point of view, the situation is not clear. Using simulations, Bekki (1999) found that the merging drives efficient transfer of gas to the central regions of galaxies, a good mechanism for feeding the central engine of AGNs and switching on a starburst. On the other hand, Fujita et al. (1999) concluded that gas stripping due to ram pressure is important in preventing gas supply to the galaxy central regions.
The ideal environment for studying the merging phenomenon is the centre of the Shapley Concentration. In particular, evidence has been accumulated that the A3558 complex is at a late stage of the merging of clusters of similar mass (Bardelli et al. 1996, 1998). Therefore, our approach is to study the radio emission of galaxies in a place where the existence of a major merging is established. This is different from the customary approach, where cluster interaction is found a posteriori, after detection of a particular phenomenon.
The results of our ATCA 22 cm survey of the merging clusters in the A3558 chain clearly indicate that the signature of cluster merging on the radio emitting properties of cluster galaxies and of the clusters themselves is complex.
The results emerging from our detailed statistical analysis of the radio properties in connection with the dynamical state of the A3558 complex, can be summarised as follows:
(1) the radio source counts in the A3558 complex are consistent with the background source counts at a confidence level of 99.6%, despite the much higher optical density in this region compared to the background;
(2) the ratio between the radio and optical flux for the Shapley radio galaxies is not affected by the local galaxy density;
(3) steep spectrum radio galaxies are not segregated in a density- diagram; on the contrary, galaxies with steep spectra () are preferentially located at the periphery of the A3558 complex, in regions where the galaxy density is much lower;
(4) for radio powers logP1.4 22.5 the radio-optical luminosity function for early type galaxies located in the A3558 region is significantly lower than that derived by other authors (LO96 and references therein) for early type galaxies in clusters and in the field.
The implications of these results are extremely important.
Point (2) indicates that the very high optical density of the merging environment in the Shapley concentration has no effect on the radio galaxy emissivity. In other words, given an optical magnitude, the radio power of the associated radio source does not depend on the local environment. This is not entirely surprising if we think that low power radio galaxies are almost only found in rich clusters of galaxies. However, our analysis suggests that not only the local density but also the merging environment plays no role in the radio power distribution of radio sources.
Point (1) suggests that the dominant source population in our survey is the background, and that the much higher optical density in the Shapley Concentration core and the ongoing merger is not reflected in a higher density of radio sources. In other words the Shapley Concentration would have not been spotted using radio source counts.
The implication of point (4) is even more extreme, since it suggests that the probability of a galaxy becoming a radio source with logP 22.5 is lower in the Shapley Concentration than in any other type of environment.
Our results can be explained in two different ways. In particular,
(a) merging neither influences the probability of a galaxy to becoming a radio source nor increases its emissivity;
(b) merging anticorrelates with radio emission, possibly switching off previously existing radio galaxies.
We point out that a preliminary analysis of the statistical radio properties in the merging complex formed by the three clusters A3528, A3530 and A3532 give similar results (Venturi et al. 1999).
Our results differ from those of Owen et al. (1999), who compared the radio-optical properties of a merging and a relaxed cluster, both at z 0.25, and concluded that cluster mergers triggers radio emission, both in the form of nuclear emission and of radio emission from starbursts. The difference in our results suggests that the role of mergers on the radio emission properties of clusters is complex, and a variety of parameters, such as for example stage of merger, impact velocities and timescales, are likely to play a role.
The complexity of the situation also emerges from the fact that despite the above mentioned statistical results, some specific radio properties in the A3558 chain seem to be the signature of cluster or group merger, most remarkably the candidate radio halo at the centre of A3562 and the extended emission around the radio galaxy J13323146. A detailed optical study of the spectral properties of the galaxies in the A3558 chain indicates that this region is populated by a very large fraction of blue galaxies. In particular 45% of the galaxies in this region show a blue excess, considered to be indicative of star formation induced by mergers (Bardelli et al. 1998). According to the numerical simulations of mergers in the A3558 complex, a shock front is expected in the region between SC1329313 and A3562 (Roettiger, Burns & Loken 1993).
Further observational support for an ongoing merger in this region of the A3558 complex comes from an X–ray spectral analysis carried out for the A3558 complex. ASCA observations by Hanami et al. (1999) show that SC1329313 exhibits remarkable peculiarities in this energy band. In particular, its observed gas temperature is higher than derived by the -TX relation and there is evidence that the gas is presently in a recombination phase rather than in ionization equilibrium. According to Hanami et al. (1999) these anomalies could be explained if SC1329313 is an ongoing merger (or if it just experienced a major merger event), responsible for gas outflow from the core of the group.
Acknowledgements
We thank Prof. R. Fanti for careful reading of the manuscripts and for insightful comments.
T.V. acknowledges the receipt of a grant from CNR/CSIRO (Prot. N. 088864).
The Australia Telescope Compact Array is operated by the CSIRO Australia Telescope National Facility.
References
- [1] Abell G.O., Corwin H.G. Jr, Olowin R.P., 1989, ApJS, 70, 1
- [2] Bardelli S., Zucca, E., Vettolani, G., Zamorani, G., Scaramella, R., Collins, C.A., MacGillivray, H.T., 1994, MNRAS 267, 665
- [3] Bardelli S., Zucca, E., Malizia, A., Zamorani, G., Vettolani, G., Scaramella, R., 1996, A&A 305, 435
- [4] Bardelli S., Zucca, E., Zamorani, G., Vettolani, G., Scaramella, R., 1998, MNRAS, 296, 599
- [5] Bardelli S., Pisani A., Ramella M., Zucca E., Zamorani G., 1998, MNRAS 300, 598
- [6] Bekki K., 1999, ApJL 510, L15
- [7] Blandford R., Eichler D., 1987, Phys. Rev. 154, 1
- [8] Bliton M., Rizza E., Burns J.O., Owen F.N., Leldow M.J., 1998, MNRAS, 301, 609
- [9] Breen J., Raychaudhury S., Forman J., Jones C., 1994, ApJ, 424, 59
- [10] Caldwell N., Rose J.A., 1997, AJ, 113,492
- [11] Condon, J.J., Cotton, W.D., Greisen, E.W., Yin, Q.F., Perley, R.A., Taylor, G.B., & Broderick, J.J., 1998, AJ, 115, 1693
- [12] de Ruiter H.R., Willis A.G., Arp H.C., 1977, A&AS 28, 211
- [13] Drinkwater, M.J., Barnes, D.G., Ellison, S.L., 1995, Publ. Astron. Soc. Austr. 12, 248
- [14] Ensslin T.A., Biermann P.L., Klein U., Kohle S., 1998, A&A, 332, 395
- [15] Ettori S., Fabian A.C., White D.A., 1997, MNRAS, 289, 787
- [16] Fanaroff B.L., Riley J.M., 1974, MNRAS 167, 31
- [17] Fanti R., 1984, in Clusters and groups of galaxies, Eds. F. Mardirossian, G. Giuricin & M. Mezzetti, Reidel Dordrecht, p. 185
- [18] Feretti L., Giovannini G., 1996, in Extragalactic Radio Sources, IAU Symp. 175, Eds. Fanti C., Ekers R., Padrielli L., Kluwer Ac. Publ., p. 333
- [19] Feretti L., Böhringer H., Giovannini G., Neumann D., 1997, A&A, 317, 432
- [20] Feretti L., Perola G.C., Fanti R., 1992, A&A, 265, 9
- [21] Feretti L., Dallacasa D., Giovannini G., Venturi T., 1990, A&A, 323, 337
- [22] Fukugita, M., Shimasaki K., Ichikawa T., 1995, PASP, 107, 945
- [23] Fujita Y., Takizawa M., Nagashima M., Enoki M., 1999, PASJ 51L, 1
- [24] Gavazzi G. & Jaffe W., 1986, ApJ, 310, 53
- [25] Hanami H., Tsuru T., Shimasaku K., Yamauchi S., Ikebe Y., Koyama K., 1999, ApJ 521, 90
- [26] Kull A., Böhringer H., 1999, A&A, 341, 23
- [27] Ledlow M.J. & Owen F.N., 1996, AJ 112, 9
- [28] Markevitch, M., 1996, ApJ, 465, 1
- [29] Markevitch, M., Vikhlinin A., 1997, ApJ, 474, 84
- [30] Metcalfe, N., Godwin, J.G., Peach, J.V., 1994, MNRAS 267, 431
- [31] Owen F.N., Ledlow M.J., Keel W.C., Morrison G.E., 1999, AJ 118, 633
- [32] Prandoni I., Gregorini L., Parma P., de Ruiter H., Vettolani G., Wieringa M.H., Ekers R.D., 1999, in Looking Deep into the Southern Sky, Eds. R. Morganti & W.J. Couch, Springer, p. 114
- [33] Raychaudhury S., Fabian A.C., Edge A.C., Jones C., Forman W., 1991, MNRAS, 248, 101
- [34] Reid, A.D., Hunstead, R.W., Pierre, M.M., 1998, MNRAS, 296, 351
- [35] Robertson J.G., 1991, Aust. J. Phys. 44, 729
- [36] Roettiger K., Burns J.O., Loken C., 1993, ApJ, 445, 80
- [37] Roettiger K., Burns J.O., Loken C., 1996, ApJ, 473, 651
- [38] Roland R., Hanisch R.J., Veron P., Fomalont E., 1984 A&A, 148, 323
- [39] Sarazin C.L., 1999, ApJ 520, 529
- [40] Sault R.J., Teuben P.J. & Wright M.C.H., 1995 in Astronomical Data Analysis Software and Systems IV eds. R. Shaw, H.E.Payne and J.J.E.Hayes, Astronomical Society of the Pacific Conference Series 77, 433
- [41] Slezak E., Durret F., Gerbal D., 1994, AJ, 108, 1996
- [42] Unewisse, A.M., Hunstead, R.W., Piestrzynski, B., 1993, Pubbl. Astron. Soc. Austr. 10, 229
- [43] Venturi T., Bardelli S., Morganti R., Hunstead R.W., 1997, MNRAS, 285, 898 (Paper I)
- [44] Venturi T., Bardelli S., Morganti R., Hunstead R.W., 1998, MNRAS, 298, 1113 (Paper II)
- [45] Venturi T., Bardelli S., Zambelli G., Morganti R., Hunstead R.W., 1999, in Diffuse thermal and relativistc plasma in galaxy clusters, Eds. H. Böhringer, L. Feretti & P. Schuecker, MPE report No 271, in press
- [46] Yentis, D.J., Cruddace, R., Gursky, H., Stuart, B.V., Collins, C.A., 1992 in Digitised Optical Sky Surveys, H.T.MacGillivray and G.B. Thomson eds, Kluwer Academic Publishers
- [47] Zucca E., Zamorani G., Scaramella R., Vettolani G., 1993, ApJ, 407, 470
- [48] Wieringa M.H. & Kesteven M.J., 1992, ATCA Technical Document Series, 39.2010