Identification of the Coronal Sources of the Fast Solar Wind
Abstract
The present spectroscopic study of the ultraviolet coronal emission in a polar hole, detected on April 6–9, 1996 with the Ultraviolet Coronagraph Spectrometer aboard the SOHO spacecraft, identifies the inter–plume lanes and background coronal hole regions as the channels where the fast solar wind is preferentially accelerated. In inter–plume lanes, at heliocentric distance 1.7 R⊙, the corona expands at a rate between 105 km s-1 and 150 km s-1, that is, much faster than in plumes where the outflow velocity is between 0 km s-1 and 65 km s-1. The wind velocity is inferred from the Doppler dimming of the O VI 1032, 1037 Å lines, within a range of values, whose lower and upper limit corresponds to anisotropic and isotropic velocity distribution of the oxygen coronal ions, respectively.
1 INTRODUCTION
One of the primary objectives of the SOHO mission is the identification of the source and acceleration mechanisms of the fast solar wind. Although polar coronal holes and regions with open magnetic field configuration were recognized long ago to be at the origin of the fast wind, the paucity of direct coronal hole observations from space in the long interval between the Skylab and SOHO missions prevented in the last two decades a real progress in studying how the fine structure of coronal holes regulates coronal expansion. Polar plumes, that are the most prominent features in polar coronal holes, and inter–plume regions have both been proposed to play an important role in the generation of the high–speed wind (e.g., Ahmad and Withbroe, 1977; Wang, 1994). SOHO observations have confirmed that plumes are denser, cooler and less dynamic structures than the surrounding regions (Doschek et al., 1997; Noci et al., 1997; Wilhelm et al., 1998). Nevertheless they are site of quasi–periodic compressional waves (DeForest and Gurman, 1998), identified as slow magnetosonic ones that however can carry only a fraction (2103 erg cm-2 s-1) of the energy required to accelerate the fast solar wind, 105 erg cm-2 s-1 (Ofman et al., 1999). The Ultraviolet Coronagraph Spectrometer (UVCS) onboard SOHO, is the first instrument that can allow us to determine the outflow velocity of the wind plasma in the outer corona and therefore to distinguish between the dynamic conditions of plumes and surrounding regions, at the height where the wind velocity has become significant. The results of such an analysis performed on the basis of the Doppler dimming of the O VI 1032, 1037 Å, detected in the period April 6–9, 1996, are reported in the present paper. Preliminary results of this study are found in the Ph.D. thesis by Giordano (1998).
2 OBSERVATION OF THE POLAR CORONAL HOLE
In the first detailed observation of the ultraviolet emission of a coronal hole above 1.5 R⊙, performed at solar minimum with UVCS during April 6–9, 1996, the polar region was scanned over an interval of 72 hours, starting on April 6, 1996 at 07:22 UT. The instantaneous field of view (29 arcmin x 14 arcsec), centered on the North pole, was moved by 14 arcsecond steps in the radial direction, thus ensuring a continuous coverage of the corona between 1.45 to 2.48 R⊙. For each spatial element, 14” x 14”, the two O VI lines, at 1031.91 Å and 1037.61 Å were detected with spectral resolution of 0.2 Å, and integration time of 3600 seconds. The raw data are calibrated according to the standard procedure (Gardner et al., 1996). The O VI line profiles are then fitted with a function resulting from the convolution of a gaussian function, for the solar spectral profile, with the Voigt curve describing the instrumental broadening, and a function accounting for the width of the slit (Giordano, 1998). The best fit is obtained by adjusting as free parameters standard deviation, , mean wavelength, , and peak, , of the solar profile. The observed line intensity is then the integral .
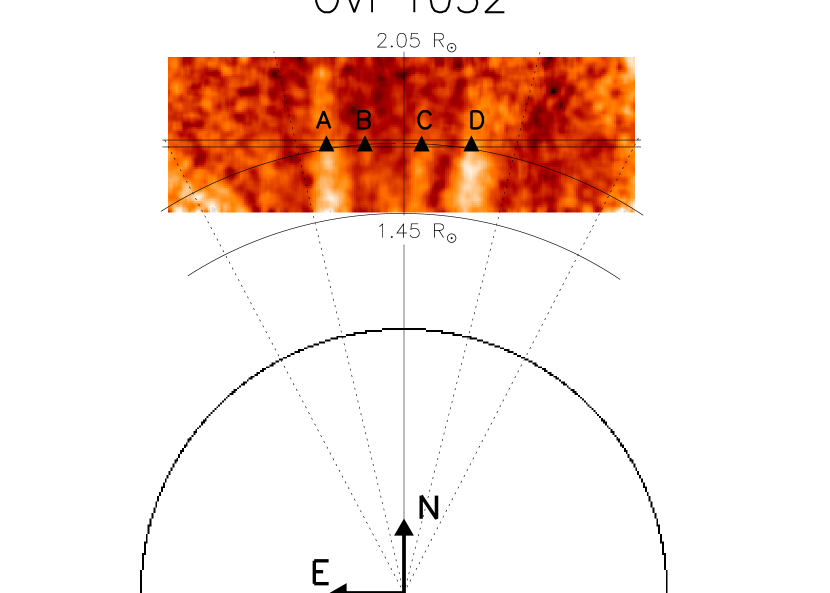
In the O VI images of the polar hole observed on April 6–9, plumes are clearly identified at least up to 2 R⊙. Four main plumes are present within 14∘ from the North pole, as the O VI 1032 image shows in Figure 1. They appear as bright broad features, dimming with heliodistance. Since the observation time to scan the corona out to 2 R⊙ is 1.4 days, plumes are either fairly stable or they tend to form again in almost the same position. In 1.4 days the displacement of the plumes due to solar rotation is negligible. Their width at 1.7 R⊙ is roughly 5109–1010 cm. Outside the central region, , plumes are weaker and fewer as shown by the intensity along the heliocentric circumference with radius 1.7 R⊙ (Figure 1).
Aim of the analysis is to determine the solar wind velocity in plumes and surrounding regions, including inter–plume lanes and darker areas of lower plume population, outside 14∘, that is, background coronal hole regions, with the intent of identifying the source of the high–speed wind. Therefore the different regions are studied at a height 1.7 R⊙, where plumes are still well identified and the wind has acquired on the average a sufficiently high velocity, 100 km s-1 (Strachan et al., 1993; Antonucci et al., 1997a, b; Kohl et al., 1997a, 1998; Giordano, Antonucci and Dodero, 1999).
The plume emission is averaged over the brightest peaks within 14∘ identified as dark segments in Figure 2, and the lane emission is averaged over the dimmest regions (dashed segments in Figure 2). The emission of dark background regions is averaged outside the interval 14∘. The background average heliodistance, 1.82 R⊙, is higher than that of plumes and inter–plume lanes, 1.72 R⊙.
3 WIND VELOCITY IN PLUMES AND LANES
The solar wind velocity relative to the three different regimes that have been identified, plume, inter–plume lanes and dark background, is then measured by determining the outflow velocity of the oxygen ions through the ratio of the Doppler dimmed O VI 1032 and 1037 Å resonance lines (Noci, Kohl and Withbroe, 1987; Dodero et al., 1998; Li et al., 1998).
In the outer corona these lines are emitted both via collisional excitation of the coronal ions and via resonant scattering of photons coming from the transition region. The second process is of increasing importance as the corona becomes more rarefied. In the frame of reference of the expanding solar wind the relative wavelength shift of incident photons and coronal absorbing profiles, causes a dimming of the resonant emission that is a function of the outflow velocity (Beckers and Chipman, 1974). The wind velocity can then be determined by the intersections of the observed O VI intensity ratios with the emissivity ratios curves calculated with the code by Dodero et al. (1998), for the coronal conditions observed, or inferred, at 1.7 R⊙. In a spherical symmetric corona, the ratios of the emissivities on the plane of the sky closely approximates the line intensity ratios (Noci, Kohl and Withbroe, 1987).
The electron temperature, , is deduced from the SOHO observations that indicate values that remain below 1106 K in a coronal hole and decrease above 1.15 R⊙ (David et al., 1998). A rare measurement in a bright plume, at 1.6 R⊙, yields a 4105 K temperature (Wilhelm et al., 1998). Higher coronal temperature values are determined on the basis of in–situ charge state ionization measurements, performed with SWICS/Ulysses, which are however derived in the assumption of slow wind (Ko et al., 1997). Here, we assume the temperature roughly equal to 3105 K at 1.7 R⊙ for both plumes and surrounding regions. The wind velocity results do not change in any significant way if a higher temperature, e.g. 1106 K, is assumed outside plumes. The plume electron density is derived from white light observations performed during minimum solar activity in 1996 (Guhathakurta et al., 1999). Since the inter–plume and background region density is not explicitly given in that paper, it is assumed to be equal to the quiet coronal hole (Table 1). The ratio of the plume and inter–plume density is consistent with the values published by Cranmer et al. (1999).
The O VI coronal absorbing profiles along the line–of–sight are directly measured with UVCS. The width of the ion velocity distribution along the line–of–sight, , is equivalent to the kinetic temperature, , where is the Boltzmann constant and is the ion mass. Table 2 reports the observed intensity ratios, , of the OVI 1037 to the OVI 1032 line and the observed kinetic temperature of the O VI ions along the line–of–sight, , together with the average heliodistance of the plume, inter–plume and background regions. The observed values (Table 2) confirm that the width of the ion velocity distribution is broader in lanes and background regions than in plumes (Antonucci et al., 1997b; Noci et al., 1997).
In the computation of the O VI emissivity the ion velocity distribution is considered to be bi–maxwellian. Since the broadening of the O VI lines in regions of open magnetic field lines is much larger than expected on the basis of ion–proton and proton–electron thermal balance (Antonucci et al., 1997a; Kohl et al., 1997a, b; Noci et al., 1997), it is reasonable to assume the width of the radial distribution (perpendicular to the line–of–sight) as a variable between two extreme cases, that is, oxygen–electron thermal balance along the radial direction and isotropic distribution, respectively. Furthermore, the existence of a degree of anisotropy in the oxygen velocity distribution is proven at least above 1.8 R⊙ (Kohl et al., 1997a, 1998; Antonucci, Giordano and Dodero, 1999; Cranmer et al., 1999). The emissivity ratios are then computed both for the radial velocity distribution characterized by , (i.e. maximum of anisotropy, corresponding to oxygen ions and electrons in thermal equilibrium along the radial direction) in Figure 3, and by , (i.e. isotropic velocity distribution) in Figure 4. Calculated and observed emissivity ratio of the O VI lines are compared to derive the outflow velocity.
4 OUTFLOW VELOCITY RESULTS
The expansion velocity, derived from the intersection of the emissivity ratio curve with the observed O VI ratio, in Figure 3 and 4, has not a unique value because of the lack of information on the radial ion velocity distribution, but it falls within a higher limit derived for isotropic oxygen velocity distribution and a lower value for the anisotropic case.
It is immediately obvious from the inspection of Figure 3 and 4, that lanes between plumes and dimmer background regions outside are the privileged sites for the fast solar wind acceleration. In these regions, at 1.7 R⊙, the fast solar wind has already reached speeds above 100 km s-1, while the plasma in plumes is either expanding slowly or remains almost static. In lanes the outflow velocity is between 105 km s-1 and 150 km s-1, and in darker regions between 110 km s-1 and 180 km s-1 for anisotropic and isotropic ion velocity distribution, respectively (Table 3). These values are of the order of the average outflow velocity detected from the O VI line emission integrated along the instantaneous field–of–view, at this height, which is between 100 km s-1 and 125 km s-1 (Giordano, Antonucci and Dodero, 1999). The tendency to measure higher velocity in the darker background regions might reflect the fact that they are located on the average at higher heliodistances, where the wind is faster. The errors of the outflow velocity derived for isotropy are larger because in this case the derivative of the emissivity ratio is smaller than in the case of anisotropy, as shown in Figure 3 and 4. No significant outflow velocity can be found in plumes for isotropic velocity distribution. However if the distribution of the oxygen ion velocity deviates from isotropy, it is possible to detect a slow expansion at 65 km s-1, much lower than that found for inter–plume lanes and background regions.
5 CONCLUSIONS
As a result of the spectroscopic analysis of the ultraviolet emission from a solar minimum polar hole in the outer corona, we can therefore conclude that there is strong evidence that the fast solar wind is preferentially accelerated in inter–plume lanes and in the darker background regions of a polar coronal hole. It is interesting to note that these are also the regions where the O VI line broadening is enhanced relative to that observed in plumes (Antonucci et al., 1997b; Noci et al., 1997).
According to the UVCS results (e.g., Kohl et al., 1997a), the wind acceleration is higher where line profiles are broader. This fact has led to interpret the excess line broadening in terms of preferential heating of the oxygen ions related to preferential acceleration of the solar wind. The correlation of higher outflow velocity and broader line profiles outside the plumes is consistent with this interpretation. This does not contradict the model by Wang (1994), that invokes higher heating at the base of plumes, since the enhanced broadening of the oxygen lines in inter–plume lanes, evidence for preferential heating of the oxygen ions, is probably related to wave-particle interaction occurring higher up in the corona (Kohl et al., 1998; Cranmer et al., 1999).
The present results, that identify the regions surrounding plumes as the dominant sources of the high–speed solar wind, together with those recently obtained by Hassler et al. (1999) and Peter and Judge (1999), who observed blue shifts at the base of polar coronal holes, suggesting that solar wind is emanating from regions along the boundaries of magnetic network cells, are finally indicating how to track back to the coronal base the fast solar wind velocity field lines.
References
- Ahmad and Withbroe (1977) Ahmad, I.A., and Withbroe, G.L.: 1977, Solar Physics, 53, 397.
- Antonucci et al. (1997a) Antonucci, E. et al.: 1997a, Fifth SOHO Workshop ESA SP–404, 175.
- Antonucci et al. (1997b) Antonucci, E. et al.: 1997b, Astronomical Society of the Pacific Conference Series, 118, 273.
- Antonucci, Giordano and Dodero (1999) Antonucci, E., Giordano, S. and Dodero, M.A.: 1999, et al.: 1999, Adv. Space Res., in press.
- Beckers and Chipman (1974) Beckers, J.M., and Chipman, E.: 1974, Sol. Phys., 34, 151.
- Cranmer et al. (1999) Cranmer, S.R. et al.: 1999, ApJ, 511, 481.
- David et al. (1998) David, C. et al.: 1998, A&A, 336, L90.
- DeForest and Gurman (1998) DeForest, C.E., and Gurman, J.B.: 1998 ApJ, 501, L217.
- Dodero et al. (1998) Dodero, M.A., Antonucci, E., Giordano, S. and Martin, R.: 1998, Sol. Phys., 183, 77.
- Doschek et al. (1997) Doschek, G.A. et al.: 1997, ApJ, 477, L119.
- Gardner et al. (1996) Gardner, L.D. et al.: 1996, Proc. SPIE, 2831, 2-24.
- Giordano (1998) Giordano, S.: 1998, PhD Thesis, University of Torino.
- Giordano, Antonucci and Dodero (1999) Giordano, S., Antonucci, E. and Dodero,M.A.: 1999, Adv. Space Res., in press.
- Guhathakurta et al. (1999) Guhathakurta, M. et al.: 1999, J. Geophys. Res., 104, A5, 9801.
- Hassler et al. (1999) Hassler, D.M. et al.: 1999, Science , 283, 810
- Hyder and Lites (1970) Hyder, C.L. and Lites, B.W.: 1970, Sol. Phys., 14, 147.
-
Ko et al. (1997)
Ko, Y.-K.
et al.: 1997,
Sol. Phys., 171, 345.
- Kohl et al. (1997a) Kohl, J.L. et al.: 1997, Sol. Phys., 175, 613.
- Kohl et al. (1997b) Kohl, J.L. et al.: 1997b, Adv. Space Res., 20, 3.
- Kohl et al. (1998) Kohl, J.L. et al.: 1998, ApJ, 501, L127.
- Li et al. (1998) Li, X., Habbal, S.R., Kohl, J.L. and Noci, G.: 1998, ApJ, 501, L133.
- Noci, Kohl and Withbroe (1987) Noci G., Kohl, J.L. and Withbroe, G.L.: 1987, ApJ, 315, 706.
- Noci et al. (1997) Noci, G. et al.: 1997, Adv. Space Res., 20, 2219.
- Ofman et al. (1999) Ofman, L., Nakariakov, V.M., DeForest, C.E.: 1999, ApJ, 514, 441.
- Peter and Judge (1999) Pete, H. and Judge, P.G. : 1999, ApJ, 522, 1148.
- Strachan et al. (1993) Strachan, L. et al.: 1993, ApJ, 412, 410.
- Wang (1994) Wang, Y.–M.: 1994, ApJ, 435, L153.
- Wilhelm et al. (1998) Wilhelm, K. et al.: 1998, ApJ, 500, 1023.
| Distance | |||
|---|---|---|---|
| (R⊙) | (105 cm-3) | (105 K) | |
| Plume | 1.72 | 5.1 | 3.0 |
| Lane | 1.72 | 3.6 | 3.0 |
| Background | 1.82 | 2.6 | 3.0 |
| Distance | |||
|---|---|---|---|
| (R⊙) | ( K) | ||
| Plume | 1.72 | 0.34 0.03 | 2.7 0.3 |
| Lane | 1.72 | 0.42 0.05 | 3.2 0.5 |
| Background | 1.82 | 0.43 0.04 | 4.5 0.6 |
| Plume | 65 (-25,+15) | 0 |
|---|---|---|
| Lane | 105 (-17,+11) | 150 (-57,+42) |
| Background | 110 (-10,+10) | 180 (-46,+39) |