Near-infrared emission-line galaxies in the Hubble Deep Field North
Abstract
We present the 2.12 m narrow-band image of the Hubble Deep Field North taken with the near-infrared camera (CISCO) on the Subaru telescope. Among five targets whose H or [O iii] emission lines are redshifted into our narrow-band range expected from their spectroscopic redshift, four of them have strong emission lines, especially for the two [O iii] emission-line objects. The remaining one target shows no H emission in spite of its bright rest-UV luminosity, indicating that this object is already under the post-starburst phase. The volume-averaged derived from the detected two H emission is roughly consistent with that evaluated from the rest-UV continuum.
1 Introduction
The Hubble Deep Field North (HDF-N) has been the deepest and the most scrutinizingly observed area since the first images taken by WFPC2 (Williams et al. 1996). The acquired data dramatically pushed the study of the global star-formation history of the early Universe with the establishment of the technique to determine the photometric redshift. The volume-averaged star-formation rate () derived from UV-to-optical data in this field shows a declination from the peak at 1.5 toward the higher- (Madau et al. 1996), while there are some suggestions that the remains almost at a constant value when the reddening correction (Calzetti 1998; Steidel et al. 1999) or the selection effect of the rest-UV surface brightness (Pascarelle et al. 1998) is taken into account. On the other hand, the volume-averaged derived from the H luminosity density tends to be larger than that evaluated from the rest-UV continuum (Pettini et al. 1998; Glazebrook et al. 1999; Yan et al. 1999), possibly due to a difference in the reddening effect between the UV continuum and the H emission line.
Now, the HDF-N has become a standard area for studying distant galaxies,
and various catalogs are available (Fernández-Soto et al. 1999; Thompson
et al. 1999; etc.). In this paper, we report on the results of the observation
of the HDF-N by the near-infrared camera CISCO mounted
on the Subaru telescope. This observation was planned not only for
verifying the system performance in the engineering phase just after
the first light observing run, but also for studying the H or
[O iii] luminosity density in this field. The details of the observation
and the data reduction are described in section 2, the detection of the
near-infrared emission-line objects and the numerical results are
reported in section 3, and the properties of these objects and the volume-averaged
star-formation rate are discussed in section 4. Throughout this paper, we
assume the Hubble constant of km s-1 Mpc-1 and the
deceleration parameter of .
2 Observations and Data Reduction
Observations of the HDF-N were made at the Subaru telescope on 1999 February 23,25, and 27 with the Cooled Infrared Spectrograph and Camera for OHS (CISCO; Motohara et al. 1998). The field was imaged through a standard (1.96–2.30 m) and H2 1–0 S(1) (2.110–2.130 m, hereafter N212) filters. Within the field-of-view of the CISCO, there are five candidates whose rest-frame optical emission lines are redshifted into the bandpass of the N212 filter on the basis of their spectroscopic redshifts. and several more candidates expected similarly from their photometric redshifts (Fernández-Soto et al. 1999 and references therein). The images were taken using an octagonal-star-like dither pattern with a diameter of 12′′. In the -band case, 20 s12 sequential exposures were made at each position (60 s6 in the case of N212), yielding a total exposure time of 1920 s for the standard round of the observation. Unfortunately, the seeing size was unstable during this observing run, and varied from 04 to 09 in each set of exposures. The observations are summarized in table 1.
All image reductions were carried out using IRAF. The initial reduction to make a “quick look image” followed that of standard infrared-image processing: a flat fielding using the “standard sky flat”, median-sky subtraction, and shift-and-add to combine the image. Then, the positions of the bright sources were listed in a “mask table” and the median-sky image was reconstructed by masking out the listed bright objects. In the -band case, the median smoothed sky image was also used as the self-sky-flat image, and all images were re-flattened by this frame. After applying secondary self-sky flat fielding and sky subtraction, the following reduction processes were carried out: a bad-pixel correction, self-fitting to remove any minor residual of the bias pattern with masking the listed bright object, and shift-and-add of all images with a 3 clipping algorithm. The reduced and N212 images are shown in figure 1. The effective exposure times are equal to the total exposure time of 5280 s in the - and 9360 s in the N212-band, respectively, because there was no discarded frame. The FWHMs for the point source in the final images are 058 () and 067 (N212).
3 Results
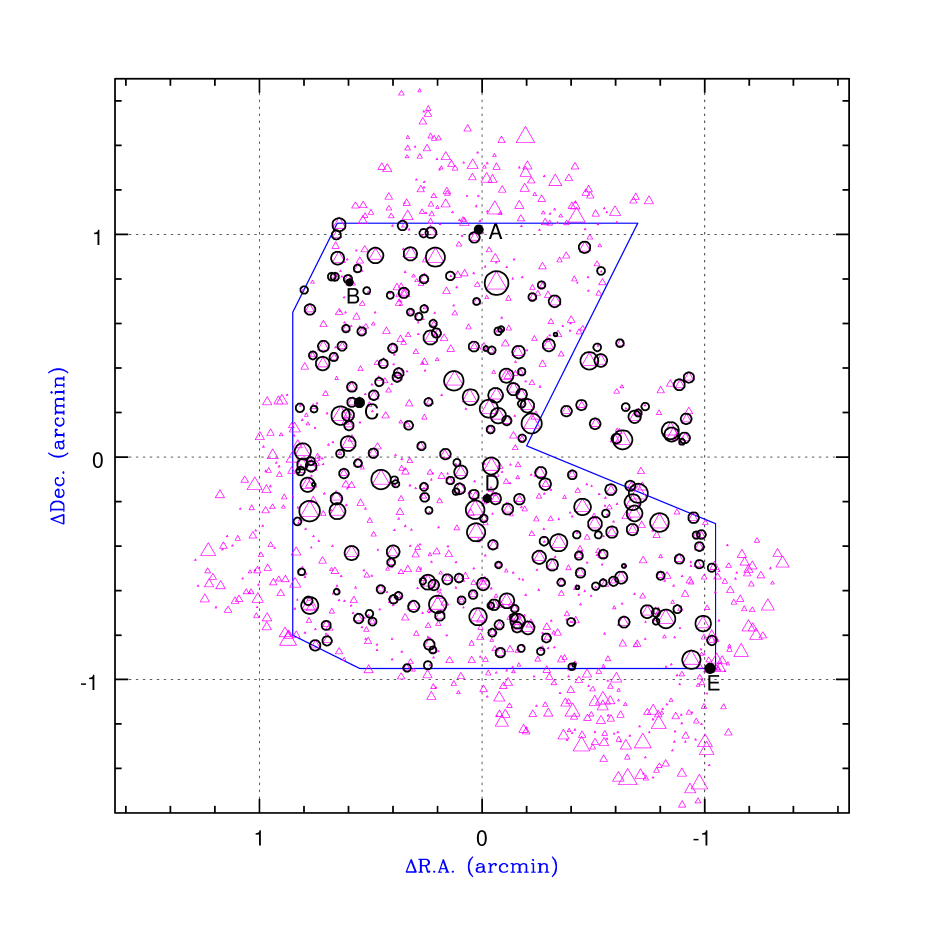
After a Gaussian smoothing was applied to the image to make the image size identical to that of the N212 image, object detection was performed on each frame using SExtractor (Bertin, Arnouts 1996). We employed the “BEST” (Kron-like) magnitude output as the total magnitude, while the N212 color within 116 (10 pix) aperture was measured by running SExtractor in the double-image mode: magnitudes for the N212 selected sample were derived using the N212 frame as a reference image for detection and the image for measurements only and vice versa for the selected sample. Next, each catalog was compared with the redshift catalog of Fernández-Soto et al. (1999) under the condition that the nearest corresponding pair having the position difference smaller than 09 is regarded as the same object. The size of the effective area is 3 arcmin2 and the distribution of the identified objects is shown in figure 2.
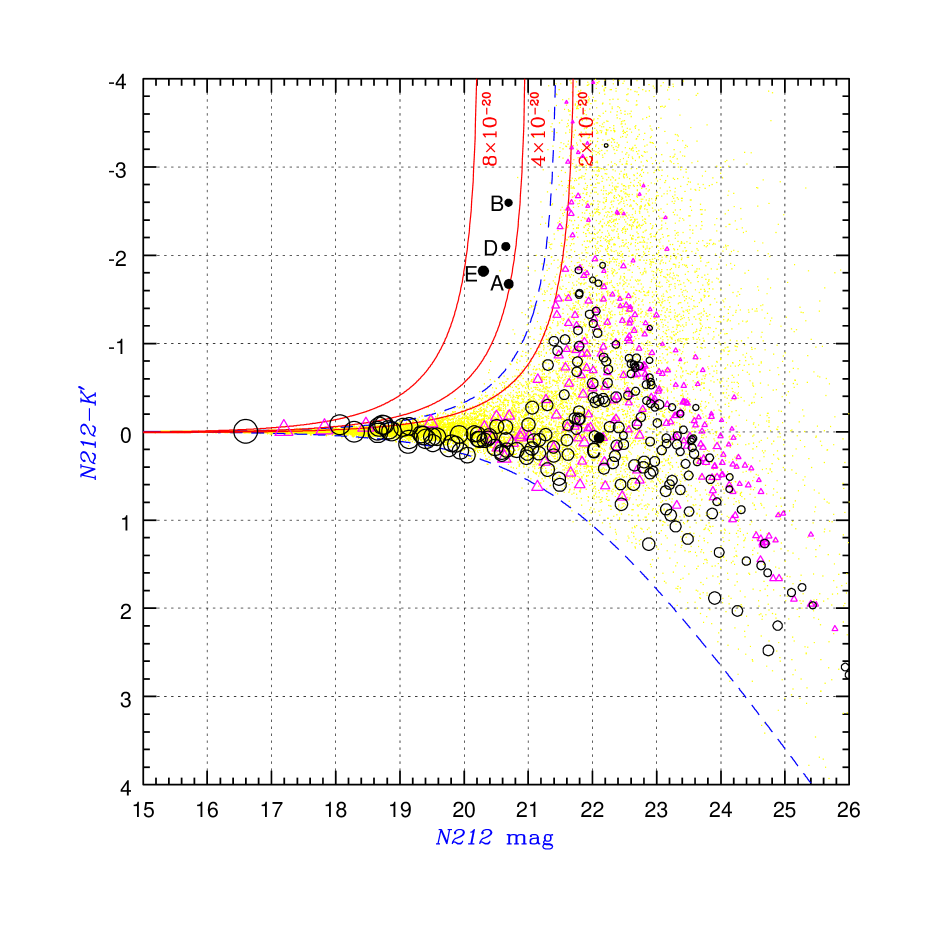
The identified and unidentified objects are plotted on the N212 color versus N212 magnitude diagram (figure 3) together with the simulated data of the artificial point sources whose intrinsic N212 colors are 0 mag. Here, the horizontal N212 mag is the aperture magnitude, because the scatter of the simulated data becomes smaller than in the case when the total magnitude is applied. The 98% confidence level estimated from the simulated data points is expressed as
| (1) |
corresponding to the 2.3 detection limit of the emission line of 2.6.
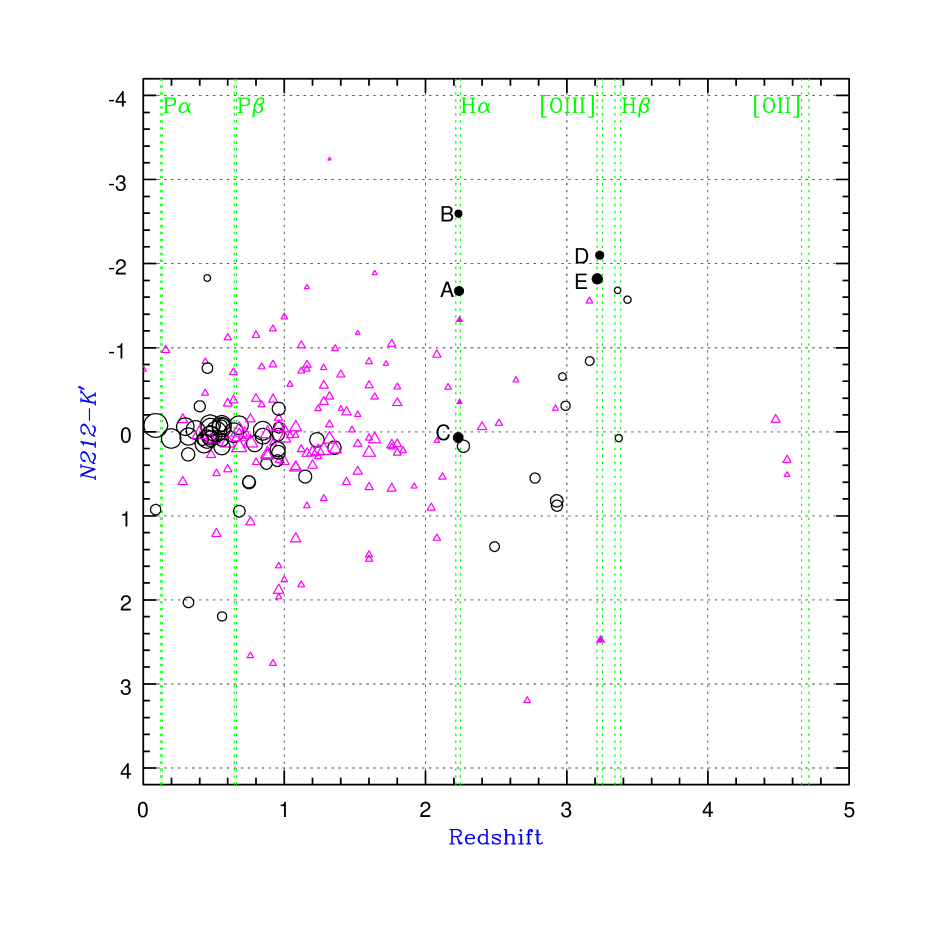
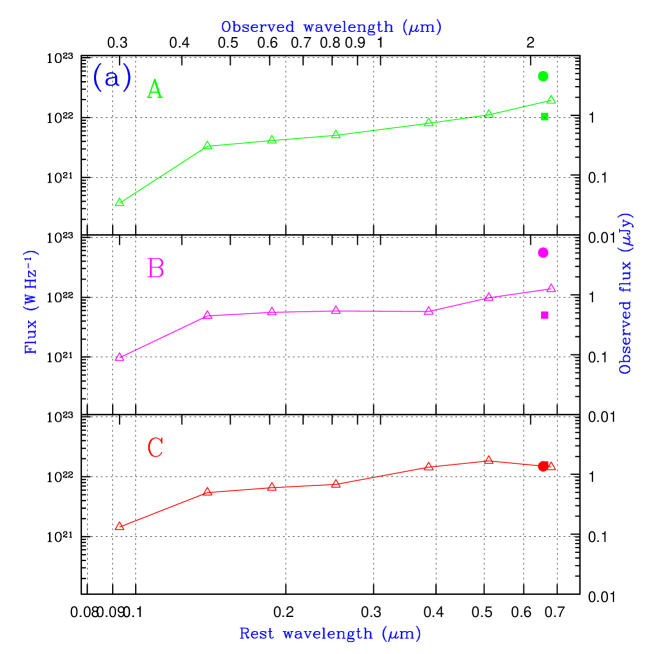
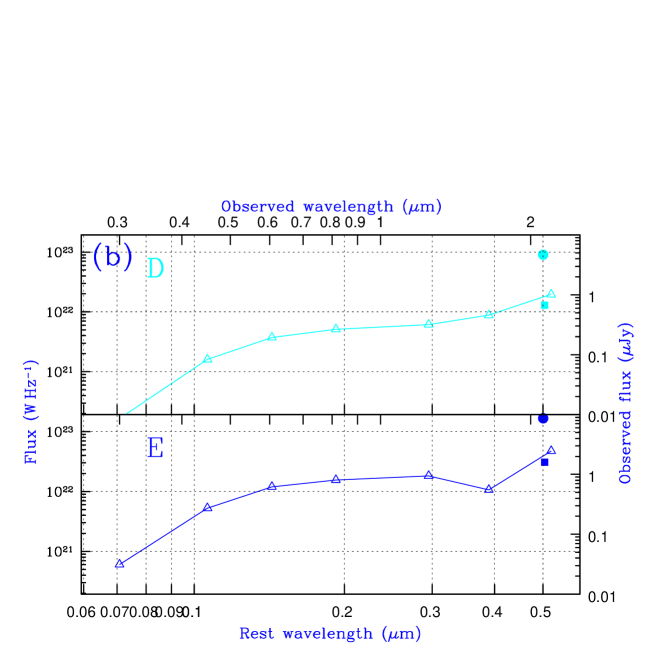
Figure 4 shows the redshift distribution of the identified objects. Among the objects with available spectroscopic redshift, seven are located where the emission lines are redshifted into the N212 filter bandpass. The SEDs of three objects (A,B,C) located in the redshift range for H are shown in figure 5a. The brightness and the shape of these SEDs are quite similar, while the H strength of object C is far different from that of A or B. The SEDs of other two objects (D,E) for [O iii] are also shown in figure 5b. We could not detect any emission from the remaining two objects for redshifted H and the other emission-line candidates expected from the photometric redshifts. The intensity of the emission lines and the s for objects A–E are listed in table 2. Here, we assumed an emission line ratio of H/[N ii] 6583,6548=2.3 (Kennicutt 1992; Gallego et al. 1997; Yan et al. 1999), and employed the conversion factor from Kennicutt (1998): ( yr(H) (erg s-1), ( yr(1600 Å) (erg s-1Hz-1).
4 Discussion
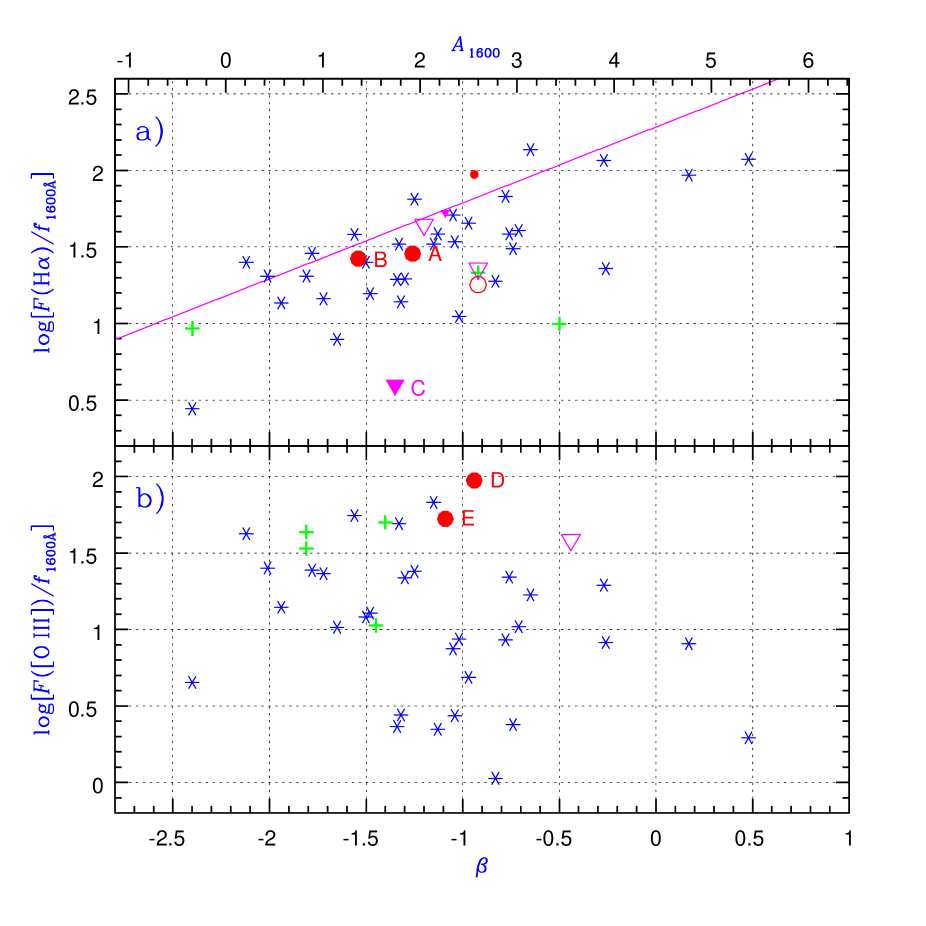
Recently, Meurer et al. (1999) reported that the UV spectral index () is a good indicator of dust extinction. They found a simple relationship between the dust absorption at 1600 Å() and the -parameter: . We assume that this correlation is also applicable to our results. First, we checked our results by using the same diagram of Meurer et al. (1999) (figure 6). The vertical axis is the “normalized line flux” defined as the ratio of line flux to flux density . In this diagram, the ratio of H indicates the rough duration time of post-starburst phase, because the H decays with a shorter timescale ( 20 Myr) than that for the UV continuum ( 100 Myr) (Kennicutt 1998). The condition of = without dust extinction implies a constant of the galaxy, displayed as the solid line in figure 6a. We employed the ’net’ obscuration expression of the stellar continuum reported by Calzetti (1998) to correct for the reddening factor at the wavelength of H. As can be seen, objects A and B are probably undergoing a starburst phase with a constant in contrast to object C, which has already finished starburst activity. In the case of the [O iii] emission line (figure 6b), objects D and E are located in a higher region compared with the distribution of the local starburst galaxies, and reside in a region similar to other Lyman-break galaxies. Although the [O iii] emission line is not a good quantitative indicator, due to its large diversity (Kennicutt 1992), it is still notable that the star-forming galaxies at high- tend to have strong [O iii] emission lines.
The remaining data points correspond to the other candidates from the photometric redshifts (open symbols) and the two redshifted H (small filled symbols) converted to the H flux assuming the case B condition. Although one marginal value with 12.3 is included (open circle in figure 6a), the accuracy of the photometric redshift ( 10%) does not seem to be sufficient to select the emission-line candidates for a narrow-band survey like this. On the other hand, one of two data points corresponding to the redshifted H emission is located at a higher position than the constant line in figure 6a. This is also a marginal data point, however, indicating that this object is a possible young starburst galaxy.
Next, the volume-averaged s were calculated using the H luminosity function at 0.7–1.9 obtained by Yan et al. (1999). The 2.3 detection limit of 2.6 corresponds to the H luminosity of . The survey volume () is for the redshifted H emission line. The sum of the for the two H-detected objects () is 22.5 yr-1 (see table 2). We then calculated the volume-averaged () using the following formulae:
| (2) | |||||
| (3) | |||||
| (4) | |||||
| (5) | |||||
| (6) | |||||
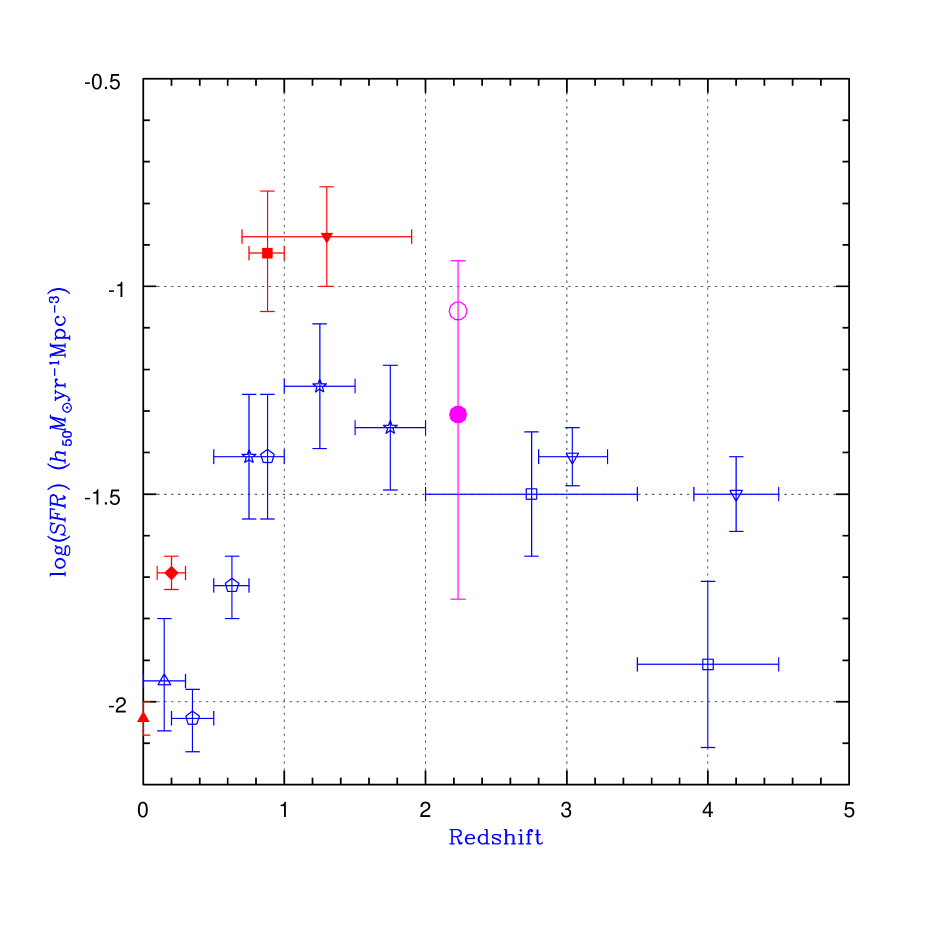
Our value is slightly larger than the previous results derived from the rest-UV continuum at 2.2 (see figure 7), showing the same tendency as the previous H survey reported by Glazebrook et al. (1999) or Yan et al. (1999). If we take the reddening effect expected from the -parameter into account, the resultant value of 0.09 yr-1Mpc3 is almost consistent with the reddening-corrected value calculated from the rest-UV continuum (Calzetti 1998; Steidel et al. 1999). Although the error is relatively large, the reddening correction by the -parameter works well as far as the present results are concerned.
Finally, we calculated the [O iii] luminosity density in the same manner as mentioned above
to compare with the H luminosity density expected from the previous results for
the UV continuum. Because the resultant ratio of the [O iii]/H luminosity density is
about 5, it cannot be explained as being the same star-forming activity in the local universe.
The most conceivable cause is that the high- star-forming galaxies emit a larger amount
of ionizing photons than local starburst galaxies due to some different type of
activity, making the [O iii] lines brighter. There is also another possibility,
that oxygen becomes the major cooling species, owing to the deficiency of metal elements,
similar to the nearby blue-compact-dwarf galaxies with metallicity of 0.1 solar
(Kunth, Ostlin 1999). Infrared spectroscopy is necessary to investigate such activity in
detail, and further observations by the OH-airglow Suppressor spectrograph on the Subaru
telescope (Maihara et al. 1993; Iwamuro et al. 1994) are expected to provide the infrared
spectra of high- star forming galaxies.
5 Conclusions
The 2.12 m narrow-band image of the HDF-N was taken with the near-infrared camera on the Subaru telescope. The main conclusions of the present paper are the following:
-
1.
We examined three objects whose H lines should be redshifted into our N212 narrow-band filter as expected from their known spectroscopic redshifts of 2.2. We found that two of the three targets are undergoing a starburst phase similar to the local starburst galaxies, while the last one target has already finished starburst activity, since no H emission was detected from this object.
-
2.
We also detected strong [O iii] emission lines from both targets with the known spectroscopic redshift of 3.2. We infer that the high- star-forming galaxy tends to show strong [O iii] emission, just like the Lyman-break galaxies reported by Pettini et. al (1998).
-
3.
The volume-averaged derived from the detected H lines is slightly larger than the values previously reported from the rest-UV continuum. They become almost consistent when the reddening correction is applied using the UV spectral index .
The present result was accomplished during an engineering observing run of the Subaru Telescope, and is indebted to all members of Subaru Observatory, NAOJ, Japan. We would like to express thanks to the engineering staff of Mitsubishi Electric Co. for their fine operation of the telescope, and the staff of Fujitsu Co. for the timely provision of control software.
References
Bertin E., Arnouts S. 1996, A&AS 117, 393 \reCalzetti D. 1998, in Proc. the Ringberg Workshop on Ultraluminous Galaxies (astro-ph/9902107) \reConnolly A.J., Szalay A.S., Dickinson M., Subbarao M.U., Brunner R.J. 1997, ApJ 486, L11 \reFernández-Soto A., Lanzetta K.M., Yahil A. 1999, ApJ 513, 34 \reGallego J., Zamorano J., Aragón-Salamanca A., Rego M. 1995, ApJ 455, L1 \reGallego J., Zamorano J., Rego M., Vitores A.G. 1997, ApJ 475, 502 \reGlazebrook K., Blake C., Economou F., Lilly S., Colless M. 1999, MNRAS 306, 843 \reIwamuro F., Maihara T., Oya S., Tsukamoto H., Hall D.N.B., Cowie L.L., Tokunaga A.T., Pickles A.J. 1994, PASJ 46, 515 \reKennicutt R.C.Jr. 1992, ApJ 388, 310 \reKennicutt R.C.Jr. 1998, ARA&A 36, 189 \reKunth D., Ostlin G. 2000, A&AR in press (astro-ph/9911094) \reLilly S.J., Le Fevre O., Hammer F., Crampton D. 1996, ApJ 460, L1 \reMadau P., Pozzetti L., Dickinson M.E. 1998, ApJ 498, 106 \reMadau P., Ferguson H.C., Dickinson M.E., Giavalisco M., Steidel C.C., Fruchter A. 1996, MNRAS 283, 1388 \reMaihara T., Iwamuro F., Hall D.N.B., Cowie L.L., Tokunaga A.T., Pickles A.J. 1993, Proc. SPIE 1946, 581 \reMeurer G.R., Heckman T.M., Calzetti D. 1999, ApJ 521, 64 \reMotohara K., Maihara T., Iwamuro F., Oya S., Imanishi M., Terada H., Goto M., Iwai J. et al. 1998, Proc. SPIE 3354, 659 \rePascarelle S.M., Lanzetta,K.M., Fernández-Soto A. 1998, ApJ 508, L1 \rePettini M., Kellogg M., Steidel C.C., Dickinson M., Adelberger K.L., Giavalisco M. 1998, ApJ 508, 539 \reSteidel C.C., Adelberger K.L., Giavalisco M., Dickinson M., Pettini M. 1999, ApJ 519, 1 \reTeplitz H.I., Malkan M.A., McLean I.S. 1999, ApJ 514, 33 \reThompson R.I., Storrie-Lombardi L.J., Weymann R.J., Rieke M.J., Schneider G., Stobie E., Lytle D. 1999, AJ 117, 17 \reTresse L., Maddox S.J. 1998, ApJ 495, 691 \reTreyer M.A., Ellis R.S., Milliard B., Donas J., Bridges T.J. 1998, MNRAS 300, 303 \reWilliams R.E., Blacker B., Dickinson M., Dixon W.V.D., Ferguson H.C., Fruchter A.S., Giavalisco M., Gilliland R.L., et al. 1996, AJ 112, 1335 \reYan L., McCarthy P.J., Freudling W., Teplitz H.I., Malumuth E.M., Weymann R.J., Malkan M.A. 1999, ApJ 519, L47
Table 1. Observation log.
| Date | Filter | Exposure | Seeing |
|---|---|---|---|
| 1999 February 23 | 1680 s(20 s127) | 05–08 | |
| N212 | 4320 s(60 s612) | 05–09 | |
| 1999 February 25 | 1920 s(20 s128) | 05–09 | |
| N212 | 5040 s(60 s614) | 06–10 | |
| 1999 February 27 | 1680 s(20 s127) | 04–08 |
Table 2. Emission-line strength and .
| Object | Spectroscopic | Line | (line) | ||
|---|---|---|---|---|---|
| redshift | 10-20W m-2 | yr-1 | |||
| A | 2.237 | H+[N ii] | 5.01.1 | 9.82.2 | 5.2 |
| B | 2.233 | H+[N ii] | 6.51.1 | 12.72.2 | 7.3 |
| C | 2.232 | H+[N ii] | 1.1 | 2.2 | 0.7 |
| D | 3.233 | [O iii] | 5.71.1 | (69.313.7)∗ | 5.9 |
| E | 3.216 | [O iii] | 10.01.1 | (121.713.7)∗ | 18.5 |
( yr([O iii]) (erg s-1) is assumed (Teplitz et al. 1999).