Infrared Imaging of the Gravitational Lens PG 1115+080 with the Subaru Telescope
Abstract
We present high spatial resolution images of the gravitational-lens system PG 1115+080 taken with the near-infrared camera (CISCO) on the Subaru telescope. The FWHM of the combined image is in the -band, yielding spatial resolution of after a deconvolution procedure. This is a first detection of an extended emission adjacent to the A1/A2 components, indicating the presence of a fairly bright emission region with a characteristic angular radius of 5 mas (40 pc). The near-infrared image of the Einstein ring was extracted in both the and bands. The color is found to be significantly redder than that of a synthetic model galaxy with an age of 3 Gyr, the age of the universe at the quasar redshift.
1 Introduction
The quadruply imaged = 1.722 quasar PG 1115+080 (Weymann et al. 1980) is one of the gravitational lens systems in which time delays have been measured (Schechter et al. 1997; Barkana 1997). Astrometric and photometric observations have been made by HST (Kristian et al. 1993; Impey et al. 1998) and by ground-based telescopes (Courbin et al. 1997). As a result, they have precisely determined the radial offset of each lensed component from the lensing galaxy, which is located at a redshift of 0.311 (Kundic et al. 1997; Tonry 1998). Restrictions on the Hubble constant were obtained on the basis of these observational materials along with appropriate lens models (Courbin et al. 1997; Kundic et al. 1997; Keeton, Kochanek 1997; Saha, Williams 1997; Impey et al. 1998).
A gravitational-lens system also offers an opportunity to study the detailed structure of the lensed object, because the lens effect serves as a natural telescope which magnifies and brightens the image of the lensed object, although the lensed images are distorted.
Recently, the infrared Einstein ring of PG 1115+080 was found (Impey et al. 1998) using the NICMOS camera, which is supposed to represent emission from the quasar host galaxy.
In this letter, we report on the results of near-infrared observations of PG 1115+080 made with the 8.2 m Subaru telescope, which was installed on the summit of Mauna Kea, Hawaii, at the end of 1998. Even in the very first stage of observations in early 1999 January, nearly ultimate performance as a ground-based, large mirror telescope has been demonstrated, as discussed in the following.
Based on and band images taken under an
seeing condition, we present the detection of the Einstein ring in
both bands, the distortion of the A1/A2 profiles in the deconvolved
image, and the structure of the quasar host galaxy.
2 Observations and Data Reduction
Photometric observations of PG 1115+080 were made on 1999 Jan 11 and 13 using the near-infrared camera CISCO (Motohara et al. 1998) mounted on the Cassegrain port of the 8.2 m Subaru Telescope on Mauna Kea. The camera uses a 10241024 element HgCdTe array (HAWAII; Kozlowski et al. 1994; Hodapp et al. 1996) with a pixel scale of pixel-1, giving a total field of view of . Although the exposure time for the normal full-frame readout is usually no shorter than 1.5 s/frame, in the present observations we utilized a fast-readout mode, by which subarray regions ( or pixels in the corner of each quadrant) could be sampled faster, with the minimum being 0.025 s/frame.
Fortunately, there is, by chance, a reference star (star A in figure 1) located in one of the subarray regions while aiming at PG 1115+080 in the other quadrant, so that both objects could be observed simultaneously.
For the cancelation of sky emission we periodically moved the telescope
in the north–south direction, by after taking 96 frames
at one position with an exposure time of 0.3 s/frame.
The total numbers of frames obtained were 3456 and 4032 in
the - and -band, respectively, giving overall integration
times of 1037 s () and 1210 s ().
The obtained data were reduced through standard common processes of sky subtraction,
flat-fielding, and the correction of bad pixels. After each pixel was divided
into 44 sub-pixels, the images were shifted and added
by reference to the center of gravity of the stellar image of star A. Since we
noticed that the point-spread function (PSF) profiles are not exactly
the same between the object position and the position of star A, possibly
due to the nature of the optical system of CISCO, the PSF of star A
was linearly transformed using the matrix with values of elements in table 1,
| (1) |
so as to make component C of PG 1115+080 to be a virtual point source.
Finally, PSF subtraction and MEM deconvolution were applied to
the combined image using this transformed PSF.
3 Results
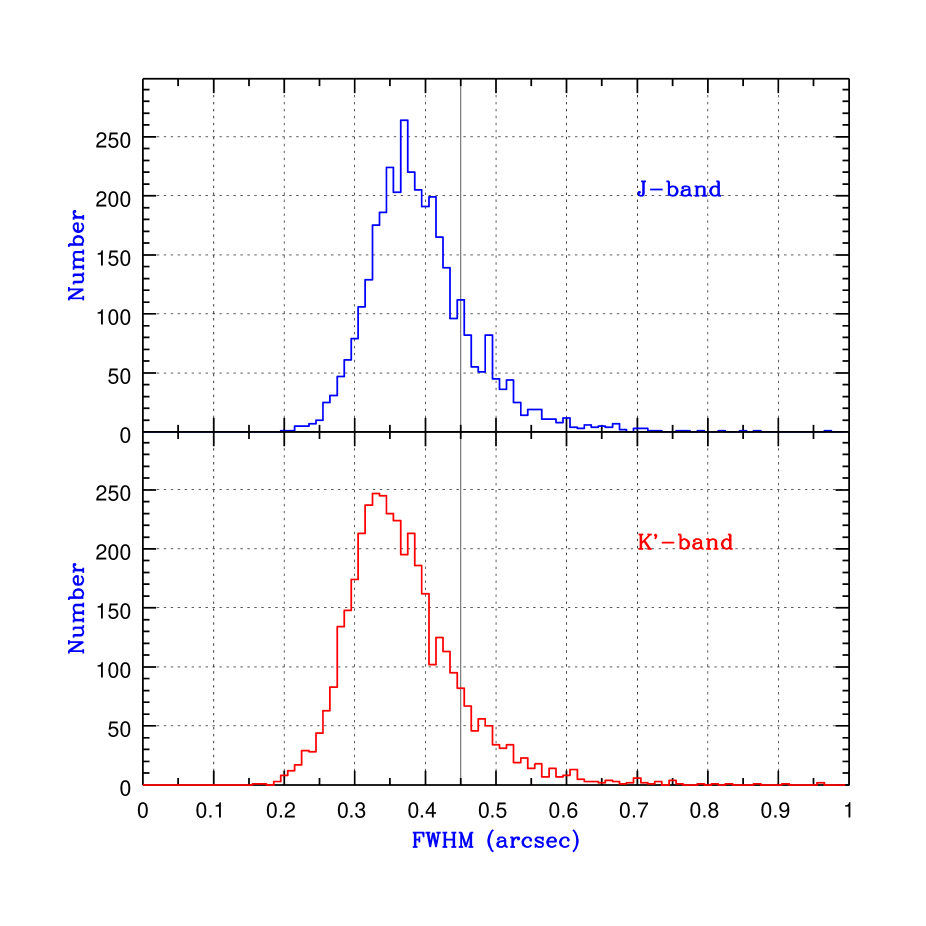
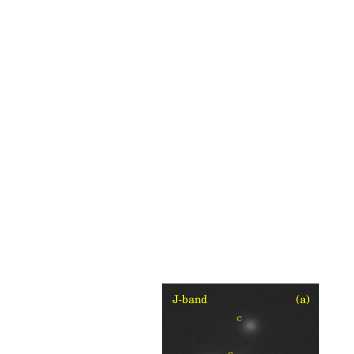
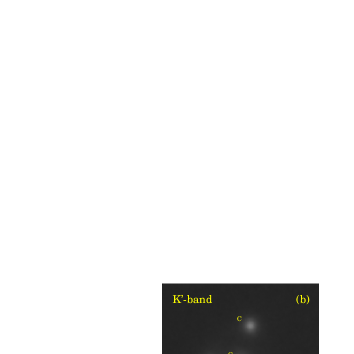
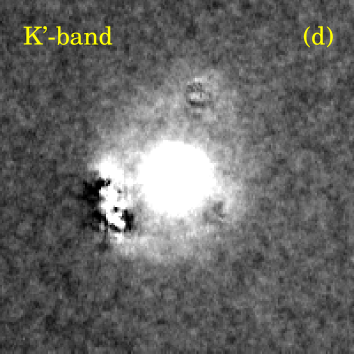
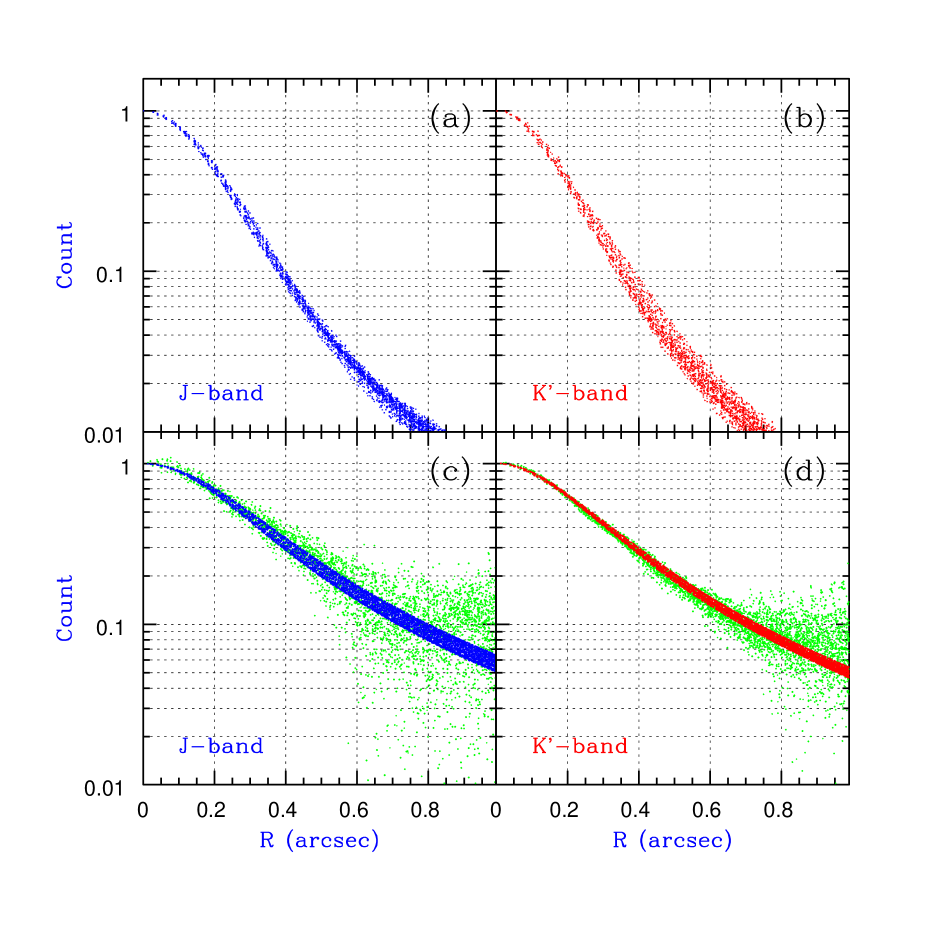
Analyses of the PSF of the recorded images in the - and -bands were performed using the IRAF image processing package, providing histograms of the statistical distribution of the FWHM values, as presented in figure 2. The images with FWHMs larger than 045 ( 20% out of the frames recorded) were excluded in the shift and add procedure so as to secure better images, which are displayed in figures 3a and b. The resultant co-added images of star A are represented by FWHMs of and in the - and -bands, respectively (figures 4a and b). The photometry of each component was carried out within a circular aperture of 086 diameter. In reducing calibrated fluxes of individual sources, flux corrections were applied by adding the relative contribution in the outskirt region of the transformed PSF, which would, otherwise, be excluded by the 086 aperture photometry. The result is presented in table 2.
As for the spatial structure of the lensing galaxy, it is assumed that the intrinsic radial distribution of the surface brightness has a de Vaucouleurs profile (figures 4c and d), and that the parameters describing the galaxy have been determined. The actual method is, first, to convolve the de Vaucouleurs expression with appropriate parameters using the transformed PSF, and then to compare it with the observed profile. The results are an effective radius of , the surface brightness in the center, mag arcsec-2 (in the band), the ellipticity, 0.1, and a position angle of .
The photometric error of the zero point is estimated to be 0.05 mag, which is mostly attributed to the uncertainty in the photometry of star A, whose magnitudes were determined by measuring faint standard stars, such as FS 19 and FS 21 of the UKIRT FS Catalog (Casali, Hawarden 1992), with identical observing configurations. The colors of the respective components in the image are also given in table 2.
It should be noted that component A1 is significantly bluer than other split-image components, which may be associated with the fact that the fairly large flux ratio in the A1/A2 pair can not be interpreted using a normal simple lensing configuration.
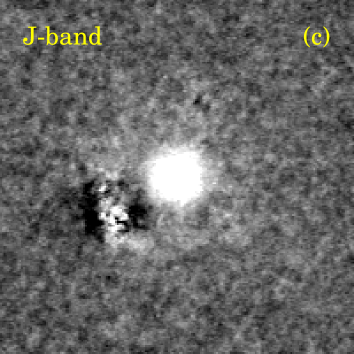
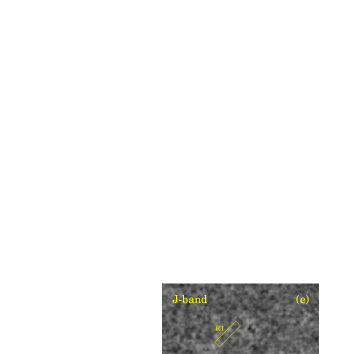
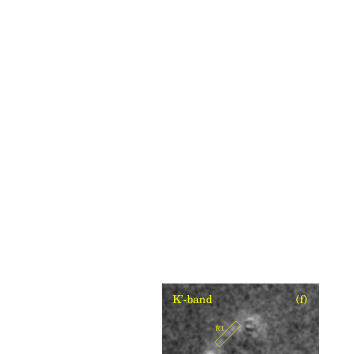
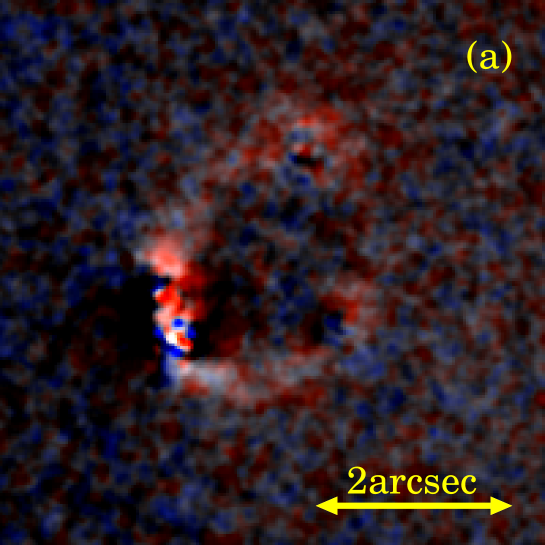
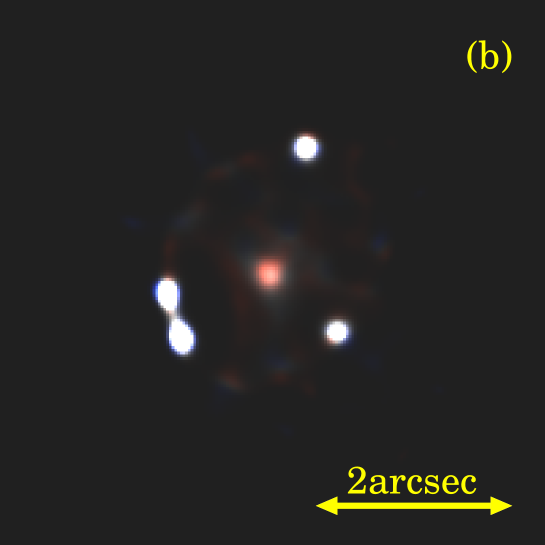
A somewhat asymmetric annulus of the Einstein ring is shown to remain when subtracting all of the lensed components A1,A2,B, and C and the lensing galaxy G in both the and bands. In presenting the surface brightness of the ring, we select two particular regions (R1 and R2 in figure 3e and f) where the brightness of the Einstein ring suffers less from the uncertainty caused by the process of removing the images of the A1/A2 system. The results are given in the lower lines of table 2. A two-color image produced from figures 3e and f is shown in figure 5a. The implication of this reddish color is discussed later.
With the MEM deconvolution task in the IRAF STSDAS package, we deconvolved
images of the two bands so as to produce a high spatial resolution color image of the quasar,
as presented in figure 5b, where the source size is
in FWHM. It is important to note that the B and C components are simply
round shaped, while the A1/A2 system is significantly different from a
symmetric shape. The meaning of this elongated morphology is briefly interpreted
in the following discussion.
4 Discussion
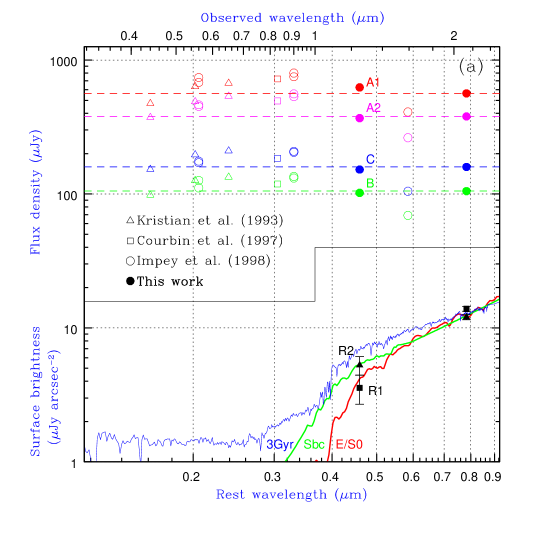
The spectral energy distributions (SEDs) of the components of the PG 1115+080, including the Einstein ring, are plotted in figure 6, where the data presented in past literature are added (see inset captions). The quasar spectrum appears to be flat (the index of power being nearly zero) over the observed wavelength range, except for the blue bump at around the 250 nm region. The flat nature of SEDs with a distinctive blue bump is typical of quasars with a pole-on geometry (Baker, Hunstead 1995; Baker 1997). The absorption-free spectrum indicates that the central source is obscured neither by the host galaxy nor by the intervening lensing galaxy.
On the contrary, the ring regions show considerable red colors, even after allowing for the uncertainties, as indicated by the error bars in the figure. In the meantime, from a model calculation of the gravitational lens system, which is basically the same method described as that by Keeton et al. (1998), it is seen that the regions designated by R1 and R2 lie at galactocentric distances of 2 kpc and 1 kpc, respectively. By comparing the SEDs of synthetic model galaxies based on those of nearby galaxies of various types, we can see that two-band photometry data of the host galaxy appear to correspond to that of an aged galaxy older than 3 Gyr, or even to E/S0 galaxies. Here, we refer to the SEDs presented by Coleman et al. (1980) for nearby galaxies; the modeled SED was calculated using the code given by Fioc and Rocca-Volmerange (1997), in which we adopted an exponential burst star-formation model with a time scale of = 1 Gyr.
It is interesting to note that an inferred age of 3 Gyr corresponds to the age of the universe at the quasar redshift. Here, we take = 75 km s-1Mpc-1 and = 0.1 for cosmological parameters.
The present result deduced from the unexpectedly red color of the host galaxy could be interpreted either by 1) a hypothesis that the host galaxy contains a certain amount of dust, thus making the color appreciably redder than nearby starburst galaxies, or 2) the case that the color is intrinsically red with negligible internal absorption.
In the latter case, however, an age of 3 Gyr of the galaxy contradicts an epoch of = 1.72 of the Universe. Virtually instantaneous star formation with a particular initial mass function (IMF) could ease the situation, because the contribution of asymptotic giant branch (AGB) stars in the mass range from 5 to 10 makes an SED fairly red on a time scale of 1 Gyr. As for the former case, the dusty environment in the host galaxy is not necessarily unrealistic, although the quasar light apparently suffers from no significant dust extinction, because the dust in the line of sight could be blown off by the intermittent jet activities reported by Michalitsianos et al. (1996). To clarify the nature of the overall spectrum of the host galaxy, further detailed spectroscopic observations are required.
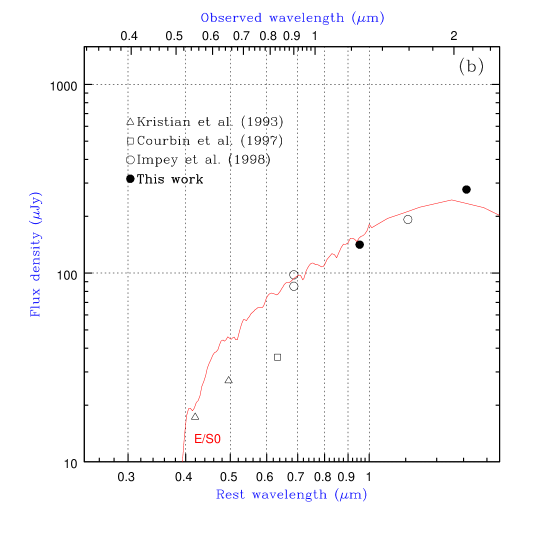
The observed fluxes at and of the lensing galaxy are plotted in accord with a typical SED of the E/S0 galaxy (Coleman et al. 1980; Yoshii & Takahara 1988). It has also been confirmed that the obtained radial distribution of the surface brightness is well represented by the de Vaucouleurs profile and, moreover, that the shape is slightly, but significantly, ellipsoidal, as found by Impey et al. (1998). The fitted position angle of the ellipsoid is , consistent with the result of Keeton et al. (1998) in which they report that the position angles of the optical axis of ellipsoids generally agree with those of the modeled mass distribution in most cases of gravitational-lens systems. In particular, they predicted a position angle of PG 1115+0080 as being 67∘, which is the same as the light distribution given by the present observation.
Finally, let us remark that the image profiles of the quasar, exhibit a
deformed shape of the A1 and A2 components (see figure 5).
These elongated emission components, whose color is quite similar to that of
the quasar, itself, is believed to be real in view of the observational accuracy.
In a quantitative analysis using the model calculation of the present
lens system, we found that the circumnuclear emission as close as
40 pc ( 5 mas) to the central quasar should be responsible for
the bridge-like structure connecting components A1 and A2.
Because the radial distance is considerably larger than the size of the typical broad
line region (1 pc), we speculate that the light originates
from illumination caused by electron scattering, supposedly taking place
near to the surface of the surrounding toric gaseous cloud, from where electrons
are supplied by intense ionizing radiation of the central source.
In this view, the exact line of sight to the quasar is presumed to be
virtually free from absorbing or scattering material; such a configuration is
consistent with the observed quasar spectrum, as formerly pointed out.
The present result, accomplished as one of the first-light observing programs
of the Subaru Telescope, is indebted to all members of Subaru Observatory,
NAOJ, Japan. We would like to express thanks to the engineering staff of Mitsubishi
Electric Co. for the fine operation of the telescope, and the staff of Fujitsu Co.
for timely provision of control software. The authors are grateful to M. Fioc and
B. Rocca-Volmerange for the generous offer to provide their galaxy-modeling
code, PEGASE.
References
Baker J.C. 1997, MNRAS 286, 23 \reBaker J.C., Hunstead R.W. 1995, ApJ 452, L95 \reBarkana R. 1997, ApJ 489, 21 \reCasali M., Hawarden T. 1992, JCMT-UKIRT Newsletter No.4, 33 \reColeman G.D., Wu C.-C., Weedman D.W. 1980, ApJS 43, 393 \reCourbin F., Magain P., Keeton C.R., Kochanek C.S., Vanderriest C., Jaunsen A.O., Hjorth J. 1997, A&A 324, L1 \reFioc M., Rocca-Volmerange B. 1997, A&A 326, 950 \reHodapp K.-W., Hora J.L., Hall D.N.B., Cowie L.L., Metzger M., Irwin E., Vural K., Kozlowski L.J. et al. 1996, New Astronomy 1, 177 \reImpey C.D., Falco E.E., Kochanek C.S., Lehár J., Mcleod B.A., Rix H.-W., Peng C.Y., Keeton C.R. 1998, ApJ 509, 551 \reKeeton C.R., Kochanek C.S. 1997, ApJ 487, 42 \reKeeton C.R., Kochanek C.S., Falco E.E. 1998, ApJ 509, 561 \reKozlowski L.J., Vural K., Cabelli S.C., Chen C.Y., Cooper D.E., Bostrup G.L., Stephenson D.M., McLevige W.L. et al. 1994, Proc. SPIE 2268, 353 \reKristian J., Groth E.J., Shaya E.J., Schneider D.P., Holtzman J.A., Baum W.A., Campbell B., Code A. et al. 1993, AJ 106, 1330 \reKundic T., Cohen J.G., Blandford R.D., Lubin L.M. 1997, AJ 114, 507 \reMichalitsianos A.G., Oliversen R.J., Nichols J. 1996, ApJ 461, 593 \reMotohara K., Maihara T., Iwamuro F., Oya S., Imanishi M., Terada H., Goto M., Iwai J. et al. 1998, Proc. SPIE 3354, 659 \reSaha P., Williams L.L.R. 1997, MNRAS 292, 148 \reSchechter P.L., Bailyn C.D., Barr R., Barvainis R., Becker C.M., Bernstein G.M., Blakeslee J.P., Bus S.J. et al. 1997, ApJ 475, L85 \reTonry J.L. 1998, AJ 115, 1 \reWeymann R.J., Latham D., Angel J.R.P., Green R.F., Liebert J.W., Turnshek D.A., Turnshek D.E., Tyson J.A. 1980, Nature 285, 641 \reYoshii Y., Takahara F. 1988, ApJ 326, 1
Table 1. Values of elements in matrices
| Band | a | b | |
|---|---|---|---|
| 1.15 | 1.00 | 21 | |
| 1.12 | 1.08 | 33 |
Table 2. Photometric Results
| Image | Magnitude∗ | Color | |
|---|---|---|---|
| A1 | 16.13(16.44) | 15.21(15.48) | 0.92 |
| A2 | 16.70(17.01) | 15.64(15.91) | 1.06 |
| B | 18.10(18.41) | 17.03(17.30) | 1.07 |
| C | 17.66(17.98) | 16.58(16.85) | 1.08 |
| G | 17.74(18.75) | 15.98(16.88) | 1.76 |
| R1 | 21.740.28† | 19.230.06† | 2.51 |
| R2 | 21.310.18† | 19.380.06† | 1.93 |
Corrected total magnitude (see text). The magnitudes inside parentheses are measured in a diameter aperture.
Surface brightness (mag arcsec-2).