Predicting Potential Host Galaxies of Supermassive Black Hole Binaries
Based on Stellar Kinematics in Archival IFU Surveys
Abstract
Supermassive black hole binaries (SMBHBs) at the centers of galaxies emit continuous gravitational waves (GWs) at nanohertz frequencies, and ongoing pulsar timing array (PTA) experiments aim to detect the first individual system. Identifying the exact host galaxy of a SMBHB detected in GWs is paramount for a variety of multi-messenger science cases, but it will be challenging due to the large number of candidate galaxies in the sky localization region. Here, we apply recent insights on the distinct characteristics of SMBHB host galaxies to archival galaxy datasets, to predict which nearby massive galaxies are most likely to host SMBHBs detectable by PTAs. Specifically, we use archival galaxy IFU surveys to search for nearby galaxies with distinct stellar kinematic signatures of SMBHB host galaxies, as informed by cosmological simulations. These distinct stellar kinematic signatures, including slow rotation and strong kinematic/photometric misalignments, are a hallmark of recent major galaxy mergers that led to the formation of SMBHBs in these galaxies. We produce a list of nearby massive galaxies that may currently host SMBHBs, ranked by a combination of their host galaxy stellar kinematic properties and their hypothetical GW strain. We discuss how our ranked list can be used (1) for targeted searches for individual sources of continuous GWs by PTAs, (2) to corroborate candidate SMBHBs identified through other approaches, and (3) to select candidate recoiling AGN and closely-separated (100 pc) dual AGN for telescope follow-up confirmation.
1 Introduction
In hierarchical galaxy evolution, merging galaxies are predicted to form supermassive black hole binary (SMBHB) systems that emit nHz continuous gravitational waves (Begelman et al., 1980). As the two supermassive black holes (SMBHs) move through the merged galaxy, they experience dynamical friction, slowing them down through transfer of angular momentum and energy to surrounding stars and dark matter (Chandrasekhar, 1943). This enables them to sink towards the bottom of the gravitational potential well of the merged galaxy (Antonini & Merritt, 2012), where the two SMBHs will then form a bound binary at parsec separation, which hardens through further angular momentum loss from scattering of nearby stars and torques from the surrounding gas (Valtaoja et al., 1989; Quinlan, 1996; Armitage & Natarajan, 2002; Sesana et al., 2008; Kelley et al., 2017; De Rosa et al., 2019). At milliparsec separations, the binary system emits continuous gravitational waves (GWs) at nHz frequencies detectable by pulsar timing array (PTA) experiments, before the binary inspirals and coalesces into a single SMBH with a recoil kick (Volonteri et al., 2003; Burke-Spolaor et al., 2019).
In the coming years, PTA experiments are expected to reach the sensitivity required to detect continuous GWs from individual SMBHB systems at the centers of nearby galaxies. The recent preliminary detection of the stochastic GW background by multiple independent PTA experiments now hints at the existence of an abundant population of SMBHBs at the centers of galaxies in the local Universe (e.g., EPTA Collaboration et al., 2023; Agazie et al., 2023; Xu et al., 2023; Reardon et al., 2023). As further pulsar timing data accumulate, the detection limit of the GW strain from an individual SMBHB improves. Eventually, PTAs will be able to resolve the localization region of the first individual SMBHB whose GW strain contributes the most to the observed GW background (Sesana et al., 2009; Ravi et al., 2015; Mingarelli et al., 2017; Kelley et al., 2018).
Identifying the host galaxies of individual SMBHBs detected in GWs from PTAs will be paramount to addressing many key science questions. For example, combining GWs and electromagnetic information originating from the binary environment and its host galaxy will constrain binary orbit parameters, such as the total mass and separation of the binary system (Arzoumanian et al., 2014; Shannon et al., 2015; Lentati et al., 2015; Liu & Vigeland, 2021). These multi-messenger observations will also constrain the interactions that take place in the galaxy nucleus, such as core scouring through three-body interactions with nearby stars (Rajagopal & Romani, 1995; Jaffe & Backer, 2003; Wyithe & Loeb, 2003; Enoki et al., 2004; Sesana et al., 2004). Furthermore, they can constrain cosmological parameters by using SMBHBs as standard sirens (Schutz, 1986; Holz & Hughes, 2005). These science goals will only be realized if the exact host galaxy of the SMBHB detected in GWs can be identified (Bogdanović et al., 2022).
Identifying the host galaxies of individual SMBHBs detected in GWs by PTAs will be challenging. The expected GW sky localization region of the individual SMBHBs detected by PTAs is expected to be of order deg2 (Sesana & Vecchio, 2010; Goldstein et al., 2018; Truant et al., 2025). While the mass and distance of SMBHBs detected in continuous GWs are degenerate, they can be determined individually if the gravitational radiation produces a frequency drift (Sesana & Vecchio, 2010). These constraints can be used to make galaxy stellar mass and redshift cuts on the galaxies in the PTA localization region based on empirical galaxy scaling relations. However, the total number of candidate host galaxies even after these selection cuts is still expected to be of order (Goldstein et al., 2019; Petrov et al., 2024; Truant et al., 2025). Identifying the exact host galaxy among these candidates requires additional approaches.
Many approaches to identifying the host galaxies of SMBHBs are based on periodic variability in the light curves of active galactic nuclei (AGN), but there are currently no secure methods. The light curve variability of AGN can be modulated by a SMBHB, and thus act as an electromagnetic signature for the presence of a SMBHB (e.g., D’Orazio et al., 2015; Charisi et al., 2022; Bogdanović et al., 2022). However, such signatures would only be observable if the SMBHB is actively accreting and the nucleus is not dust-obscured, which may be a minority of cases (Koss et al., 2018; Izquierdo-Villalba et al., 2023; Dong-Páez et al., 2023; Truant et al., 2025). Thus, there is no guarantee that SMBHBs detected in GWs by PTAs will display those light curve variability signatures.
Other studies focused on host galaxies have characterized the population of PTA-detectable SMBHB host galaxies in cosmological simulations, but these results are influenced by galaxy scaling relations. By comparing the properties of the host galaxies of all SMBHBs in the Illustris cosmological simulations to the host galaxies of PTA-detectable SMBHBs, Cella et al. (2024) found that PTAs are sensitive to SMBHBs in galaxies that are more massive, redder in color, more metal-rich and less star forming. Saeedzadeh et al. (2024) used the Romulus25 cosmological simulations to compare the properties of SMBHB hosts to the overall population of galaxies in the simulation, and found similar results. However, PTAs are only sensitive to the most massive SMBHBs (; Sesana et al., 2009; Ellis et al., 2023). These naturally correspond to more massive, metal-rich, redder, and less star-forming galaxies, due to empirical galaxy scaling relations such as the stellar mass-black hole mass relation (; Häring & Rix, 2004; Torbaniuk et al., 2024), the stellar mass-metallicity relation (; Tremonti et al., 2004; Ma et al., 2016), the stellar mass-color relationship (color; Law-Smith & Eisenstein, 2017), and the stellar mass-specific star formation rate relation (sSFR; Brinchmann et al., 2004; Bauer et al., 2013). Thus, these properties may not be distinct to SMBHB host galaxies, but instead reflect the sensitivity of PTAs to nHz GWs, which arise from massive SMBHBs in massive galaxies. As a result, characterizing the distinct properties of galaxies that host PTA-detectable SMBHBs beyond their difference in mass relative to the broader galaxy population will require a comparison with a mass-matched control galaxy sample.
Recently, Bardati et al. (2024a, hereafter B24A) and Bardati et al. (2024b, hereafter B24B) used cosmological simulations of galaxy formation to find that galaxies hosting SMBH mergers and binaries have distinctive morphological and stellar kinematic properties, in comparison to a mass- and redshift-matched control galaxy sample. Their results suggest that the host galaxies of closely separated (100 pc) SMBH pairs, bound SMBHBs, and recent SMBH mergers tend to have bulge-dominated morphologies in imaging, and have slower rotation with stronger kinematic/photometric misaligned stellar kinematics in integral field spectroscopy. Critically, because their control sample is mass- and redshift-matched to their SMBH merger and binary sample, these characteristics are distinct to SMBHB host galaxies, and do not simply arise from galaxy scaling relations. As such, these results can be used to search for candidate galaxies hosting SMBHBs using archival galaxy datasets, even before PTA detections, effectively making a prediction of which nearby galaxies are likely to host future PTA sources of continuous GWs.
Other investigations have aimed to predict the host galaxies of individual SMBHBs that will be detected by PTAs among local galaxies by computing the GW strain of hypothetical SMBHBs. Simon et al. (2014) and Schutz & Ma (2016) computed the GW strain of hypothetical SMBHBs in local galaxies by using the distance and SMBH mass of each galaxy. However, those studies do not incorporate any information on the potential presence of a SMBHB in each galaxy, which is needed to make a more informed prediction.
Here, we predict potential host galaxies of the first SMBHBs that will be detected in GWs by PTAs, by searching archival galaxy datasets for the distinct signatures of SMBH merger and binary host galaxies identified by B24A and B24B. Since most local massive galaxies have already been observed by imaging and integral field spectroscopy surveys, their morphological and stellar kinematic parameters are already available in the literature. We use this information to predict which galaxies among them are the most likely to host SMBHB systems. We also calculate the GW strain of their hypothetical SMBHBs, to identify the potentially strongest individual sources of GWs. Finally, we present a ranked list of galaxies within our sample that both possess the signatures of SMBHB host galaxies and whose hypothetical SMBHBs have the strongest GW strain. These top-ranking galaxies are thus the most likely to be the host galaxy counterpart to individual sources of continuous GWs that will be detected by PTAs in the near future.
The structure of this paper is as follows. In Section 2, we determine which set of parameters, from the morphological and stellar kinematic measurements, best discriminates SMBH merger and binary host galaxies against a mass- and redshift-matched sample using the Romulus25 simulations. In Sections 3 and 4, we describe the archival galaxy datasets we use for our search for SMBHB host galaxies and show the results of our SMBHB host galaxy classification using stellar kinematic features. In Section 5, we compute the GW strain of the hypothetical SMBHB systems in our sample. In Section 6, we discuss how our results can be used to predict the host galaxy of the SMBHB that will be detected by PTAs, as well as other applications. We briefly conclude in Section 7.
2 Distinct Signatures of SMBH Merger and Binary Host Galaxies
2.1 Background
To identify the distinct morphological and stellar kinematic properties of SMBHB host galaxies in the Romulus25 cosmological simulations, B24A and B24B constructed a sample of SMBH merger and binary host galaxies, as well as a mass- and redshift-matched control sample. In Romulus25, SMBHs numerically merge in the simulation at a separation of 700 pc. However, at this stage, the two SMBHs have yet to form a bound binary. Further loss of angular momentum that hardens the binary separation down to milliparsec scales, and the eventual physical merger of the SMBHB, are below the resolution limit of the simulation. The time delay between numerical and physical merger is poorly-constrained, and estimates vary widely between 0.1 to 10 Gyr (e.g., Volonteri et al., 2020; Li et al., 2022). B24A identified 201 SMBH numerical merger events within the simulation, and tracked their host galaxies up to 1 Gyr after their numerical merger in order to construct a galaxy sample representative of SMBH merger and binary host galaxies. Due to their ignorance of the exact time of the physical SMBHB merger, this sample includes galaxies hosting SMBHBs at separations from 700 pc to galaxies hosting SMBHBs that have merged in the past 1 Gyr. They also built a control galaxy sample, by selecting galaxies in Romulus25 whose mass and redshift distributions matched those of the SMBH merger and binary host galaxy sample.
After measuring the morphological and stellar kinematic parameters of both their SMBH merger and binary sample as well as their control sample galaxies, B24A and B24B trained a linear discriminant analysis (LDA) predictor to identify the distinct signatures of SMBH merger and binary host galaxies. They first performed stellar population synthesis and radiative transfer simulations to produce synthetic images and stellar kinematic maps of their simulated galaxies, from which they extracted morphological and stellar kinematic parameters. They then trained an LDA predictor to identify the linear combination of parameters that optimally distinguishes the SMBH merger and binary host galaxy sample from the control sample. The resultant LDA predictor assigns a score to each galaxy based on their morphological or stellar kinematic parameters, where high (positive) LDA scoring galaxies are predicted to be more likely to host a SMBH merger or binary.
The findings of B24A and B24B suggest that SMBH merger and binary host galaxies have distinct morphological and stellar kinematic properties in comparison to a mass- and redshift-matched control sample. Specifically, B24A found that SMBH merger and binary host galaxies are characterized by a more prominent classical bulge in their morphology as probed by imaging, while B24B found that they are characterized by slower rotation and stronger kinematic/photometric misalignments through their stellar kinematics as probed by integral field unit (IFU) spectroscopy. These distinctions are strongest for SMBH merger and binary host galaxies with high chirp mass () and high mass ratio (). Those results are consistent with the standard picture of hierarchical galaxy formation, in which major mergers of massive galaxies produce SMBHBs, which result in galaxies with more bulge-dominant morphologies, slower rotation, and more complex stellar kinematics (e.g., Bois et al., 2011; Naab et al., 2014). B24A used morphological parameters to derive the LDA predictor:
| (1) |
where the Gini coefficient is a measure of how evenly the galaxy flux is distributed, the parameter describes the concentration of light in a galaxy, (concentration) measures the concentration of light in a galaxy relative to its center, and (smoothness) is a measure of the fraction of light found in clumpy distributions (Lotz et al., 2004; Pawlik et al., 2016). The LDA predictor from Equation 1 distinguishes the SMBH merger and binary host galaxies from the mass- and redshift-matched control group with a mean accuracy of . B24B then used stellar kinematic parameters to derive the LDA predictor:
| (2) |
where is the difference between the photometric position angle as measured in the galaxy image and the kinematic position angle as measured in the galaxy stellar kinematic map, and is the spin angular momentum of the galaxy measured at one effective radius (Emsellem et al., 2007). The LDA predictor from Equation 2 distinguishes the SMBH merger and binary host galaxies from the mass- and redshift-matched control group with a mean accuracy of . Because the LDA equation was constructed by first normalizing the parameters, the absolute value of the coefficients are indicative of each parameter’s importance towards the LDA classification. For example, the most important parameter in Equation 2 is the parameter.
2.2 Comparing Stellar Kinematic Signatures to Morphological Signatures
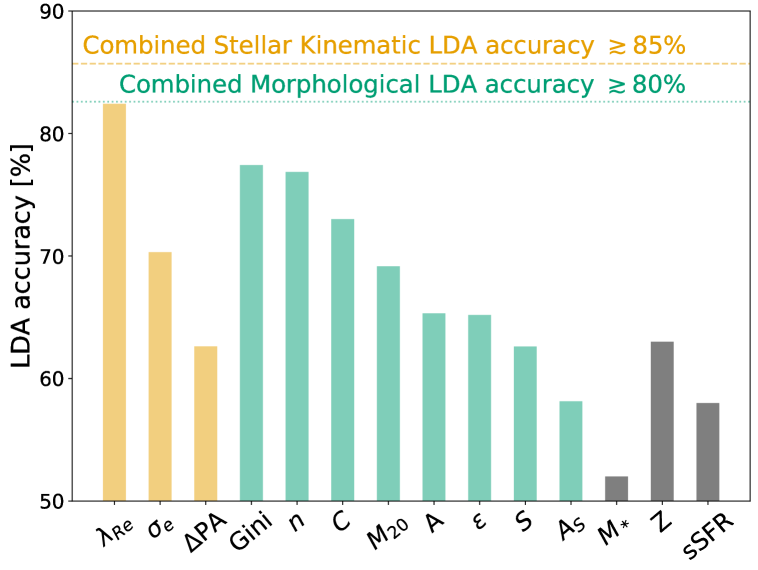
We identify the optimal combination of parameters to search for PTA-detectable SMBHB host galaxies, which will determine which archival datasets we need for our search. In Figure 1, we show the accuracy of the LDA predictor, which we train using one parameter at a time while ignoring the others. For the stellar kinematic parameters (yellow bars), the spin angular momentum () and the stellar velocity dispersion () measured at the effective radius () are the two parameters whose LDA equations are the most accurate at discriminating the SMBH merger and binary host galaxies from the control group. However, when training the LDA using both parameters, the accuracy remains the same as using alone, because the discriminatory information contained in is degenerate with that from . In contrast, even though PA individually has an accuracy of only 60%, it contains discriminatory information that is not degenerate with , which causes the accuracy of the LDA trained over both and PA to be higher than alone. This is why the optimal stellar kinematic equation of the LDA as derived by B24B (Equation 2) contains and PA, but not .
Among all morphological (green bars) and stellar kinematic (yellow bars) parameters shown in Figure 1 and present in Equations 1 and 2, we find that the set of stellar kinematic parameters is the optimal discriminant, motivating the use of archival galaxy IFU surveys. While B24A and B24B separately identified each set of parameters that best classified SMBH merger and binary host galaxies, it is possible that combining both sets of parameters increases the accuracy of the LDA equation. To test this, we train the LDA over the ensemble of both the morphological and stellar kinematic parameters. We use the same approach as B24A and B24B by performing forward stepwise selection to optimally reduce the number of parameters in the LDA equation, through which parameters are added one by one to the LDA. At each step, the corresponding LDA equation is computed to determine whether adding the parameter increases the LDA accuracy or not. This process is repeated until the LDA accuracy decreases. We find that all the morphological parameters as analyzed by B24A are degenerate with either or PA, such that the optimal LDA equation that maximizes the classification accuracy and minimizes the number of parameters is the set of stellar kinematic parameters as derived by B24B, and described in Equation 2. As such, we will mine through archival galaxy IFU surveys to conduct our search of PTA-detectable SMBHB host galaxies.
3 Archival Galaxy IFU Datasets
3.1 Sample Selection
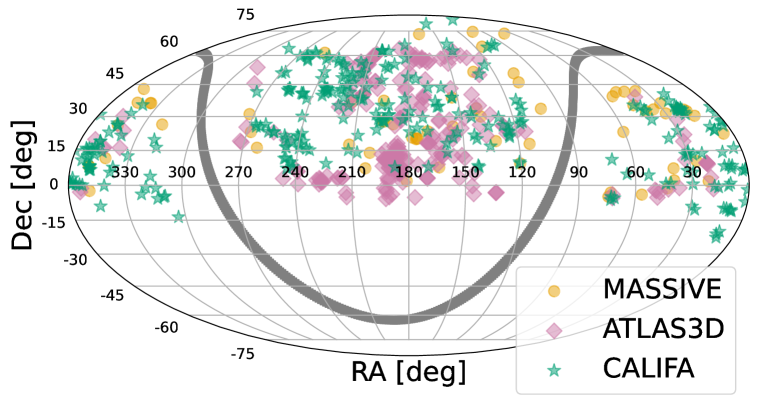
We conduct our search for SMBHB host galaxies using archival IFU data from the MASSIVE (Ma et al., 2014), ATLAS3D (Cappellari et al., 2011), and CALIFA (Sánchez et al., 2012) galaxy surveys. Since PTAs are sensitive to GWs originating from nearly the full sky, we specifically choose these three IFU surveys because they cover a wide sky footprint. Furthermore, these three surveys are also approximately volume-limited, which mitigates the Malmquist bias that would preferentially select increasingly massive galaxies with increasing distance (Malmquist, 1922; Sandage, 2000). By doing so, we explore all the galaxies in the northern sky within a distance Mpc and with a stellar mass for MASSIVE (Ma et al., 2014), and Mpc, for ATLAS3D (Cappellari et al., 2011). Although the CALIFA survey is not strictly volume-limited, it has been shown to be complete for galaxies with stellar mass and distance (Sánchez et al., 2012; Walcher et al., 2014), so we limit our study to this range. In total, the main MASSIVE, CALIFA, and ATLAS3D surveys contain 116, 667, and 260 galaxies, respectively. A few galaxies overlap between multiple surveys, and we address how we take this into account in our analysis in Section 6.5. We also note that the redshift ranges of these IFU surveys are different than the redshift range of simulated galaxies used to derive the stellar kinematic signatures of SMBH merger and binary host galaxies, and we discuss why this does not impact our results in Section 6.6. With this selection of galaxies, we cover most of the local massive galaxies in the northern sky that are not in the Galactic plane (see Figure 2).
3.2 Stellar Mass, Metallicity, and Star-Formation Rate as SMBHB Host Galaxy Discriminants
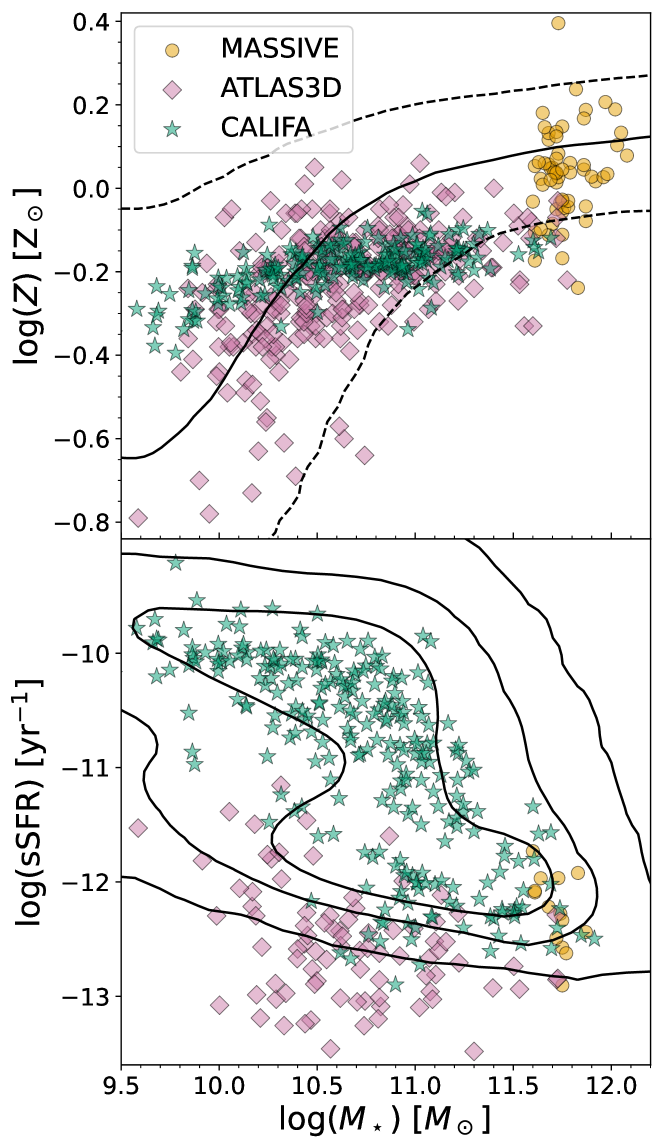
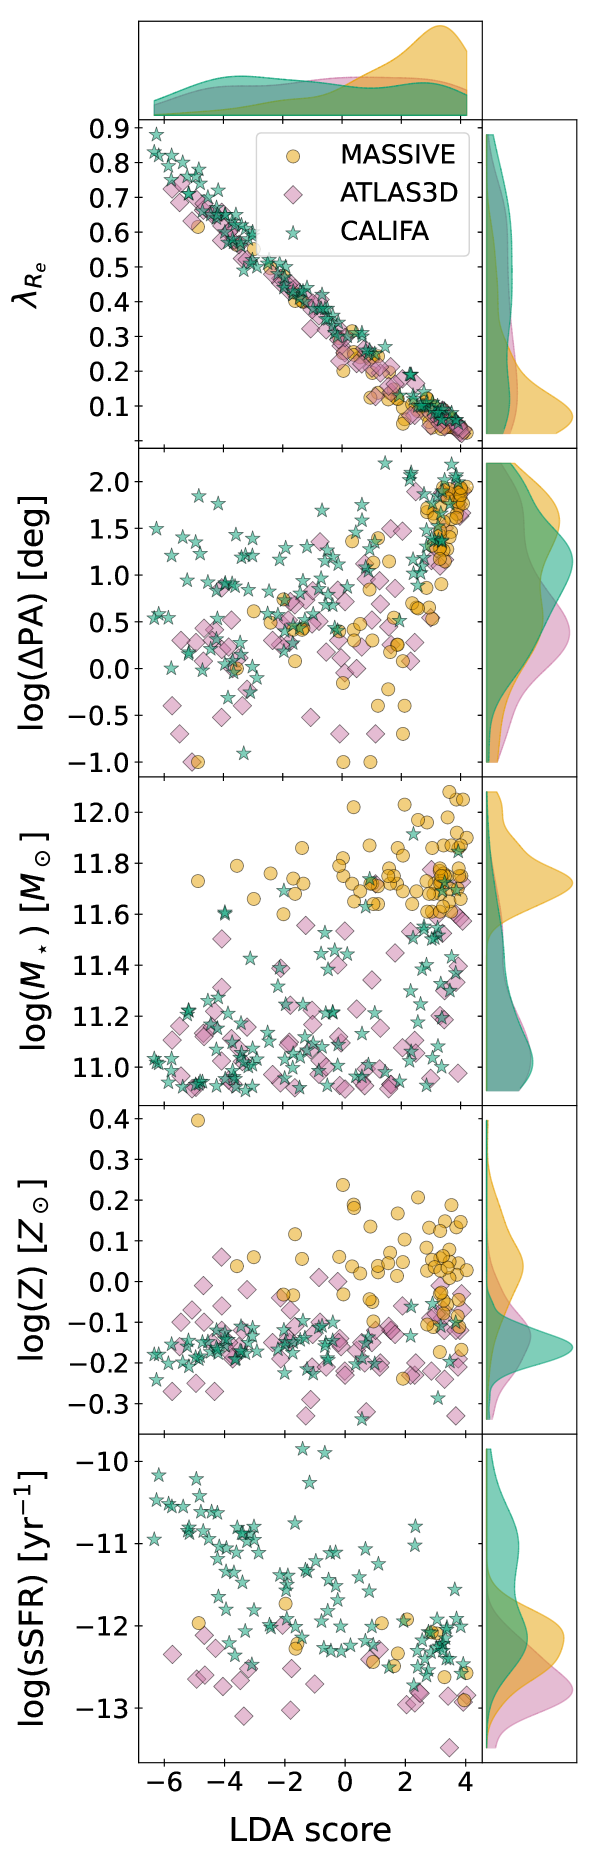
We first demonstrate that the most massive galaxies within our sample naturally correspond to the most metal-rich and least star-forming, as expected from galaxy scaling relations. As such, identifying the distinct signatures of the host galaxies of SMBHBs detectable by PTAs requires a comparison to a mass-matched control sample of galaxies. Previous studies have asserted from cosmological simulations that PTA-detectable SMBHBs live in galaxies that are more massive, redder in color, more metal rich and less star forming than the overall population of galaxies or the overall population of SMBHB host galaxies (Cella et al., 2024; Saeedzadeh et al., 2024). However, because PTAs are more sensitive to the most massive SMBHBs, we expect their host galaxies to be more massive, which should naturally correlate with higher metallicity and lower star formation rate through galaxy scaling relations. In Figure 3, we show the and sSFR relations for MASSIVE (Davis et al., 2016; Greene et al., 2019), ATLAS3D (Davis et al., 2014; McDermid et al., 2015), and CALIFA galaxies (Sánchez et al., 2017; Catalán-Torrecilla et al., 2015) for which metallicity and star formation rates have been derived (for a total of 14, 88 and 291 galaxies from MASSIVE, ATLAS3D and CALIFA, respectively). We note that the wide range of star formation among the CALIFA galaxies is due to the CALIFA survey probing a different volume in mass and distance than MASSIVE and ATLAS3D, thus resulting in galaxies of different morphologies, while ATLAS3D and MASSIVE mostly contain E and S0 galaxies, which are usually less star-forming (González Delgado et al., 2015). As expected from global mass-scaling relations (; Tremonti et al. 2004; Ma et al. 2016, and sSFR; Brinchmann et al. 2004; Bauer et al. 2013), Figure 3 reveals a correlation between galaxy stellar mass and metallicity, and an anti-correlation between galaxy stellar mass and specific star formation rate. These correlations are consistent with the paradigm that more massive galaxies tend to have older stellar populations, which through time have enriched the interstellar medium with metals, resulting in higher stellar metallicity, and have exhausted the available gas required to form stars, resulting in lower specific star formation rate (e.g., Kennicutt, 1998; Madau & Dickinson, 2014). Since PTA-detectable SMBHBs are the most massive SMBHBs (with ; Sesana et al., 2009; Ellis et al., 2023), they reside in galaxies with high stellar mass. These galaxies are thus naturally more metal-rich and less star-forming compared to the overall population of SMBHB host galaxies or to the overall population of galaxies. These correlations reflect galaxy scaling relations, rather than truly distinctive properties of SMBHB host galaxies.
Using the Romulus25 simulations, we find that the stellar metallicity and sSFR are not reliable discriminants to identify SMBH merger and binary host galaxies from a mass- and redshift-matched control sample. To assess if and sSFR can be used as discriminants of SMBHB host galaxies, we train the LDA equation using and sSFR to distinguish the SMBH merger and binary host galaxy sample from the mass- and redshift-matched control galaxy sample in Romulus25. First, we extract the stellar metallicity and star-formation rate values for each galaxy in our samples from the Romulus25 simulation stellar particle data. We then train the LDA using the metallicity and sSFR parameters individually. We find that the resulting accuracy of the LDA classification is low (), as shown in Figure 1. We also find that combining both and sSFR into the LDA equation does not increase its accuracy. This confirms that PTA-detectable SMBHB host galaxies do not have distinctively-high metallicities and low star formation rates. Rather, they are simply more massive than the overall population of galaxies and SMBHB host galaxies. In contrast, our stellar kinematic LDA predictor in Equation 2 is not affected by galaxy scaling relations, and reflects truly distinctive properties of SMBHB host galaxies. Hence, we compute the LDA score using Equation 2 for galaxies in our archival IFU surveys to identify galaxies most likely to host a SMBHB.
4 Identifying SMBHB Host Galaxy Candidates in Archival IFU Surveys
4.1 Retrieval of Stellar Kinematic Parameters
To identify SMBHB host galaxy candidates from their distinct stellar kinematic properties using Equation 2, we first retrieve the stellar kinematic parameters of galaxies from archival datasets. Specifically, we retrieve the and PA parameters from ATLAS3D (Emsellem et al., 2011; Krajnović et al., 2011) and MASSIVE (Veale et al., 2017; Ene et al., 2018), and from CALIFA (Falcón-Barroso et al., 2019). A few MASSIVE galaxies have no reported value for PA due to not having identifiable kinematic axes (Ene et al., 2018). Furthermore, only a subset of the full CALIFA sample (galaxies with good quality data and non-disturbed morphologies) have reported values for (Falcón-Barroso et al., 2017). With these cuts, the stellar kinematic parameters are available for 71, 260 and 291 galaxies from MASSIVE, CALIFA and ATLAS3D, respectively.
Although the CALIFA survey does not provide the PA parameter for its galaxies, we measure PA by computing the morphological position angle PAmorph and the kinematic position angle PAkin from the flux and line-of-sight velocity dispersion (LOSVD) maps, respectively, as produced by the CALIFA collaboration (Falcón-Barroso et al., 2017). We retrieve the V1200 (medium resolution) stellar kinematic maps111https://califa.caha.es/FTP-PUB/dataproducts/Stellar_Kinematics_V1200/, and run StatMorph (Rodriguez-Gomez et al., 2019) over the flux and noise maps to compute the morphological position angle . We also compute the kinematic position angle by following the technique by Nevin et al. (2019), and use the bounded Absolute Radon Transform by Stark et al. (2018) on the line-of-sight velocity dispersion (LOSVD) maps. This enables us to compute the PA parameter for all 291 CALIFA galaxies in our sample.
4.2 Selection of Massive Galaxies
To identify the galaxies in our archival galaxy datasets that are the most likely to host a SMBHB detectable by PTAs, we first select the galaxies whose SMBH mass are the highest. PTA experiments are only sensitive to the most massive SMBHB systems, so we select galaxies harboring the most massive SMBHs in the MASSIVE, ATLAS3D and CALIFA IFU surveys. We estimate the of each galaxy using the empirical relation for early-type galaxies from Sahu et al. (2019), and we justify this choice in Section 6.3.1. The resulting SMBH mass distribution of our sample of galaxies is shown in Figure 4.
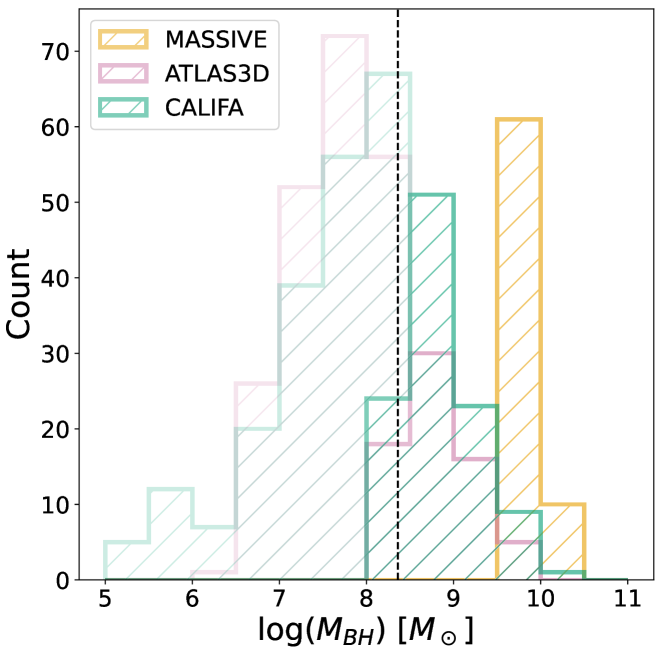
We use a fiducial minimum as the threshold to select the most massive galaxies in our sample. This threshold matches the sensitivity from PTA experiments, and corresponds to a chirp mass for a binary with a mass ratio , where . Previously, B24B showed that the LDA predictor from Equation 2 has an accuracy of 85% in discriminating simulated SMBH merger and binary host galaxies from a mass- and redshift-matched control galaxy sample for SMBHs with a chirp mass . Notably, they found that this accuracy does not decrease significantly when the minimum chirp mass threshold is lowered from to . Thus, we still expect the LDA predictor to reach 85% accuracy with our adopted minimum SMBH mass threshold of , which corresponds to a minimum chirp mass threshold of . Our selection of the most massive galaxies yields 71, 69 and 106 galaxies in MASSIVE, ATLAS3D and CALIFA, respectively.
4.3 LDA Score and Correlations
with , PA, , , and sSFR
After retrieving the and PA parameters and selecting the most massive galaxies, we compute the LDA score for each galaxy. We normalize each parameter by subtracting the mean and dividing by the standard deviation of each parameter’s distribution, following the method of B24A and B24B, to prevent any one particular parameter from dominating the LDA equation. We then input the normalized parameters in Equation 2 to determine the LDA score of each galaxy.
As expected, we find that the LDA score is strongly correlated with , and has a weaker correlation with PA. In the first and second panels from the top of Figure 5, we show the correlation between the LDA score and the and PA parameters for our sample of massive ( galaxies. From the LDA predictor (Equation 2), the absolute values of the coefficients of each parameter are indicative of their relative importance. Thus, it makes sense that the strongest correlation occurs with the parameter in Figure 5, as its coefficient has an absolute value of 2.81, compared to 0.51 for PA. The sign of the coefficients indicates either an anti-correlation (coefficient 0) or positive correlation (coefficient 0). This is why (with a coefficient of ) has a strong anti-correlation with the LDA score, while PA (with a coefficient of ) has a weaker positive correlation with the LDA score. To verify this, we compute Pearson’s (see, e.g., Bravais, 1844; Stigler, 1989) for the LDA and LDAPA distributions, and find values of 1 and 0.6, respectively, which is consistent with our expectations.
We also find that the LDA predictor does not simply select the most massive galaxies, further confirming that the LDA predictor is identifying the true distinctive stellar kinematic signatures of SMBH merger and binary host galaxies. In the third, fourth, and fifth panels from the top of Figure 5, we show the correlations between the LDA score from Equation 2 and galaxy stellar mass, metallicity, and sSFR, respectively. In contrast to and PA, these parameters have little to no correlation with the LDA score. We compute Pearson’s for each of their correlation with the LDA, and find values of 0.5, 0.3 and 0.3 for , and sSFR, respectively. As such, our results show that the LDA predictor is not simply selecting the most massive, metal-rich and least star-forming galaxies, and instead is likely identifying the true distinctive signature of SMBH merger and binary host galaxies.
5 Calculating the GW strain of Hypothetical SMBH Binaries
We calculate the GW strain of the hypothetical SMBHB systems in our galaxies. We use the GW strain equation for an equal-mass binary from Schutz & Ma (2016)
| (3) |
where is the GW strain of the hypothetical SMBHB, is the total mass of the two black holes (), is the luminosity distance to the host galaxy, and is the frequency at which the GWs are assumed to be emitted. Since we have no information about the mass ratio of the potential binary systems, we assume equal-mass SMBHBs (i.e., fiducial mass ratio ). Since we also do not know the separation between the two black holes, we further assume that the GWs are emitted at a frequency near the highest sensitivity of PTA experiments, around 10 nHz (Arzoumanian et al., 2020); this corresponds to a separation of 5 milliparsecs between two black holes of mass (Schutz & Ma, 2016). We discuss the caveats of this hypothetical in Section 6.3.
We combine the GW strain and the LDA score into a total score for each galaxy, based on (1) how likely the galaxy is to host a hypothetical SMBHB, and (2) the amplitude of the GW strain computed with Equation 3. We normalize both the LDA score and the GW strain between 0 and 1, and add them in quadrature to compute a total score. We assign equal weights to each score to remain agnostic about the relative importance between these two metrics towards the likelihood of a PTA detection. We normalize the total score between 0 and 1, such that:
| (4) |
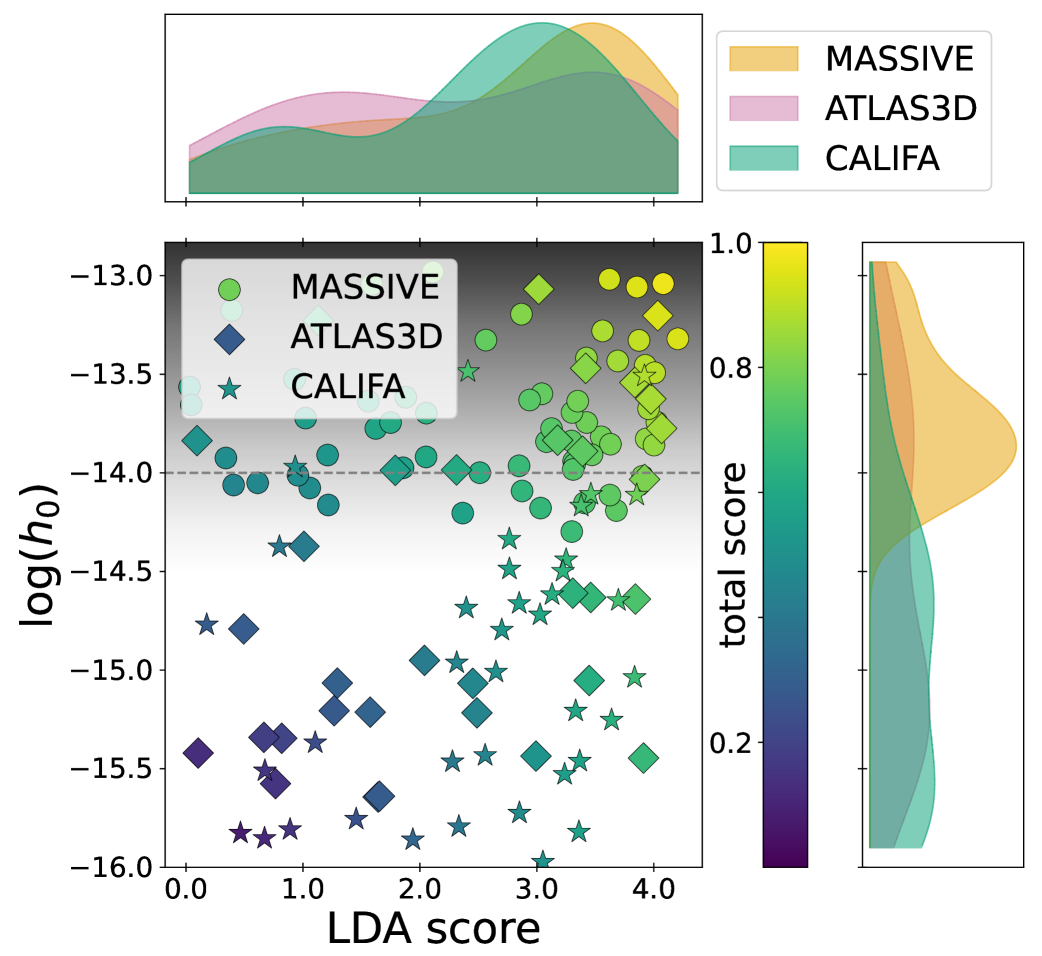
where is the normalized LDA score and is the normalized log GW strain score. We compute this total score for each of the massive galaxies in our sample with positive LDA scores. The resulting top ten ranked galaxies are listed in Table 1, while all ranked galaxies are listed in Table LABEL:tab:top_rank_full in the Appendix. In Figure 6, we present our sample of galaxies with a positive LDA score in the LDA plane, where the color of each galaxy reflects its total score from Equation 4. Galaxies with a high LDA score are predicted to be more likely to host a SMBHB, and galaxies whose SMBHBs have a high GW strain are more likely to be detected by PTAs. We discuss some caveats on the interpretation of Figure 6 in Section 6.3.
| Name | Total Score | Survey | LDA | Total | Light | |||||
|---|---|---|---|---|---|---|---|---|---|---|
| Rank | [Mpc] | Score | Score | Score | Profile | |||||
| NGC4073 | 1 | 91.50 | MASSIVE | 10.25 | -13.04 | 4.08 | 0.98 | 0.99 | 0.99 | C |
| NGC1016 | 2 | 95.20 | MASSIVE | 10.25 | -13.06 | 3.86 | 0.98 | 0.97 | 0.97 | C |
| NGC2832 | 3 | 105.20 | MASSIVE | 10.30 | -13.02 | 3.62 | 0.99 | 0.94 | 0.97 | C |
| NGC4486 | 4 | 17.20 | ATLAS3D | 9.72 | -13.20 | 4.03 | 0.93 | 0.98 | 0.96 | C |
| NGC1060 | 5 | 67.40 | MASSIVE | 10.00 | -13.32 | 4.21 | 0.90 | 1.00 | 0.95 | – |
| NGC0533 | 6 | 77.90 | MASSIVE | 10.03 | -13.33 | 3.87 | 0.90 | 0.97 | 0.93 | – |
| NGC4472 | 7 | 17.10 | ATLAS3D | 9.80 | -13.07 | 3.02 | 0.97 | 0.89 | 0.93 | C |
| NGC4874 | 8 | 102.00 | MASSIVE | 10.13 | -13.28 | 3.56 | 0.91 | 0.94 | 0.92 | C |
| NGC0410 | 9 | 71.30 | MASSIVE | 9.94 | -13.45 | 3.93 | 0.86 | 0.97 | 0.92 | – |
| NGC7265 | 10 | 82.80 | MASSIVE | 9.95 | -13.49 | 4.01 | 0.85 | 0.98 | 0.92 | – |
6 Discussion
6.1 Interpretations of the Ranked List of Galaxies
In our ranked list of galaxies, high-LDA scoring galaxies are the most likely to host SMBHBs, although it is possible that the two SMBHs have either already merged or have yet to form a gravitationally-bound system. As discussed in Section 2, galaxies with a high LDA score possess the stellar kinematic signatures of SMBH merger and binary host galaxies, as informed from the Romulus25 cosmological simulations. However, the stellar kinematic signatures identified in Romulus25 (slow rotation and misaligned kinematic/photometric axes) are for SMBHB that have a broad range of separations, from 700 pc (i.e., SMBH pairs) to 0 pc (i.e., recently merged). For observed galaxies in the IFU surveys, the separation of their hypothetical two SMBHs is unknown. Thus, we caution that it is likely that the high-LDA scoring galaxies in our list are contaminated by galaxies harboring SMBHB that have merged in the past Gyr, or have current separations of 100 pc and thus have not yet hardened into a binary system. However, this issue of contamination should not hamper the use of our ranked list of galaxies for targeted continuous GW sources for PTA experiments. Furthermore, the presence of these contaminants in our ranked list enables other science goals, such as searches for close dual AGNs and recoiling AGNs. We discuss these different use cases for our ranked list in Section 6.2 below.
We suggest that the host galaxies of gravitationally-unbound SMBH pairs could be distinguished from nHz GW-emitting SMBHB host galaxies based on their inner galaxy surface brightness profile. If the two SMBHs have hardened to a binary system by scouring the galaxy nucleus through three-body interactions with nearby stars, this would result in an observable surface brightness core in the inner light profile of the galaxy (e.g., Begelman et al., 1980; Hills, 1983; Quinlan, 1996). However, other mechanisms such as gravitational wave-induced recoil and tidal deposition have also been proposed to explain the origin of observed surface brightness cores (Nasim et al., 2021; Khonji et al., 2024; Rawlings et al., 2025), and so this interpretation warrants caution. Nevertheless, we provide the inner surface brightness profile classification of the massive galaxies in our search as found in the literature (Lauer et al., 1995; Faber et al., 1997; Ravindranath et al., 2001; Rest et al., 2001; Laine et al., 2003; Lauer et al., 2005, 2007a; Krajnović et al., 2013) in Table 1 and Table LABEL:tab:top_rank_full, if one desires to interpret it as a discriminant between potential SMBH pair and SMBHB host galaxies.
6.2 Use Cases of the Ranked List of Galaxies
The most basic use of our ranked list of galaxies in Tables 1 and LABEL:tab:top_rank_full is to identify the most likely host galaxy counterpart to an individual PTA source. Once PTA experiments identify an individual source of continuous GWs, nearby massive galaxies in its sky localization region that are also highest-ranked in our list are the most likely counterparts. However, even before such a PTA detection, our ranked list of galaxies can be used for several science cases, as discussed below.
6.2.1 Targeted Searches for Individual Continuous GW Sources by PTAs
The highest-ranked galaxies in our ranked list can already be used in targeted searches for individual continuous GW sources in PTA data. PTA searches for continuous GWs from an individual SMBHB typically fit pulsar timing residual data to models with many parameters, such as the sky position, the GW frequency , the orbital phase, the GW polarization angle, the orbital inclination, and others, depending on the chosen model (e.g., Arzoumanian et al., 2020; Liu & Vigeland, 2021). These searches are computationally expensive, but can be sped up by fixing one or more of these parameters. For example, targeted searches fix the location in the sky of the GW source to observed galaxies, which improves the detection sensitivity (e.g., Liu et al., 2023; Charisi et al., 2024). Our high-ranking galaxies are among the best PTA-detectable SMBHB host galaxy candidates in the northern sky, and thus targeted PTA searches can focus on them for faster and more sensitive searches.
6.2.2 Independent Corroboration of Candidate SMBHBs Discovered Through Other Means
Our ranked list of galaxies can be used to independently corroborate candidate SMBHBs discovered through other means (e.g., light curve periodicities), based on the host galaxy stellar kinematic properties. Our full galaxy list in Table LABEL:tab:top_rank_full provides the stellar kinematic properties of the overall population of massive nearby galaxies, spanning those likely to host SMBHBs (high LDA score) to those unlikely (low LDA score). For a candidate SMBHB discovered through other means, a comparison of its host galaxy stellar kinematics to our full galaxy list can provide independent evidence to either reinforce or weaken the hypothesis that its central SMBH is indeed a SMBHB. Specifically, the stellar kinematic parameters and PA of the candidate SMBHB’s host galaxy can be measured from IFU spectroscopy, and used to compute a LDA score using Equation 2. The resultant LDA score can then be compared to our full galaxy list in Table LABEL:tab:top_rank_full; if the SMBHB candidate has a high LDA score compared to the galaxies in our full list, this corroborates the hypothesis that the galaxy hosts a SMBHB, and vice versa. We emphasize that since this comparison does not involve the GW strain , it is the LDA score (Equation 2) in Table LABEL:tab:top_rank_full that should be considered, rather than the total score (Equation 4). We also note that the LDA score in Equation 2 requires normalized values of and PA for the candidate SMBHB’s host galaxy. To perform this normalization, one should subtract the mean value of the parameter from our distribution and divide by its standard deviation (the mean and standard deviation of and PA from our full list in Table LABEL:tab:top_rank_full are and , respectively). The resulting normalized values of and PA for the candidate SMBHB’s host galaxy can then be directly inserted into Equation 2.
6.2.3 Identifying Candidate Dual AGNs and Recoiling AGNs for Follow-Up Observations
Our list of galaxies can also be used to select candidate closely separated (100 pc) dual AGN, which can be confirmed with follow-up observations. As discussed in Section 6.1, some of our top-ranked galaxies may instead host close (100 pc) SMBH pairs, since their host galaxy stellar kinematics are similar to SMBHBs and thus contaminate our ranked list. If both SMBHs in the pair are accreting, then they could be observable as a close dual AGN. Follow-up telescope imaging of these candidates with high spatial resolution in the infrared, X-ray, or radio could spatially resolve the two AGNs for confirmation. Furthermore, if the two SMBHs have not yet formed a bound parsec-scale binary (and are thus potentially resolvable in follow-up observations), the inner surface brightness profiles of the host galaxy would not have been modified by scouring yet. In this scenario, the host galaxies would thus display a power-law inner surface brightness profile (rather than a core), which can be used as an additional selection cut to maximize the efficiency of target selection for follow-up observations. Within our sample, six galaxies (NGC 6703, NGC 3414, NGC 474, NGC 4494, NGC 3226 and NGC 4596) have a positive LDA score and a power-law inner surface brightness profile.
In addition to dual AGN, we suggest that our ranked list of galaxies can be used to select candidate recoiling AGN that can be verified with follow-up observations. As discussed in Section 6.1, our top-ranked galaxies are also likely to host SMBHBs that have merged in the past Gyr. For a merging SMBHB, anisotropic emission of GWs produce a recoil kick on the merged SMBH (e.g., Campanelli et al., 2007; Schnittman & Buonanno, 2007; Blecha et al., 2011), with velocities ranging from 500 km/s to 4000 km/s depending on the binary parameters (Bogdanović et al., 2007; Campanelli et al., 2007). If the kicked SMBH is accreting, it could be observed as an AGN with spatial or kinematic offsets from the host galaxy. Such methods have already been employed towards detecting AGN recoil candidates, for example using HST images (e.g., Lena et al., 2014). In contrast with the dual AGN discussed above, the inner light profile of the host galaxy of a recently-merged SMBHB would be scoured and display a core. Follow-up observations of our top-ranked galaxies, especially those with cores, could reveal these spatial or kinematic offsets (Blecha et al., 2011; Kim et al., 2016).
6.3 Uncertainties in Calculating the GW Strain
6.3.1 Black Hole Mass
Our calculation of the SMBH mass carries a statistical error stemming from our use of an empirical scaling relation, which causes the GW strain as shown in Figure 6 to be approximate. Specifically, the empirical relation we use from Sahu et al. (2019) has a scatter of 0.5 dex. Since , this would lead to a scatter of a factor of 7 in , which corresponds to an uncertainty of 0.8 dex on the y-axis of Figure 6. Among our top ranking galaxies in Table 1, two (NGC 4486 (M87) and NGC 4374 (M84)) have dynamically-or directly-measured SMBH masses in the literature. The SMBH mass of M87 has been directly measured from the black hole’s shadow by Event Horizon Telescope Collaboration et al. (2019) to be , within 1 of our value found with stellar mass. The SMBH mass of M84 has been measured through gas kinematics by Bower et al. (1998) to be , also within 1 of our stellar mass value. SMBH masses of other galaxies such as NGC 2832 and NGC 4874 have also been published, although they were found through the empirical relation (Schutz & Ma, 2016; Dullo, 2019). Their values are below our adopted estimates using a relation (a difference of up to 1.5 dex), which is consistent with recent studies suggesting that the relation systematically underestimates for the most massive galaxies, and is therefore a less robust method to determine of local massive galaxies (e.g., Lauer et al., 2007b; Dullo et al., 2021; Liepold & Ma, 2024). This further justifies our choice of the relation to compute .
6.3.2 Black Hole Mass Ratio
Our assumption of an equal mass ratio in the calculation of the chirp mass also leads to a systematic error in the gravitational wave strain . Although the mass ratio of hypothetical SMBHBs in our galaxies is unknown, our choice of may be justified because accretion onto the binary would drive it towards equal mass (Young & Clarke, 2015). However, hypothetical SMBHBs in our galaxy dataset might have a mass ratio . Since , if we assume a SMBHB to have a mass ratio of while its actual mass ratio is, e.g., , we would overestimate its GW strain by a factor of 3, which corresponds to a 0.5 dex difference on the y-axis of Figure 6 (but still smaller than the uncertainty caused by the black hole mass). Therefore, the GW strain of galaxies shown in Figure 6 is an upper limit.
6.3.3 Binary Separation
Ultimately, our lack of constraints on the hypothetical SMBHB orbital separation is our most significant obstacle towards identifying potential PTA-detectable SMBHB candidate host galaxies. In Figure 6, we assume a GW emission frequency of 10 nHz to compute the GW strain , which corresponds to a binary separation of 5 milliparsecs for a system of mass (Schutz & Ma, 2016). As discussed in Section 6.1, the exact separations can be anywhere between 100 pc to 0 pc (already merged). PTA-detectable SMBHBs need separations of milliparsec to emit nHz GWs, which we cannot constrain (although they would rank highly in our list if there are any in our archival galaxy datasets). Thus, the galaxies shown in Figure 6 that are above the current NANOGrav sensitivity limit are not necessarily predicted to host SMBHBs currently detectable by PTAs, but may instead host SMBHB systems that have either already merged in the past Gyr, or that are currently at larger separations and have not yet hardened into a bound nHz-emitting SMBHB.
6.4 Cross-Referencing with Multi-AGN Catalogs
Through cross-referencing with multi-AGN catalogs, we find five candidate recoiling AGN host galaxies in our galaxy dataset, all of which have a positive LDA score, which is consistent with our interpretation. We use the Pfeifle et al. (2024) Big Multi-AGN Catalog, which is a census of all known and candidate multiple-AGN systems in the literature, and identify the galaxies in our sample that are present in that catalog. Notably, we find that five of our ATLAS3D galaxies host candidate recoiling AGN (NGC 4486 (M87), NGC 4168, NGC 4278, NGC 4636 and NGC 5846, as identified by Lena et al., 2014). These five galaxies all have 10 pc spatial offsets between the AGN and the galaxy center, which suggests recent (0.1 Myr) SMBH mergers assuming typical recoil velocities of 100–1000 km s-1 (Campanelli et al., 2007). We also find one galaxy (NGC 6338) from the CALIFA sample in the Pfeifle et al. (2024) catalog as identified by Comerford & Greene (2014) that hosts a candidate dual AGN, with a projected separation of 1.6 kpc. All six of these galaxies have positive LDA scores, which is consistent with our expectation that the LDA score not only identifies SMBHB host galaxies, but also the host galaxies of SMBH pairs and recent SMBHB mergers.
Other observational evidence also suggests that many of the highest-ranked galaxies in our sample either have undergone a recent galaxy merger, host a SMBHB, or host a recent SMBH merger. In particular, our #1 scoring galaxy, NGC 4073, has been observed by Lauer et al. (2005) to display a local minimum in its surface brightness profile near its center. Surface brightness central minima have been hypothesized to result from the hardening and recent merger of a SMBHB (Holley-Bockelmann & Richstone, 2000; Lauer et al., 2002), which is consistent with expectations from our LDA score. Our #6 scoring galaxy, NGC 533, lies in a galaxy group that is suspected to have recently undergone a merger based on X-ray observations of its intragroup medium gas (Finoguenov et al., 2007; Gu et al., 2012). We also note that the majority (6/10) of our highest-ranked galaxies reside in either galaxy groups or low-mass clusters rather than massive galaxy clusters, based on cross-referencing with galaxy catalogs (Mahtessian, 1998). This is consistent with the scenario in which galaxy groups are more conducive to major mergers of massive galaxies that lead to the formation of SMBHBs, due to the lower velocity dispersions of galaxies in the group (Binney & Tremaine, 2008).
6.5 Discrepancies Among Overlapping Galaxies Between Different Surveys
Among the 71, 69, and 106 galaxies from the MASSIVE, ATLAS3D, and CALIFA surveys that we use to search for PTA-detectable SMBHBs, there are 18 galaxies that overlap between two different galaxy surveys, and none that are in all three. In particular, NGC 5353, NGC 4472, NGC 5557, and NGC 5322 are present in both MASSIVE and ATLAS3D, NGC 2592, NGC 5631, NGC 2880, NGC 5485, and NGC 6278 are present in both ATLAS3D and CALIFA, while NGC 7619, NGC 4816, NGC 1167, NGC 3615, NGC 3158, NGC 2513, NGC 0499, NGC 1060, and NGC 4874 are present in both MASSIVE and CALIFA. As such, many of these galaxies have different reported distances and stellar kinematic parameters, depending on the survey.
For overlapping galaxies, we find that the stellar kinematic parameters are similar between the different surveys within the uncertainties, whereas some galaxy distances have been measured differently and disagree. For the galaxy distances, we use those that have been corrected with the surface brightness fluctuation method or corrected for local peculiar velocity, whenever available. For example, NGC 1060 as observed by MASSIVE is ranked #5 in our list, but #11 as observed by CALIFA. Upon closer inspection, this difference arises not from a different LDA score (both are similar), but rather from a difference in GW strain due to MASSIVE reporting a distance of 67.4 Mpc and CALIFA reporting a distance of 73.9 Mpc. Since the MASSIVE galaxy distance is smaller, its is higher and its rank is higher. In this case, the distance of NGC 1060 from MASSIVE has been corrected for its local peculiar velocity, and thus we use the distance reported in MASSIVE.
6.6 Redshift Difference Between
the Simulated and Observational Galaxy Datasets
Although the redshift range of the IFU surveys we use is lower than the redshift range of the Romulus25 simulated galaxies, this does not significantly affect our results, because the distinct stellar kinematic signatures of simulated SMBH merger and binary host galaxies do not display redshift evolution. The simulated galaxies in Romulus25 used by B24B to derive the LDA predictor have redshifts of (mean of ). As such, it is possible that the stellar kinematic signatures of SMBH merger and binary host galaxies identified by B24B are different for lower redshift galaxies, such as those at in the IFU surveys we use. Although the Romulus25 simulation does not contain enough SMBH merger and binary host galaxies to directly assess if the LDA predictor in Equation 2 applies at , we test whether this LDA predictor evolves over redshift. Specifically, we retrain the LDA predictor only for a subset of simulated galaxies around redshift , and find that the resulting LDA equation is similar to Equation 2 in terms of parameters and parameter coefficients. This explicitly demonstrates that the distinct stellar kinematic properties of simulated SMBH merger and binary host galaxies do not evolve with redshift, and should apply even to galaxies at lower redshifts.
Despite the different redshift ranges of the simulated and observed galaxies, the synthetic IFU data used by B24B to compute the LDA predictor probe similar physical scales in the galaxies compared to the observational IFU datasets, which enables us to directly use the LDA predictor on our archival galaxy datasets. As a consequence of the difference in redshift range between the simulated and observed galaxies, if the physical scale probed by the synthetic IFU data for the simulated galaxies used to compute the LDA predictor is much smaller than the physical scale probed by the observational dataset, the LDA predictor may not be directly applicable to the observational IFU dataset. In particular, the pixel spatial resolution of the synthetic stellar kinematic maps produced by B24B probes physical scales of 400 to 900 pc in each galaxy, depending on the redshift of the simulated galaxy. On the other hand, the physical scales probed by the stellar kinematic maps from CALIFA, ATLAS3D, and MASSIVE range from 300–1200 pc, depending on redshift and instrument resolution. Thus, despite the difference in redshift ranges, the physical scales probed are similar, enabling us to directly apply the LDA predictor in Equation 2 to the MASSIVE, ATLAS3D and CALIFA galaxy IFU datasets.
7 Conclusions
We mine archival galaxy IFU surveys to search for potential candidate host galaxies of individual SMBHBs that could be detected in GWs by PTAs. To do this, we use results from the Romulus25 cosmological simulations to identify the optimal set of parameters that discriminate simulated SMBH merger and binary host galaxies from a mass- and redshift-matched control sample. This selection is embedded in a LDA predictor. We then compute the LDA score for galaxies from archival IFU surveys to identify nearby galaxies that display the distinct signatures of SMBH binary and merger host galaxies. Assuming that their hypothetical two SMBHs are equal mass and are at milliparsec separations, we calculate their expected gravitational wave strain . We combine the LDA score with to calculate a total score for each galaxy that reflects both (1) how likely they are to host a SMBHB, and (2) the strength of their hypothetical gravitational wave strain. Our main findings are as follows:
-
1.
Using the Romulus25 cosmological simulations, we determine that among the full set of morphological and stellar kinematic parameters, it is the set of stellar kinematic parameters that optimally discriminates SMBH merger and binary host galaxies from a mass- and redshift-matched control sample. By selecting simulated galaxies with chirp mass and mass ratio , the accuracy of this classification reaches 85%.
-
2.
We derive the stellar kinematic signatures of simulated SMBH merger and binary host galaxies using a mass- and redshift-matched control sample, such that our results are not affected by galaxy scaling relations. We apply these distinctive stellar kinematic signatures (slower rotation and stronger kinematic/photometric misalignments) to archival IFU observations of massive nearby galaxies, to predict which ones are the most likely to host a SMBH merger or binary.
-
3.
We produce a ranked list of galaxies that correspond to the best candidates for the host galaxies of individual SMBHBs in the northern sky that will be detected in GWs by PTAs. Even before a PTA detection, this list can be use to (1) perform targeted searches for individual sources of continuous GW in PTA data, (2) to corroborate candidate SMBHBs discovered through other means, and (3) to select candidate closely-separated (100 pc) dual AGNs and recoiling AGN for follow-up observations.
The quest to detect continuous nHz GWs from an individual SMBHB is ongoing through multiple PTA experiments. While we focus in this paper on identifying potential PTA GW sources among massive nearby galaxies using archival IFU surveys in the northern sky, ongoing galaxy IFU surveys in the south such as the Hector Galaxy Survey222https://hector.survey.org.au/ can extend these efforts for full sky coverage of individual PTA sources. Such a search may become especially pressing given the recent tentative detection of a GW hotspot by the MeerKAT PTA collaboration at southern declinations not covered here (Grunthal et al., 2024). When the host galaxy of an individual SMBHB detected through GWs by PTAs is identified, telescope follow-up across the electromagnetic spectrum will provide insights on the formation and environments of SMBHBs that remain mysterious.
Appendix A Full Ranked List
| Name | Total Score | Survey | LDA | Total | Light | |||||
|---|---|---|---|---|---|---|---|---|---|---|
| Rank | [Mpc] | Score | Score | Score | Profile | |||||
| NGC4073 | 1 | 91.50 | MASSIVE | 10.25 | -13.04 | 4.08 | 0.98 | 0.99 | 0.99 | C |
| NGC1016 | 2 | 95.20 | MASSIVE | 10.25 | -13.06 | 3.86 | 0.98 | 0.97 | 0.97 | C |
| NGC2832 | 3 | 105.20 | MASSIVE | 10.30 | -13.02 | 3.62 | 0.99 | 0.94 | 0.97 | C |
| NGC4486 | 4 | 17.20 | ATLAS3D | 9.72 | -13.20 | 4.03 | 0.93 | 0.98 | 0.96 | C |
| NGC1060 | 5 | 67.40 | MASSIVE | 10.00 | -13.32 | 4.21 | 0.90 | 1.00 | 0.95 | – |
| NGC0533 | 6 | 77.90 | MASSIVE | 10.03 | -13.33 | 3.87 | 0.90 | 0.97 | 0.93 | – |
| NGC4472 | 7 | 17.10 | ATLAS3D | 9.80 | -13.07 | 3.02 | 0.97 | 0.89 | 0.93 | C |
| NGC4874 | 8 | 102.00 | MASSIVE | 10.13 | -13.28 | 3.56 | 0.91 | 0.94 | 0.92 | C |
| NGC0410 | 9 | 71.30 | MASSIVE | 9.94 | -13.45 | 3.93 | 0.86 | 0.97 | 0.92 | – |
| NGC7265 | 10 | 82.80 | MASSIVE | 9.95 | -13.49 | 4.01 | 0.85 | 0.98 | 0.92 | – |
| NGC1060 | 11 | 73.90 | CALIFA | 9.91 | -13.51 | 3.92 | 0.84 | 0.97 | 0.91 | – |
| NGC0777 | 12 | 72.20 | MASSIVE | 9.95 | -13.43 | 3.69 | 0.86 | 0.95 | 0.91 | – |
| NGC0315 | 13 | 70.30 | MASSIVE | 10.22 | -12.98 | 2.11 | 1.00 | 0.80 | 0.91 | – |
| NGC1129 | 14 | 73.90 | MASSIVE | 10.10 | -13.20 | 2.87 | 0.94 | 0.87 | 0.90 | – |
| NGC4406 | 15 | 16.80 | ATLAS3D | 9.51 | -13.54 | 3.84 | 0.83 | 0.97 | 0.90 | C |
| NGC0507 | 16 | 69.80 | MASSIVE | 9.95 | -13.42 | 3.42 | 0.87 | 0.93 | 0.90 | C |
| NGC4374 | 17 | 18.50 | ATLAS3D | 9.48 | -13.63 | 3.97 | 0.81 | 0.98 | 0.90 | C |
| NGC4261 | 18 | 30.80 | ATLAS3D | 9.71 | -13.47 | 3.42 | 0.85 | 0.93 | 0.89 | C |
| NGC2258 | 19 | 59.00 | MASSIVE | 9.75 | -13.68 | 3.96 | 0.79 | 0.98 | 0.89 | – |
| NGC0708 | 20 | 69.00 | MASSIVE | 9.75 | -13.74 | 4.03 | 0.77 | 0.98 | 0.88 | – |
| NGC5846 | 21 | 24.20 | ATLAS3D | 9.46 | -13.77 | 4.07 | 0.76 | 0.99 | 0.88 | C |
| NGC4472 | 22 | 16.70 | MASSIVE | 9.80 | -13.04 | 1.59 | 0.98 | 0.75 | 0.87 | C |
| NGC7436 | 23 | 106.60 | MASSIVE | 10.12 | -13.33 | 2.56 | 0.90 | 0.84 | 0.87 | – |
| NGC2783 | 24 | 101.40 | MASSIVE | 9.80 | -13.83 | 3.93 | 0.74 | 0.97 | 0.87 | – |
| NGC5557 | 25 | 51.00 | MASSIVE | 9.61 | -13.86 | 4.00 | 0.73 | 0.98 | 0.87 | C |
| NGC7626 | 26 | 54.00 | MASSIVE | 9.75 | -13.64 | 3.35 | 0.80 | 0.92 | 0.86 | I |
| NGC3842 | 27 | 99.40 | MASSIVE | 9.94 | -13.60 | 3.04 | 0.81 | 0.89 | 0.85 | C |
| NGC4914 | 28 | 74.50 | MASSIVE | 9.80 | -13.69 | 3.30 | 0.78 | 0.91 | 0.85 | – |
| NGC2274 | 29 | 73.80 | MASSIVE | 9.77 | -13.74 | 3.43 | 0.77 | 0.93 | 0.85 | – |
| NGC0080 | 30 | 81.90 | MASSIVE | 9.75 | -13.82 | 3.55 | 0.75 | 0.94 | 0.85 | – |
| NGC1573 | 31 | 65.00 | MASSIVE | 9.67 | -13.85 | 3.63 | 0.74 | 0.95 | 0.85 | – |
| NGC5322 | 32 | 34.20 | MASSIVE | 9.64 | -13.63 | 2.94 | 0.80 | 0.88 | 0.84 | C |
| NGC3209 | 33 | 94.60 | MASSIVE | 9.67 | -14.02 | 3.90 | 0.69 | 0.97 | 0.84 | – |
| NGC4636 | 34 | 14.30 | ATLAS3D | 9.17 | -14.03 | 3.92 | 0.68 | 0.97 | 0.84 | C |
| NGC7436B | 35 | 107.80 | CALIFA | 10.02 | -13.49 | 2.41 | 0.85 | 0.83 | 0.84 | – |
| NGC1132 | 36 | 97.60 | MASSIVE | 9.79 | -13.84 | 3.30 | 0.74 | 0.91 | 0.83 | – |
| NGC3562 | 37 | 101.00 | MASSIVE | 9.75 | -13.91 | 3.47 | 0.72 | 0.93 | 0.83 | – |
| NGC2672 | 38 | 61.50 | MASSIVE | 9.70 | -13.78 | 3.13 | 0.76 | 0.90 | 0.83 | – |
| NGC4365 | 39 | 23.30 | ATLAS3D | 9.38 | -13.89 | 3.39 | 0.72 | 0.92 | 0.83 | C |
| NGC4874 | 40 | 114.00 | CALIFA | 9.66 | -14.11 | 3.85 | 0.66 | 0.97 | 0.83 | C |
| NGC5813 | 41 | 31.30 | ATLAS3D | 9.49 | -13.83 | 3.18 | 0.74 | 0.90 | 0.83 | C |
| NGC4649 | 42 | 17.30 | ATLAS3D | 9.70 | -13.23 | 1.13 | 0.93 | 0.71 | 0.82 | C |
| NGC0890 | 43 | 55.60 | MASSIVE | 9.64 | -13.84 | 3.08 | 0.74 | 0.89 | 0.82 | – |
| NGC0499 | 44 | 69.80 | MASSIVE | 9.64 | -13.94 | 3.31 | 0.71 | 0.92 | 0.82 | – |
| NGC3462 | 45 | 99.20 | MASSIVE | 9.72 | -13.96 | 3.32 | 0.71 | 0.92 | 0.82 | – |
| UGC02783 | 46 | 85.80 | MASSIVE | 9.59 | -14.11 | 3.62 | 0.66 | 0.94 | 0.81 | – |
| NGC7386 | 47 | 99.10 | MASSIVE | 9.70 | -13.98 | 3.31 | 0.70 | 0.92 | 0.81 | – |
| NGC0910 | 48 | 79.80 | MASSIVE | 9.52 | -14.19 | 3.68 | 0.63 | 0.95 | 0.81 | C |
| NGC6173 | 49 | 136.70 | CALIFA | 9.71 | -14.11 | 3.46 | 0.66 | 0.93 | 0.81 | – |
| NGC3158 | 50 | 103.40 | MASSIVE | 10.20 | -13.18 | 0.39 | 0.94 | 0.64 | 0.80 | – |
| NGC7274 | 51 | 82.80 | MASSIVE | 9.56 | -14.15 | 3.41 | 0.65 | 0.92 | 0.80 | – |
| NGC6338 | 52 | 126.40 | CALIFA | 9.66 | -14.17 | 3.38 | 0.64 | 0.92 | 0.79 | – |
| NGC4555 | 53 | 103.60 | MASSIVE | 9.94 | -13.62 | 1.88 | 0.81 | 0.78 | 0.79 | – |
| NGC3937 | 54 | 101.20 | MASSIVE | 9.72 | -13.96 | 2.85 | 0.70 | 0.87 | 0.79 | – |
| NGC7556 | 55 | 103.00 | MASSIVE | 9.89 | -13.70 | 2.05 | 0.78 | 0.80 | 0.79 | – |
| NGC1684 | 56 | 63.50 | MASSIVE | 9.52 | -14.09 | 2.87 | 0.66 | 0.87 | 0.78 | – |
| NGC7619 | 57 | 54.00 | MASSIVE | 9.75 | -13.64 | 1.56 | 0.80 | 0.75 | 0.78 | C |
| NGC4816 | 58 | 102.00 | MASSIVE | 9.52 | -14.30 | 3.30 | 0.60 | 0.91 | 0.77 | – |
| IC0310 | 59 | 77.50 | MASSIVE | 9.52 | -14.18 | 3.03 | 0.64 | 0.89 | 0.77 | – |
| UGC03683 | 60 | 85.10 | MASSIVE | 9.66 | -14.00 | 2.51 | 0.69 | 0.84 | 0.77 | – |
| NGC5557 | 61 | 38.80 | ATLAS3D | 9.07 | -14.64 | 3.84 | 0.50 | 0.97 | 0.77 | C |
| NGC7052 | 62 | 69.30 | MASSIVE | 9.75 | -13.74 | 1.75 | 0.77 | 0.77 | 0.77 | C |
| NGC2320 | 63 | 89.40 | MASSIVE | 9.95 | -13.53 | 0.93 | 0.84 | 0.69 | 0.77 | – |
| NGC5322 | 64 | 30.30 | ATLAS3D | 9.39 | -13.99 | 2.31 | 0.70 | 0.82 | 0.76 | C |
| NGC7550 | 65 | 73.80 | CALIFA | 9.23 | -14.65 | 3.70 | 0.50 | 0.95 | 0.76 | – |
| NGC6482 | 66 | 61.40 | MASSIVE | 9.70 | -13.77 | 1.62 | 0.76 | 0.75 | 0.76 | – |
| NGC2513 | 67 | 70.80 | MASSIVE | 9.66 | -13.92 | 2.05 | 0.72 | 0.80 | 0.76 | – |
| NGC0741 | 68 | 78.70 | CALIFA | 9.37 | -14.44 | 3.25 | 0.56 | 0.91 | 0.75 | – |
| NGC4841A | 69 | 108.00 | CALIFA | 9.42 | -14.50 | 3.22 | 0.54 | 0.91 | 0.75 | – |
| NGC4168 | 70 | 30.90 | ATLAS3D | 9.01 | -14.63 | 3.46 | 0.50 | 0.93 | 0.75 | C |
| NGC4552 | 71 | 15.80 | ATLAS3D | 8.85 | -14.61 | 3.31 | 0.51 | 0.91 | 0.74 | C |
| NGC2513 | 72 | 71.10 | CALIFA | 9.41 | -14.34 | 2.76 | 0.59 | 0.86 | 0.74 | – |
| UGC03894 | 73 | 97.20 | MASSIVE | 9.70 | -13.97 | 1.86 | 0.70 | 0.78 | 0.74 | – |
| NGC1700 | 74 | 54.40 | MASSIVE | 9.70 | -13.72 | 1.02 | 0.78 | 0.70 | 0.74 | C |
| NGC3816 | 75 | 99.40 | MASSIVE | 9.57 | -14.20 | 2.37 | 0.63 | 0.83 | 0.73 | – |
| NGC4382 | 76 | 17.90 | ATLAS3D | 9.26 | -13.99 | 1.79 | 0.70 | 0.77 | 0.73 | C |
| UGC12127 | 77 | 121.70 | CALIFA | 9.13 | -15.04 | 3.84 | 0.38 | 0.96 | 0.73 | – |
| NGC4816 | 78 | 110.10 | CALIFA | 9.35 | -14.62 | 3.13 | 0.51 | 0.90 | 0.73 | – |
| NGC0383 | 79 | 71.30 | MASSIVE | 9.87 | -13.56 | 0.03 | 0.82 | 0.60 | 0.72 | – |
| NGC0810 | 80 | 109.40 | CALIFA | 9.43 | -14.49 | 2.77 | 0.54 | 0.86 | 0.72 | – |
| NGC5490 | 81 | 78.60 | MASSIVE | 9.69 | -13.91 | 1.21 | 0.72 | 0.72 | 0.72 | – |
| NGC5029 | 82 | 136.00 | CALIFA | 9.35 | -14.72 | 3.03 | 0.47 | 0.89 | 0.71 | – |
| NGC6703 | 83 | 25.90 | ATLAS3D | 8.48 | -15.45 | 3.91 | 0.25 | 0.97 | 0.71 | P |
| NGC0499 | 84 | 62.90 | CALIFA | 9.18 | -14.66 | 2.85 | 0.49 | 0.87 | 0.71 | – |
| NGC5198 | 85 | 39.60 | ATLAS3D | 8.82 | -15.05 | 3.45 | 0.37 | 0.93 | 0.71 | C |
| NGC1453 | 86 | 56.40 | MASSIVE | 9.75 | -13.66 | 0.04 | 0.80 | 0.61 | 0.71 | – |
| UGC10695 | 87 | 129.30 | CALIFA | 9.01 | -15.25 | 3.64 | 0.31 | 0.95 | 0.70 | – |
| NGC2693 | 88 | 74.40 | MASSIVE | 9.82 | -13.67 | -0.09 | 0.79 | 0.59 | 0.70 | – |
| NGC3158 | 89 | 107.90 | CALIFA | 9.73 | -13.97 | 0.93 | 0.70 | 0.69 | 0.70 | – |
| NGC6575 | 90 | 106.00 | MASSIVE | 9.70 | -14.01 | 0.96 | 0.69 | 0.69 | 0.69 | – |
| IC1079 | 91 | 137.90 | CALIFA | 9.06 | -15.21 | 3.33 | 0.33 | 0.92 | 0.69 | – |
| NGC2418 | 92 | 74.10 | MASSIVE | 9.57 | -14.08 | 1.06 | 0.67 | 0.70 | 0.69 | – |
| NGC6125 | 93 | 77.00 | CALIFA | 9.15 | -14.80 | 2.70 | 0.45 | 0.86 | 0.68 | – |
| NGC0997 | 94 | 90.40 | MASSIVE | 9.57 | -14.16 | 1.22 | 0.64 | 0.72 | 0.68 | – |
| NGC2768 | 95 | 21.80 | ATLAS3D | 9.40 | -13.84 | 0.09 | 0.74 | 0.61 | 0.68 | I |
| UGC10693 | 96 | 129.80 | CALIFA | 9.35 | -14.69 | 2.40 | 0.48 | 0.83 | 0.68 | – |
| NGC6223 | 97 | 86.70 | MASSIVE | 9.70 | -13.92 | 0.34 | 0.71 | 0.63 | 0.68 | – |
| NGC6515 | 98 | 106.20 | CALIFA | 8.84 | -15.46 | 3.37 | 0.25 | 0.92 | 0.67 | – |
| NGC6375 | 99 | 95.80 | MASSIVE | 9.66 | -14.05 | 0.61 | 0.68 | 0.66 | 0.67 | – |
| NGC6411 | 100 | 61.30 | CALIFA | 8.65 | -15.53 | 3.24 | 0.23 | 0.91 | 0.66 | – |
| NGC7562 | 101 | 52.70 | CALIFA | 8.92 | -15.01 | 2.65 | 0.39 | 0.85 | 0.66 | – |
| NGC5129 | 102 | 107.50 | MASSIVE | 9.94 | -13.63 | -1.35 | 0.80 | 0.47 | 0.66 | – |
| NGC6020 | 103 | 71.80 | CALIFA | 8.52 | -15.82 | 3.36 | 0.14 | 0.92 | 0.66 | – |
| NGC7618 | 104 | 76.30 | MASSIVE | 9.59 | -14.06 | 0.41 | 0.67 | 0.64 | 0.66 | – |
| NGC3608 | 105 | 22.30 | ATLAS3D | 8.44 | -15.44 | 2.99 | 0.26 | 0.88 | 0.65 | C |
| NGC5614 | 106 | 65.40 | CALIFA | 9.01 | -14.96 | 2.31 | 0.40 | 0.82 | 0.65 | – |
| NGC3414 | 107 | 24.50 | ATLAS3D | 8.69 | -15.07 | 2.45 | 0.37 | 0.83 | 0.64 | P |
| NGC3607 | 108 | 22.20 | ATLAS3D | 9.08 | -14.37 | 1.01 | 0.58 | 0.70 | 0.64 | C |
| NGC5485 | 109 | 25.20 | ATLAS3D | 8.61 | -15.22 | 2.49 | 0.32 | 0.84 | 0.63 | C |
| UGC00029 | 110 | 127.50 | CALIFA | 8.58 | -15.97 | 3.05 | 0.09 | 0.89 | 0.63 | – |
| NGC4278 | 111 | 15.60 | ATLAS3D | 8.64 | -14.95 | 2.04 | 0.40 | 0.79 | 0.63 | C |
| NGC6146 | 112 | 137.30 | CALIFA | 9.55 | -14.37 | 0.80 | 0.58 | 0.68 | 0.63 | – |
| NGC5631 | 113 | 36.30 | CALIFA | 8.40 | -15.72 | 2.85 | 0.17 | 0.87 | 0.63 | – |
| NGC0155 | 114 | 89.20 | CALIFA | 8.81 | -15.43 | 2.56 | 0.26 | 0.84 | 0.62 | – |
| NGC1167 | 115 | 70.20 | MASSIVE | 9.74 | -13.78 | -1.65 | 0.76 | 0.44 | 0.62 | – |
| NGC0524 | 116 | 23.30 | ATLAS3D | 9.18 | -14.23 | -0.14 | 0.62 | 0.59 | 0.60 | C |
| NGC3665 | 117 | 33.10 | ATLAS3D | 9.43 | -13.96 | -1.22 | 0.70 | 0.48 | 0.60 | – |
| NGC5485 | 118 | 36.70 | CALIFA | 8.56 | -15.46 | 2.28 | 0.25 | 0.82 | 0.60 | C |
| NGC3615 | 119 | 101.20 | MASSIVE | 9.70 | -13.99 | -1.30 | 0.69 | 0.48 | 0.60 | – |
| NGC3303 | 120 | 98.80 | CALIFA | 8.62 | -15.79 | 2.33 | 0.15 | 0.82 | 0.59 | – |
| NGC0665 | 121 | 74.60 | MASSIVE | 9.64 | -13.97 | -1.58 | 0.70 | 0.45 | 0.59 | – |
| NGC1167 | 122 | 70.60 | CALIFA | 9.66 | -13.91 | -1.96 | 0.72 | 0.41 | 0.59 | – |
| NGC7426 | 123 | 80.00 | MASSIVE | 9.82 | -13.70 | -3.55 | 0.78 | 0.26 | 0.58 | – |
| NGC5353 | 124 | 41.10 | MASSIVE | 9.61 | -13.77 | -2.98 | 0.76 | 0.32 | 0.58 | – |
| NGC3805 | 125 | 99.40 | MASSIVE | 9.77 | -13.87 | -2.41 | 0.73 | 0.37 | 0.58 | – |
| NGC3379 | 126 | 10.30 | ATLAS3D | 8.38 | -15.21 | 1.57 | 0.32 | 0.75 | 0.58 | C |
| NGC3193 | 127 | 33.10 | ATLAS3D | 8.77 | -15.07 | 1.29 | 0.37 | 0.72 | 0.57 | C |
| NGC7619 | 128 | 54.90 | CALIFA | 8.42 | -15.86 | 1.94 | 0.13 | 0.78 | 0.56 | C |
| NGC4494 | 129 | 16.60 | ATLAS3D | 8.51 | -15.21 | 1.27 | 0.33 | 0.72 | 0.56 | P |
| NGC7025 | 130 | 75.40 | CALIFA | 9.39 | -14.39 | -0.58 | 0.57 | 0.55 | 0.56 | – |
| NGC3613 | 131 | 28.30 | ATLAS3D | 8.89 | -14.79 | 0.49 | 0.45 | 0.65 | 0.56 | C |
| NGC0661 | 132 | 30.60 | ATLAS3D | 8.40 | -15.64 | 1.65 | 0.20 | 0.76 | 0.55 | – |
| NGC0474 | 133 | 30.90 | ATLAS3D | 8.40 | -15.64 | 1.64 | 0.19 | 0.76 | 0.55 | P |
| NGC2918 | 134 | 105.10 | CALIFA | 9.25 | -14.77 | 0.18 | 0.46 | 0.62 | 0.54 | – |
| NGC3106 | 135 | 96.40 | CALIFA | 8.87 | -15.37 | 1.10 | 0.28 | 0.71 | 0.54 | – |
| NGC7623 | 136 | 54.50 | CALIFA | 8.49 | -15.76 | 1.45 | 0.16 | 0.74 | 0.53 | – |
| UGC10097 | 137 | 94.60 | CALIFA | 9.27 | -14.68 | -0.25 | 0.49 | 0.58 | 0.53 | – |
| NGC4621 | 138 | 14.90 | ATLAS3D | 8.71 | -14.81 | -0.11 | 0.45 | 0.59 | 0.52 | P |
| NGC1497 | 139 | 87.80 | MASSIVE | 9.51 | -14.26 | -1.98 | 0.61 | 0.41 | 0.52 | – |
| NGC3226 | 140 | 22.90 | ATLAS3D | 8.51 | -15.35 | 0.82 | 0.28 | 0.68 | 0.52 | P |
| NGC4753 | 141 | 22.90 | ATLAS3D | 9.16 | -14.26 | -2.07 | 0.61 | 0.40 | 0.52 | – |
| NGC4477 | 142 | 16.50 | ATLAS3D | 8.42 | -15.34 | 0.67 | 0.29 | 0.66 | 0.51 | I |
| NGC5208 | 143 | 105.00 | MASSIVE | 9.72 | -13.98 | -4.86 | 0.70 | 0.14 | 0.50 | – |
| NGC5638 | 144 | 25.60 | ATLAS3D | 8.40 | -15.58 | 0.76 | 0.22 | 0.67 | 0.50 | – |
| NGC0447 | 145 | 80.10 | CALIFA | 8.73 | -15.51 | 0.67 | 0.23 | 0.66 | 0.50 | – |
| NGC0821 | 146 | 23.40 | ATLAS3D | 8.67 | -15.07 | -0.03 | 0.37 | 0.60 | 0.50 | I |
| NGC5966 | 147 | 73.50 | CALIFA | 8.53 | -15.81 | 0.89 | 0.14 | 0.69 | 0.50 | – |
| NGC7194 | 148 | 118.90 | CALIFA | 9.25 | -14.82 | -0.71 | 0.44 | 0.53 | 0.49 | – |
| NGC4429 | 149 | 16.50 | ATLAS3D | 8.79 | -14.72 | -0.99 | 0.47 | 0.51 | 0.49 | P |
| NGC4526 | 150 | 16.40 | ATLAS3D | 8.92 | -14.51 | -1.74 | 0.54 | 0.44 | 0.49 | – |
| NGC3615 | 151 | 105.40 | CALIFA | 9.15 | -14.94 | -0.47 | 0.41 | 0.56 | 0.49 | – |
| NGC0169 | 152 | 66.20 | CALIFA | 9.51 | -14.13 | -3.95 | 0.65 | 0.23 | 0.49 | – |
| NGC5353 | 153 | 35.20 | ATLAS3D | 9.35 | -14.13 | -4.06 | 0.65 | 0.22 | 0.49 | – |
| NGC3640 | 154 | 26.30 | ATLAS3D | 8.88 | -14.77 | -1.01 | 0.46 | 0.51 | 0.48 | C |
| NGC7563 | 155 | 60.80 | CALIFA | 8.46 | -15.85 | 0.67 | 0.13 | 0.66 | 0.48 | – |
| NGC4697 | 156 | 11.40 | ATLAS3D | 8.63 | -14.84 | -1.06 | 0.44 | 0.50 | 0.47 | P |
| NGC4596 | 157 | 16.50 | ATLAS3D | 8.37 | -15.42 | 0.10 | 0.26 | 0.61 | 0.47 | P |
| NGC2554 | 158 | 64.00 | CALIFA | 8.87 | -15.19 | -0.31 | 0.33 | 0.57 | 0.47 | – |
| NGC0932 | 159 | 57.50 | CALIFA | 8.46 | -15.83 | 0.47 | 0.14 | 0.65 | 0.47 | – |
| NGC4473 | 160 | 15.30 | ATLAS3D | 8.40 | -15.35 | -0.08 | 0.28 | 0.59 | 0.47 | C |
| NGC5866 | 161 | 14.90 | ATLAS3D | 8.52 | -15.14 | -0.53 | 0.35 | 0.55 | 0.46 | – |
| NGC5784 | 162 | 86.60 | CALIFA | 8.87 | -15.31 | -0.31 | 0.30 | 0.57 | 0.45 | – |
| NGC6945 | 163 | 59.30 | CALIFA | 9.16 | -14.67 | -2.11 | 0.49 | 0.40 | 0.45 | – |
| NGC0529 | 164 | 69.00 | CALIFA | 8.66 | -15.56 | -0.13 | 0.22 | 0.59 | 0.44 | – |
| UGC10905 | 165 | 122.70 | CALIFA | 9.52 | -14.39 | -3.95 | 0.57 | 0.23 | 0.44 | – |
| NGC6314 | 166 | 105.30 | CALIFA | 8.87 | -15.41 | -0.55 | 0.27 | 0.55 | 0.43 | – |
| NGC7722 | 167 | 58.30 | CALIFA | 8.92 | -15.06 | -1.32 | 0.37 | 0.48 | 0.43 | – |
| NGC6021 | 168 | 78.50 | CALIFA | 8.53 | -15.84 | -0.15 | 0.13 | 0.59 | 0.43 | – |
| NGC0936 | 169 | 22.40 | ATLAS3D | 9.03 | -14.46 | -4.06 | 0.55 | 0.22 | 0.42 | P |
| NGC0680 | 170 | 37.50 | ATLAS3D | 8.56 | -15.47 | -0.74 | 0.25 | 0.53 | 0.41 | – |
| NGC2859 | 171 | 27.00 | ATLAS3D | 8.47 | -15.48 | -0.78 | 0.25 | 0.53 | 0.41 | P |
| NGC7738 | 172 | 97.80 | CALIFA | 8.65 | -15.74 | -0.67 | 0.17 | 0.54 | 0.40 | – |
| NGC1349 | 173 | 93.90 | CALIFA | 8.40 | -16.14 | -0.50 | 0.05 | 0.55 | 0.39 | – |
| UGC11228 | 174 | 90.30 | CALIFA | 8.67 | -15.67 | -0.97 | 0.19 | 0.51 | 0.38 | – |
| NGC4956 | 175 | 77.70 | CALIFA | 8.49 | -15.90 | -0.78 | 0.12 | 0.53 | 0.38 | – |
| NGC2962 | 176 | 34.00 | ATLAS3D | 8.68 | -15.23 | -1.78 | 0.32 | 0.43 | 0.38 | P |
| NGC5473 | 177 | 33.20 | ATLAS3D | 8.66 | -15.25 | -1.81 | 0.31 | 0.43 | 0.38 | – |
| NGC6081 | 178 | 85.00 | CALIFA | 8.71 | -15.57 | -1.25 | 0.22 | 0.48 | 0.37 | – |
| NGC7824 | 179 | 88.10 | CALIFA | 8.92 | -15.24 | -1.90 | 0.32 | 0.42 | 0.37 | – |
| NGC4459 | 180 | 16.10 | ATLAS3D | 8.38 | -15.40 | -1.59 | 0.27 | 0.45 | 0.37 | P |
| UGC05771 | 181 | 114.30 | CALIFA | 9.04 | -15.15 | -2.16 | 0.34 | 0.40 | 0.37 | – |
| NGC5838 | 182 | 21.80 | ATLAS3D | 8.78 | -14.87 | -3.20 | 0.43 | 0.30 | 0.37 | P |
| NGC6150 | 183 | 135.80 | CALIFA | 9.22 | -14.93 | -3.10 | 0.41 | 0.31 | 0.36 | – |
| NGC3998 | 184 | 13.70 | ATLAS3D | 8.41 | -15.27 | -2.08 | 0.31 | 0.40 | 0.36 | I |
| UGC08107 | 185 | 128.60 | CALIFA | 8.63 | -15.89 | -1.18 | 0.12 | 0.49 | 0.36 | – |
| NGC4281 | 186 | 24.40 | ATLAS3D | 8.88 | -14.75 | -4.30 | 0.46 | 0.19 | 0.36 | P |
| NGC0023 | 187 | 65.70 | CALIFA | 8.58 | -15.67 | -1.41 | 0.19 | 0.47 | 0.36 | – |
| NGC7711 | 188 | 58.80 | CALIFA | 8.60 | -15.59 | -1.65 | 0.21 | 0.44 | 0.35 | – |
| NGC6278 | 189 | 48.60 | CALIFA | 8.38 | -15.88 | -1.43 | 0.12 | 0.46 | 0.34 | P |
| UGC10205 | 190 | 104.60 | CALIFA | 8.51 | -15.99 | -1.66 | 0.09 | 0.44 | 0.32 | – |
| NGC5687 | 191 | 27.20 | ATLAS3D | 8.47 | -15.48 | -2.34 | 0.24 | 0.38 | 0.32 | – |
| NGC0160 | 192 | 75.20 | CALIFA | 8.57 | -15.76 | -1.93 | 0.16 | 0.42 | 0.32 | – |
| NGC2974 | 193 | 20.90 | ATLAS3D | 8.74 | -14.92 | -4.68 | 0.41 | 0.16 | 0.31 | P |
| NGC7671 | 194 | 60.00 | CALIFA | 8.44 | -15.87 | -1.93 | 0.13 | 0.42 | 0.31 | – |
| NGC5987 | 195 | 50.80 | CALIFA | 8.86 | -15.10 | -3.85 | 0.36 | 0.24 | 0.30 | – |
| NGC4036 | 196 | 24.60 | ATLAS3D | 8.78 | -14.91 | -5.48 | 0.42 | 0.08 | 0.30 | – |
| NGC5308 | 197 | 31.50 | ATLAS3D | 8.78 | -15.03 | -4.38 | 0.38 | 0.19 | 0.30 | P |
| NGC3945 | 198 | 23.20 | ATLAS3D | 8.55 | -15.27 | -3.36 | 0.31 | 0.28 | 0.29 | P |
| UGC05113 | 199 | 103.60 | CALIFA | 8.68 | -15.70 | -2.46 | 0.18 | 0.37 | 0.29 | – |
| UGC08234 | 200 | 124.80 | CALIFA | 8.74 | -15.69 | -2.51 | 0.18 | 0.36 | 0.29 | – |
| NGC4233 | 201 | 33.90 | ATLAS3D | 8.64 | -15.30 | -3.48 | 0.30 | 0.27 | 0.29 | – |
| NGC5406 | 202 | 84.40 | CALIFA | 8.97 | -15.14 | -4.18 | 0.35 | 0.20 | 0.28 | – |
| NGC3230 | 203 | 40.80 | ATLAS3D | 8.70 | -15.27 | -3.73 | 0.31 | 0.25 | 0.28 | – |
| NGC4762 | 204 | 22.60 | ATLAS3D | 8.69 | -15.03 | -5.73 | 0.38 | 0.06 | 0.27 | P |
| NGC5908 | 205 | 55.40 | CALIFA | 8.88 | -15.10 | -5.18 | 0.36 | 0.11 | 0.27 | – |
| NGC2639 | 206 | 52.70 | CALIFA | 8.79 | -15.23 | -4.43 | 0.32 | 0.18 | 0.26 | – |
| UGC06036 | 207 | 101.60 | CALIFA | 8.80 | -15.50 | -3.41 | 0.24 | 0.28 | 0.26 | – |
| NGC4521 | 208 | 39.70 | ATLAS3D | 8.71 | -15.24 | -4.65 | 0.32 | 0.16 | 0.25 | – |
| NGC0217 | 209 | 56.70 | CALIFA | 8.68 | -15.45 | -3.71 | 0.25 | 0.25 | 0.25 | – |
| UGC06312 | 210 | 100.70 | CALIFA | 8.57 | -15.88 | -2.87 | 0.12 | 0.33 | 0.25 | – |
| NGC4003 | 211 | 103.60 | CALIFA | 8.64 | -15.78 | -3.02 | 0.15 | 0.31 | 0.25 | – |
| NGC7683 | 212 | 54.20 | CALIFA | 8.55 | -15.65 | -3.32 | 0.19 | 0.29 | 0.24 | – |
| IC0944 | 213 | 112.40 | CALIFA | 8.95 | -15.30 | -4.52 | 0.30 | 0.17 | 0.24 | – |
| NGC0774 | 214 | 65.20 | CALIFA | 8.39 | -15.99 | -3.02 | 0.09 | 0.31 | 0.23 | – |
| UGC00036 | 215 | 90.50 | CALIFA | 8.52 | -15.92 | -3.16 | 0.11 | 0.30 | 0.23 | – |
| UGC10380 | 216 | 137.90 | CALIFA | 8.53 | -16.08 | -3.02 | 0.06 | 0.31 | 0.23 | – |
| NGC2695 | 217 | 31.50 | ATLAS3D | 8.41 | -15.64 | -3.69 | 0.19 | 0.25 | 0.22 | – |
| NGC5422 | 218 | 30.80 | ATLAS3D | 8.43 | -15.60 | -3.82 | 0.21 | 0.24 | 0.22 | I |
| NGC6278 | 219 | 42.90 | ATLAS3D | 8.56 | -15.53 | -4.06 | 0.23 | 0.22 | 0.22 | P |
| NGC6497 | 220 | 95.50 | CALIFA | 8.58 | -15.84 | -3.44 | 0.13 | 0.27 | 0.22 | – |
| UGC08781 | 221 | 120.90 | CALIFA | 8.61 | -15.89 | -3.39 | 0.12 | 0.28 | 0.21 | – |
| IC0674 | 222 | 116.70 | CALIFA | 8.36 | -16.29 | -3.26 | 0.00 | 0.29 | 0.21 | – |
| UGC12274 | 223 | 112.10 | CALIFA | 8.77 | -15.60 | -4.20 | 0.21 | 0.20 | 0.21 | – |
| NGC7311 | 224 | 66.90 | CALIFA | 8.63 | -15.60 | -4.24 | 0.21 | 0.20 | 0.20 | – |
| NGC7684 | 225 | 74.30 | CALIFA | 8.49 | -15.88 | -3.69 | 0.12 | 0.25 | 0.20 | – |
| NGC0364 | 226 | 72.80 | CALIFA | 8.45 | -15.93 | -3.66 | 0.11 | 0.25 | 0.19 | – |
| UGC03995 | 227 | 71.80 | CALIFA | 8.39 | -16.04 | -3.58 | 0.08 | 0.26 | 0.19 | – |
| IC4566 | 228 | 92.30 | CALIFA | 8.44 | -16.06 | -3.61 | 0.07 | 0.26 | 0.19 | – |
| UGC09537 | 229 | 138.50 | CALIFA | 8.88 | -15.50 | -5.17 | 0.24 | 0.11 | 0.19 | – |
| NGC5888 | 230 | 136.50 | CALIFA | 8.86 | -15.54 | -5.22 | 0.23 | 0.11 | 0.18 | – |
| NGC3160 | 231 | 106.90 | CALIFA | 8.44 | -16.12 | -3.94 | 0.05 | 0.23 | 0.16 | – |
| NGC2577 | 232 | 30.80 | ATLAS3D | 8.39 | -15.67 | -4.93 | 0.19 | 0.13 | 0.16 | – |
| NGC5493 | 233 | 38.80 | ATLAS3D | 8.46 | -15.65 | -5.43 | 0.19 | 0.09 | 0.15 | – |
| IC1755 | 234 | 113.50 | CALIFA | 8.39 | -16.23 | -4.23 | 0.02 | 0.20 | 0.14 | – |
| NGC6547 | 235 | 40.80 | ATLAS3D | 8.38 | -15.81 | -5.06 | 0.14 | 0.12 | 0.13 | – |
| NGC5934 | 236 | 91.30 | CALIFA | 8.42 | -16.09 | -4.71 | 0.06 | 0.15 | 0.12 | – |
| NGC6060 | 237 | 73.70 | CALIFA | 8.41 | -16.02 | -4.83 | 0.08 | 0.14 | 0.12 | – |
| NGC6941 | 238 | 94.80 | CALIFA | 8.42 | -16.10 | -4.79 | 0.06 | 0.15 | 0.11 | – |
| NGC7321 | 239 | 104.90 | CALIFA | 8.40 | -16.18 | -4.94 | 0.03 | 0.13 | 0.10 | – |
| NGC6978 | 240 | 91.60 | CALIFA | 8.57 | -15.84 | -6.33 | 0.14 | 0.00 | 0.10 | – |
| NGC0180 | 241 | 75.30 | CALIFA | 8.39 | -16.06 | -5.37 | 0.07 | 0.09 | 0.08 | – |
| NGC2347 | 242 | 67.10 | CALIFA | 8.42 | -15.96 | -5.86 | 0.10 | 0.05 | 0.08 | – |
| NGC6478 | 243 | 105.10 | CALIFA | 8.54 | -15.95 | -6.18 | 0.10 | 0.01 | 0.07 | – |
| UGC10337 | 244 | 138.60 | CALIFA | 8.57 | -16.02 | -5.75 | 0.08 | 0.06 | 0.07 | – |
| NGC6301 | 245 | 129.50 | CALIFA | 8.55 | -16.03 | -6.26 | 0.08 | 0.01 | 0.06 | – |
| UGC10710 | 246 | 130.10 | CALIFA | 8.49 | -16.12 | -5.76 | 0.05 | 0.05 | 0.05 | – |
References
- Agazie et al. (2023) Agazie, G., Anumarlapudi, A., Archibald, A. M., et al. 2023, ApJ, 951, L8, doi: 10.3847/2041-8213/acdac6
- Agazie et al. (2024) Agazie, G., Antoniadis, J., Anumarlapudi, A., et al. 2024, ApJ, 966, 105, doi: 10.3847/1538-4357/ad36be
- Antonini & Merritt (2012) Antonini, F., & Merritt, D. 2012, ApJ, 745, 83, doi: 10.1088/0004-637X/745/1/83
- Armitage & Natarajan (2002) Armitage, P. J., & Natarajan, P. 2002, ApJ, 567, L9, doi: 10.1086/339770
- Arzoumanian et al. (2014) Arzoumanian, Z., Brazier, A., Burke-Spolaor, S., et al. 2014, ApJ, 794, 141, doi: 10.1088/0004-637X/794/2/141
- Arzoumanian et al. (2020) Arzoumanian, Z., Baker, P. T., Brazier, A., et al. 2020, ApJ, 900, 102, doi: 10.3847/1538-4357/ababa1
- Astropy Collaboration et al. (2018) Astropy Collaboration, Price-Whelan, A. M., Sipőcz, B. M., et al. 2018, AJ, 156, 123, doi: 10.3847/1538-3881/aabc4f
- Bardati et al. (2024a) Bardati, J., Ruan, J. J., Haggard, D., & Tremmel, M. 2024a, The Astrophysical Journal, 961, 34, doi: 10.3847/1538-4357/ad055a
- Bardati et al. (2024b) Bardati, J., Ruan, J. J., Haggard, D., Tremmel, M., & Horlaville, P. 2024b, Signatures of Massive Black Hole Merger Host Galaxies from Cosmological Simulations II: Unique Stellar Kinematics in Integral Field Unit Spectroscopy. https://arxiv.org/abs/2407.14061
- Bauer et al. (2013) Bauer, A. E., Hopkins, A. M., Gunawardhana, M., et al. 2013, MNRAS, 434, 209, doi: 10.1093/mnras/stt1011
- Begelman et al. (1980) Begelman, M. C., Blandford, R. D., & Rees, M. J. 1980, Nature, 287, 307
- Binney & Tremaine (2008) Binney, J., & Tremaine, S. 2008, Galactic Dynamics: Second Edition
- Blecha et al. (2011) Blecha, L., Cox, T. J., Loeb, A., & Hernquist, L. 2011, Monthly Notices of the Royal Astronomical Society, 412, 2154, doi: 10.1111/j.1365-2966.2010.18042.x
- Bogdanović et al. (2022) Bogdanović, T., Miller, M. C., & Blecha, L. 2022, Living Reviews in Relativity, 25, 3, doi: 10.1007/s41114-022-00037-8
- Bogdanović et al. (2007) Bogdanović, T., Reynolds, C. S., & Miller, M. C. 2007, ApJ, 661, L147, doi: 10.1086/518769
- Bois et al. (2011) Bois, M., Emsellem, E., Bournaud, F., et al. 2011, MNRAS, 416, 1654, doi: 10.1111/j.1365-2966.2011.19113.x
- Bower et al. (1998) Bower, G. A., Green, R. F., Danks, A., et al. 1998, ApJ, 492, L111, doi: 10.1086/311109
- Bravais (1844) Bravais, A. 1844, Analyse mathématique sur les probabilités des erreurs de situation d’un point (Impr. Royale)
- Brinchmann et al. (2004) Brinchmann, J., Charlot, S., White, S. D. M., et al. 2004, MNRAS, 351, 1151, doi: 10.1111/j.1365-2966.2004.07881.x
- Burke-Spolaor et al. (2019) Burke-Spolaor, S., Taylor, S. R., Charisi, M., et al. 2019, A&A Rev., 27, 5, doi: 10.1007/s00159-019-0115-7
- Campanelli et al. (2007) Campanelli, M., Lousto, C. O., Zlochower, Y., & Merritt, D. 2007, Physical Review Letters, 98, doi: 10.1103/physrevlett.98.231102
- Cappellari et al. (2011) Cappellari, M., Emsellem, E., Krajnović, D., et al. 2011, MNRAS, 413, 813, doi: 10.1111/j.1365-2966.2010.18174.x
- Catalán-Torrecilla et al. (2015) Catalán-Torrecilla, C., Gil de Paz, A., Castillo-Morales, A., et al. 2015, A&A, 584, A87, doi: 10.1051/0004-6361/201526023
- Cella et al. (2024) Cella, K., Taylor, S. R., & Kelley, L. Z. 2024, arXiv e-prints, arXiv:2407.01659, doi: 10.48550/arXiv.2407.01659
- Chandrasekhar (1943) Chandrasekhar, S. 1943, ApJ, 97, 255, doi: 10.1086/144517
- Charisi et al. (2022) Charisi, M., Taylor, S. R., Runnoe, J., Bogdanovic, T., & Trump, J. R. 2022, MNRAS, 510, 5929, doi: 10.1093/mnras/stab3713
- Charisi et al. (2024) Charisi, M., Taylor, S. R., Witt, C. A., & Runnoe, J. 2024, Phys. Rev. Lett., 132, 061401, doi: 10.1103/PhysRevLett.132.061401
- Comerford & Greene (2014) Comerford, J. M., & Greene, J. E. 2014, ApJ, 789, 112, doi: 10.1088/0004-637X/789/2/112
- Davis et al. (2016) Davis, T. A., Greene, J., Ma, C.-P., et al. 2016, MNRAS, 455, 214, doi: 10.1093/mnras/stv2313
- Davis et al. (2014) Davis, T. A., Young, L. M., Crocker, A. F., et al. 2014, MNRAS, 444, 3427, doi: 10.1093/mnras/stu570
- De Rosa et al. (2019) De Rosa, A., Vignali, C., Bogdanović, T., et al. 2019, New Astronomy Reviews, 86, 101525, doi: 10.1016/j.newar.2020.101525
- Dong-Páez et al. (2023) Dong-Páez, C. A., Volonteri, M., Beckmann, R. S., et al. 2023, A&A, 676, A2, doi: 10.1051/0004-6361/202346435
- D’Orazio et al. (2015) D’Orazio, D. J., Haiman, Z., & Schiminovich, D. 2015, Nature, 525, 351, doi: 10.1038/nature15262
- Dullo (2019) Dullo, B. T. 2019, ApJ, 886, 80, doi: 10.3847/1538-4357/ab4d4f
- Dullo et al. (2021) Dullo, B. T., Gil de Paz, A., & Knapen, J. H. 2021, ApJ, 908, 134, doi: 10.3847/1538-4357/abceae
- Ellis et al. (2023) Ellis, J., Fairbairn, M., Hütsi, G., et al. 2023, A&A, 676, A38, doi: 10.1051/0004-6361/202346268
- Emsellem et al. (2007) Emsellem, E., Cappellari, M., Krajnović, D., et al. 2007, MNRAS, 379, 401, doi: 10.1111/j.1365-2966.2007.11752.x
- Emsellem et al. (2011) —. 2011, MNRAS, 414, 888, doi: 10.1111/j.1365-2966.2011.18496.x
- Ene et al. (2018) Ene, I., Ma, C.-P., Veale, M., et al. 2018, MNRAS, 479, 2810, doi: 10.1093/mnras/sty1649
- Enoki et al. (2004) Enoki, M., Inoue, K. T., Nagashima, M., & Sugiyama, N. 2004, ApJ, 615, 19, doi: 10.1086/424475
- EPTA Collaboration et al. (2023) EPTA Collaboration, InPTA Collaboration, Antoniadis, J., et al. 2023, A&A, 678, A50, doi: 10.1051/0004-6361/202346844
- Event Horizon Telescope Collaboration et al. (2019) Event Horizon Telescope Collaboration, Akiyama, K., Alberdi, A., et al. 2019, ApJ, 875, L6, doi: 10.3847/2041-8213/ab1141
- Faber et al. (1997) Faber, S. M., Tremaine, S., Ajhar, E. A., et al. 1997, AJ, 114, 1771, doi: 10.1086/118606
- Falcón-Barroso et al. (2017) Falcón-Barroso, J., Lyubenova, M., van de Ven, G., et al. 2017, A&A, 597, A48, doi: 10.1051/0004-6361/201628625
- Falcón-Barroso et al. (2019) Falcón-Barroso, J., van de Ven, G., Lyubenova, M., et al. 2019, A&A, 632, A59, doi: 10.1051/0004-6361/201936413
- Finoguenov et al. (2007) Finoguenov, A., Ponman, T. J., Osmond, J. P. F., & Zimer, M. 2007, MNRAS, 374, 737, doi: 10.1111/j.1365-2966.2006.11194.x
- Gallazzi et al. (2005) Gallazzi, A., Charlot, S., Brinchmann, J., White, S. D. M., & Tremonti, C. A. 2005, MNRAS, 362, 41, doi: 10.1111/j.1365-2966.2005.09321.x
- Goldstein et al. (2019) Goldstein, J. M., Sesana, A., Holgado, A. M., & Veitch, J. 2019, MNRAS, 485, 248, doi: 10.1093/mnras/stz420
- Goldstein et al. (2018) Goldstein, J. M., Veitch, J., Sesana, A., & Vecchio, A. 2018, MNRAS, 477, 5447, doi: 10.1093/mnras/sty892
- González Delgado et al. (2015) González Delgado, R. M., García-Benito, R., Pérez, E., et al. 2015, A&A, 581, A103, doi: 10.1051/0004-6361/201525938
- Greene et al. (2019) Greene, J. E., Veale, M., Ma, C.-P., et al. 2019, ApJ, 874, 66, doi: 10.3847/1538-4357/ab01e3
- Grunthal et al. (2024) Grunthal, K., Nathan, R. S., Thrane, E., et al. 2024, arXiv e-prints, arXiv:2412.01214, doi: 10.48550/arXiv.2412.01214
- Gu et al. (2012) Gu, J.-H., Xu, H.-G., Wang, J.-Y., et al. 2012, Research in Astronomy and Astrophysics, 12, 63, doi: 10.1088/1674-4527/12/1/005
- Häring & Rix (2004) Häring, N., & Rix, H.-W. 2004, ApJ, 604, L89, doi: 10.1086/383567
- Harris et al. (2020) Harris, C. R., Millman, K. J., van der Walt, S. J., et al. 2020, Nature, 585, 357, doi: 10.1038/s41586-020-2649-2
- Hills (1983) Hills, J. G. 1983, AJ, 88, 1269, doi: 10.1086/113418
- Holley-Bockelmann & Richstone (2000) Holley-Bockelmann, K., & Richstone, D. O. 2000, ApJ, 531, 232, doi: 10.1086/308447
- Holz & Hughes (2005) Holz, D. E., & Hughes, S. A. 2005, ApJ, 629, 15, doi: 10.1086/431341
- Hunter (2007) Hunter, J. D. 2007, Computing in Science & Engineering, 9, 90, doi: 10.1109/MCSE.2007.55
- Izquierdo-Villalba et al. (2023) Izquierdo-Villalba, D., Sesana, A., & Colpi, M. 2023, MNRAS, 519, 2083, doi: 10.1093/mnras/stac3677
- Jaffe & Backer (2003) Jaffe, A. H., & Backer, D. C. 2003, ApJ, 583, 616, doi: 10.1086/345443
- Kelley et al. (2017) Kelley, L. Z., Blecha, L., & Hernquist, L. 2017, MNRAS, 464, 3131, doi: 10.1093/mnras/stw2452
- Kelley et al. (2018) Kelley, L. Z., Blecha, L., Hernquist, L., Sesana, A., & Taylor, S. R. 2018, MNRAS, 477, 964, doi: 10.1093/mnras/sty689
- Kennicutt (1998) Kennicutt, Jr., R. C. 1998, ARA&A, 36, 189, doi: 10.1146/annurev.astro.36.1.189
- Khonji et al. (2024) Khonji, N., Gualandris, A., Read, J. I., & Dehnen, W. 2024, ApJ, 974, 204, doi: 10.3847/1538-4357/ad7390
- Kim et al. (2016) Kim, D. C., Evans, A. S., Stierwalt, S., & Privon, G. C. 2016, ApJ, 824, 122, doi: 10.3847/0004-637X/824/2/122
- Koss et al. (2018) Koss, M. J., Blecha, L., Bernhard, P., et al. 2018, Nature, 563, 214, doi: 10.1038/s41586-018-0652-7
- Krajnović et al. (2011) Krajnović, D., Emsellem, E., Cappellari, M., et al. 2011, MNRAS, 414, 2923, doi: 10.1111/j.1365-2966.2011.18560.x
- Krajnović et al. (2013) Krajnović, D., Karick, A. M., Davies, R. L., et al. 2013, MNRAS, 433, 2812, doi: 10.1093/mnras/stt905
- Laine et al. (2003) Laine, S., van der Marel, R. P., Lauer, T. R., et al. 2003, AJ, 125, 478, doi: 10.1086/345823
- Lauer et al. (1995) Lauer, T. R., Ajhar, E. A., Byun, Y. I., et al. 1995, AJ, 110, 2622, doi: 10.1086/117719
- Lauer et al. (2002) Lauer, T. R., Gebhardt, K., Richstone, D., et al. 2002, AJ, 124, 1975, doi: 10.1086/342932
- Lauer et al. (2005) Lauer, T. R., Faber, S. M., Gebhardt, K., et al. 2005, AJ, 129, 2138, doi: 10.1086/429565
- Lauer et al. (2007a) Lauer, T. R., Gebhardt, K., Faber, S. M., et al. 2007a, ApJ, 664, 226, doi: 10.1086/519229
- Lauer et al. (2007b) Lauer, T. R., Faber, S. M., Richstone, D., et al. 2007b, ApJ, 662, 808, doi: 10.1086/518223
- Law-Smith & Eisenstein (2017) Law-Smith, J., & Eisenstein, D. J. 2017, ApJ, 836, 87, doi: 10.3847/1538-4357/836/1/87
- Lena et al. (2014) Lena, D., Robinson, A., Marconi, A., et al. 2014, ApJ, 795, 146, doi: 10.1088/0004-637X/795/2/146
- Lentati et al. (2015) Lentati, L., Taylor, S. R., Mingarelli, C. M. F., et al. 2015, MNRAS, 453, 2576, doi: 10.1093/mnras/stv1538
- Li et al. (2022) Li, K., Bogdanović, T., Ballantyne, D. R., & Bonetti, M. 2022, ApJ, 933, 104, doi: 10.3847/1538-4357/ac74b5
- Liepold & Ma (2024) Liepold, E. R., & Ma, C.-P. 2024, ApJ, 971, L29, doi: 10.3847/2041-8213/ad66b8
- Liu et al. (2023) Liu, T., Cohen, T., McGrath, C., Demorest, P. B., & Vigeland, S. J. 2023, ApJ, 945, 78, doi: 10.3847/1538-4357/acb492
- Liu & Vigeland (2021) Liu, T., & Vigeland, S. J. 2021, ApJ, 921, 178, doi: 10.3847/1538-4357/ac1da9
- Lotz et al. (2004) Lotz, J. M., Primack, J., & Madau, P. 2004, AJ, 128, 163, doi: 10.1086/421849
- Ma et al. (2014) Ma, C.-P., Greene, J. E., McConnell, N., et al. 2014, The Astrophysical Journal, 795, 158, doi: 10.1088/0004-637X/795/2/158
- Ma et al. (2016) Ma, X., Hopkins, P. F., Faucher-Giguère, C.-A., et al. 2016, MNRAS, 456, 2140, doi: 10.1093/mnras/stv2659
- Madau & Dickinson (2014) Madau, P., & Dickinson, M. 2014, ARA&A, 52, 415, doi: 10.1146/annurev-astro-081811-125615
- Mahtessian (1998) Mahtessian, A. P. 1998, Astrophysics, 41, 308, doi: 10.1007/BF03036100
- Malmquist (1922) Malmquist, K. G. 1922, Meddelanden fran Lunds Astronomiska Observatorium Serie I, 100, 1
- McDermid et al. (2015) McDermid, R. M., Alatalo, K., Blitz, L., et al. 2015, MNRAS, 448, 3484, doi: 10.1093/mnras/stv105
- Mingarelli et al. (2017) Mingarelli, C. M. F., Lazio, T. J. W., Sesana, A., et al. 2017, Nature Astronomy, 1, 886, doi: 10.1038/s41550-017-0299-6
- Naab et al. (2014) Naab, T., Oser, L., Emsellem, E., et al. 2014, MNRAS, 444, 3357, doi: 10.1093/mnras/stt1919
- Nasim et al. (2021) Nasim, I. T., Gualandris, A., Read, J. I., et al. 2021, MNRAS, 502, 4794, doi: 10.1093/mnras/stab435
- Nevin et al. (2019) Nevin, R., Blecha, L., Comerford, J., & Greene, J. 2019, ApJ, 872, 76, doi: 10.3847/1538-4357/aafd34
- Pawlik et al. (2016) Pawlik, M. M., Wild, V., Walcher, C. J., et al. 2016, MNRAS, 456, 3032, doi: 10.1093/mnras/stv2878
- Pedregosa et al. (2011) Pedregosa, F., Varoquaux, G., Gramfort, A., et al. 2011, Journal of Machine Learning Research, 12, 2825
- Petrov et al. (2024) Petrov, P., Taylor, S. R., Charisi, M., & Ma, C.-P. 2024, arXiv e-prints, arXiv:2406.04409, doi: 10.48550/arXiv.2406.04409
- Pfeifle et al. (2024) Pfeifle, R. W., Weaver, K. A., Secrest, N. J., Rothberg, B., & Patton, D. R. 2024, arXiv e-prints, arXiv:2411.12799, doi: 10.48550/arXiv.2411.12799
- Quinlan (1996) Quinlan, G. D. 1996, New A, 1, 35, doi: 10.1016/S1384-1076(96)00003-6
- Rajagopal & Romani (1995) Rajagopal, M., & Romani, R. W. 1995, ApJ, 446, 543, doi: 10.1086/175813
- Ravi et al. (2015) Ravi, V., Wyithe, J. S. B., Shannon, R. M., & Hobbs, G. 2015, MNRAS, 447, 2772, doi: 10.1093/mnras/stu2659
- Ravindranath et al. (2001) Ravindranath, S., Ho, L. C., Peng, C. Y., Filippenko, A. V., & Sargent, W. L. W. 2001, AJ, 122, 653, doi: 10.1086/321175
- Rawlings et al. (2025) Rawlings, A., Keitaanranta, A., Mattero, M., et al. 2025, MNRAS, 537, 3421, doi: 10.1093/mnras/staf238
- Reardon et al. (2023) Reardon, D. J., Zic, A., Shannon, R. M., et al. 2023, ApJ, 951, L6, doi: 10.3847/2041-8213/acdd02
- Rest et al. (2001) Rest, A., van den Bosch, F. C., Jaffe, W., et al. 2001, AJ, 121, 2431, doi: 10.1086/320370
- Rhodes (2011) Rhodes, B. C. 2011, PyEphem: Astronomical Ephemeris for Python, Astrophysics Source Code Library, record ascl:1112.014
- Rodriguez-Gomez et al. (2019) Rodriguez-Gomez, V., Snyder, G. F., Lotz, J. M., et al. 2019, MNRAS, 483, 4140, doi: 10.1093/mnras/sty3345
- Saeedzadeh et al. (2024) Saeedzadeh, V., Mukherjee, S., Babul, A., Tremmel, M., & Quinn, T. R. 2024, Monthly Notices of the Royal Astronomical Society, 529, 4295, doi: 10.1093/mnras/stae513
- Sahu et al. (2019) Sahu, N., Graham, A. W., & Davis, B. L. 2019, ApJ, 876, 155, doi: 10.3847/1538-4357/ab0f32
- Sánchez et al. (2012) Sánchez, S. F., Kennicutt, R. C., Gil de Paz, A., et al. 2012, A&A, 538, A8, doi: 10.1051/0004-6361/201117353
- Sánchez et al. (2017) Sánchez, S. F., Barrera-Ballesteros, J. K., Sánchez-Menguiano, L., et al. 2017, MNRAS, 469, 2121, doi: 10.1093/mnras/stx808
- Sandage (2000) Sandage, A. 2000, in Encyclopedia of Astronomy and Astrophysics, ed. P. Murdin, 1940, doi: 10.1888/0333750888/1940
- Schnittman & Buonanno (2007) Schnittman, J. D., & Buonanno, A. 2007, ApJ, 662, L63, doi: 10.1086/519309
- Schutz (1986) Schutz, B. F. 1986, Nature, 323, 310, doi: 10.1038/323310a0
- Schutz & Ma (2016) Schutz, K., & Ma, C.-P. 2016, MNRAS, 459, 1737, doi: 10.1093/mnras/stw768
- Sesana et al. (2008) Sesana, A., Haardt, F., & Madau, P. 2008, ApJ, 686, 432, doi: 10.1086/590651
- Sesana et al. (2004) Sesana, A., Haardt, F., Madau, P., & Volonteri, M. 2004, ApJ, 611, 623, doi: 10.1086/422185
- Sesana & Vecchio (2010) Sesana, A., & Vecchio, A. 2010, Phys. Rev. D, 81, 104008, doi: 10.1103/PhysRevD.81.104008
- Sesana et al. (2009) Sesana, A., Vecchio, A., & Volonteri, M. 2009, MNRAS, 394, 2255, doi: 10.1111/j.1365-2966.2009.14499.x
- Shannon et al. (2015) Shannon, R. M., Ravi, V., Lentati, L. T., et al. 2015, Science, 349, 1522, doi: 10.1126/science.aab1910
- Simon et al. (2014) Simon, J., Polin, A., Lommen, A., et al. 2014, ApJ, 784, 60, doi: 10.1088/0004-637X/784/1/60
- Stark et al. (2018) Stark, D. V., Bundy, K. A., Westfall, K., et al. 2018, MNRAS, 480, 2217, doi: 10.1093/mnras/sty1991
- Stigler (1989) Stigler, S. M. 1989, Statistical Science, 4, 73, doi: 10.1214/ss/1177012580
- Torbaniuk et al. (2024) Torbaniuk, O., Paolillo, M., D’Abrusco, R., et al. 2024, MNRAS, 527, 12091, doi: 10.1093/mnras/stad3965
- Tremonti et al. (2004) Tremonti, C. A., Heckman, T. M., Kauffmann, G., et al. 2004, ApJ, 613, 898, doi: 10.1086/423264
- Truant et al. (2025) Truant, R. J., Izquierdo-Villalba, D., Sesana, A., et al. 2025, arXiv e-prints, arXiv:2504.01074, doi: 10.48550/arXiv.2504.01074
- Valtaoja et al. (1989) Valtaoja, L., Valtonen, M. J., & Byrd, G. G. 1989, ApJ, 343, 47, doi: 10.1086/167683
- Veale et al. (2017) Veale, M., Ma, C.-P., Greene, J. E., et al. 2017, MNRAS, 471, 1428, doi: 10.1093/mnras/stx1639
- Virtanen et al. (2020) Virtanen, P., Gommers, R., Oliphant, T. E., et al. 2020, Nature Methods, 17, 261, doi: 10.1038/s41592-019-0686-2
- Volonteri et al. (2003) Volonteri, M., Haardt, F., & Madau, P. 2003, The Astrophysical Journal, 582, 559, doi: 10.1086/344675
- Volonteri et al. (2020) Volonteri, M., Pfister, H., Beckmann, R. S., et al. 2020, MNRAS, 498, 2219, doi: 10.1093/mnras/staa2384
- Walcher et al. (2014) Walcher, C. J., Wisotzki, L., Bekeraité, S., et al. 2014, A&A, 569, A1, doi: 10.1051/0004-6361/201424198
- Wyithe & Loeb (2003) Wyithe, J. S. B., & Loeb, A. 2003, ApJ, 590, 691, doi: 10.1086/375187
- Xu et al. (2023) Xu, H., Chen, S., Guo, Y., et al. 2023, Research in Astronomy and Astrophysics, 23, 075024, doi: 10.1088/1674-4527/acdfa5
- Young & Clarke (2015) Young, M. D., & Clarke, C. J. 2015, MNRAS, 452, 3085, doi: 10.1093/mnras/stv1512