Electron beam characterization via fluorescence imaging of Rydberg states in atomic vapor
Abstract
We demonstrate an all-optical, minimally invasive method for electron beam (-beam) characterization using Rydberg electrometry. The -beam passes through a dilute Rb vapor prepared in a quantum superposition of ground and Rydberg states that reduces resonant absorption in a narrow spectral region. Imaging the modifications of Rb fluorescence due to shifts in the Rydberg state from the -beam electric field allows us to reconstruct -beam width, centroid position, and current. We experimentally demonstrate this technique using a 20 keV -beam in the range of currents down to 20 A, and discuss technical challenges produced by environmental electric potentials in the detection chamber. Overall, we demonstrate the promising potential of such an approach as a minimally invasive diagnostic for charged particle beams.
With the steady technological advancements at high energy particle accelerators, there has been an increasing demand for more robust non-invasive spatial beam property diagnostics. While different approaches and apparatuses exist, optical and imaging methods based on signals such as fluorescence [1, 2], synchrotron radiation [3], and X-rays generated by moving particles [4] have played an essential role in accelerator research and beam operations. However, each of these beam diagnostics also bear some intrinsic drawbacks and their applicability is often limited by factors such as sensitivity and system complexity. For example, synchrotron radiation only exists near particle trajectory-bending components [3, 5], Compton scattering laser wire requires high laser intensity and slow scanning between particle and laser beams [6, 7], and the gas-ionization-based 2D super-sonic gas curtain devices rely on complex mechanical systems and have low sensitivity [8, 9]. The work presented in this letter describes our effort in the development of a sensitive, minimally invasive apparatus capable of measuring multiple charged particle beam parameters including width, centroid position, and current simultaneously.
In this letter we apply recently developed quantum electrometry [10, 11, 12, 13] for detection and diagnostic of a charged particle beam. We take advantage of the exceptionally large electron dipole moment of Rydberg states of alkali metal atoms () that have already been explored for a wide range of applications. These include SI-traceable electric field standards [14], rf-field receivers [11, 15, 13], THz-imaging [16, 17, 18], magnetic field sensing [19, 20], and thermometry of blackbody radiation [21]. Here we introduce a diagnostic method of an electron beam (-beam) via all-optical measurement of its effect on the Rydberg states in dilute rubidium (Rb) vapor. The reconstruction of electric field, created by the electrons, lets us calculate the centroid position, width and total current of the -beam. Unlike the complimentary technique based on magnetic field reconstruction using nonlinear magneto-polarization rotation [22], the current method offers superior spatial resolution, and in principle allows for three-dimensional reconstruction of the charged particle distribution.
For all-optical detection we use a coherent two-photon process known as electromagnetically induced transparency (EIT) [23, 24]. The Rb atoms are excited to a Rydberg state using two laser fields: a near-infrared probe field, resonant with the optical transition (wavelength 780 nm), and a 480 nm blue control field that couples the intermediate state with the desired Rydberg state (in our experiment ). In this configuration the population of the intermediate state diminishes when the sum of the laser frequencies matches the frequency difference between the ground and Rydberg states, and this change can be detected either through increased probe laser transmission, or reduced infra-red (IR) fluorescence [25, 26] at the two-photon resonance condition. Such two-photon EIT arrangement allows for relatively simple and sensitive detection of Rydberg state frequency shifts caused by external electric and magnetic fields. To maximize the interaction volume and, more importantly, to minimize the two-photon Doppler broadening [24], two optical fields are typically counter-propagating. Keeping track of the probe laser transmission complicates extracting any spatial information about -beam, since it reflects cumulative variations in the electric field along the interaction volume. There are some strategies for spatial mapping [27, 28], using, e.g., crossed laser beam [29] or a three-photon “star” configuration [30], but at expense of reduced spectral resolution and lower signal-to-noise.
The motivation of this work is to offer an in situ minimally invasive detection tool for charged particle beams as an alternative to more standard destructive diagnostics. In this letter, we demonstrate the possibility to map the electric field produced by an -beam by capturing Rb fluorescence, following a recently proposed fluorescence-based imaging technique [20, 31]. By recording and analyzing the spatial variation of IR fluorescence in the Rydberg EIT configuration, we map spatial variations in dc electric fields along the laser beam propagation (potentially in 2 dimensions) [31]. Here we focus on diagnostics of the electric field produced by an -beam. Despite parasitic background electric fields, we are able to infer the -beam width and centroid position, as well as its current.
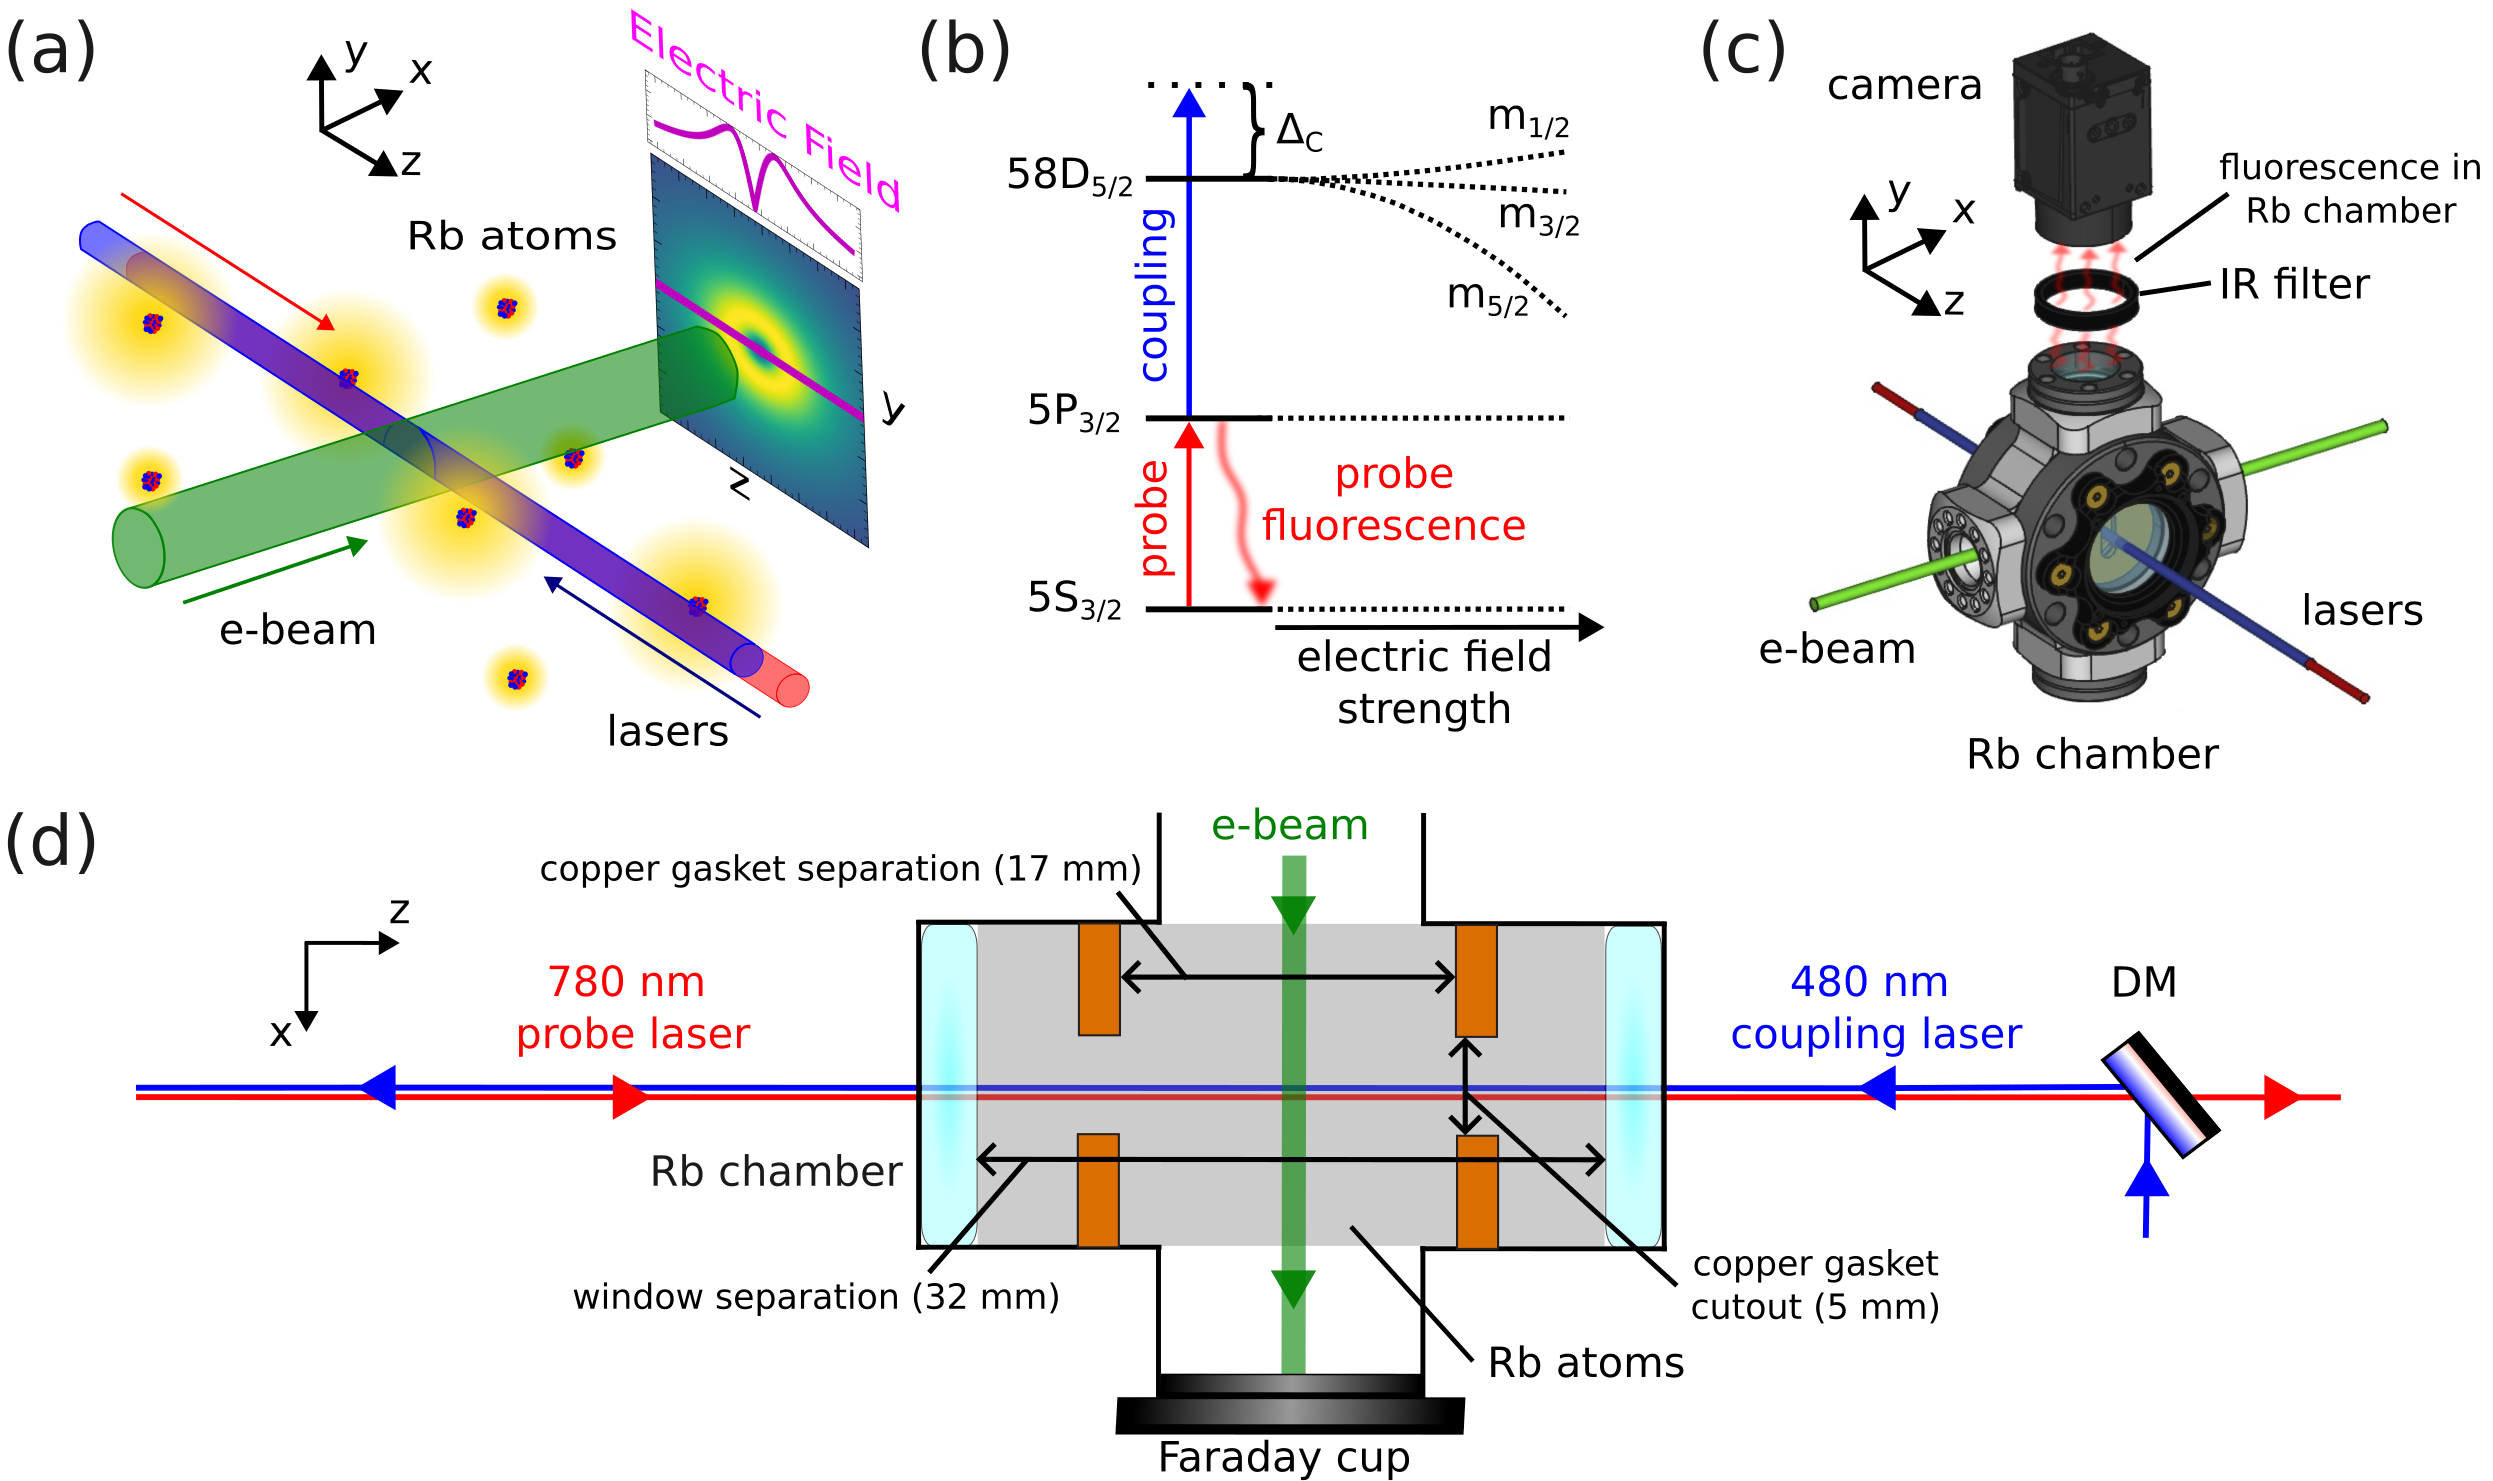
The experimental setup and general detection principle for the -beam diagnostics is shown in Fig. 1. A collimated beam of 20 keV electrons passes through an area filled with a dilute Rb vapor. The Rb density of 1.6 1011 atoms/cm3 is produced using an ampule of metallic Rb placed in the heated vacuum chamber. Fig. 1(a) also shows a radially symmetric electric field distribution, produced by an -beam with Gaussian transverse profile. Two counter-propagating laser beams, perpendicular to the -beam, are used to excite Rb atoms to the 58D Rydberg state. Electric field lifts the degeneracy of this state, producing quadratic dc-Stark shifts for each of the sublevels, as shown in Fig. 1(b). Approximate shifts to the Rydberg sublevels are described by:
| (1) |
Where is Planck’s constant, is the scalar polarizability of the different sublevels of the Rydberg state and is the magnitude of the electric field [20, 31, 14, 11]. A more accurate description of these shifts are interpolated from a numerically solved Stark map generated by the Alkali Rydberg calculator (ARC) [32].
The effect of dc Stark shifts on EIT resonance at different points along the laser beam is monitored using a CCD camera. The camera captures the probe laser fluorescence in the Rb chamber Fig. 1(c). For these measurements we need to capture the variation in 5P3/2 state population as a function of the coupling laser frequency at each point along the laser beams. To do that the camera collects images at a fixed frame rate with 60 ms exposure time for 600 frames while the coupling laser sweeps across the 58D Rydberg state at a rate of 300 s. This way we are able to record fluorescence spectrum for each image pixel, providing localized information of electric field. We used the known frequency separation of the 58D5/2 and 58D3/2 Rydberg states [32] to calibrate the frequency axis. For these measurements both laser fields were collimated to similar beam size [0.33 mm full width at half maximum (FWHM)]. The 780 nm probe laser has power 5 W, and the maximum power of the 480 nm coupling laser is 70 mW. We used a 50 mm lens to image the plane of the laser fluorescence in the Rb chamber into the camera. An IR filter in front of the lens eliminated background light and increased the for the probe laser fluorescence. The scaling of this imaging system was calibrated using a ruler.
A more detailed view of the experimental arrangements in Fig. 1(d) shows the location of grounded copper gaskets whose role is to attenuate possible electric charge buildup the chamber windows from scattered electrons or photoelectrons produced by the blue laser [27, 31]. The -beam has an energy of 20 keV and variable current from 0 - 40 A that is monitored on a Faraday cup. Unfortunately, our apparatus lacks the ability to verify the electron beam current at the location of the laser beam.
However, we can obtain in situ information about the -beam position and size in the Rb chamber by measuring beam impact fluorescence (IF) – the incoherent electron impact-induced fluorescence in Rb [22, 1, 33]. In this case all the lasers are blocked, and the Rb fluorescence caused solely by the -beam is recorded with a 10 s exposure time using the same imaging system. IF offers a secondary in situ measurement of the -beam position and size to compare with the Rydberg measurements.
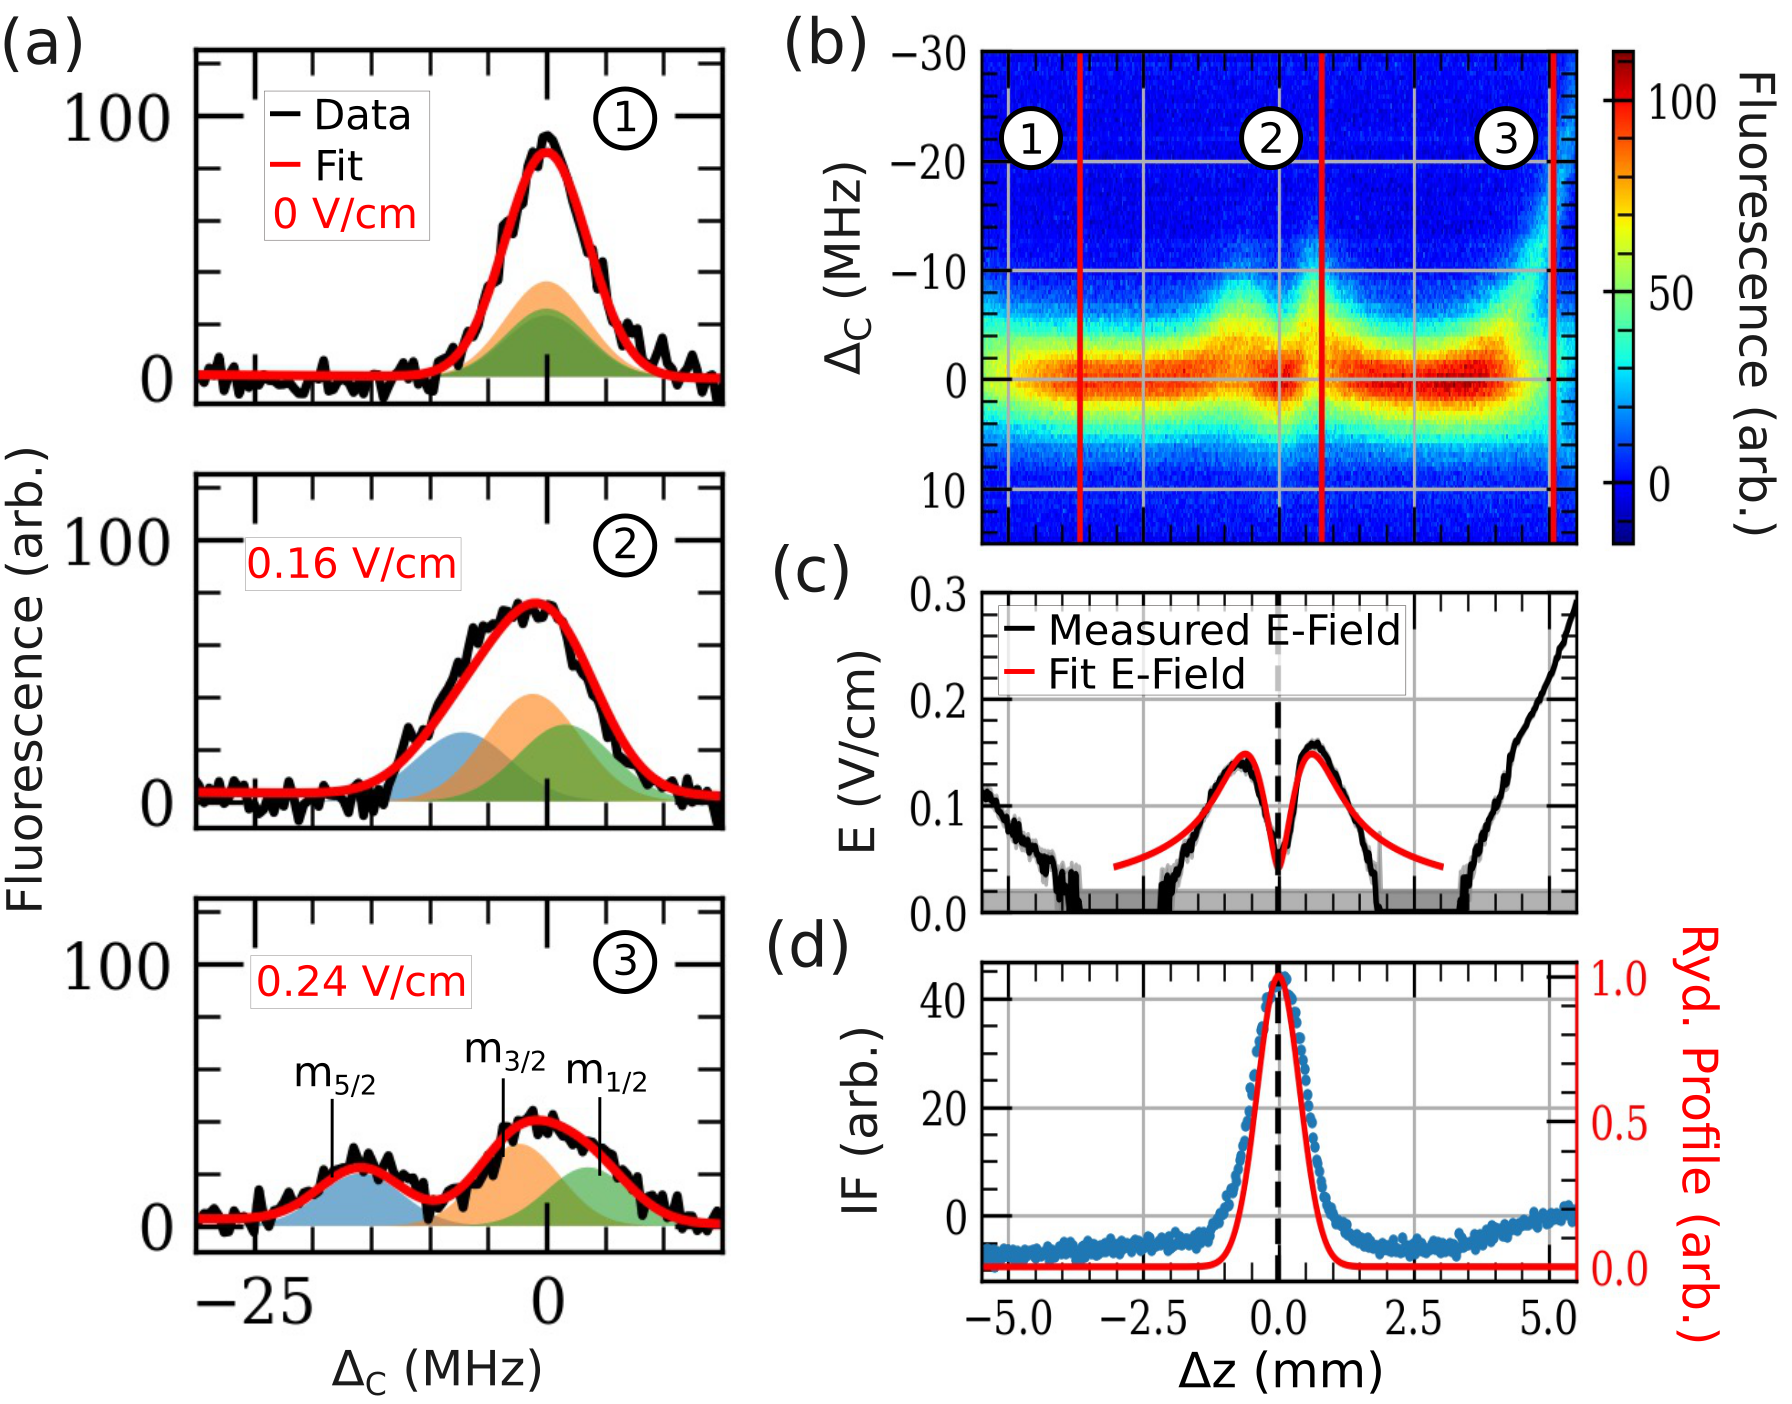
Fig. 2 shows an example of recorded fluorescence spectra and resulting -beam profile analysis. Fig. 2(a) shows three samples of the EIT fluorescence spectra for different positions along the laser beam path [Fig. 2(b)]: (1) at the region of minimal electric field; (2) at the edge of the -beam where its electric field is the highest; (3) near the surface of the copper gasket where residual charging produces relatively strong electric field. To extract the value of the electric field in each point, we follow the procedure similar to the previously published work [20, 31], where the total EIT fluorescence spectra is modeled as a combination of three resonances:
| (2) |
Here, are amplitudes for each level of the Rydberg state empirically set and constant for all fits, is the coupling laser frequency detuning, is the linewidth of the EIT resonance set constant for all fits, and is the frequency shift of the Rydberg energy level described by the Stark map from ARC [20, 31, 32]. In this fit, the only free parameters are the total amplitude of the EIT profile, , and the value of electric field magnitude, .
The reconstructed electric field distribution is shown in Fig. 2 (c). In the center, one can clearly see the characteristic two-lobed feature, expected when the laser beams go through the center of the -beam, as shown in Fig.1(a). The position and width of this feature matches well with the IF signal, shown in Fig. 2(d). The background electric field near the edges is not directly related to the -beam, but caused by residual charging of the cell windows and walls. Our ability to measure small values of electric fields is limited by our ability to resolve small relative shifts of the three EIT peaks. We can estimate the minimum detectable shift to be , where is the signal to noise ratio, and is the number of data points in the resonance [34, 35]. For our current experiment, this minimum shift is MHz corresponding to an minimum electric field of V/cm.
To extract the -beam parameters, we fit the reconstructed curve with an analytical expression for the electric field produced by an electron beam with a uniform Gaussian distribution:
| (3) |
Here is the half-width at half maximum of the -beam, is the permittivity of free space, is the radial position away from the -beam center, and is its displacement along the -direction, is the -beam current, and is the speed of the electron, proportional to the square root of the beam energy. The fit also accounts for the finite width of the laser beam and the -deflection from center of the -beam. The free parameters in this fit are the -beam width , -beam current , and the and -displacement of the electron and laser beams respectively.
The reconstructed -beam cross section is plotted on top of the IF measurement in Fig. 2 (d), showing excellent agreement between the two measurement methods. The -beam width is measured to be 1.07 0.06 mm with IF method and 1.1 0.1 mm with Rydberg electric field reconstruction method. The value of the width is measured from repeated measurements with a fixed Faraday cup current of 35 A.
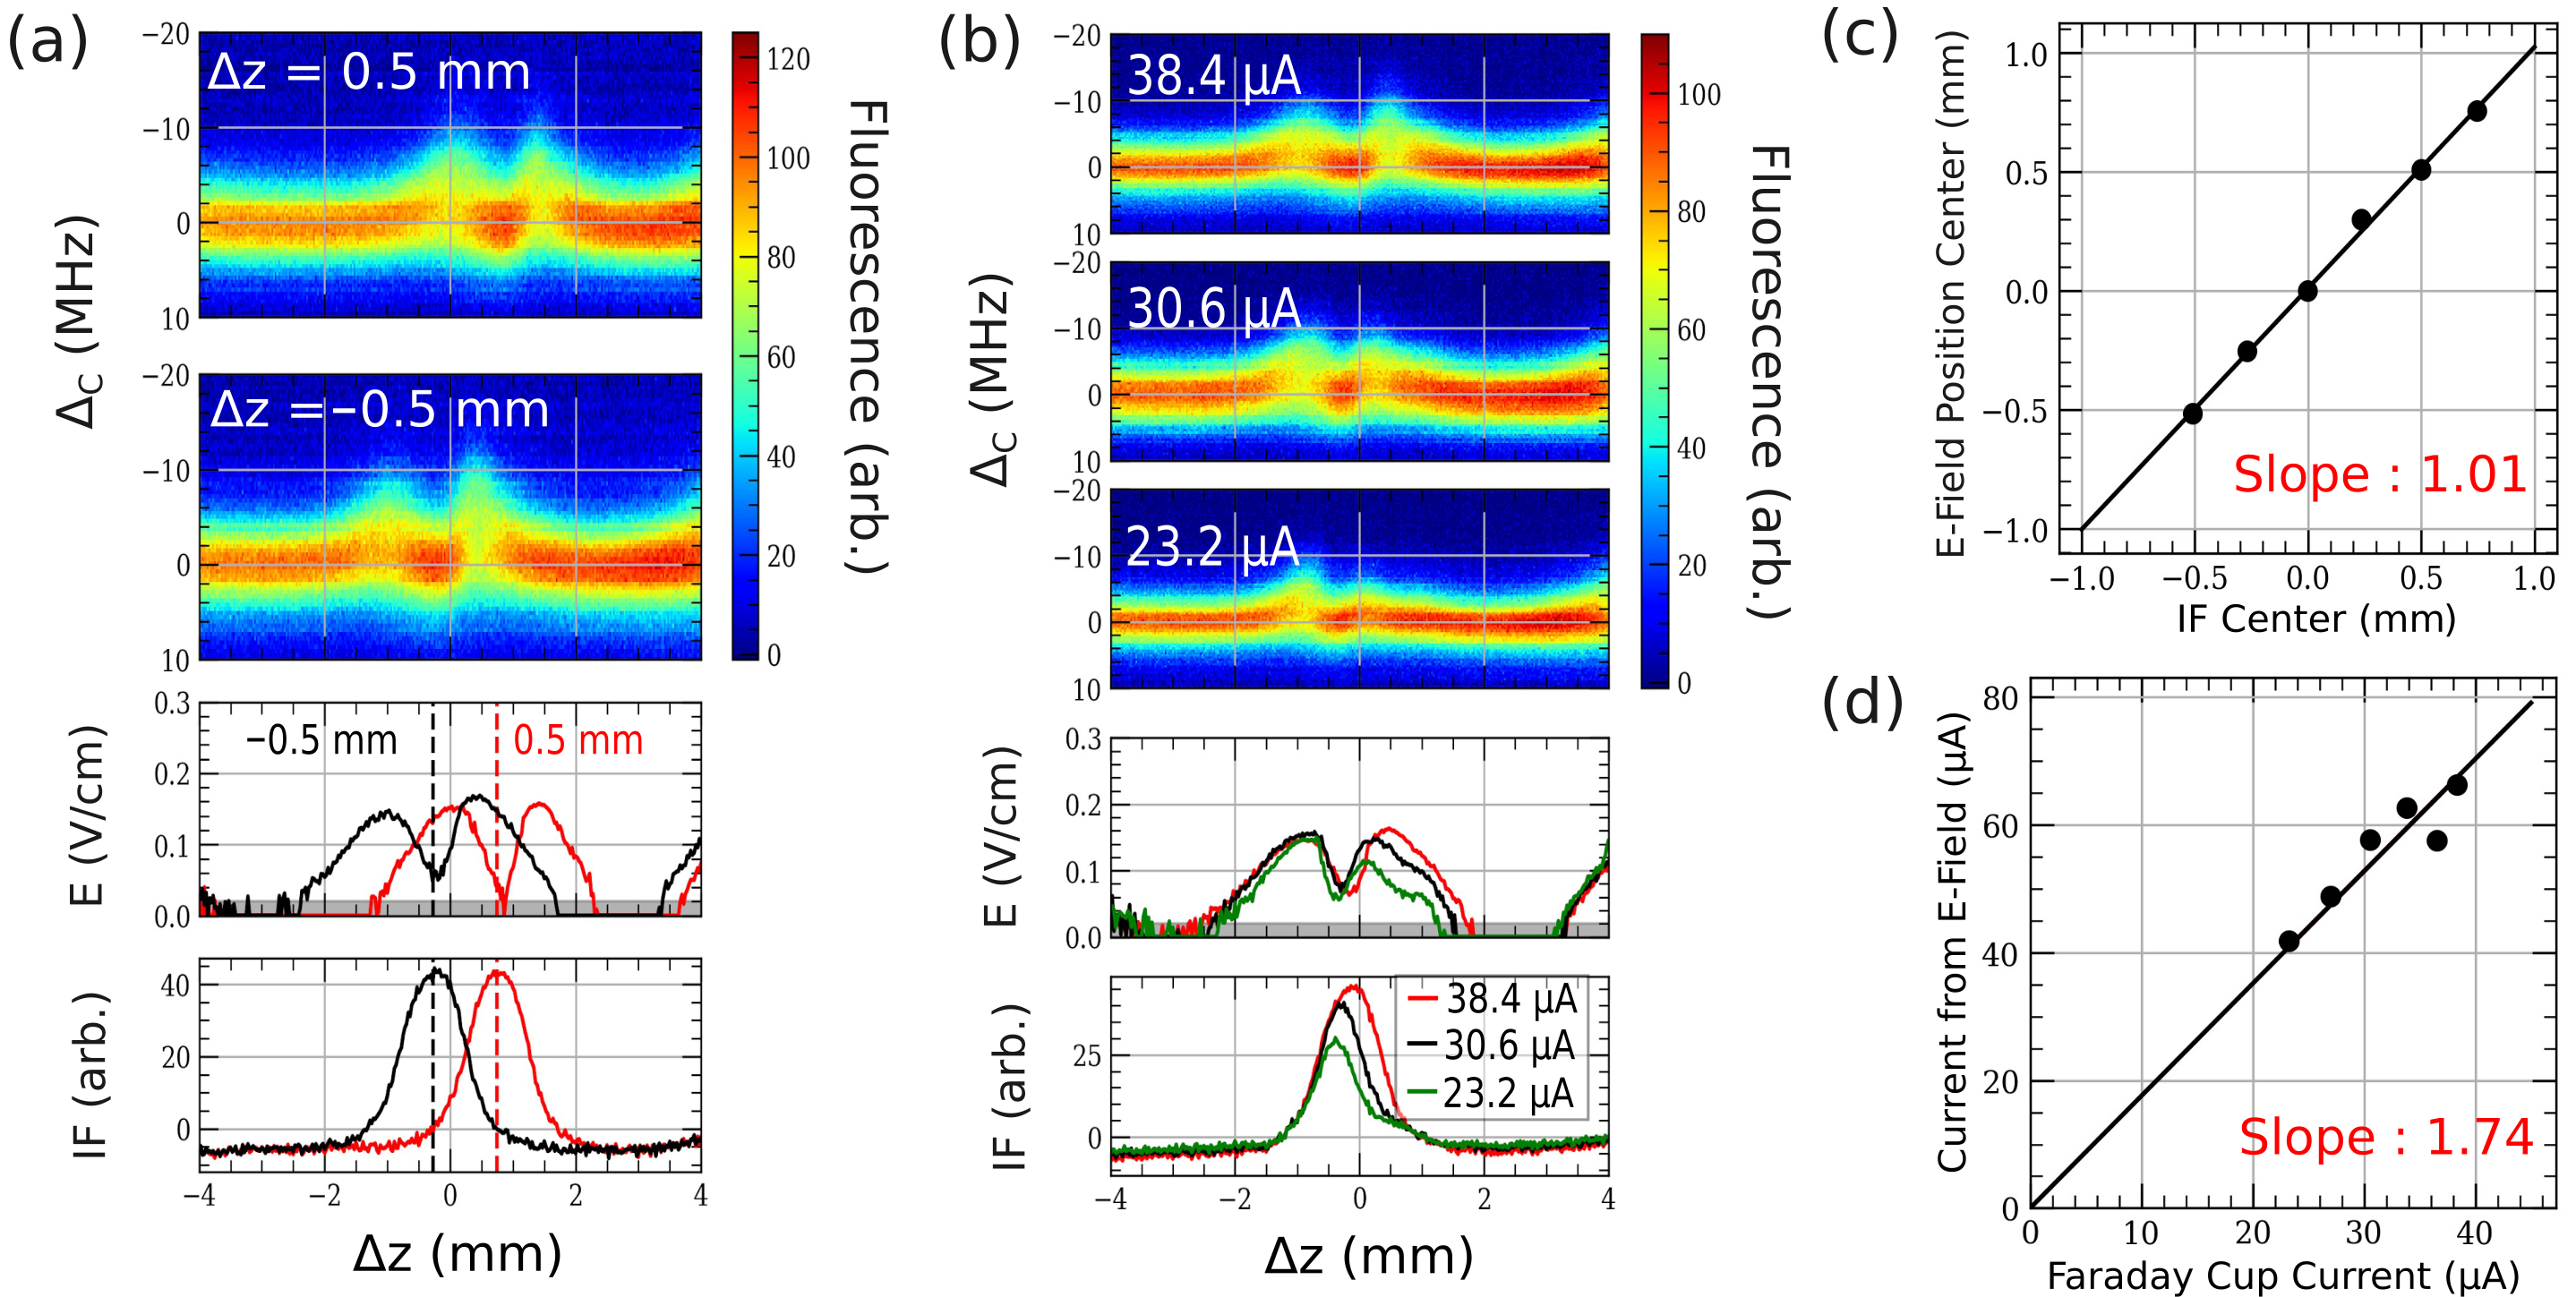
Further diagnostics of the -beam position and current are shown in Fig. 3. For these measurements we either moved the -beam [Fig. 3(a)] or changed its current [Fig. 3 (b)] and tracked the variations in the reconstructed electric field distribution. We see the anticipated variation in the fluorescence spectra. For example, if the beam position changes, the two lobes shift by the corresponding amount. To verify the accuracy of our method, we fit the reconstructed electric field with a functional form, as described above. Fig. 3(c) shows excellent agreement between the reconstructed beam position with that measured using IF method. The shown uncertainties for the Rydberg EIT methods are from the error of the fit parameters, and the centroid position is known within 8 m.
Changing the emission current seems to also slightly deform and shift the -beam due to electron repulsion or focusing effects that we see in both electric field reconstruction [Fig. 3(b)] and IF measurements. Both profiles show an asymmetry that may be due to the background field present within the Rb chamber visible near the edges. Fig. 3(d) shows clear linear correlation between the recorded Faraday cup current and the current values reconstructed from the electric field. The reconstructed current values are about twice larger than the measured Faraday cup current, possibly due to the -beam clipping somewhere in the beamline before the Faraday cup. Further verification will require accurate in situ -beam current measurements using, e.g., a co-located harp scanner. Since our current approach is only sensitive to the absolute value of the electric field, our current fit model does not take into account the direction of the electric field, and its influence on the shifts of the different levels of the Rydberg state. In addition, presence of the background electric field can produce additional systematic error in beam reconstruction due to its unknown direction. More accurate current measurements may require improvement of the Rb vapor chamber design to further reduce the parasitic charging.
In conclusion, we apply Rydberg fluorescence-based detection to measure spatially varying dc electric fields produced by an -beam and to reconstruct the center-of-mass beam position to within 8 m, determine the beam width to within 100 m, and measure the beam current in a simultaneous measurement. We expect this technique to be useful for diagnostics of charged particle beams of any energy, and for diagnostics of charged particle in general, such as low-density plasmas [36]. Further diagnostics such as full beam cross-sectional profiling can be achieved if a sheet of light is used [20], and the speed can be improved using faster camera.
I Acknowledgments
The authors thank Saeed Pegahan and Ziqi Niu for help with experiments, and Chris Holloway’s group at NIST for enlightening conversations.
This work is supported by U.S. DOE Contract DE-SC0024621 and DE-AC05-06OR23177, NSF award 2326736 and Jefferson Lab LDRD program.
References
- Salehilashkajani et al. [2022] A. Salehilashkajani, H. D. Zhang, M. Ady, N. Chritin, P. Forck, J. Glutting, O. R. Jones, R. Kersevan, N. Kumar, T. Lefevre, T. Marriott-Dodington, S. Mazzoni, I. Papazoglou, A. Rossi, G. Schneider, O. Sedlacek, S. Udrea, R. Veness, and C. P. Welsch, A gas curtain beam profile monitor using beam induced fluorescence for high intensity charged particle beams, Applied Physics Letters 120, 174101 (2022), https://pubs.aip.org/aip/apl/article-pdf/doi/10.1063/5.0085491/16480328/174101_1_online.pdf .
- Sandoval et al. [1994] D. P. Sandoval, R. C. Garcia, J. D. Gilpatrick, M. A. Shinas, R. Wright, V. Yuan, and M. E. Zander, Fluorescence-based video profile beam diagnostics: Theory and experience, AIP Conf. Proc. 319, 273 (1994).
- Hofmann [1981] A. Hofmann, Electron and proton beam diagnostics with synchrotron radiation, IEEE Transactions on Nuclear Science 28, 2131 (1981).
- Rule [1987] D. Rule, Transition radiation diagnostics for intense charged particle beams, Nuclear Instruments and Methods in Physics Research Section B: Beam Interactions with Materials and Atoms 24-25, 901 (1987).
- Ponce et al. [2004] L. Ponce, R. Jung, and F. Meot, LHC proton beam diagnostics using synchrotron radiation, Tech. Rep. (2004).
- Chouffani et al. [2006] K. Chouffani, F. Harmon, D. Wells, J. Jones, and G. Lancaster, Laser-compton scattering as a tool for electron beam diagnostics, Laser and Particle Beams 24, 411 (2006).
- Blair [2008] G. Blair, Laser based beam diagnostics, EUROTeV-Report-2008-027 (2008).
- Tzoganis et al. [2017] V. Tzoganis, H. D. Zhang, A. Jeff, and C. P. Welsch, Design and first operation of a supersonic gas jet based beam profile monitor, Phys. Rev. Accel. Beams 20, 062801 (2017).
- Castro Sequeiro et al. [2024] C. Castro Sequeiro, M. Ady, G. Bregliozzi, N. Chatzigeorgiou, A. R. Churchman, R. Kersevan, T. Lefevre, S. Mazzoni, G. Pigny, A. Rossi, M. Sameed, G. Schneider, O. Sedlacek, K. Sidorowski, C. Vazquez Pelaez, R. Veness, L. Zygaropoulos, O. Stringer, A. Webber-Date, C. P. Welsch, H. Zhang, P. Forck, and S. Udrea, Beam gas curtain monitor: Vacuum studies for lhc integration and operation, Phys. Rev. Accel. Beams 27, 043201 (2024).
- Gallagher [1994] T. F. Gallagher, Rydberg Atoms, Cambridge Monographs on Atomic, Molecular and Chemical Physics (Cambridge University Press, 1994).
- Schlossberger et al. [2024a] N. Schlossberger, N. Prajapati, S. Berweger, A. P. Rotunno, A. B. Artusio-Glimpse, M. T. Simons, A. A. Sheikh, E. B. Norrgard, S. P. Eckel, and C. L. Holloway, Rydberg states of alkali atoms in atomic vapour as si-traceable field probes and communications receivers, Nature Reviews Physics 6, 606 (2024a).
- Simons et al. [2021] M. T. Simons, A. B. Artusio-Glimpse, A. K. Robinson, N. Prajapati, and C. L. Holloway, Rydberg atom-based sensors for radio-frequency electric field metrology, sensing, and communications, Measurement: Sensors 18, 100273 (2021).
- Fancher et al. [2021] C. T. Fancher, D. R. Scherer, M. C. S. John, and B. L. S. Marlow, Rydberg atom electric field sensors for communications and sensing, IEEE Transactions on Quantum Engineering 2, 1 (2021).
- Holloway et al. [2017] C. L. Holloway, M. T. Simons, J. A. Gordon, A. Dienstfrey, D. A. Anderson, and G. Raithel, Electric field metrology for si traceability: Systematic measurement uncertainties in electromagnetically induced transparency in atomic vapor, Journal of Applied Physics 121, 233106 (2017).
- Elgee et al. [2023] P. K. Elgee, J. C. Hill, K.-J. E. LeBlanc, G. D. Ko, P. D. Kunz, D. H. Meyer, and K. C. Cox, Satellite radio detection via dual-microwave rydberg spectroscopy, Applied Physics Letters 123, 084001 (2023).
- Simons et al. [2018] M. T. Simons, J. A. Gordon, and C. L. Holloway, Fiber-coupled vapor cell for a portable rydberg atom-based radio frequency electric field sensor, Appl. Opt. 57, 6456 (2018).
- Downes et al. [2023] L. A. Downes, L. Torralbo-Campo, and K. J. Weatherill, A practical guide to terahertz imaging using thermal atomic vapour, New Journal of Physics 25, 035002 (2023).
- Downes et al. [2020] L. A. Downes, A. R. MacKellar, D. J. Whiting, C. Bourgenot, C. S. Adams, and K. J. Weatherill, Full-field terahertz imaging at kilohertz frame rates using atomic vapor, Phys. Rev. X 10, 011027 (2020).
- Schlossberger et al. [2024b] N. Schlossberger, A. P. Rotunno, A. B. Artusio-Glimpse, N. Prajapati, S. Berweger, D. Shylla, M. T. Simons, and C. L. Holloway, Zeeman-resolved autler-townes splitting in rydberg atoms with tunable resonances and a single transition dipole moment, Phys. Rev. A 109, L021702 (2024b).
- Schlossberger et al. [2024c] N. Schlossberger, T. McDonald, K. Su, R. Talashila, R. Behary, C. L. Patrick, D. Hammerland, E. E. Mikhailov, S. Aubin, I. Novikova, C. L. Holloway, and N. Prajapati, Two-dimensional imaging of electromagnetic fields via light sheet fluorescence imaging with rydberg atoms (2024c), arXiv:2412.12568 [physics.atom-ph] .
- Schlossberger et al. [2025] N. Schlossberger, A. P. Rotunno, S. P. Eckel, E. B. Norrgard, D. Manchaiah, N. Prajapati, A. B. Artusio-Glimpse, S. Berweger, M. T. Simons, D. Shylla, W. J. Watterson, C. Patrick, A. Meraki, R. Talashila, A. Younes, D. S. La Mantia, and C. L. Holloway, Primary quantum thermometry of mm-wave blackbody radiation via induced state transfer in rydberg states of cold atoms, Phys. Rev. Res. 7, L012020 (2025).
- DeStefano et al. [2024] N. DeStefano, S. Pegahan, A. Ramaswamy, S. Aubin, T. Averett, A. Camsonne, S. Malinovskaya, E. E. Mikhailov, G. Park, S. Zhang, and I. Novikova, Electron beam characterization via quantum coherent optical magnetometry, Applied Physics Letters 125, 264001 (2024).
- Scully and Zubairy [2001] M. O. Scully and M. S. Zubairy, Quantum Optics (Cambridge University Press, 2001).
- Finkelstein et al. [2023] R. Finkelstein, S. Bali, O. Firstenberg, and I. Novikova, A practical guide to electromagnetically induced transparency in atomic vapor, New Journal of Physics 25, 035001 (2023).
- Keaveney et al. [2014] J. Keaveney, A. Sargsyan, D. Sarkisyan, A. Papoyan, and C. S. Adams, Active narrowband filtering, line narrowing and gain using ladder electromagnetically induced transparency in an optically thick atomic vapour, Journal of Physics B: Atomic, Molecular and Optical Physics 47, 075002 (2014).
- Ma [2021] L. Ma, Electromagnetic Field Sensing with Rydberg Atoms in Vapor Cells, Ph.D. thesis, University of Michigan (2021).
- Ma et al. [2020] L. Ma, E. Paradis, and G. Raithel, Dc electric fields in electrode-free glass vapor cell by photoillumination, Opt. Express 28, 3676 (2020).
- Jau and Carter [2020] Y.-Y. Jau and T. Carter, Vapor-cell-based atomic electrometry for detection frequencies below 1 khz, Phys. Rev. Appl. 13, 054034 (2020).
- Su et al. [2025] K. Su, R. Behary, S. Aubin, E. E. Mikhailov, and I. Novikova, Two-photon rydberg eit resonances in non-collinear beam configurations, J. Opt. Soc. Am. B 42, 757 (2025).
- Weichman [2024] P. B. Weichman, Doppler sensitivity and resonant tuning of rydberg atom-based antennas, Journal of Physics B: Atomic, Molecular and Optical Physics 57, 165501 (2024).
- Patrick et al. [2025] L. Patrick, N. Schlossberger, D. F. Hammerland, N. Prajapati, T. McDonald, S. Berweger, R. Talashila, A. B. Artusio-Glimpse, and C. L. Holloway, Imaging of induced surface charge distribution effects in glass vapor cells used for rydberg atom-based sensors (2025), arXiv:2502.07018 [physics.atom-ph] .
- Šibalić et al. [2017] N. Šibalić, J. Pritchard, C. Adams, and K. Weatherill, Arc: An open-source library for calculating properties of alkali rydberg atoms, Computer Physics Communications 220, 319 (2017).
- Ugoletti et al. [2025] M. Ugoletti, C. Ballage, T. Minea, G. Serianni, O. Vasilovici, and M. Agostini, Visible cameras as a tool to study electron beam shape, Review of Scientific Instruments 96, 023705 (2025), https://pubs.aip.org/aip/rsi/article-pdf/doi/10.1063/5.0243793/20380771/023705_1_5.0243793.pdf .
- Wsb [1991] Wsb, Fourier transforms in nmr, optical, and mass spectrometry, a user’s handbook: Alan g. marshall and francis r. verdun.elsevier, amsterdam and new york, 1990. 450 pages. paperback, $49.95. isbn 0444874127, Journal of Magnetic Resonance 93 (1991).
- Mikhailov et al. [2009] E. E. Mikhailov, I. Novikova, M. D. Havey, and F. A. Narducci, Magnetic field imaging with atomic rb vapor, Opt. Lett. 34, 3529 (2009).
- Mordjick et al. [2024] S. Mordjick, I. Novikova, E. Mikhailov, and S. Aubin, Optical quantum sensing diagnostic development for non-invasive measurements of electric and magnetic fields in plasmas (2024), dOE BRN Workshop on Measurement Innovation, Washington, D.C., Jan. 9, 2024.