Accelerated State Expansion of a Nanoparticle in a Dark Inverted Potential
Abstract
While the wave packet of a massive particle grows linearly under free dynamics, it grows exponentially in an inverted harmonic potential, offering a pathway to rapidly increase quantum fluctuations to macroscopic dimensions. In this work, we experimentally demonstrate this principle by expanding the center-of-mass thermal state of a silica nanoparticle to a position uncertainty of within . This expansion, achieved using an inverted dark potential to minimize decoherence from photon recoil, represents a 952-fold increase, reaching a scale comparable to the nanoparticle’s physical size. This work represents a key advancement toward preparing macroscopic quantum superpositions at unprecedented mass and length scales.
Quantum mechanics predicts that a massive particle cannot exist in a motional state exhibiting no uncertainty in phase-space, even at zero temperature. Specifically, the Heisenberg principle states that due to the non-commutation of a pair of canonically conjugated variables, such as position and momentum, the product of their standard deviations is bounded from below by [1]. These Heisenberg-limited states can be prepared by reducing the entropy of their motional state, namely, through cooling. This has been experimentally achieved with massive objects confined in harmonic potentials, including a single ion [2, 3, 4], a nanoparticle containing billions of atoms [5, 6, 7, 8, 9, 10], and various micromechanical resonators [11, 12, 13, 14, 15], with some resonators having masses as large as atomic mass units [16]. In harmonic potentials of frequency , the position standard deviation of these Heisenberg-limited states is on the order of the so-called zero-point motion , where is the mass of the object. Consequently, the more massive the object, the smaller the position uncertainty for these Heisenberg-limited states prepared in a harmonic potential. Thus, it appears that the more massive an object is, the more microscopic its quantum effects become.
However, quantum mechanics allows, in principle, the amplification of quantum fluctuations by increasing the standard deviation of one canonical variable while reducing the conjugate one, such that their product remains close to . These motionally squeezed states can exhibit position uncertainties much larger than , potentially extending beyond the size of the particle like in matter-wave experiments [17, 18, 19, 20]. Such macroscopic quantum states of massive objects become extremely sensitive to external signals and decoherence, and can be used to test quantum mechanics in regimes where collapse models predict the breakdown of the superposition principle [21, 22]. Additionally, they can be transformed into non-Gaussian states exhibiting negativities in their Wigner function [23, 24]. In clamped oscillators, where the tight harmonic potential is fixed, moderate motional squeezing up to [25] was reported. Recently, the possibility of quenching the harmonic potential of a levitated nanoparticle and exploiting motional dynamics in the absence of laser light – which would generate decoherence due to photon scattering – has been proposed as a promising platform for achieving unprecedented levels of motional squeezing [26, 27, 28]. A particularly promising method involves using a dark (non-optical) inverted harmonic potential since, in this case, the generation of motional squeezing is exponential in time [26, 29, 30]. This stands in stark contrast to the linear regime induced by dynamics in shallower harmonic potentials or even free dynamics. Exponentially fast expansion of states is relevant to overcome challenges imposed by decoherence and stability, both affecting the dynamics during the protocol as well as the uncertainties between experimental runs [26, 27].
In recent years, experiments aiming at the ambitious goal of preparing macroscopic quantum superposition states of nanoparticles have been proposed [21, 31, 32, 33, 29, 26, 27, 28]. The often required ground-state cooling of an optically levitated nanoparticle was achieved using either an optical cavity [5, 10, 34, 35] or active feedback [7, 6, 9, 36]. Furthermore, motional state expansion, linear in time, were reported using either shallower optical potential or free dynamics, starting from both the ground state [37, 38] and thermal state [39, 40] of a nanoparticle. However, squeezing protocols that utilize optical means are limited by decoherence induced by photon scattering [41, 42, 43]. Recently, hybrid schemes have been reported in the classical regime [44, 45, 46], where an optically levitated nanoparticle is released into a shallower harmonic electrical potential [47]. In this article, we report a significant progress: the controlled release of an optically trapped and cooled nanoparticle into an inverted dark potential, resulting in an exponentially fast expansion of its motional state [30]. This is achieved using a hybrid electro-optical platform that integrates state-of-the-art motion detection and cooling to low phonon occupations with engineered on-chip electrostatic [48] and radio-frequency (RF) potentials. Our approach enables rapid squeezing protocols while effectively suppressing photon recoil heating.
More specifically, we study the expansion of a nanoparticle’s state in a dark, inverted, and electrostatic potential parametrized by the frequency . The levitated nanoparticle is released from a tighter optical harmonic trap at the center of the inverted potential, leading to an exponentially accelerated state expansion [30, 26, 49]. Throughout the entire protocol described here, the particle occupies a Gaussian state that is fully described by the mean, variances and covariance of the position and momentum quadratures. Initially, the particle occupies the symmetric phase-space of a thermal Gaussian state with an average phonon occupation of the center-of-mass motion (CoM) given by the Boltzmann distribution , before the state expands in phase-space following the inverted harmonic potential, as depicted in Fig. 1a-b. In the zeroth order secular approximation [50] neglecting micromotion and damping, the position variance follows [51]
| (1) | |||||
where the first term describes the coherent dynamics and the second term the incoherent dynamics. The parameter corresponds to the displacement noise and links to the heating rate , which is here dominated by the residual gas and electric field noise (see Supplemental Material Section IX). The expansion coefficient after the release time is defined as the ratio of the initial and final delocalization length . Note that our setup allows us to compare the frequency jump protocol [52, 51, 46] simultaneously in the transversal directions.
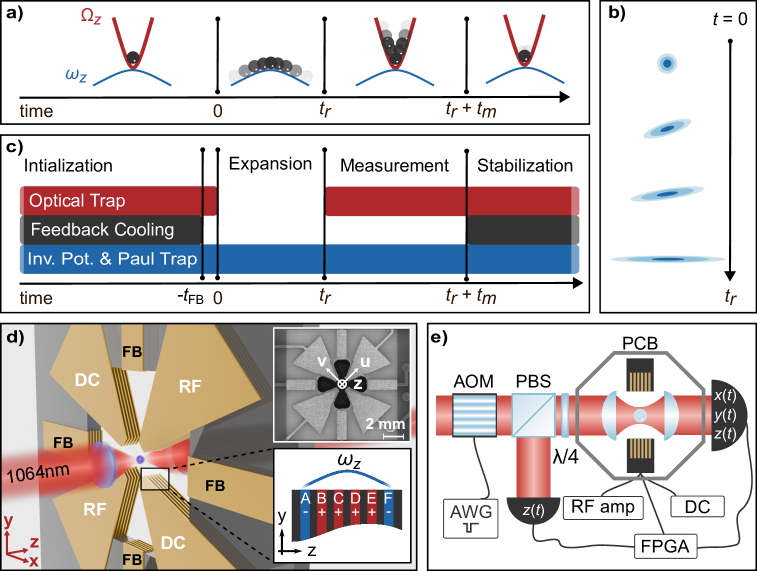
We consider a charged, spherical silica (SiO2) nanoparticle of mass corresponding to a radius that is trapped by an optical tweezer, leading to a 3D harmonic potential with mechanical eigenfrequencies kHz. The optical trap is interfaced to a 6-layer printed circuit board (PCB), as shown in Fig. 1d-e, which integrates a Paul trap [53, 54, 55, 56] for dark confinement (RF) with segmented virtual ground electrodes (DC) and electrodes for cold damping (FB) [57, 58, 59, 48, 60]. The individual PCB layers along the optical propagation axis allow for the generation of an electrostatic, inverted harmonic potential at the center of the PCB by applying tailored DC voltages to each layers (see lower inset in Fig. 1d). From an independent measurement, the inverted harmonic potential of along the optical axis is characterized for a positively charged particle with elementary charges (see Supplemental Material Section II). The secular frequencies in the Paul trap plane are where the -plane is rotated by with respect to the -plane [46]. Deviations from are due to fabrication inaccuracies (see top inset in Fig. 1d and Supplemental Material Section I).
The particle’s CoM motion is detected in forward balanced split detection in [61] and in backward homodyne detection for [7]. The latter is used for feedback and data acquisition in the inverted potential. We initialize the CoM state by applying 3D active feedback with cold damping which reduces the phonon occupation to phonons, at pressure mbar. Motional cooling enables to decouple the CoM modes of the particle, such that we can treat their dynamics independently. Here we primarily focus on the inverted dynamics along the -axis.
The experimental protocol is illustrated in Fig. 1c. The pre-cooled nanoparticle is positioned at at the center of the Paul trap by aligning the primary optical trap to minimize micromotion. The initial motional state sizes are . Following the deactivation of the electrical feedback, the particle is released from the optical trap at a fixed phase of the applied RF Paul trap voltage . The particle then evolves in the dark electrical potential for a duration before being recaptured in the optical trap. Once recaptured, the particle’s position is measured for before the feedback is reactivated to reinitialize the state. This sequence is repeated 400 times for each release duration . Throughout the entire protocol, both the Paul trap and the inverted potential remain active. To compensate for time-dependent position shifts caused by micromotion and electrical stray fields, electrical compensation fields are individually adjusted for each release time using the feedback electrodes. The particle’s position and velocity at are extracted using a lock-in detection method (see Supplemental Material Section III). Note that the position standard variation increases during the measurement due to heating sources by , corresponding to phonons related to the initial thermal state with ( see Supplemental Material Section VI and IX). This effect overestimates the measured state , which we add to the error bar in Fig. 3. However, the contribution of to the position uncertainty, overestimating , is only significant for small states ().
Results
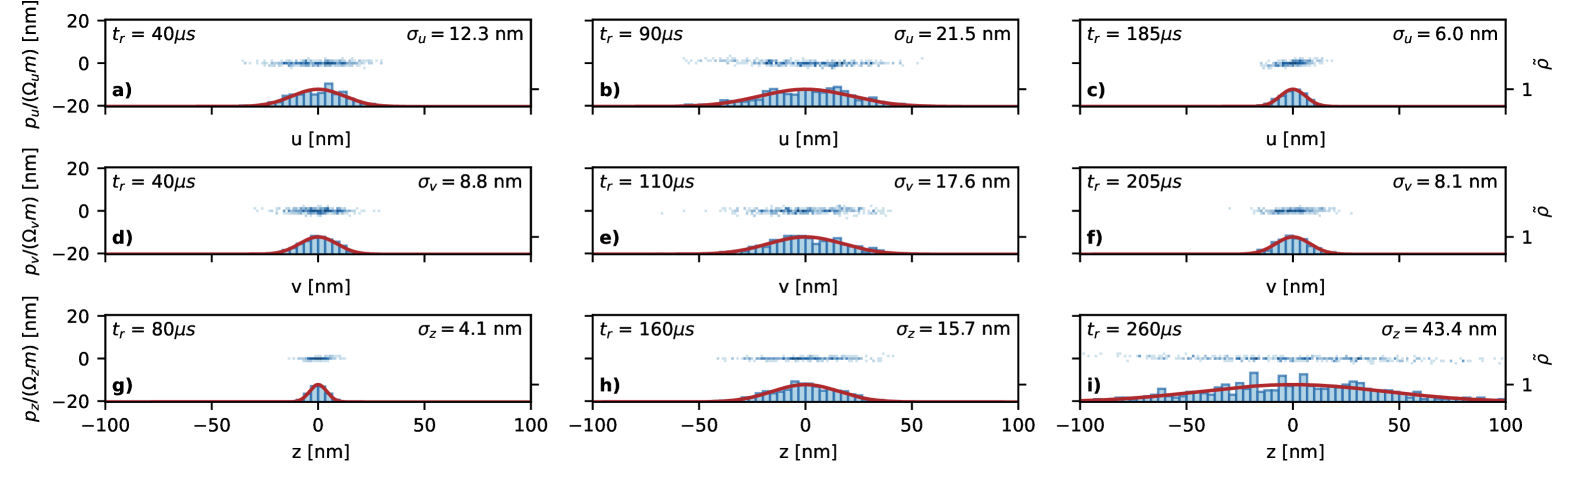
Our experimental setup enables a direct comparison between the dynamics in an inverted potential along () and the dynamics induced by the frequency jump protocol along ()[26, 47, 37, 39, 52]. In Fig. 2 we plot the phase-space distribution for at different release times where the phase-space angle due to experimental delays is adjusted in post-processing (see Supplemental Material Section III). The phase-space distributions are represented as 2D histograms constructed from 400 repetitions of the experimental protocol. For each , the 1D histogram in the inset shows the projection on the position axis. These are overlaid with a normalized Gaussian curve with the extracted standard deviation , visually confirming the Gaussian distribution of the data. In Fig. 2a-f, we observe the expansion of the initial state, followed by recompression along and . In contrast, we observe an ever-growing expansion along the inverted potential in the -direction as can be seen in Fig. 2g-i. Note that only the major axis of the phase-space distribution can be resolved reliably, unlike the minor axis due to heating effects during the measurement and insufficient accuracy in the phase-space angle (see Supplementary Section III and IX) .
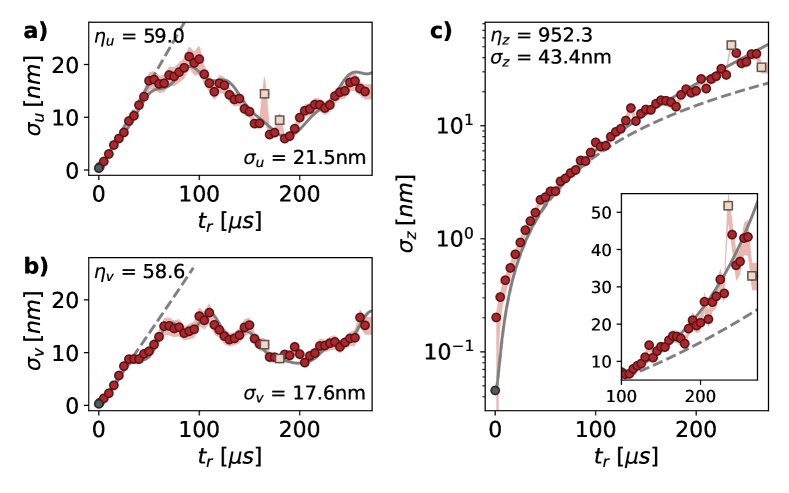
In Fig. 3 we depict the position standard deviation of the phase-space distribution in dependence of the release time along . The shaded error bars represent the standard deviation of the position uncertainties and the measurement contribution to associated with overestimating the state size. For the frequency jump protocol along in Fig. 3a-b, we observe a maximum expansion at followed by a recompression at where as predicted by the theory (see Supplemental Material Section VII). The micromotion due to the Paul trap confinement leads to additional smaller amplitude oscillations dictated by the Paul trap frequency (see Supplemental Material Section VIII). In Fig. 3c we observe the exponentially accelerated state expansion along the inverted potential. The micromotion plays only a negligible role in the inverted potential. The solid line is a fit to the theory (Eq. 1 for and Eq. 46 in the Supplemental Material Section VIII for ) with and as fit parameters (see Tab. 1 in the Supplemental Material). The decoherence rate is only considered in the zeroth-order secular motion (second term Eq. 1), since higher order terms turned out to be negligible. For comparison, Fig 3 displays the state expansion in free dynamics in (dashed line) following
| (2) |
where is the heating rate accounting for the expansion due to heating. From Fig. 3, we observe that the free-expansion, the frequency jump and the inverted protocol follow the same dynamics for small release times . Nevertheless, the expansion in and is bound by the Paul trap confinement to the ratio , neglecting the micromotion. In contrast, free expansion is unbound but slower than the dynamics in the inverted potential for large .
The standard deviation of the state reaches a maximum at , corresponding to a state size comparable to the particle’s radius and an exponentially fast expansion ratio . The final state size, only limited by our linear detection range, beats the free expansion and would continue to grow for longer expansion times, which is the main result of this manuscript.
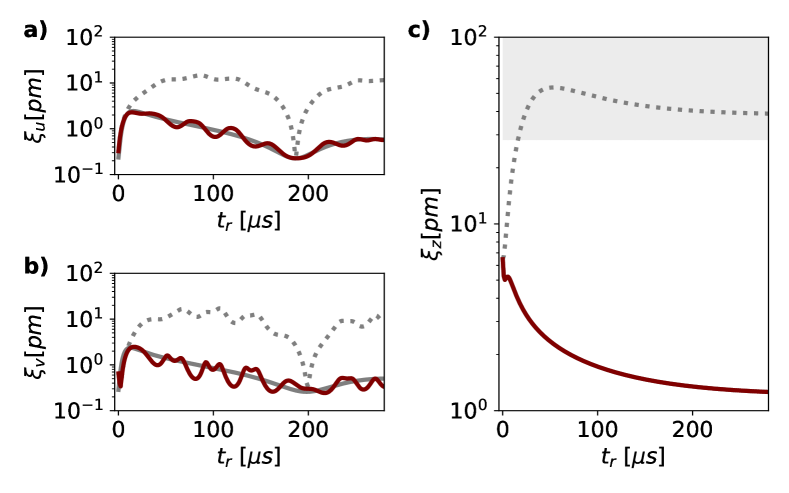
Nonetheless, to reach large quantum states, it is of utmost importance to expand the state coherently. The figure of merit here is the coherence length [21]
| (3) |
with the state purity where is the density matrix, the momentum variance and the covariance of the Gaussian state. For the case of the optical trap, the purity of the initial thermal state is given by . The variances and covariances depend on the very same parameters, namely and (see Supplemental Material VII-VIII). Under the assumption that our micromotion model captures well the dynamics of the system not only for the measured position variance (see Fig. 3) but also for the momentum variance and covariance , we can estimate the coherence length by using the fitting parameters from Fig. 3 (see Tab. 1 in the Supplemental Material). In Fig. 4, we deduce for the current experiment (solid red line) in the presence of a fitted total heating rate of , which stands in reasonable agreement with theoretically predicted values (see Supplemental Material Section IX). Moreover, theory predicts electrical noise to be the largest heating source along , while gas collisions and electric field noise play an equally important role along . Starting from along , we can see an increase of the coherence length for the frequency jump protocol by a factor of . This gain in coherence length is followed by an oscillatory behavior at the secular frequencies combined with a rapid decay due to . Interestingly, smaller oscillations due to micromotion at can also be observed. In contrast, along , pm is larger to begin with due to the higher purity of the initial state . We observe a partial decay down to before stabilizes to a nearly constant value, as the expansion nearly compensates for the heating. Notably, reducing by a factor of , as readily achievable in current experiments [37, 62], would enable much larger coherence lengths displayed by the gray dotted line in Fig. 4.
Summary and Outlook
In summary, we have demonstrated the accelerated expansion of a nanoparticle’s motional state in a dark, inverted harmonic potential. This approach minimizes decoherence due to light scattering and blackbody radiation while enabling faster protocols. Our results highlight the inverted potential as a powerful tool for the generation of large quantum states. We achieve state sizes comparable to the size of the nanoparticle itself, attaining an expansion factor of nearly three orders of magnitude within a few hundred microseconds. This corresponds to a squeezing level of dB for a pure state in the absence of decoherence and correlations between position and momentum.
Furthermore, our method enables the modification of the potential from purely inverted potentials to a double-well configuration [49]. The quartic contribution of the double well introduces nonlinear dynamics, enabling the study of non-Gaussian states. Both inverted and nonharmonic potentials are essential ingredients for generating macroscopic quantum superpositions.
Acknowledgements: This research was supported by the European Research Council (ERC) through grant Q-Xtreme ERC 2020-SyG (grant agreement number 951234). ARC acknowledges funding from the European Union’s Horizon 2020 research and innovation programme under the Marie Skłodowska Curie grant agreement No. [101103589] (DecoXtreme, HORIZON-MSCA-2022-PF-01-01). We acknowledge valuable discussions with the Q-Xtreme synergy consortium.
References
- Heisenberg [1927] W. Heisenberg, Zeitschrift für Physik 43, 172 (1927).
- Diedrich et al. [1989] F. Diedrich, J. Bergquist, W. M. Itano, and D. Wineland, Physical Review Letters 62, 403 (1989).
- Monroe et al. [1995] C. Monroe, D. Meekhof, B. King, S. R. Jefferts, W. M. Itano, D. J. Wineland, and P. Gould, Physical Review Letters 75, 4011 (1995).
- Roos et al. [1999] C. Roos, T. Zeiger, H. Rohde, H. Nägerl, J. Eschner, D. Leibfried, F. Schmidt-Kaler, and R. Blatt, Physical Review Letters 83, 4713 (1999).
- Delić et al. [2020] U. Delić, M. Reisenbauer, K. Dare, D. Grass, V. Vuletić, N. Kiesel, and M. Aspelmeyer, Science 367, 892 (2020).
- Magrini et al. [2021] L. Magrini, P. Rosenzweig, C. Bach, A. Deutschmann-Olek, S. G. Hofer, S. Hong, N. Kiesel, A. Kugi, and M. Aspelmeyer, Nature 595, 373 (2021).
- Tebbenjohanns et al. [2021] F. Tebbenjohanns, M. L. Mattana, M. Rossi, M. Frimmer, and L. Novotny, Nature 595, 378 (2021).
- Ranfagni et al. [2021] A. Ranfagni, P. Vezio, M. Calamai, A. Chowdhury, F. Marino, and F. Marin, Nature Physics 17, 1120 (2021).
- Kamba et al. [2022] M. Kamba, R. Shimizu, and K. Aikawa, Optics Express 30, 26716 (2022).
- Piotrowski et al. [2023] J. Piotrowski, D. Windey, J. Vijayan, C. Gonzalez-Ballestero, A. de los Ríos Sommer, N. Meyer, R. Quidant, O. Romero-Isart, R. Reimann, and L. Novotny, Nature Physics 19, 1009 (2023).
- Aspelmeyer et al. [2014] M. Aspelmeyer, T. J. Kippenberg, and F. Marquardt, Reviews of Modern Physics 86, 1391 (2014).
- O’Connell et al. [2010] A. D. O’Connell, M. Hofheinz, M. Ansmann, R. C. Bialczak, M. Lenander, E. Lucero, M. Neeley, D. Sank, H. Wang, M. Weides, et al., Nature 464, 697 (2010).
- Teufel et al. [2011] J. D. Teufel, T. Donner, D. Li, J. W. Harlow, M. Allman, K. Cicak, A. J. Sirois, J. D. Whittaker, K. W. Lehnert, and R. W. Simmonds, Nature 475, 359 (2011).
- Chan et al. [2011] J. Chan, T. M. Alegre, A. H. Safavi-Naeini, J. T. Hill, A. Krause, S. Gröblacher, M. Aspelmeyer, and O. Painter, Nature 478, 89 (2011).
- Verhagen et al. [2012] E. Verhagen, S. Deléglise, S. Weis, A. Schliesser, and T. J. Kippenberg, Nature 482, 63 (2012).
- Bild et al. [2023] M. Bild, M. Fadel, Y. Yang, U. von Lüpke, P. Martin, A. Bruno, and Y. Chu, Science 380, 274 (2023), publisher: American Association for the Advancement of Science.
- Davisson and Germer [1927] C. Davisson and L. H. Germer, Nature 119, 558 (1927).
- Keith et al. [1988] D. W. Keith, M. L. Schattenburg, H. I. Smith, and D. E. Pritchard, Physical Review Letters 61, 1580 (1988).
- Arndt et al. [1999] M. Arndt, O. Nairz, J. Vos-Andreae, C. Keller, G. van der Zouw, and A. Zeilinger, Nature 401, 680 (1999).
- Arndt and Hornberger [2014] M. Arndt and K. Hornberger, Nature Physics 10, 271 (2014).
- Romero-Isart [2011] O. Romero-Isart, Physical Review A 84, 052121 (2011).
- Bassi et al. [2013] A. Bassi, K. Lochan, S. Satin, T. P. Singh, and H. Ulbricht, Reviews of Modern Physics 85, 471 (2013).
- Rosiek et al. [2024] C. A. Rosiek, M. Rossi, A. Schliesser, and A. S. Sørensen, PRX Quantum 5, 030312 (2024).
- Riera-Campeny et al. [2024] A. Riera-Campeny, M. Roda-Llordes, P. T. Grochowski, and O. Romero-Isart, Quantum 8, 1393 (2024).
- Lei et al. [2016] C. Lei, A. Weinstein, J. Suh, E. Wollman, A. Kronwald, F. Marquardt, A. Clerk, and K. Schwab, Physical Review Letters 117, 100801 (2016).
- Weiss et al. [2021] T. Weiss, M. Roda-Llordes, E. Torrontegui, M. Aspelmeyer, and O. Romero-Isart, Physical Review Letters 127, 023601 (2021).
- Roda-Llordes et al. [2024a] M. Roda-Llordes, A. Riera-Campeny, D. Candoli, P. T. Grochowski, and O. Romero-Isart, Physical Review Letters 132, 023601 (2024a).
- Neumeier et al. [2024] L. Neumeier, M. A. Ciampini, O. Romero-Isart, M. Aspelmeyer, and N. Kiesel, Proceedings of the National Academy of Sciences 121, e2306953121 (2024).
- Pino et al. [2018] H. Pino, J. Prat-Camps, K. Sinha, B. P. Venkatesh, and O. Romero-Isart, Quantum Science and Technology 3, 025001 (2018).
- Romero-Isart [2017] O. Romero-Isart, New Journal of Physics 19, 123029 (2017).
- Romero-Isart et al. [2011] O. Romero-Isart, A. C. Pflanzer, F. Blaser, R. Kaltenbaek, N. Kiesel, M. Aspelmeyer, and J. I. Cirac, Physical Review Letters 107, 020405 (2011).
- Scala et al. [2013] M. Scala, M. Kim, G. Morley, P. Barker, and S. Bose, Physical Review Letters 111, 180403 (2013).
- Stickler et al. [2018] B. A. Stickler, B. Papendell, S. Kuhn, B. Schrinski, J. Millen, M. Arndt, and K. Hornberger, New Journal of Physics 20, 122001 (2018).
- Pontin et al. [2023] A. Pontin, H. Fu, M. Toroš, T. S. Monteiro, and P. F. Barker, Nature Physics 19, 1003 (2023).
- Ranfagni et al. [2022] A. Ranfagni, K. Børkje, F. Marino, and F. Marin, Physical Review Research 4, 033051 (2022).
- Kamba et al. [2023] M. Kamba, R. Shimizu, and K. Aikawa, Nature Communications 14, 7943 (2023).
- Rossi et al. [2024] M. Rossi, A. Militaru, N. C. Zambon, A. Riera-Campeny, O. Romero-Isart, M. Frimmer, and L. Novotny, arXiv:2408.01264 (2024).
- Kamba and Aikawa [2023] M. Kamba and K. Aikawa, Physical Review Letters 131, 183602 (2023).
- Muffato et al. [2024] R. Muffato, T. Georgescu, M. Carlesso, M. Paternostro, and H. Ulbricht, arXiv:2408.09596 (2024).
- Hebestreit et al. [2018] E. Hebestreit, M. Frimmer, R. Reimann, and L. Novotny, Physical Review Letters 121, 063602 (2018).
- Jain et al. [2016] V. Jain, J. Gieseler, C. Moritz, C. Dellago, R. Quidant, and L. Novotny, Physical Review Letters 116, 243601 (2016).
- Chang et al. [2010] D. E. Chang, C. Regal, S. Papp, D. Wilson, J. Ye, O. Painter, H. J. Kimble, and P. Zoller, Proceedings of the National Academy of Sciences 107, 1005 (2010).
- Maurer et al. [2023] P. Maurer, C. Gonzalez-Ballestero, and O. Romero-Isart, Physical Review A 108, 033714 (2023).
- Conangla et al. [2020] G. P. Conangla, R. A. Rica, and R. Quidant, Nano Letters 20, 6018 (2020).
- Bykov et al. [2022] D. S. Bykov, M. Meusburger, L. Dania, and T. E. Northup, Review of scientific instruments 93 (2022).
- Bonvin et al. [2024a] E. Bonvin, L. Devaud, M. Rossi, A. Militaru, L. Dania, D. S. Bykov, M. Teller, T. E. Northup, L. Novotny, and M. Frimmer, Physical Review Research 6, 043129 (2024a).
- Bonvin et al. [2024b] E. Bonvin, L. Devaud, M. Rossi, A. Militaru, L. Dania, D. S. Bykov, O. Romero-Isart, T. E. Northup, L. Novotny, and M. Frimmer, Physical Review Letters 132, 253602 (2024b).
- Melo et al. [2024] B. Melo, M. T. Cuairan, G. F. M. Tomassi, N. Meyer, and R. Quidant, Nature Nanotechnology 19, 1270 (2024).
- Roda-Llordes et al. [2024b] M. Roda-Llordes, A. Riera-Campeny, D. Candoli, P. Grochowski, and O. Romero-Isart, Physical Review Letters 132, 023601 (2024b).
- Major et al. [2005] F. G. Major, V. N. Gheorghe, and G. Werth, Charged particle traps: physics and techniques of charged particle field confinement, Vol. 37 (Springer Science & Business Media, 2005).
- Graham [1987] R. Graham, Journal of Modern Optics 34, 873 (1987).
- Janszky and Yushin [1986] J. Janszky and Y. Y. Yushin, Optics communications 59, 151 (1986).
- Chen [2017] J.-S. Chen, Ticking near the Zero-Point Energy: Towards Accuracy in Al+ Optical Clocks, Ph.D. thesis, University of Colorado Boulder (2017).
- Chen et al. [2017] J.-S. Chen, S. Brewer, C. Chou, D. Wineland, D. Leibrandt, and D. Hume, Physical Review Letters 118, 053002 (2017).
- Brewer et al. [2019] S. Brewer, J.-S. Chen, A. Hankin, E. Clements, C. Chou, D. Wineland, D. Hume, and D. Leibrandt, Physical Review Letters 123, 033201 (2019).
- Teller et al. [2023] M. Teller, V. Messerer, K. Schüppert, Y. Zou, D. A. Fioretto, M. Galli, P. C. Holz, J. Reichel, and T. E. Northup, AVS Quantum Science 5, 012001 (2023).
- Poggio et al. [2007] M. Poggio, C. Degen, H. Mamin, and D. Rugar, Physical Review Letters 99, 017201 (2007).
- Conangla et al. [2019] G. P. Conangla, F. Ricci, M. T. Cuairan, A. W. Schell, N. Meyer, and R. Quidant, Physical Review Letters 122, 223602 (2019).
- Tebbenjohanns et al. [2019] F. Tebbenjohanns, M. Frimmer, A. Militaru, V. Jain, and L. Novotny, Physical Review Letters 122, 223601 (2019).
- Kremer et al. [2024] O. Kremer, I. Califrer, D. Tandeitnik, J. P. von der Weid, G. Temporão, and T. Guerreiro, Phys. Rev. Appl. 22, 024010 (2024).
- Gieseler [2014] J. Gieseler, Dynamics of optically levitated nanoparticles in high vacuum, Ph.D. thesis, ICFO (2014).
- Lindner et al. [2024] S. Lindner, P. Juschitz, J. Rieser, Y. Y. Fein, M. Debiossac, M. A. Ciampini, M. Aspelmeyer, and N. Kiesel, Applied Physics Letters 124, 143501 (2024).