Data Release 1 of the Dark Energy Spectroscopic Instrument
Abstract
In 2021 May the Dark Energy Spectroscopic Instrument (DESI) collaboration began a 5-year spectroscopic redshift survey to produce a detailed map of the evolving three-dimensional structure of the universe between and . DESI’s principle scientific objectives are to place precise constraints on the equation of state of dark energy, the gravitationally driven growth of large-scale structure, and the sum of the neutrino masses, and to explore the observational signatures of primordial inflation. We present DESI Data Release 1 (DR1), which consists of all data acquired during the first 13 months of the DESI main survey, as well as a uniform reprocessing of the DESI Survey Validation data which was previously made public in the DESI Early Data Release. The DR1 main survey includes high-confidence redshifts for 18.7M objects, of which 13.1M are spectroscopically classified as galaxies, 1.6M as quasars, and 4M as stars, making DR1 the largest sample of extragalactic redshifts ever assembled. We summarize the DR1 observations, the spectroscopic data-reduction pipeline and data products, large-scale structure catalogs, value-added catalogs, and describe how to access and interact with the data. In addition to fulfilling its core cosmological objectives with unprecedented precision, we expect DR1 to enable a wide range of transformational astrophysical studies and discoveries.
1 Introduction
1.1 The First Year of DESI Data
Elucidating the nature of dark energy and the physical mechanisms responsible for the accelerating expansion of the universe is one of the most important unsolved problems in physics and, arguably, all of science (Albrecht et al., 2006; Weinberg et al., 2013). To tackle this question, in 2021 May the Dark Energy Spectroscopic Instrument (DESI) collaboration began a 5-year survey to produce the most detailed three-dimensional map of the universe ever assembled (Levi et al., 2013; DESI Collaboration et al., 2016a, b). By measuring the baryon acoustic oscillation (BAO) feature and redshift space distortions at multiple cosmological epochs, DESI aims to place unprecedented constraints on the equation of state of dark energy, the gravitationally driven growth of large-scale structure, and the sum of the neutrino masses, as well as to explore the observational signatures of primordial inflation (DESI Collaboration et al., 2024a). Concurrently, DESI is carrying out an ambitious survey of stars in the halo of the Milky Way Galaxy in order to constrain the geometry, properties, and accretion history of its stellar halo, disk, and dark-matter halo (Cooper et al., 2023). Notably, DESI has the distinction of being the first Stage-IV dark-energy experiment to begin science operations (Albrecht et al., 2006).
DESI is a highly multiplexed instrument mounted at the prime focus of the Mayall 4-meter telescope at Kitt Peak National Observatory (KPNO) in Arizona, USA. Its 5000 robotic fibers and diameter field-of-view enable it to rapidly acquire optical spectrophotometry of tens of thousands of targets per night (DESI Collaboration et al., 2022; Schlafly et al., 2023). By the end of its 5-year survey in 2026 May, current projections are that DESI will have measured precise redshifts for approximately 50M unique galaxies and quasars and spectroscopic properties of 25M Milky Way stars.
DESI identifies its primary spectroscopic targets using 14,000 deg2 of broadband optical and mid-infrared photometry from Data Release 9 (DR9) of the DESI Legacy Imaging Surveys111https://www.legacysurvey.org/dr9 (Zou et al. 2017; Dey et al. 2019; Moustakas et al. 2023; Myers et al. 2023a; Schlegel et al. 2025, in preparation; hereafter, the Legacy Surveys), and, in some cases, using Gaia stellar photometry (Gaia Collaboration et al., 2016). Specifically, DESI targets five broad classes of objects scaffolded in redshift: Milky Way survey (MWS) and backup program stars (Cooper et al. 2023; Dey et al. 2025, in preparation); bright galaxy survey (BGS) galaxies (; Ruiz-Macias et al., 2020; Hahn et al., 2023); luminous red galaxies (LRGs, ; Zhou et al., 2020, 2023); emission-line galaxies (ELGs, ; Raichoor et al., 2020, 2023); and QSOs (; Yèche et al., 2020; Chaussidon et al., 2023). For its cosmological analyses, DESI further differentiates QSO targets into “tracer” QSOs at lower redshift, , from Ly forest QSOs at , because above DESI uses the Ly forest as an independent probe of the matter-density field (DESI Collaboration et al., 2016a).
After first light and a brief commissioning period, in 2020 December DESI began a five-month survey validation (SV) program which was designed to test the performance of the instrument and all its subsystems, and to validate its target-selection algorithms, data-reduction pipeline, and scientific deliverables (DESI Collaboration et al., 2024a). SV consisted of three successive phases: Target Selection Validation (SV1); Operations Development (SV2); and the One-Percent Survey (SV3), the last of which covered roughly 1% of the final 14,000 deg2 DESI footprint but to higher target completeness (DESI Collaboration et al., 2024a). These observations, particularly the One-Percent Survey data, resulted in a flurry of scientific activity222https://data.desi.lbl.gov/doc/papers/edr as well as DESI’s first measurement of the BAO peak in the BGS, LRG, ELG, and QSO 2-point correlation functions (Moon et al., 2023) and in the auto-correlation function of the Ly forest (Gordon et al., 2023). Subsequently, on 2021 May 14, DESI launched its 5-year main survey.333In detail, a small number of SV observations continued until 2021 June 10, but those data were acquired independently of the main survey and are included in the SV dataset (DESI Collaboration et al., 2024b).
All the data obtained during SV were first made public on 2023 June 13 as part of the DESI Early Data Release (EDR; DESI Collaboration et al., 2024a, b).444https://data.desi.lbl.gov/doc/releases/edr Here, we present DESI Data Release 1 (DR1), which includes all the data obtained by DESI during its first 13 months of science operations (2021 May 14 through 2022 June 13) as well as a uniform reprocessing of all the SV data. Overall, DESI has been efficient, running well-ahead of schedule and occasionally obtaining redshifts for more than one million unique targets in a single month (Schlafly et al., 2023). In the first year of the main survey, DESI has measured confident redshifts for approximately 18.7M unique targets over more than deg2, including 13.1M galaxies, 1.6M quasars, and 4M stars, making DESI the largest extragalactic spectroscopic redshift survey ever conducted. For comparison, all five generations of the Sloan Digital Sky Survey (SDSS I/II, III, IV, and V; York et al., 2000; Dawson et al., 2013; Majewski et al., 2017; Blanton et al., 2017; Kollmeier et al., 2017), spanning 18 public data releases and approximately 25 years of operations,555https://www.sdss.org have cumulatively resulted in approximately 4M unique extragalactic spectra, making DESI DR1 nearly a factor of four larger than all previous SDSS programs combined.
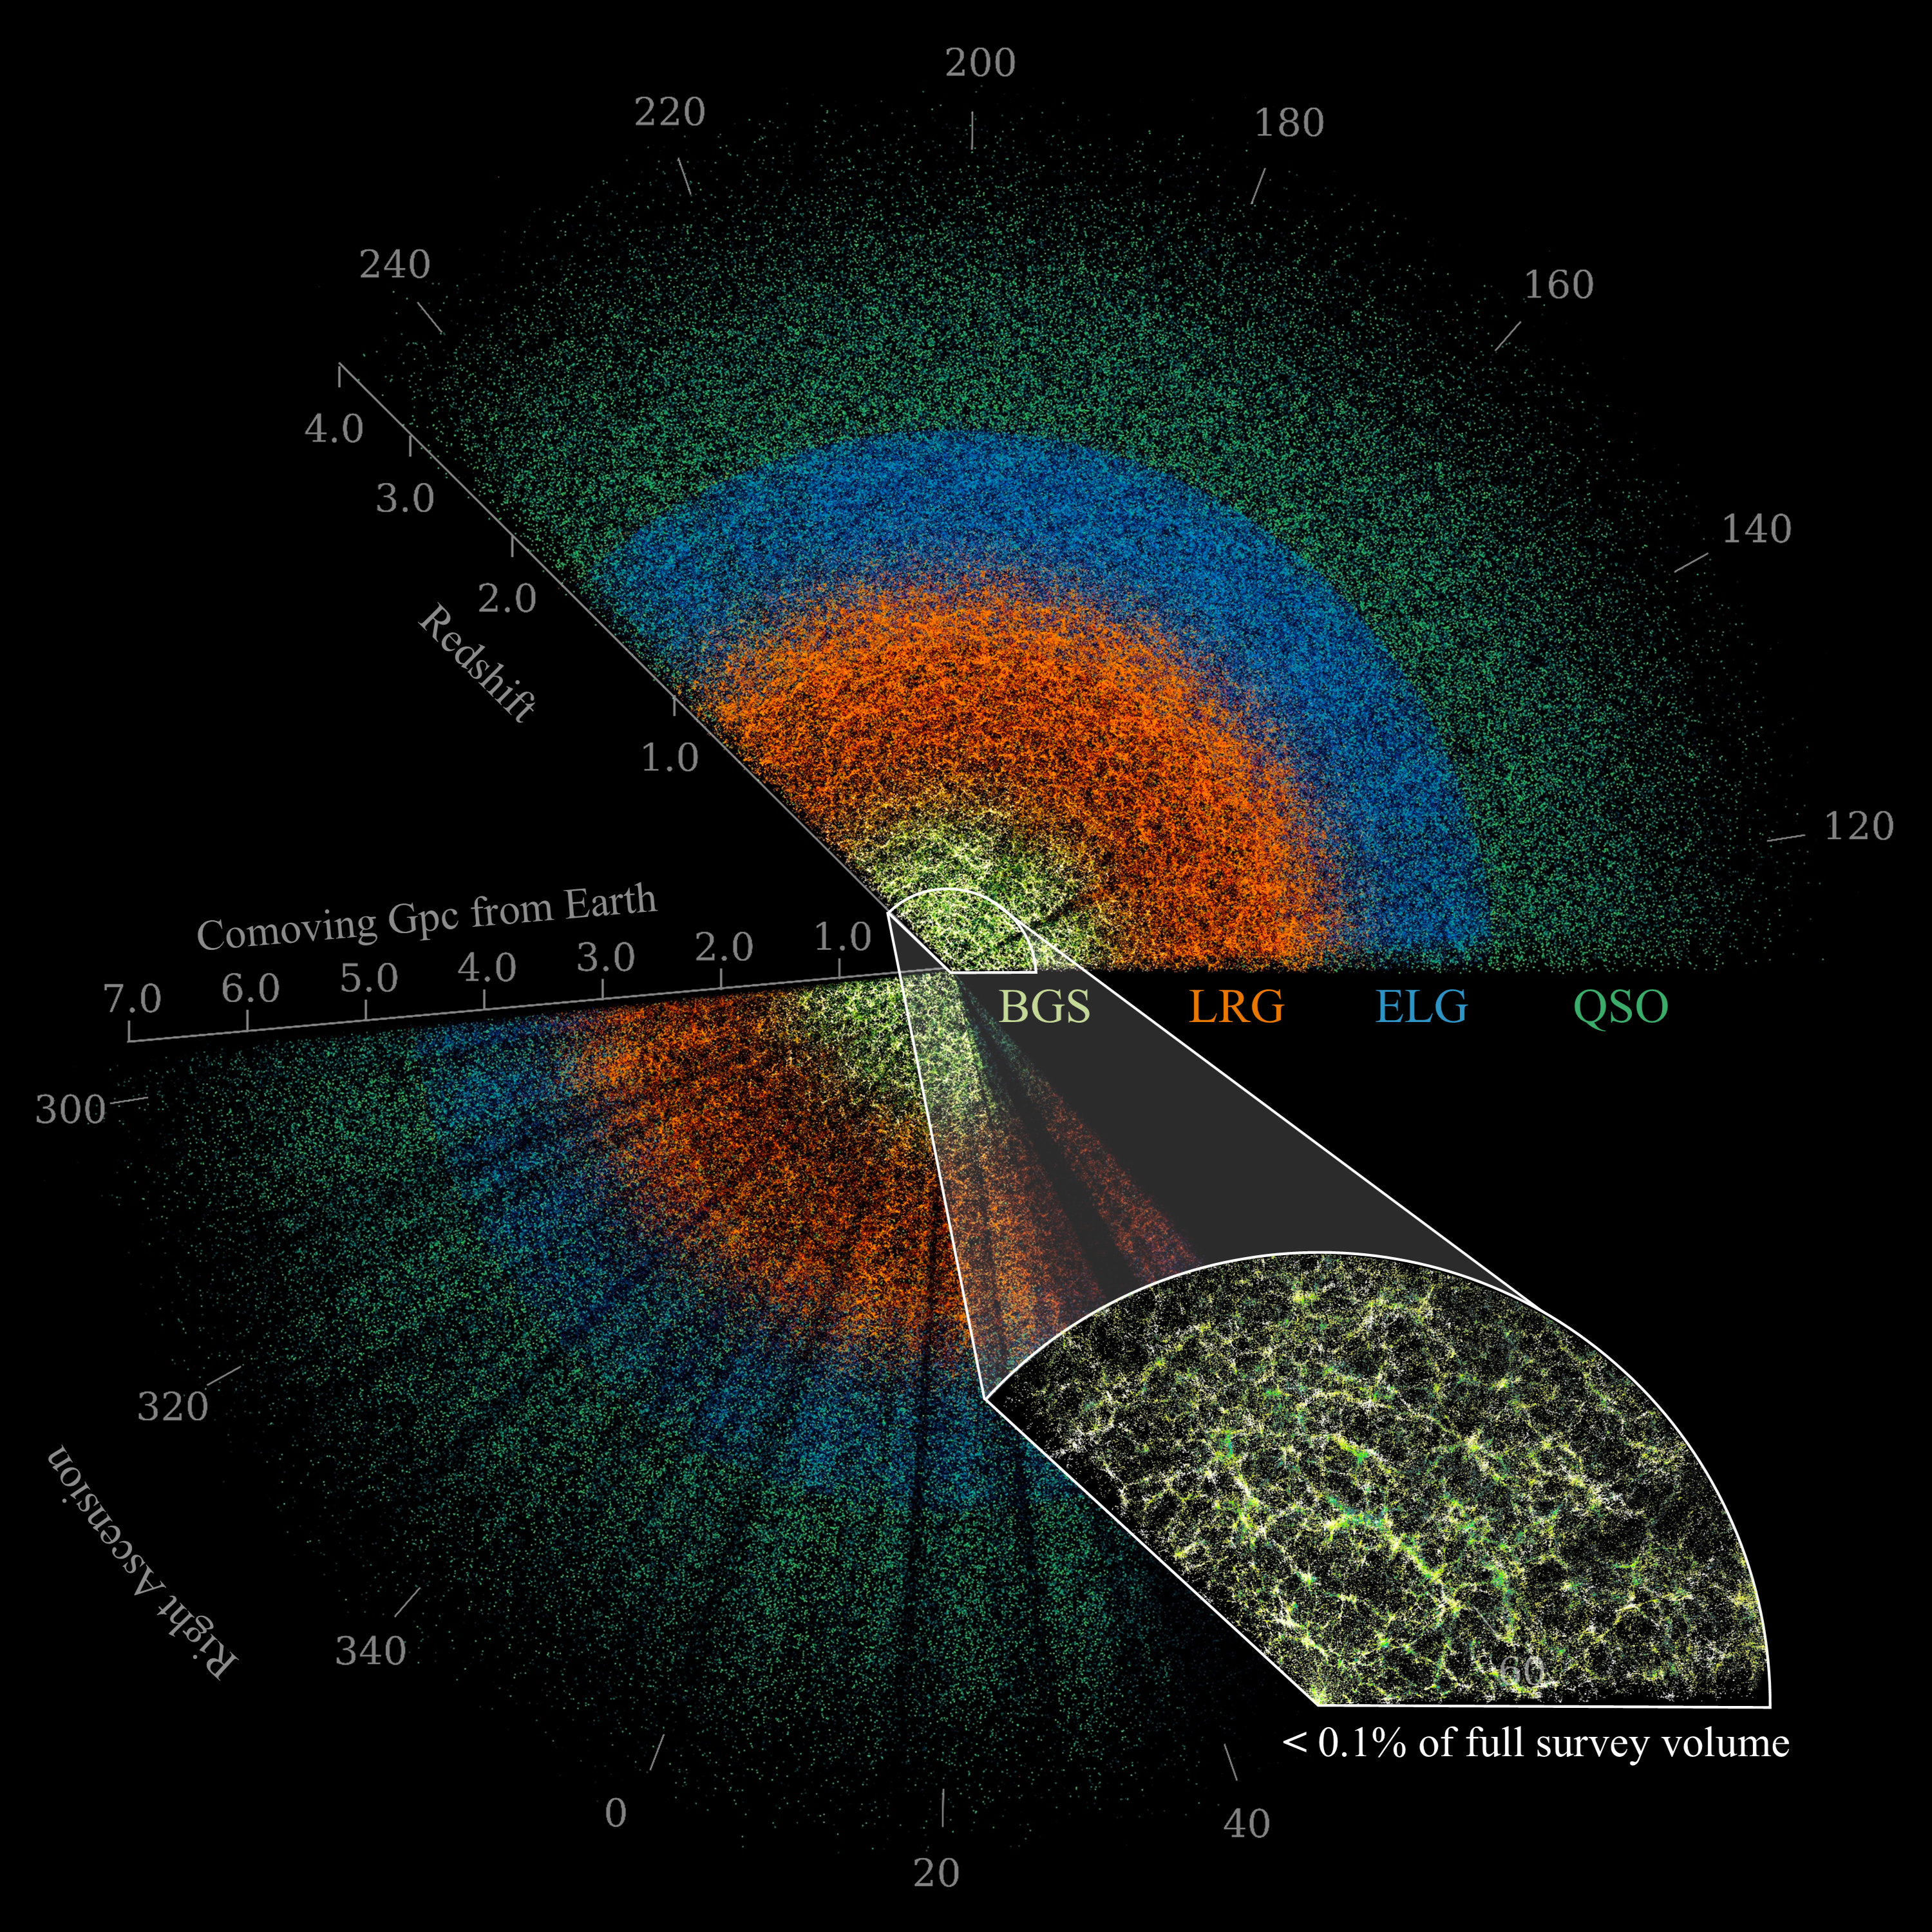
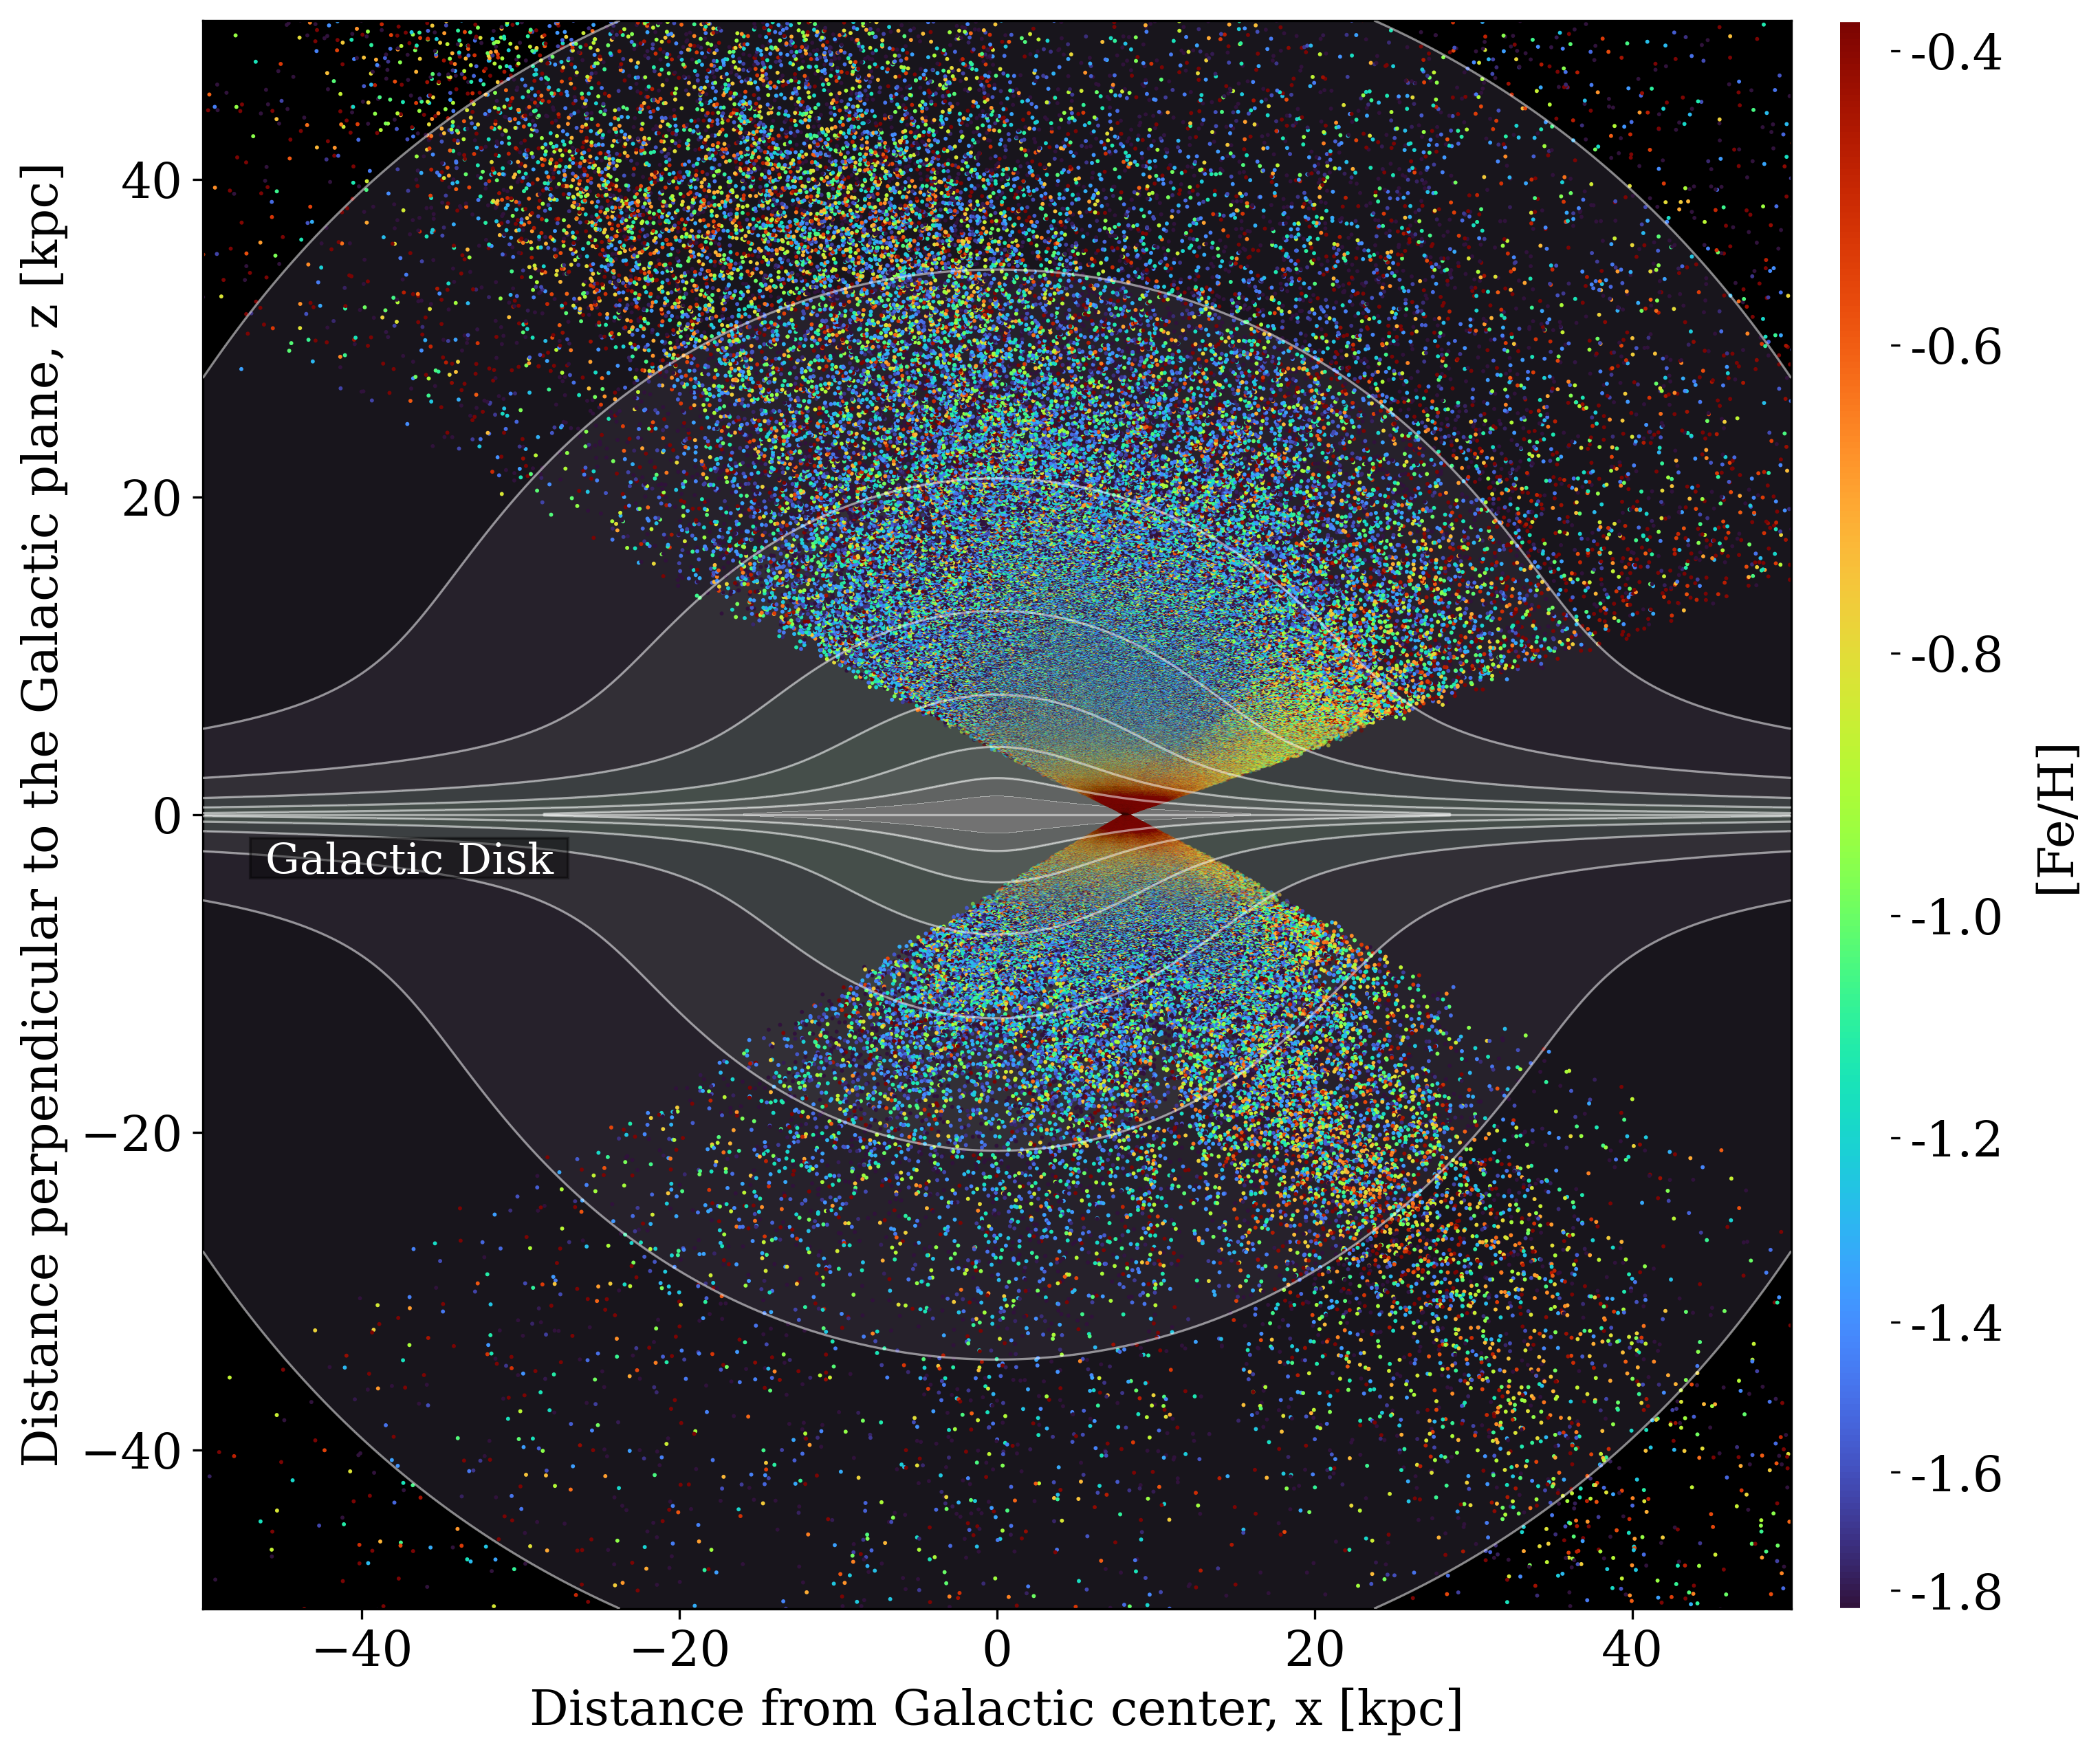
Figures 1 and 2 illustrate the incredible scope and detail of the data included in DESI DR1. In Figure 1 we show a two-dimensional projection of redshift and right ascension for a narrow wedge of the DESI footprint ( degrees in declination), unveiling the large-scale structure traced by the BGS, LRG, ELG, and QSO targets out to . In Figure 2 we show a complementary visualization of the Galactic disk mapped out by DESI, showing the physical distances of millions of MWS stars as a function of iron abundance, [Fe/H]. All the data used to generate these two figures are being released in DR1.
In §1.2 we outline the organization and contents of this paper and describe several important terms and concepts which will help orient readers interested in using DESI DR1. Complementarily, we recommend that readers interested in the cosmological results from DESI DR1 begin at the DESI portal666https://data.desi.lbl.gov/doc/papers/#year-1-cosmology-results for a high-level overview of the results before consulting the individual key papers (DESI Collaboration et al., 2024c, d, 2025a, e, 2025b, f).
1.2 A High-Level Guide to DESI and Data Release 1
The sheer size and scope of the DESI survey and data can be overwhelming to both new and expert users. The goal of this section is to introduce some of the key, high-level DESI concepts (and vernacular), with the overarching goal of demystifying some of this complexity. All the terminology and concepts we describe here will also apply to subsequent data releases, thereby lowering the barrier to working with future public DESI datasets.
All DESI observations are made in the context of a survey and a program (Schlafly et al., 2023). As introduced in §1.1, DESI’s primary, 5-year scientific program is its main survey, which was preceded by three independent, successive surveys (SV1, SV2, and SV3), collectively called SV. In addition, an object can be observed as part of the special survey, which includes a miscellaneous assortment of targets and observations which are kept separate from the main survey (see §2.3.3).
Within each survey, objects are observed in one of three possible programs according to the acceptable lunar phase and on-sky observing conditions (see §2.3.1): bright, dark, or backup.777A fourth program name, other, is occassionally used for ad hoc or bespoke observations which do not easily fit into the three standard program names. By design, LRG, ELG, and QSO targets are assigned to the dark program and BGS and MWS targets are assigned to the bright program; meanwhile, the backup program consists entirely of stellar (Milky Way) targets, and special (secondary and tertiary targets) can be assigned to any program (see §2.2; Schlafly et al., 2023; Myers et al., 2023a; DESI Collaboration et al., 2024a). In general, objects within each survey/program combination are always treated independently, from target selection (§2.2) all the way through to spectral coaddition and redshift estimation (§3.1); in other words, the same astrophysical object can appear in two (or more) survey/program combinations. This strict separation of targets within each survey and program is a critical part of the large-scale structure pipeline which enables DESI to make precise cosmological measurements (Ross et al., 2025).
The next important DESI concept is the spectroscopic production, or specprod, which is a fixed or pre-defined set of input spectra and calibration files processed with a well-defined (tagged) software stack. The philosophy underpinning these productions is that the provenance of every file and measurement is well-defined and fully reproducible. In DESI, spectroscopic productions are alphabetically named after mountains or mountain ranges. Notably, a given data release such as DR1 may contain more than one specprod (and also note that not all spectroscopic productions are publicly released since some are for internal testing and validation).
| Spectroscopic | Software | Included | No. of Unique | Release |
|---|---|---|---|---|
| ProductionaaWithin the DESI data model, a spectroscopic production is referred to as a specprod. Each specprod corresponds to a uniform processing of the data using a well-defined and reproducible set of input files and software tags. | Stack | SurveysbbSee §2.3 for a description of the SV and main surveys. | RedshiftsccApproximate total number of unique redshifts summed over all surveys and programs. | Date |
| Early Data Release (EDR)ddThe Early Data Release is described in DESI Collaboration et al. (2024b) and the data are publicly available at https://data.desi.lbl.gov/doc/releases/edr. | ||||
| Fuji | fujieeEvery ELG is also assigned bits from combinations of ELG_LOP, ELG_HIP, or ELG_VLO. See §3 of Raichoor et al. (2023) for further details. | SV | 1.7M | 2023 June |
| Data Release 1 (DR1)ffSome papers based on DESI data will interchangeably refer to DR1 as the “Year 1” (Y1) DESI sample; in addition, unless explicitly stated otherwise, DR1 (or Y1) implicitly means “the Iron spectroscopic production in DR1.” | ||||
| GuadalupeggSome early DESI papers refer to the Guadalupe production as “M2” or “DESI-M2”, referencing the two months of main-survey data. | fujieeEvery ELG is also assigned bits from combinations of ELG_LOP, ELG_HIP, or ELG_VLO. See §3 of Raichoor et al. (2023) for further details. | Main (2 months) | 2.4M | 2025 March |
| Iron | ironhhfootnotemark: | SV, Main (13 months) | 20.4M | 2025 March |
The primary spectroscopic production for DR1 is Iron, named after the Iron Mountain in Utah, USA; the Iron spectroscopic production includes data from the first 13 months of the DESI main survey, as well as a uniform reprocessing of the SV data which was previously released in the EDR (DESI Collaboration et al., 2024b). DR1 also includes a supplemental or ancillary spectroscopic production called Guadalupe (after the Guadalupe Mountains in Texas, USA), which includes just the first two months of the DESI main survey data (see Appendix A). We include Guadalupe in DR1 because it was used in some early DESI analyses (e.g., Moon et al., 2023; Gordon et al., 2023; Ravoux et al., 2023; Karaçaylı et al., 2024; Herrera-Alcantar et al., 2023; Bault et al., 2025; Ram´ırez-Pérez et al., 2024). Guadalupe was processed using the same set of calibration files and software tags as Fuji, the specprod used for the EDR (DESI Collaboration et al., 2024b). We emphasize, however, that all new or planned analyses of DESI data should use Iron instead of Guadalupe, since Iron contains significantly more data than Guadalupe and was processed with better algorithms and calibration files (see §3.1).
Table 1 summarizes the connection between the public data releases (EDR and DR1) and the spectroscopic productions included in these releases. Unless otherwise noted, in this paper we use DR1 to mean “observations, files, and measurements based on the Iron spectroscopic production,” including all summary statistics and performance metrics. Finally, we point out that some DESI papers, including most of the cosmological analysis papers (e.g., DESI Collaboration et al., 2025b, 2024f) use Year 1 (or Y1) to mean the DR1 or Iron spectroscopic production. So for all intents and purposes, DR1, Y1, and Iron can be used interchangeably to refer to the same underlying set of DESI data products.
We conclude the introduction by outlining the remaining structure of the paper. In §2, we provide an overview of DESI as an instrument (§2.1), describe some of the key DESI target-selection concepts (§2.2), and summarize the observations contained in DR1 and the status of the DESI main survey (§2.3). Next, §3 describes how DESI derives redshifts and spectral classifications from the raw data (§3.1); tabulates and visualizes the number and distribution of unique, confident redshifts in DR1 (§3.2); describes the major DR1 data products and how the data are organized (§3.3); summarizes the large-scale structure catalogs used in the DESI Y1 cosmological analyses (§3.4); and presents the current set of DR1 value-added catalogs (§3.5). Finally, in §4 we describe how the public data can be accessed using two complementary interfaces, and in §5 we summarize the paper.
2 Data Acquisition
In this section we document how DESI targets and observes objects over its deg2 footprint. In §2.1 we describe the characteristics of DESI as a highly multiplexed spectroscopic instrument; in §2.2 we briefly summarize how primary, secondary, and tertiary targets are selected for observations; and in §2.3 we outline DESI survey operations, the process by which DESI carries out its observing program, and summarize the observations contained within DR1.
2.1 Dark Energy Spectroscopic Instrument
DESI is capable of observing 5000 objects simultaneously using 10 petals of 500 fibers each over an 8 deg2 field-of-view focal plane (Silber et al., 2023; Miller et al., 2024). These fibers send light to 10 corresponding spectrographs with three arms, or cameras, sensitive to a different portion of the 3600–9800 Å observed-frame wavelength range (Poppett et al., 2024). The three cameras are sensitive to blue, red, and near-infrared light, and are denoted B, R, and Z, respectively. In its nominal configuration, DESI generates ten -pixel blue images and twenty -pixel red and near-infrared images, each containing data for 500 fibers. Table 2 summarizes some of the other key parameters of the instrument; additional details can be found in DESI Collaboration et al. (2022) and Guy et al. (2023).
The DESI wavelength coverage and instrumental resolution are designed to resolve the [O II] doublet for galaxies at redshifts , with the throughput optimized to measure [O II] down to fluxes of with an effective exposure time of 1000 s. Here, effective exposure time corresponds to an exposure time under nominal dark-time conditions—an object observed at zenith, in a dark sky with full-width at half-maximum (FWHM) seeing of 11, and no Galactic extinction (see §4.14 of Guy et al. 2023 for additional details).
| Parameter | Value | ||
|---|---|---|---|
| Field of View | 8 deg2 | ||
| Number of spectrographs | 10 | ||
| Fibers per spectrograph | 500 | ||
| Cameras per spectrograph | 3 (B,R,Z) | ||
| Camera | Spectral Range | Pixel Size | Resolution |
| Name | (Å) | (Å) | () |
| B | 3600–5800 | 0.8 | 2000–3500 |
| R | 5760–7620 | 0.8 | 3400–4800 |
| Z | 7520–9824 | 0.8 | 3800–5200 |
2.2 Target Selection
DESI Collaboration et al. (2024a) and Myers et al. (2023a) provide a summary of the selection criteria DESI uses to identify targets for spectroscopic observations, including estimates of the completeness, contamination rate, and technical implementation (building on a significant body of work documented in DESI Collaboration et al. 2016a, and references therein). In addition, individual supporting papers delve into the target-selection algorithms for each specific class of objects targeted by DESI, which we summarize in Table 3 (updated from a prior version of this table presented in Myers et al., 2023a). Here, we briefly describe some key target-selection concepts and terminology used elsewhere in the paper, but defer to the individual papers cited in Table 3 for additional details regarding DESI target selection.
Targets selected as part of the initial DESI design specifications (BGS, ELG, LRG, QSO, and MWS targets; DESI Collaboration et al., 2016a) are typically referred to as primary targets. Primary targets are always photometrically selected from the Legacy Surveys or from Gaia (Gaia Collaboration et al. 2016; see Myers et al. 2023a for details). As mentioned in §1.1, MWS and BGS targets are observed in bright observing conditions while LRG, ELG, and QSO targets are observed in dark conditions (see §2.3.1 and Schlafly et al. 2023) for a quantitative definition of bright and dark observing conditions). In addition, DESI observes stellar backup targets during twilight, or when conditions are too poor for main-survey observations; these backup targets are considered part of the MWS primary program (Dey et al. 2025, in preparation).
| Target Selection | Main Survey | ||
|---|---|---|---|
| Category | Bit NameaaStored as bit-values in the DESI_TARGET, BGS_TARGET and MWS_TARGET columns. Bit-names can be converted to bit-values using the desi_mask, bgs_mask and mws_mask bitmasks (see §2.4 in Myers et al., 2023a). | Description | Reference |
| Bright-time targets | |||
| Bright Galaxy Survey | BGS_ANY | Any BGS bit is set | Hahn et al. (2023) |
| BGS_FAINTbbBGS bits other than BGS_ANY are stored in the BGS_TARGET column and bgs_mask bitmask. | Faint BGS target | ||
| BGS_BRIGHT | Bright BGS target | ||
| BGS_WISE | AGN-like BGS target | Juneau et al. (2024a) | |
| BGS_FAINT_HIP | Faint BGS target prioritized | ||
| like a bright BGS targetccSome targets with low observational priority are observed at higher priority to help characterize the survey selection function. | |||
| Milky Way Survey | MWS_ANY | Any MWS bit is set | Cooper et al. (2023) |
| MWS_BROADddMWS bits other than MWS_ANY are stored in the MWS_TARGET column and mws_mask bitmask. | Magnitude-limited bulk sample | ||
| MWS_WD | White dwarf | ||
| MWS_NEARBY | Volume-limited 100 pc sample | ||
| MWS_BHB | Blue Horizontal Branch target | ||
| MWS_MAIN_BLUE | Magnitude-limited blue sample | ||
| MWS_MAIN_RED | Magnitude-limited red sample | ||
| Dark-time targets | |||
| Luminous Red Galaxies | LRG | LRG target | Zhou et al. (2023) |
| Emission Line GalaxieseeEvery ELG is also assigned bits from combinations of ELG_LOP, ELG_HIP, or ELG_VLO. See §3 of Raichoor et al. (2023) for further details. | ELG | ELG target | Raichoor et al. (2023) |
| ELG_LOP | ELG at standard priority | ||
| ELG_HIP | ELG observed at the (higher) | ||
| priority of an LRG | |||
| ELG_VLO | Low-priority “filler” ELG | ||
| Quasars | QSO | Quasar target | Chaussidon et al. (2023) |
| Backup targets | |||
| Part of the | BACKUP_GIANT_LOPffBACKUP bits are stored in the MWS_TARGET column and mws_mask bitmask. | Candidate Giant Star | Dey et al. 2025 (in prep.) |
| Milky Way Survey | observed at lower priority | ||
| BACKUP_GIANT | Candidate Giant Star | ||
| BACKUP_BRIGHT | Brighter backup target | ||
| BACKUP_FAINT | Fainter backup target | ||
| BACKUP_VERY_FAINT | Even fainter backup target | ||
In addition to primary targets, DESI also targets secondary and tertiary targets, in order to facilitate bespoke science programs with goals beyond the primary DESI experiment (e.g., Palmese et al., 2021; Darragh-Ford et al., 2023; Dey et al., 2023; Saulder et al., 2023; Yang et al., 2023; Fawcett et al., 2023; Soumagnac et al., 2024; Manser et al., 2024; Byström et al., 2024; Valluri et al., 2025). Secondary targets can be selected using any source of imaging, although the vast majority of these targets have counterparts in the Legacy Surveys. Tertiary targets are similar to secondary targets, but they are observed on dedicated special survey tiles instead of being interleaved with regular targets on normal tiles.
Targets identified for spectroscopic observations are carefully tracked for downstream redshift and large-scale structure catalogs (Ross et al. 2025) using a unique TARGETID (see §3 of Myers et al. 2023a). In addition, we record the provenance of each target using names and values stored in dedicated bit-masks (see §2 of Myers et al. 2023a and Table 3). In Appendix B, C and D we summarize the bits used to track primary, secondary and tertiary targets observed as part of the DESI main survey, respectively; the bits used to track SV target classes are documented in the appendices of the EDR paper, DESI Collaboration et al. (2024b).
2.3 Survey Operations
In this section we describe DESI survey operations, the process by which the survey is planned and executed on timescales ranging from a single night to months and years (Schlafly et al., 2023). A key concept for all DESI observations is the “tile,” which refers to a particular assignment of DESI’s fibers to celestial targets. With the exception of some early, unguided commissioning observations, whenever DESI observes, it observes a tile. Each tile is assigned a unique TILEID, although note that multiple exposures of the same TILEID can be executed (each one assigned a unique EXPID). Thus, when discussing the different programs observed by DESI, we frequently refer to the number of tiles and the amount of time spent on those tiles.
In §2.3.1 we describe main-survey operations, which DESI focused on almost exclusively in the time period covered by DR1, 2021 May 14 through 2022 June 13. Observations of SV tiles were included in the EDR and are described in DESI Collaboration et al. (2024b, a), although we summarize these observations briefly in §2.3.2 since they are being re-released in DR1. Finally, §2.3.3 briefly introduces the set of observations taken as part of the special survey included in DR1.
2.3.1 The Main Survey
The DESI main survey consists of 9929 dark tiles, 5676 bright tiles, and 2657 backup tiles, which DESI aims to observe over the course of its 5-year survey (Schlafly et al., 2023).888As the DESI survey is performing better than anticipated, the dark- and bright-time programs have been extended—both in terms of the number of tiles and the exact footprint—since the start of science operations. However, in this paper we adopt the survey definition in place at the start of the survey, as documented in Schlafly et al. (2023), since it is that survey that was used in the DESI year-one cosmology analyses. For the dark- and bright-time surveys, the locations of the centers of these tiles are chosen to cover the Galactic caps accessible to DESI, roughly the sky where Legacy Surveys imaging is available (Dey et al., 2019), supplemented with modest additional cuts to remove tiles at low Galactic latitude (roughly ; see Schlafly et al. 2023). Meanwhile, the backup program footprint covers a wider declination range (roughly ) and lower Galactic latitude (roughly ), as backup-program targets are selected from Gaia photometry (Gaia Collaboration et al., 2016) which is available over the whole sky (Myers et al. 2023a; Dey et al. 2025, in preparation).
| No. of | No. of | No. of | Effective TimeaaThe effective exposure time is the on-sky integration time in reference, or ideal conditions (see §2.1 and Guy et al. 2023 for details). | AreabbThe area covered by tiles is larger than the true effective area available to targets due to bright star exclusions, focal plane geometry, hardware configuration, and higher priority targets blocking lower priority targets. | |
|---|---|---|---|---|---|
| Program | Nights | Tiles | Exposures | (h) | (deg2) |
| Survey Validation | |||||
| CMXccDR1 includes a single commissioning (CMX) tile (TILEID=80615, SURVEY=cmx covering M33 which was obtained during the early part of SV. | 1 | 1 | 4 | 0.9 | 8 |
| SV1ddSURVEY=sv1 includes both Target Selection Validation tiles and tiles dedicated to secondary targets (DESI Collaboration et al., 2024b). | 90 | 187 | 1674 | 175.3 | 1082 |
| SV2 | 8 | 37 | 70 | 6.4 | 102 |
| SV3 | 38 | 488 | 710 | 102.9 | 197 |
| Special Observations | |||||
| Special | 38 | 42 | 148 | 13.7 | 243 |
| Main Survey | |||||
| Bright | 262 | 2275 | 2569 | 148.8 | 9739 |
| Dark | 212 | 2744 | 3420 | 782.9 | 9528 |
| Backup | 92 | 327 | 581 | 6.0 | 2726 |
Although the tile centers are fixed, the actual assignment of targets to fibers is not defined until we observe a particular location on the sky. At that time, the Merged Target List (MTL; Schlafly et al., 2023) is used to assign the highest-priority target to each fiber, in order to produce a tile with a fixed fiber-assignment configuration. The primary motivation for this “on the fly” design strategy is to be able to identify and increase the priority of quasars from DESI spectra so that they will be repeatedly observed. At , the Ly forest redshifts into the DESI spectral coverage (see §2.1), making these targets especially valuable probes of large-scale structure at high redshifts. However, because we do not know in advance which quasars are at , we are forced to learn this from the DESI spectra themselves. Once Ly-forest QSOs have been identified, we update the MTL with the results to ensure that future DESI observations will observe these targets whenever possible. The MTL allows us to identify times when observations of targets failed, for example, due to being assigned to a positioner which has stopped functioning. Observations of these targets may then be repeated in the future.
The need to use information about past observations in order to inform future observations leads to the following survey operations mode or sequence: {enumerate*}
Observe tiles in regions of the sky where the MTL is up to date with the latest observations;
Analyze those tiles (typically the day after observations have been obtained) to determine redshifts, with particular care taken to identify quasars; and
Incorporate the resulting redshifts into the MTL, in order to inform future targeting.
The DESI spectroscopic pipeline processes each night’s observations as they come in, and usually redshifts are available the following morning (see §3.1 and Guy et al., 2023).999The DESI team informally and fondly refers to this process as “redshifts by breakfast.” Following a quality assurance process by members of the survey operations team, the reduced data are incorporated into the MTL, roughly twice per week (Schlafly et al., 2023).
Tiles are selected for observation each night automatically by the Next Tile Selector (NTS; Schlafly et al., 2023). The basic scheme is to prefer equatorial fields while minimizing slewing and obtaining the minimum airmass possible. The NTS avoids observing areas of the sky where observations have been made that have not been incorporated into the MTL, so that any remaining Ly quasars in those regions can be identified. The NTS is also responsible for deciding whether to observe bright, dark, or backup tiles. This decision is made on the basis of the current survey speed, which is based on real-time measurements of the transparency, seeing, and sky background from the Exposure Time Calculator (ETC; Kirkby et al., 2025). The survey speed is expressed as a fraction relative to nominal dark conditions, where the sky background is 21.07 mag arcsec-2 in the -band, the seeing is 11, and conditions are photometric. When the survey speed is greater than 0.4 we observe the dark program; when the survey speed is greater than 0.08 but less than 0.4 we observe the bright program; otherwise we observe backup program tiles.
We observe tiles for an effective exposure time of 1000 s for the dark program and 180 s for the bright program. Effective exposure times intend to deliver a given “average” signal-to-noise ratio on a reference spectrum, and can be thought of as ordinary exposure times in the reference conditions. With these effective exposure times, and accounting for the fact that DESI is not always observing in reference conditions and has overheads and downtime, the DESI instrument can be used to observe a 14,000 deg2 survey in five years (Schlafly et al., 2023).
The survey had one major shutdown in its first year, between 2021 July 10 and 2021 September 20, when the focal-plane electronics were upgraded. Apart from these interruptions, DESI executed close to continual operation, weather permitting. As shown in Table 4, more than five thousand main-survey tiles were observed, roughly equally split between the bright and dark programs. The backup program began after the main survey started, on 2021 November 25, and comprises 327 unique observed tiles in DR1.
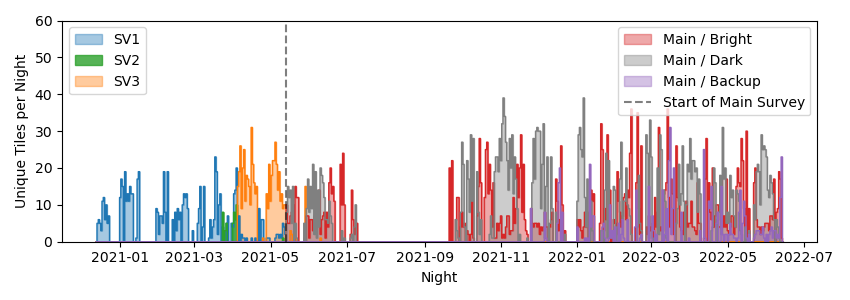
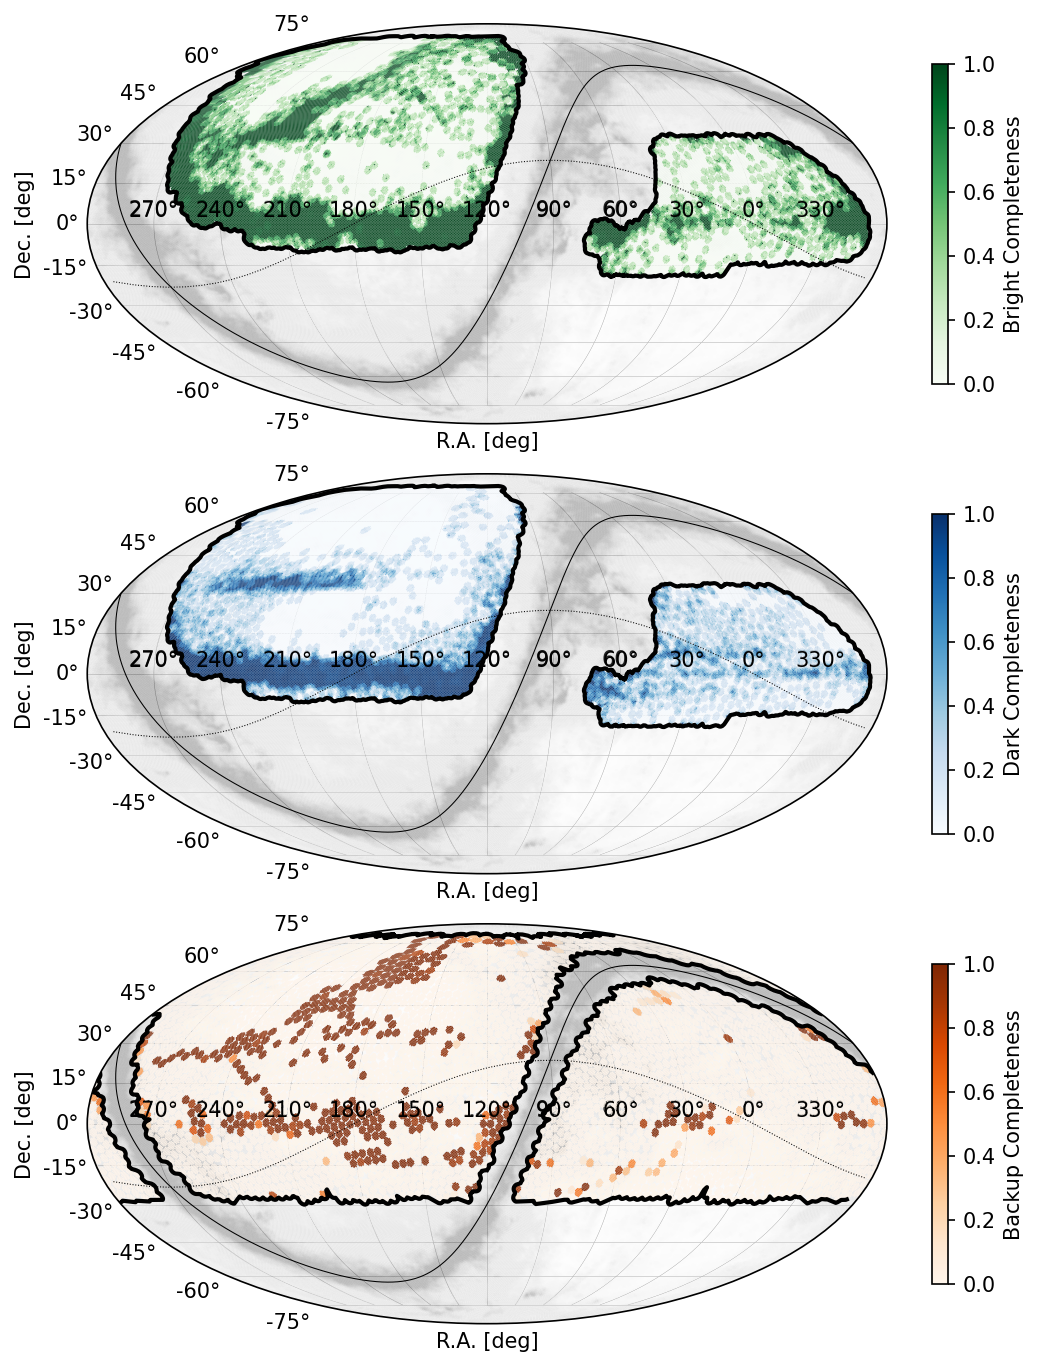
The data being released in DR1 represents a meaningful fraction of the full DESI survey. Through 2022 June 13, the dark survey was 29.0% complete, the bright survey was 41.3% complete; and the backup program was 5.2% complete. Figure 3 shows the spatial distribution of the main-survey completeness on the sky for each of these three programs, and Figure 4 plots the number of unique tiles observed each night over the window of time spanned by DR1. The start of the main survey on 2021 May 14 is clearly evident as the time when we transitioned from SV3 to the main survey. Though noisy, one can also make out the pattern of the full and new moon, as nightly observations alternate between the dark- and bright-time programs.
In Figure 3, the completeness is strongly affected by the survey strategy and observational conditions. We aim to observe “depth first,” starting at the equator, obtaining all spectra in a particular region of the sky before moving off the equator. This strategy leads to the equatorial regions with especially dense regions in the bright and dark programs. Kitt Peak occasionally experiences strong southerly winds, which force observation of tiles in the north, leading to the dense regions of observations north of . These regions are especially prominent in the dark program. Most bright observations are taken when the Moon is high in the sky, and DESI tries to observe locations more than away from the Moon, making the distribution of bright tiles less concentrated at the equator than the dark tiles. Finally, because we need to identify quasars in observations before reobserving any patch of the sky, occasionally we have operated in a “breadth first” mode while validating the observations, leading to some large areas of limited coverage in the bright and dark programs.
2.3.2 Survey Validation
Although the primary focus of DR1 is on the new main-survey data, DR1 also includes all the SV data which were taken before the start of the main survey: {enumerate*}
SV1 (Target Selection Validation) tiles were used to verify and refine the target-selection algorithms for the main survey, and include dedicated secondary-target tiles which were used for special programs before we developed the special survey (see §2.3.3).
SV2 (Operations Development) tiles were used to test survey-like DESI operations; and
SV3 (One Percent Survey) tiles comprised a high-completeness sample of observations using the final set of DESI target selection algorithms.
These programs were all part of the EDR and are discussed in extensive detail in DESI Collaboration et al. (2024b); they remain useful for specialized analyses due to their depth (SV1), high spectroscopic completeness (SV3), and for comparison to past work on the EDR samples.
2.3.3 Special Tiles
Approximately two percent of DESI observing time in its first year of science operations was spent on the special survey. These tiles cover a variety of use cases, both technical and scientific, and so they are kept separate from the main survey and associated MTL strategy. We summarize these observations in Table 5 and describe them in more detail in Appendix D.
| No. of | No. of | Effective | |||
|---|---|---|---|---|---|
| ObservationsaaAll special tiles have SURVEY=special. The bright, dark, and backup special tiles have PROGRAM=bright, dark, and backup, respectively, while the m31, odin, and tertiary tiles all have PROGRAM=other. | Description | Tiles | Exposures | TILEIDs | TimebbDefined in Table 4. (h) |
| Bright | Bright test tiles. | 15 | 80 | 80978–80981, 82258–82268 | 2.5 |
| Dark | Dark test tiles; Sgr stream tile. | 4 | 9 | 80977, 81100, 81112, 82237 | 1.2 |
| Backup | Backup test tiles. | 9 | 25 | 82401–82409 | 0.2 |
| M31 | M31 special program. | 2 | 9 | 82634–82635 | 3.3 |
| Odin | LAE/LBG targets in COSMOS. | 1 | 8 | 82636 | 2.7 |
| Tertiary1 | Dense, COSMOS targets. | 11 | 17 | 82637–82647 | 3.9 |
Note. — See Appendix D for more details regarding these observations.
3 Data Reduction and Data Products
In this section we describe the major DR1 data products and how they are produced. First, in §3.1 we present a brief overview of how the two-dimensional spectra are reduced to derive redshifts, redshift-quality flags, and spectral classifications. Next, in §3.2 we summarize the number of unique redshifts in DR1 and show the sample distributions in redshift and on the sky. In §3.3 we outline the contents and organization of the data products included in DR1, and in §3.4 we provide a brief introduction to the large-scale structure (LSS) catalogs used to carry out the DESI cosmological analysis and describe where and how those catalogs can be accessed. Finally, in §3.5 we describe the current set of value-added catalogs (VACs) accompanying DR1.
3.1 From Raw Spectra to Redshifts
The following three subsections describe the data-reduction pipeline (§3.1.1), the determination of redshifts and spectral classifications (§3.1.2), and the improvements in the spectroscopic pipeline relative to the data released in the EDR (§3.1.3).
3.1.1 Spectral Extraction and Calibration
The DESI spectroscopic data-reduction pipeline is described in detail in Guy et al. (2023) and §3 of DESI Collaboration et al. (2024b). The primary outputs of this pipeline are sky-subtracted, wavelength-calibrated, and flux-calibrated spectra, including estimated uncertainties, and a resolution matrix, which encodes the effective instrument resolution.
The data acquired by DESI at KPNO are automatically transferred to the National Energy Research Scientific Computing Center (NERSC101010https://nersc.gov) for reduction, analysis, and archiving. During nominal operations, calibration data at KPNO are acquired during the afternoon preceding a given night of observations. These calibration data include zero exposure-time (bias) frames; dark exposures; arc lamp exposures; and multiple flat-field exposures taken with LED lamps illuminating a white dome screen.
Using these data, we derive a master bias frame for each CCD, the spectral trace coordinates, wavelength calibration parameters, two-dimensional point-spread functions (PSFs), and a flat-field correction for each fiber of each camera. The processing of a scientific exposure acquired during the subsequent night proceeds as follows: We first pre-process each CCD image by subtracting the bias, the overscan level, and the dark current. We mask pixels affected by cosmic-ray hits and CCD defects, convert counts into electrons, and estimate the noise per pixel. We then adjust the coordinates of the spectral traces and the wavelength calibration of each fiber using the known wavelengths of the emission lines from the night-sky spectrum, while offsetting this solution such that the extracted spectra will be in a vacuum Solar System barycentric frame. These coordinate corrections are typically smaller than a CCD pixel relative to the afternoon calibrations. Next, we extract one-dimensional spectra using the spectroperfectionism algorithm of Bolton & Schlegel (2010). The results are counts per fiber and wavelength on a common wavelength grid (vacuum, barycentric), along with the resolution matrix, which quantifies the effective instrument resolution of each extracted spectrum as a function of wavelength. The spectra are then flat-fielded and sky-subtracted. Next, we use observations of F-type stars to determine the instrument throughput and to convert the measured counts into calibrated spectral energy density.111111All extracted (one-dimensional) DESI spectra are in units of . Finally, depending on which data products are being generated (see §3.3), multiple observations of the target or TILEID (see §2.3) are coadded using optimal (inverse variance) weights.
We record the resolution matrix for each spectrum as a band-diagonal sparse matrix. A perfect resolution model should be multiplied by this matrix to achieve the equivalent observed model at the effective resolution of DESI. The underlying mathematics and motivation for the resolution matrix are described in §3 of Bolton & Schlegel (2010) and in §4.5 and Appendices C and D of Guy et al. (2023). We refer interested readers to the repository of DESI tutorials (see §4.3) for worked examples of how to use the resolution matrix in scientific analyses.
For each spectrum, DESI also measures the template signal-to-noise ratio squared (TSNR2) for each of its major target classes BGS, LRG, ELG, QSO, and LYA.121212Here, LYA refers to QSOs which have been spectroscopically confirmed to be Ly forest () quasars. Also note that we do not derive a TSNR2 value for MWS targets. These quantities measure a wavelength-averaged, squared, signal-to-noise ratio, where the noise is determined from the current observations (CCD noise, sky level), the signal amplitude depends on the flux calibration, and the variation of the signal with wavelength is designed to best predict the redshift measurement precision of a given target class. For example, TSNR2_ELG gives larger weight to redder wavelengths covering the [O II] doublet at the redshifts of typical DESI ELG targets, while TSNR2_QSO gives more weight to bluer wavelengths important for measuring QSO emission lines. TSNR2_LRG is scaled to derive the effective exposure time (described in §2.3) of DESI dark-time exposures, while TSNR2_BGS is used to derive the effective exposure time for bright-time tiles, though this is also normalized to the reference dark conditions (see §4.14 of Guy et al. 2023 for more details).
3.1.2 Redshifts and Spectral Classifications
With the fully calibrated spectra in-hand, we use Redrock to determine the optimum redshift and spectral classification of each object (Ross et al. 2020; Anand et al. 2024, Bailey et al. 2025, in preparation). Briefly, Redrock fits principal component analysis (PCA) templates of three broad, independent classes of objects—stars, galaxies, and quasars, corresponding to spectral type STAR, GALAXY, and QSO, respectively—on a spectral type-dependent grid of redshift. The fit which produces the lowest overall value yields the best-fitting redshift (Z), redshift uncertainty (ZERR), spectral type (SPECTYPE), and template coefficients (COEFF). In addition, Redrock reports the (minimum) of the best fit (CHI2) and (DELTACHI2), which is the difference between the two lowest values across all three spectral classes. Interpreted using Gaussian statistics, DELTACHI2 represents the statistical significance of the best fit relative to the next best fit; for example, a DELTACHI2 value of 25 implies that the best fit is “better” than the next best fit (not accounting for systematic uncertainties). Finally, besides redshifts and classification, a key metric reported by Redrock is the per-object redshift warning bitmask, ZWARN. In essence, a value of ZWARN\text=0 indicates that there are no known problems with either the input spectroscopic data nor with the corresponding redshift fit. We refer the reader to the DESI data model131313https://desidatamodel.readthedocs.io/en/latest/bitmasks.html#zwarn, which documents the full set of possible ZWARN bits and their definitions, and to §3.2 of DESI Collaboration et al. (2024b) for more discussion.
Finally, the DESI pipeline carries out three additional processing steps: emission-line fitting (emlinefit; Raichoor et al., 2023); a fit to the Mg II doublet (Chaussidon et al., 2023); and a quasar neural-network classifier called QuasarNET (Busca & Balland 2018; Farr et al. 2020; Green et al. 2025, in preparation), all three of which are described in more detail in §3.1.4 of DESI Collaboration et al. (2024b).141414Colloquially, DESI team members refer to these steps of the pipeline as “after-burners,” since they are collaborator-contributed algorithms executed after the original core pipeline Redrock results have been written out. Detailed analyses show that these after-burners are essential for evaluating successful ELG redshifts and for correctly classifying and measuring the correct redshifts for some classes of QSOs (Alexander et al., 2023; Lan et al., 2023; Raichoor et al., 2023; Chaussidon et al., 2023; DESI Collaboration et al., 2024a), so the after-burner catalogs are included as standard pipeline outputs.
| Parameter | Value | ReferenceaaReferences G23, DESI24c, and K24 are Guy et al. (2023), DESI Collaboration et al. (2024c), and Koposov et al. (2024), respectively. |
|---|---|---|
| Wavelength precision | 0.025 Å | G23 §4.7.4, Figure 32 |
| Sky Subtraction | 1% systematic | G23 §4.7.5, Figure 34 |
| Spectrophotometric flux calibration | 6%–10% | G23 §4.9.3, Figure 38 |
| Redshift precision – BGS, ELG | 10 km s-1 | DESI24c §7.2 |
| Redshift precision – LRG | 50 km s-1 | DESI24c §7.2 |
| Redshift precision – QSO | 20–125 km s-1 () | DESI24c §7.2 |
| Redshift outliers – BGS, LRG, ELG | DESI24c §7.2 | |
| Redshift outliers – QSO | DESI24c §7.2 | |
| Redshift outliers – QSO | DESI24c §7.2 | |
| Radial velocity precision – MWS | km s-1, km s-1 systematic | K24 §5.4.1 |
3.1.3 Pipeline Improvements and Algorithmic Performance
Algorithmic updates for the Iron production in DR1 (relative to the Fuji specprod used in the EDR and Guadalupe; see §1.2) include new QSO templates split by redshift range (Brodzeller et al., 2023); improved sky subtraction by modeling the measured fiber throughput as a function of positioner location151515https://github.com/desihub/desispec/pull/1801 which replaces the simpler per-fiber, per-exposure measured normalization described in §4.7.2 of Guy et al. (2023); and multiple smaller bug-fixes. In addition, compared to the Fuji release in the EDR, most intermediate pipeline files are now gzipped to save disk space, although the coadded spectra and measured catalog files remain uncompressed for faster read-access (see §3.3).
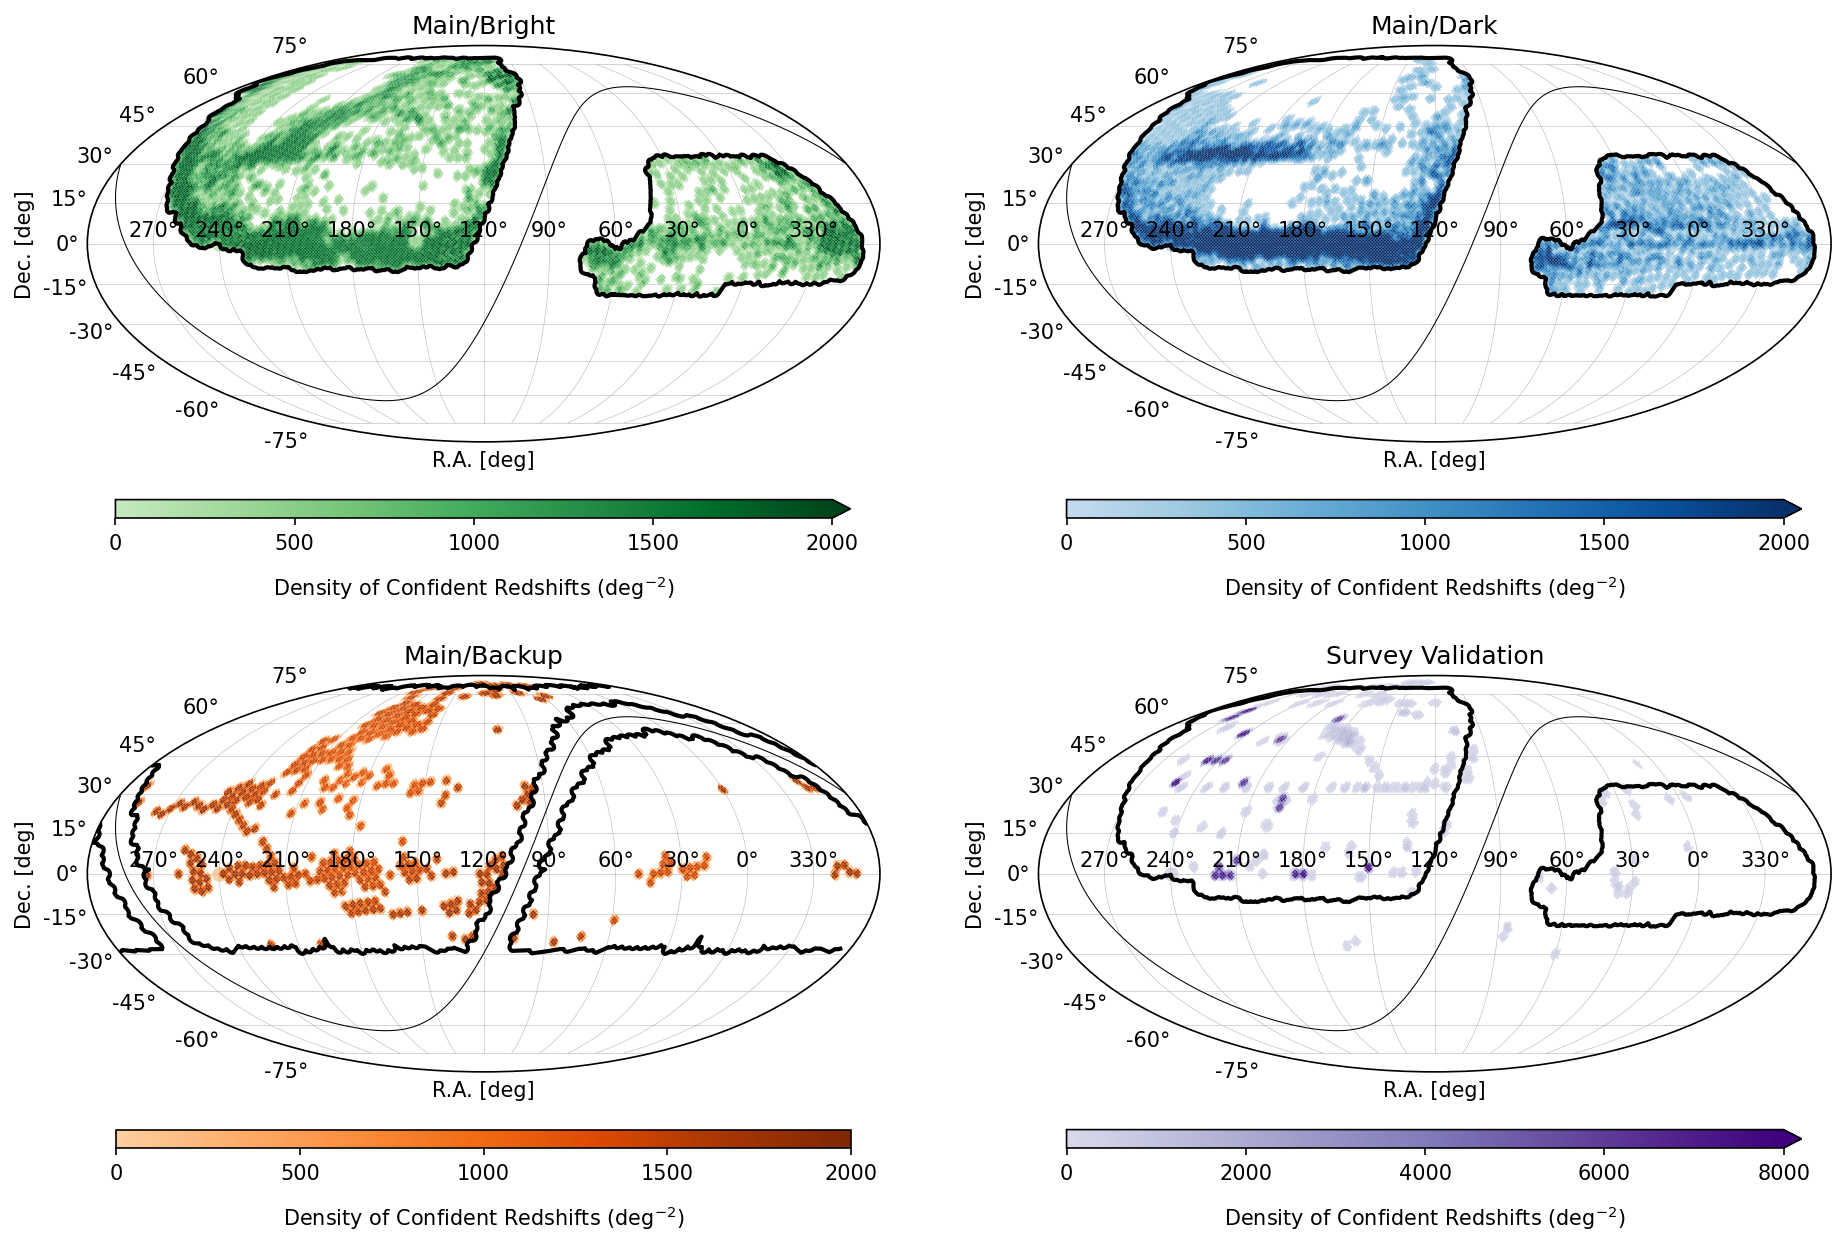
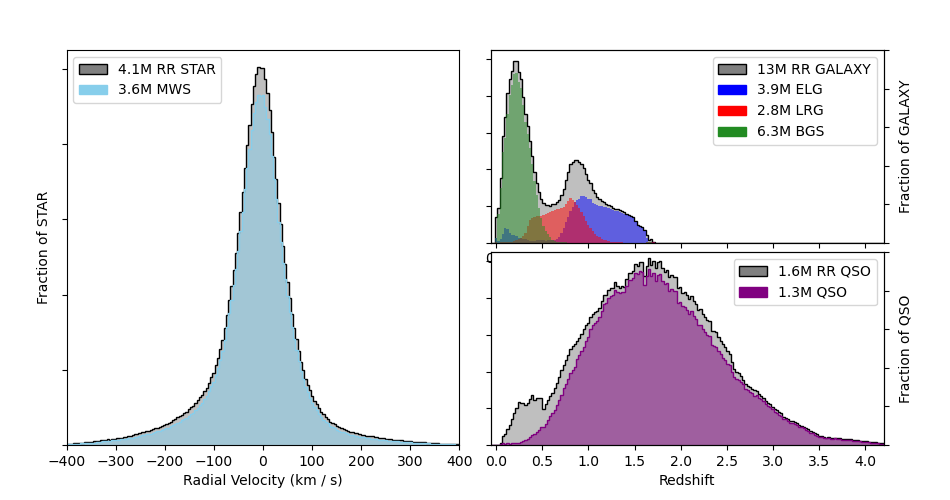
Table 6 provides a summary of the algorithmic performance of the spectroscopic pipeline, including average wavelength precision, sky subtraction residuals, spectrophotometric flux calibration, redshift and radial velocity precision, and redshift outliers. The table includes references to other papers documenting the details.
3.2 Sample Distributions
After just 13 months of science operations, DESI has measured confident redshifts for approximately 18.7M unique science targets across all surveys and programs, making DR1 the largest sample of extragalactic redshifts ever assembled. In the main survey alone, DR1 includes a total of 8.5M, 9.0M, and 1.2M objects with reliable redshifts from the bright, dark, and backup programs, respectively. Here and in the rest of this section, we use the (logical “and”) condition to select a sample of unique objects with confident redshifts. The criterion identifies objects with no known hardware, observing, data quality, or redshift-fitting flags (see §3.1), and ZCAT_PRIMARY chooses the “best” observation of objects which have been observed in different surveys or programs (see §3.3). For additional details regarding the full range of possible data-quality bit-masks, see the DESI data model.161616https://desidatamodel.readthedocs.io/en/latest/bitmasks.html#bit-masks-in-desi Alternatively, most users of the DESI data will likely be interested in the tracer-dependent quantitative criteria used to define the samples used for DESI cosmological analyses, which are described in §4.2 of DESI Collaboration et al. (2024b) and DESI Collaboration et al. (2024c) for the EDR and DR1 cosmological results, respectively.
Figure 5 displays the surface density distribution of objects with confidently measured redshifts observed as part of the bright, dark, and backup programs of the main survey (first three panels, starting in the upper-left) and as part of SV (lower-right panel). For reference, the approximate solid angle covered by these four datasets is 9739, 9528, 2726, and 1410 deg2, respectively (Table 4) For more precise tracer-dependent area estimates, see Ross et al. 2025.
| Program | bbThe number of MWS objects listed in this column includes the standard stars used for spectrophotometric calibration. | TotalccThe total may be different than the sum of the the columns because some targets may belong to one or more target class (or a target class may not be listed). | |||||
|---|---|---|---|---|---|---|---|
| Survey Validation | |||||||
| CMX | 469 | 247 | 1,040 | 734 | 292 | 0 | 3,173 |
| SV1 | 159,115 | 128,921 | 62,706 | 109,420 | 29,387 | 59,538 | 527,927 |
| SV2 | 8,954 | 37,456 | 21,053 | 11,732 | 11,364 | 0 | 89,925 |
| SV3 | 280,253 | 219,213 | 127,876 | 295,831 | 32,843 | 69,811 | 992,821 |
| Total | 448,791 | 385,837 | 212,675 | 417,717 | 73,886 | 129,349 | 1,613,846 |
| Special Observations | |||||||
| Special | 42,690 | 31,303 | 3,778 | 4,407 | 2,599 | 58,252 | 141,473 |
| Main Survey | |||||||
| Backup | 1,192,150 | 0 | 0 | 0 | 0 | 5 | 1,212,427 |
| Bright | 2,237,995 | 5,940,739 | 189,759 | 736 | 4,607 | 705,730 | 8,484,481 |
| Dark | 211,235 | 339,459 | 2,639,852 | 3,925,609 | 1,335,505 | 1,289,489 | 8,962,896 |
| Total | 3,641,380 | 6,280,198 | 2,829,611 | 3,926,345 | 1,340,112 | 1,995,224 | 18,659,804 |
In Figure 6 we show the redshift distribution of stellar (left-hand panel) and extragalactic (right-hand panels) targets in DR1 with well-measured redshifts. In each panel, the gray histogram shows the distribution of objects spectroscopically classified by Redrock (RR) into stars, galaxies, and quasars (SPECTYPE=STAR, GALAXY, and QSO; see §3.1.2). The light-blue, dark-green, red, dark-blue, and purple histograms show the redshift distribution of MWS, BGS, LRG, ELG, and QSO tracers, respectively. As discussed in DESI Collaboration et al. (2024a, b) and the collection of papers listed in Table 3, these redshift distributions match the finely-tuned target-selection algorithms developed for each class of DESI target.
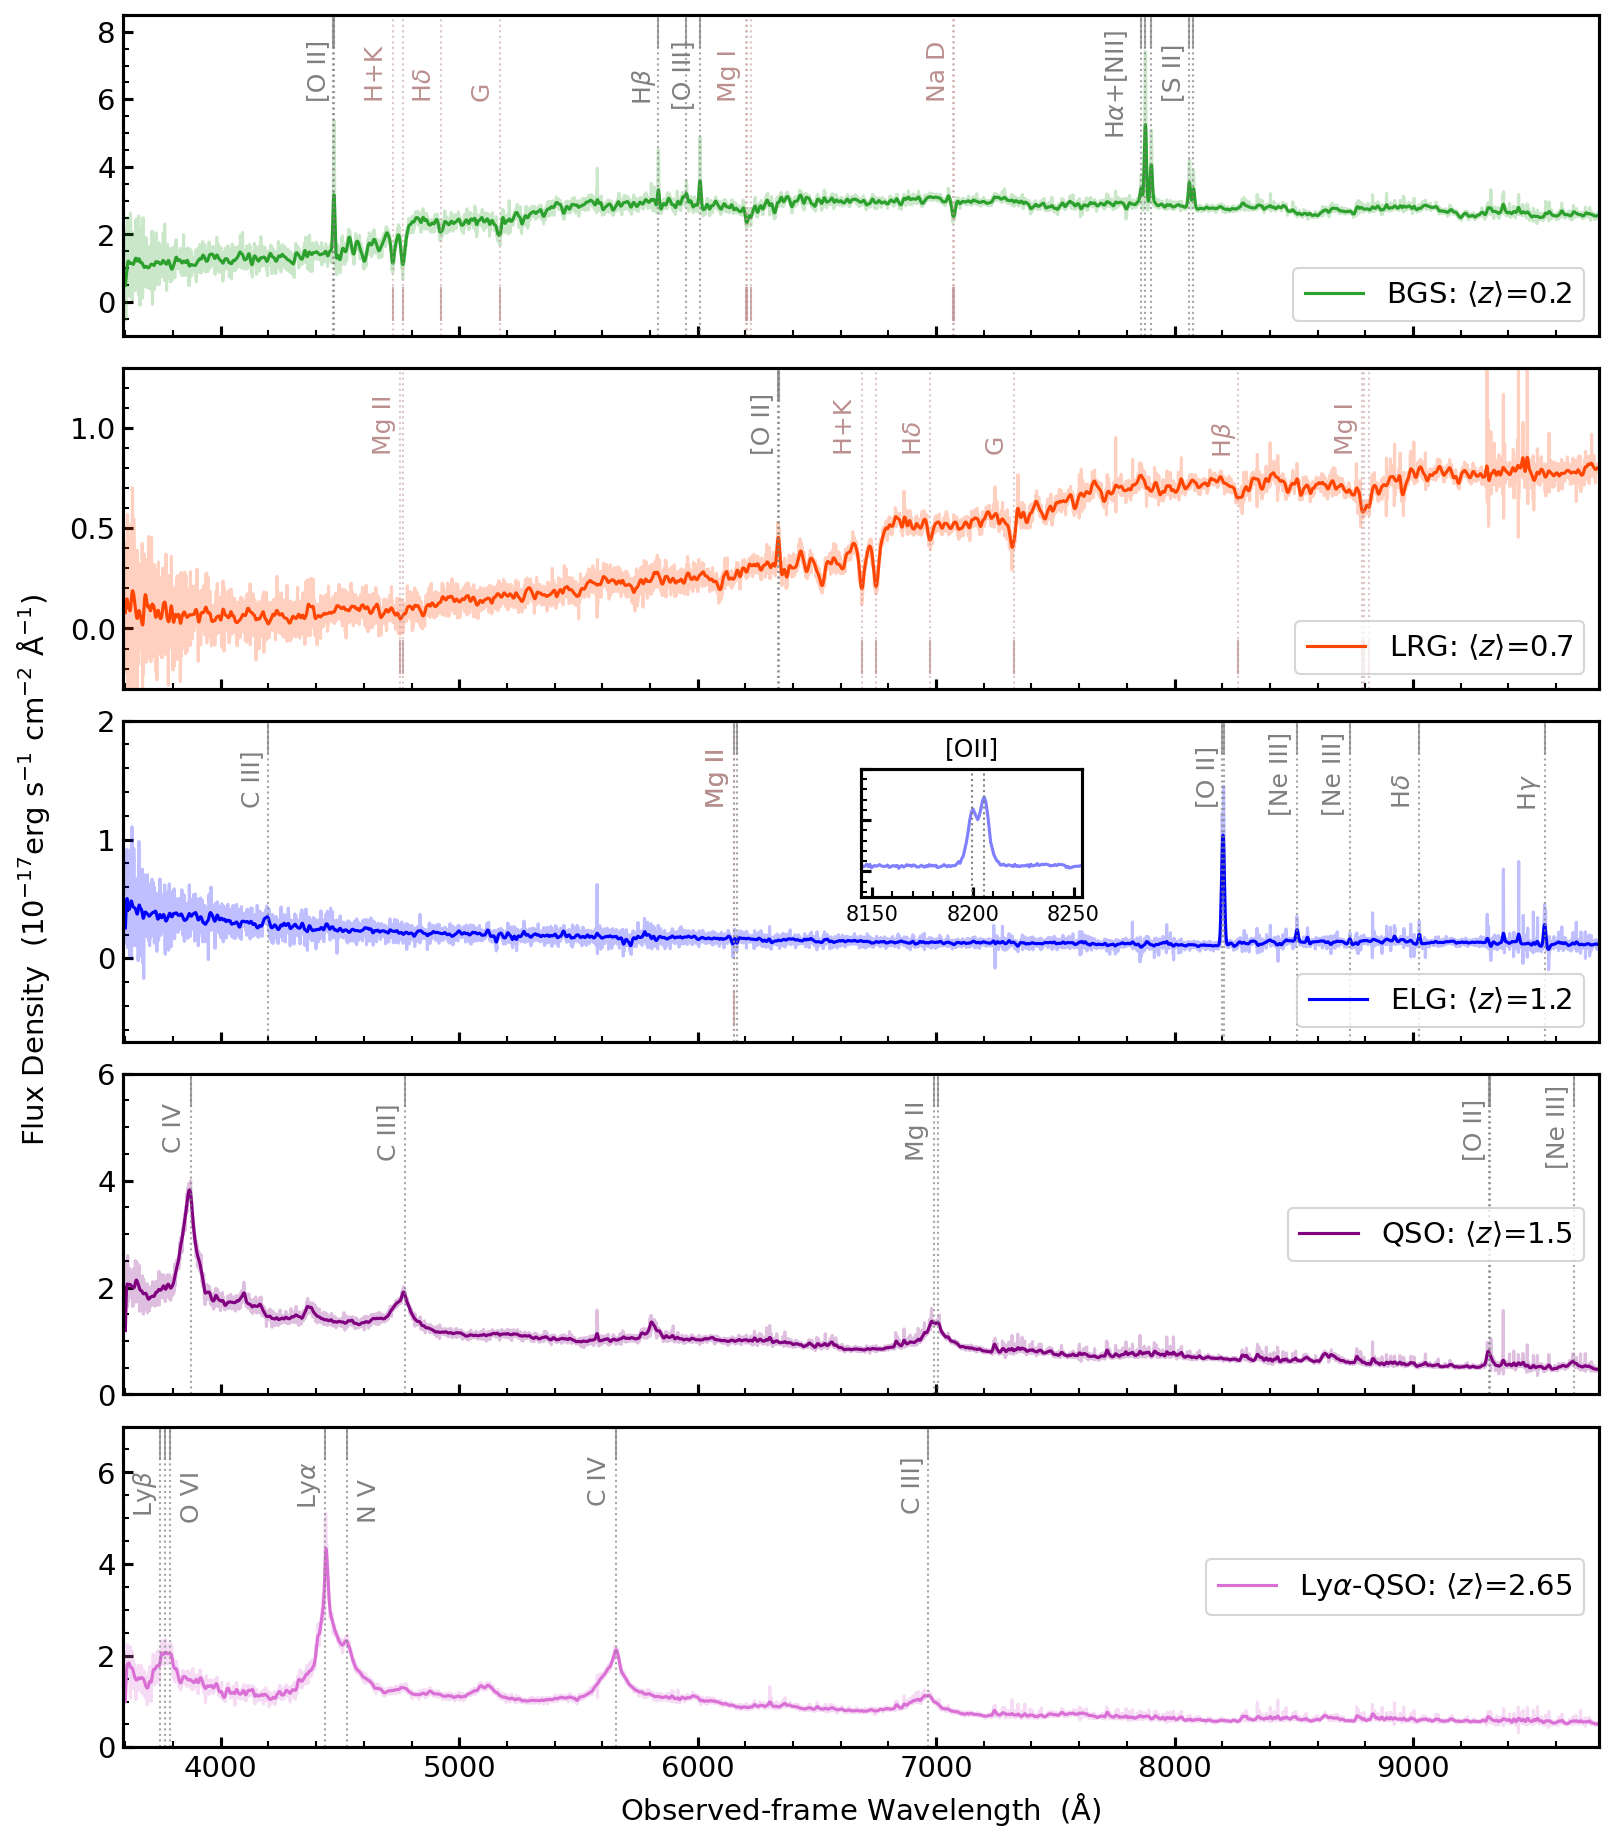
Table 7 summarizes the exact number of unique, well-measured redshifts in DR1. In this table we show the detailed breakdown of the number of good redshifts as a function of target class (including secondary, SCND, targets; see §§1.1 and 2.2), and the full set of observational programs included in DR1 (see §2.3). In addition, the last column gives the total number of good redshifts within each program, although we emphasize that this total cannot be derived from the sum of the preceding columns because it includes objects which may belong to one or more (or none) of the listed target classes.
Finally, in Figure 7 we show examples of coadded spectra for each of the primary extragalactic target classes.
3.3 Data Products
In this section we provide a high-level overview of the organizational (directory) structure of the data included in DR1 (see §4 for information regarding how the data can be accessed). For a complete description of all the directories and files in DR1, as well as their provenance and inter-dependencies, please see the DESI data model.171717https://desidatamodel.readthedocs.io
Table 8 shows key elements of the DR1 file and directory structure and relative locations, and the number of files and total size in terabytes. Most users will be interested in the data and catalogs in spectro/redux/iron/181818As discussed in §1.2, Iron is the primary spectroscopic production for DR1., the LSS catalogs in survey/catalogs/dr1/LSS/ (see §3.4), and the VACs in vac/dr1/ (see §3.5 and Appendix F).
In the top-level production directory, spectro/redux/iron/tiles-iron.fits contains a catalog of all DESI tiles included in Iron. This file can be used to quickly assess the observational footprint of DR1, and to filter the set of tiles by survey (SURVEY) or program (PROGRAM). Because tiles may be observed on multiple exposures spanning multiple nights (see §2.3), more detailed per-exposure information can be found in the spectro/redux/iron/exposures-iron.fits file, for example, for time-domain studies or for comparisons of systematic differences of data obtained on different nights.
In §3.3.1 we describe the organization of the spectra, coadds, and lower-level (per-observation) redshift files, and in §3.3.2 we describe the merged redshift catalogs, which are joined across different combinations of DESI surveys and programs. In addition, §3.3.3 describes specific updates to the parent target catalogs used for DR1 observations. For additional information and descriptions of the other kinds of files available in DR1, such as the fiber assignment and parent photometric-target catalogs, please see DESI Collaboration et al. (2024b) and the DESI data model.
Finally, Appendix E documents known problems and other caveats regarding the data released in DR1.
| Size | No. of | ||
|---|---|---|---|
| Directory | (TB) | Files | Description |
| spectro/ | 266 | 5,921,713 | All spectroscopic data |
| data/ | 23 | 234,530 | Raw data |
| redux/ | Reduced data | ||
| iron/ | 212 | 4,907,360 | Iron spectroscopic production |
| tiles-iron.fits | 1 | Unique list of tiles | |
| exposures-iron.fits | 1 | Unique list of exposures | |
| exposures/ | 61 | 2,435,160 | Intermediate processing files per exposure |
| healpix/ | 34 | 565,037 | Spectra and redshifts grouped by HEALPix |
| tiles/ | Spectra and redshifts grouped by TILEID | ||
| cumulative/ | 35 | 909,161 | Spectra and redshifts coadded across all nights |
| pernight/ | 7.9 | 155,299 | Spectra and redshifts coadded within a night |
| zcatalog/ | |||
| v1/ | 0.103 | 51 | Merged redshift catalogs |
| guadalupe/ | 31 | 769,219 | Like iron/ but for the Guadalupe production |
| survey/ | Survey operations and LSS catalog files | ||
| catalogs/ | |||
| dr1/ | |||
| LSS/ | 4.4 | 1,280 | Large-scale structure catalogs |
| QSO/ | 2 | QSO catalogs | |
| target/ | |||
| catalogs/ | 21 | 61,614 | Input target catalogs |
| fiberassign/ | 0.062 | 29,020 | Fiber assignment catalogs for each TILEID |
| vac/ | |||
| dr1/ | 11 | 824,203 | Contributed value-added catalogs |
Note. — Please see the DESI data model documentation at https://desidatamodel.readthedocs.io for more details regarding the directory and subdirectory structure listed in this table, individual file formats, and additional directories and files not listed here used by the DESI pipeline, including calibration files.
3.3.1 Spectra, Coadds, and Redshifts
Per-exposure spectra, coadded spectra (coadds), redshifts, and after-burner catalogs are organized into two broad groups or categories: per-tile and “healpix”. Tile-based spectra can be found in spectro/redux/iron/tiles/; these spectra combine information across multiple exposures of the same tile, but not across different tiles (even if the same target was observed on multiple tiles; see §1.2). Meanwhile, healpix coadds combine all the available exposures of targets observed on different tiles into a given HEALPix pixel on the sky (nested scheme, using NSide=64; Górski et al., 2005; Zonca et al., 2019); healpix coadds can be found under spectro/redux/iron/healpix/.
In the case of both the tile-based and healpix coadds, data are not combined across surveys (SV1, SV2, SV3, main, special) or programs (bright, dark, backup). This decision is driven by the desire to prioritize the uniformity of the data in each survey/program combination (but see the ZCAT_PRIMARY flag described in §3.3.2). In general, we expect most users to utilize the HEALPix-grouped spectra and redshifts, while the tile-based results will be used for more specialized (including cosmological) analyses.
We organize healpix-grouped outputs in subdirectories by HEALPix number; however, in order to avoid having tens of thousands of subdirectories at the same level, these subdirectories are additionally grouped by integers given by int(healpix/100). For example, all SURVEY=main, PROGRAM=dark data for targets in nested NSide=64 HEALPix number 31542 can be found in spectro/redux/iron/healpix/main/dark/315/31542/. The files in this directory include the per-exposure (uncoadded) spectra, coadded spectra (across exposures but not across cameras), Redrock redshift fits and classifications, and the outputs from the pipeline after-burner algorithms (described in §3.1.2).
Meanwhile, tile-based spectra, coadds, redshifts, and after-burner catalogs contain the same set of files, but are organized differently in additional subgroups under spectro/redux/iron/tiles/ (see Table 8). The cumulative/ directory tree contains all data for each tile, coadded across exposures and nights, while the pernight/ directory tree combines data within a night but not across nights, enabling reproducibility studies of the same targets observed under different conditions on different nights.191919For the Iron spectroscopic production, the pernight grouping was only created for SV tiles, not main-survey tiles. Finally, if a tile was only observed on a single night, the contents of the cumulative/ and pernight/ directories are effectively identical, but they are still kept in both directories so that each can be used independently.
3.3.2 Merged Redshift Catalogs
Merged redshift catalogs, combined across thousands of smaller, individual files and catalogs, can be found in spectro/redux/iron/zcatalog/v1/. Like the spectra and coadds described in §3.3.1, these catalogs come in multiple groups, for example, combining all the cumulative, tile-based redshifts for a given survey and program into a single file, with different files for different survey/program combinations. Future data releases may include v2 (or higher) version numbers with a modified data model optimized for the increasingly large catalogs. In general, we recommend using the highest version number available, which is v1 in the case of DR1.
For analyses seeking the “best” redshift for a given target, regardless of the DESI-specific survey/program combination, we recommend the zall-pix-iron.fits file, which combines all the HEALPix-based redshifts across all surveys and programs into a single file. The “best” redshift can be retrieved using the ZCAT_PRIMARY boolean column, which is derived using the Python script desispec.zcatalog.find_primary_spectra.202020https://github.com/desihub/desispec/blob/0.60.2/py/desispec/zcatalog.py#L58 This same script can be adopted to subselect multiply-observed targets from a custom selection of spectra to determine the recommended redshift. Similarly, the zall-tilecumulative-iron.fits file provides all cumulative, tile-based redshifts across all surveys and programs, with ZCAT_PRIMARY indicating the recommended best single tile-based redshift per target.
3.3.3 Parent Target Catalogs
Target catalogs used as input for DESI observations were previously published in the Early Target Selection (ETS) release described in Myers et al. (2023a) and included as part of the EDR.212121https://data.desi.lbl.gov/public/edr/target The photometric catalogs from which primary DESI targets have been selected remain unchanged relative to the EDR and can be found in the target/catalogs directory tree (see Table 8). Meanwhile, some catalogs of secondary222222https://data.desi.lbl.gov/public/dr1/target/catalogs/dr9/1.3.0 and calibration232323https://data.desi.lbl.gov/public/dr1/target/catalogs/dr9/2.2.0 targets have been updated between the ETS and DR1 in a manner consistent with the schemas described in §3.2, §4.3 and §4.4 of Myers et al. (2023a). Additional details regarding secondary targets can be found in Appendix C; in addition, some random catalogs (see §4.5.1 of Myers et al., 2023a) were repackaged into HEALPix (Górski et al., 2005) pixels to simplify LSS analyses, and these are also included as part of DR1.242424https://data.desi.lbl.gov/public/dr1/target/catalogs/dr9/2.4.0
3.4 Large-Scale Structure Catalogs
Together with the raw and intermediate DESI data, DR1 includes all the LSS catalogs needed to reproduce the DR1 clustering and cosmology analyses, including the BAO measurements (DESI Collaboration et al., 2024d), the full-shape analyses (DESI Collaboration et al., 2024f), and the derivation of the baseline cosmological constraints from the four extragalactic DESI tracers (BGS, LRG, ELG, and QSO; DESI Collaboration et al., 2025b). For complete details regarding the sample definitions and characteristics of the LSS clustering catalogs in DR1, see DESI Collaboration et al. (2024c) and Ross et al. (2025). Here, we briefly summarize the broad organizational structure of the LSS catalogs, and how they can be accessed (see also Table 8).
| VersionaaVersion of the LSS pipeline used to generate the catalogs. | Description | References | Software Tag |
|---|---|---|---|
| v1.2 | Baseline used in DR1 BAO analysis and cosmological results. | DESI Collaboration et al. (2024d, 2025b) | v1.2-DR1 |
| v1.5 | Minor bug fixes; should be used for all clustering measurements at scales greater than the fiber patrol radius (.) | DESI Collaboration et al. (2024f); Chaussidon et al. (2024) | v1.5-DR1 |
Unlike in the EDR, where the LSS catalogs were released as a VAC (see §4 of DESI Collaboration et al. 2024b), the LSS catalogs in DR1 can be found under the survey/catalogs/dr1/LSS directory (see §3.3 and Table 8). This directory contains all the auxiliary files defining the DR1 tiles, potential assignments for 18 random catalogs, and the input redshifts from the Iron spectroscopic production.
The ready-to-use clustering catalogs and associated randoms are available in survey/catalogs/dr1/LSS/iron/LSScats. In this directory, there are two distinct versions of these catalogs, v1.2 and v1.5 (see Table 9). A discussion of the differences between these versions can be found in Appendix B of DESI Collaboration et al. (2024c).
In addition, we publish all the initial and intermediate data-products needed to process the DESI data with the DESI LSS pipeline.252525https://github.com/desihub/LSS We list the specific tag of the pipeline used to produce each version of the LSS catalogs in the last column of Table 9. The LSS pipeline and these software tags are described in Ross et al. (2025), while the content and column descriptions of all the LSS files can be found at the DESI data model documentation.262626https://desidatamodel.readthedocs.io
Data containing the information on 128 alternative realizations of the DR1 fiber-assignment history (used, e.g., to determine pairwise inverse probability, PIP, weights for 2-point clustering measurements; see Lasker et al. 2025 and Bianchi et al. 2024), together with the catalog version v1.5pip described in Appendix C of DESI Collaboration et al. (2024c), will be published in the near future.
Finally, dedicated mocks to assess the quality of the data, the completeness weights, and to derive covariance matrices, will be published at a later time using a similar directory structure and data model.
3.5 Value-Added Catalogs
| VAC Name | Description |
|---|---|
| General VACs | |
| LS/DR9 Photometry | Merged targeting catalogs and Legacy Surveys DR9 Tractor photometric |
| catalogs for all observed and potential DESI targets. | |
| Sky Spectra | Exemplar sky spectra with detailed metadata from the DESI pipeline. |
| Milky Way Survey (MWS) | |
| MWS | Analysis of stellar spectra by the MWS Working Group. |
| MWS BHB | Catalog of spectroscopically confirmed blue horizontal branch (BHB) stars |
| (Byström et al., 2024). | |
| MWS SpecDis | Spectrophotometric distances for million stars in DR1 predicted using a neural network trained on stellar spectra (Li et al., 2025). |
| SPDist | Spectrophotometric distances for all stars observed by the MWS predicted using a multi-layer perceptron trained on a selection of stellar parameters. |
| Stellar Reddening | Spectra and catalog of stars used in dust reddening measurements (Zhou et al., 2024). |
| Extragalactic Science | |
| DESI HETDEX | HETDEX and DESI spectra for Hobby-Eberly Telescope Dark Energy Experiment (HETDEX) Ly emitter candidates observed by DESI (Landriau et al., 2025). |
| DESIVAST | Cosmic voids identified within the DESI DR1 volume (Rincon et al., 2024). |
| Dwarf Galaxy | Extragalactic dwarf galaxies identified in DESI DR1. |
| EmFit | Emission-line fitting results for galaxies (Pucha et al., 2024, Pucha et al. 2025, in preparation). |
| FastSpecFit | Spectrophotometric fitting results from the FastSpecFit stellar continuum and |
| emission-line modeling code. | |
| Extended Halo-based Group | Halo-based group catalog based on Legacy Surveys DR9 for -band apparent magnitude galaxies. |
| Mass EMLines | Stellar mass and emission line measurements for galaxies in DR1 (Zou et al., 2024). |
| Strong Lensing | Catalog of spectroscopic observations of strong lenses observed in DESI DR1. |
| Quasar Science | |
| AGN/QSO Summary | AGN and QSO identifications for all target classes in DESI DR1 (Juneau et al. 2025, in preparation). |
| AGN Host Properties | Stellar masses and other physical properties from spectral energy distribution |
| modeling which includes AGN templates (Siudek et al., 2024). | |
| BHMass | Iron-corrected supermassive black hole masses based on Mg II at |
| (Pan et al., 2025). | |
| DLA NN and GP Finder | DLA parameters and detections using the NN and GP DLA finders (Wang et al., 2022; Ho et al., 2020). |
| DLA Template Finder | DLA parameters and detections using DLA Toolkit (Brodzeller et al. 2025, in preparation). |
| MgII Absorber | Summarized information of Mg II absorption systems in DESI quasars (Napolitano et al., 2023). |
| ZLyA | Updated redshifts and BAL information used in the Ly Y1 BAO analysis (DESI Collaboration et al., 2025a). |
| Ly Forest | |
| Ly Forest Y1 Deltas | Measured flux-transmission field used in the Ly Y1 BAO analysis (DESI Collaboration et al., 2025a). |
| Ly Forest Y1 Correlations | Measured correlations, distortion matrices and covariances used for the |
| Ly Y1 BAO analysis (DESI Collaboration et al., 2025a). | |
Each DESI data release includes multiple VACs, which are additional data products, catalogs, and documentation contributed by members of the DESI science collaboration. These VACs are built upon the core data products (spectra, classifications, redshifts) from this data release, and include additional data useful for a variety of scientific analyses. DR1 includes a total of 24 distinct VACs at the date of the public data release, although additional VACs may be added to DR1 following this date. The most up-to-date list of VACs and their associated documentation and references can be found online at the public DESI website.272727https://data.desi.lbl.gov/doc/vac
4 Data Access
In this section we provide a brief overview of how to access DR1. At the time of this writing, DESI catalogs and spectra can be accessed via file download (§4.1) or a searchable database (§4.2). We demonstrate these access methods, as well as techniques for exploring and manipulating DESI data, through a variety of tutorials and examples (§4.3). The DESI collaboration may deploy additional data-access methods in the future, such as web services designed for interactive data exploration or interfaces enabling users to download individual spectra or custom collections of spectra. The latest information on how to access DESI data can always be found in the DESI documentation.282828https://data.desi.lbl.gov/doc/access
All DESI data are released under the Creative Commons Attribution 4.0 International License.292929https://creativecommons.org/licenses/by/4.0 This license allows users to share, copy, redistribute, adapt, transform, and build upon the DESI data for any purpose, including commercially, as long as attribution is given by citing this paper and including the complete text of the DESI acknowledgment.303030https://data.desi.lbl.gov/doc/acknowledgments
4.1 File Access
The DR1 data directory tree and individual files can be explored and downloaded directly from https://data.desi.lbl.gov/public/dr1, following the basic structure illustrated in Table 8. For efficient bulk-download of files, we provide (and recommend) the Globus313131https://globus.org endpoint called “DESI Public Data.” Finally, for individuals with access to NERSC, e.g., through other U.S. Department of Energy-sponsored programs, the same files are directly available without any restriction relative to the following top-level directory: $CFS_DIR/desi/public/dr1/.
The complete DR1 dataset occupies more than 280 TB of storage. To optimize the use of resources, we strongly recommend that users exercise discretion when downloading data and select only the data essential for their specific analysis.
We anticipate that the majority of users will initiate their data exploration with one of the merged redshift catalogs, spectro/redux/iron/zcatalog/v1/ (containing all objects) or survey/catalogs/dr1/LSS/ (containing objects used in DESI cosmological anlyses), as described in §3.3.2 and §3.4, respectively. Subsequently, users can further refine their data selection by focusing on the objects of particular interest. Once the selection has been defined, users can proceed to download only the files containing spectra relevant to their analysis (see §4.3).
4.2 Database Access
When available, databases can provide users with a more flexible and light-weight approach to search vast amounts of data compared to downloading large files. For convenience, catalog-level data—containing target photometry, fiber-assignments, exposure metadata, spectral classifications, and redshift information—are accessible through a searchable PostgreSQL database.323232https://www.postgresql.org Detailed information about the structure of the tables and access credentials for NOIRLab’s Astro Data Lab and NERSC can be found in the DESI documentation portal.333333https://data.desi.lbl.gov/doc/access/database
NOIRLab’s Astro Data Lab platform offers anonymous public access343434https://datalab.noirlab.edu/desi to DESI data via a web-query interface and a Table Access Protocol (TAP) handle.353535TAP-aware clients such as TOPCAT (Taylor, 2005) can point to https://datalab.noirlab.edu/tap and select the desi_dr1 database. Additionally, the Astro Data Lab platform offers authenticated access via a JupyterLab363636https://jupyter.org/ server, as well as access to the full-depth DESI spectra through the SPectra Analysis and Retrievable Catalog Lab (SPARCL373737https://astrosparcl.datalab.noirlab.edu), which features a spectral database with a programmatic interface (Juneau et al., 2024b). The subset of spectra available via SPARCL is limited to the 18.7M healpix-coadded spectra (see §3.3.1) that have been combined across cameras. Other types of spectra and files are available at the file-based archive at NERSC previously described in §4.1.
Finally, individuals with NERSC access can query the DESI database using SQL, or they can utilize the pre-installed specprodDB383838https://github.com/desihub/specprod-db Python code, which provides convenient SQLAlchemy (Bayer, 2012) wrapper objects, indexed using q3c (Koposov & Bartunov, 2006, 2019), for rapid, streamlined data-access and manipulation.
4.3 Tutorials
The DESI collaboration creates and maintains a variety of tutorials in the form of Jupyter notebooks (Kluyver et al., 2016; Juneau et al., 2021). These tutorials are intended to facilitate the introduction of various data products and methods for accessing them and are arranged into thematic and topical sub-directories. Due to the significant data volume and complexity, these tutorials may be used as an entry point to get started with DESI data access and analysis. The main GitHub repository for DESI tutorials is located at: https://github.com/desihub/tutorials.
As additional tutorials become available, the DESI documentation will be updated accordingly.393939https://data.desi.lbl.gov/doc/tutorials/
5 Summary
This paper presents DESI DR1, the second major public release of DESI data, following the DESI EDR in 2023 June (DESI Collaboration et al., 2024a, b). DR1 includes all the data obtained by DESI during its first 13 months of science operations (2021 May 14 through 2022 June 13), roughly spanning the first year of its 5-year, 14,000 deg2 spectroscopic survey, as well as an improved and uniform reprocessing of all SV data previously released in the EDR.
The DR1 main survey includes high-quality redshifts for approximately 18.7M unique objects, of which 13.1M are spectroscopically classified as galaxies, 1.6M are quasars, and 4M are stars. Viewed another way, 5.9M of the objects in DR1 are BGS targets observed over deg2 in the bright-time program; 2.6M, 3.9M, and 1.3M are LRG, ELG, and QSO targets, respectively, observed over deg2 in the dark-time program; 3.6M are MWS stars observed as part of the bright-time, dark-time, and backup programs; and the remaining 1.4M objects are secondary, tertiary, and other classes of objects observed as part of a variety of new, bespoke science drivers. By way of comparison, we estimate that DESI DR1 contains high-fidelity redshifts for more unique extragalactic objects than all previous SDSS surveys combined by nearly a factor of four.
We summarize the observations contained in DR1 across all surveys and programs, and include a high-level overview of the DESI target-selection algorithms and a description of how DESI carries out the survey on the timescale of days, months, and years. We estimate that the bright- and dark-time main-survey programs are 41.3% and 29.0% complete, respectively, based on the data in DR1. We also describe the basic data-reduction, redshift-fitting, and spectroscopic classification algorithms, and show the distribution of targets with well-measured redshifts in celestial coordinates and in redshift.
By all metrics, DESI outperformed expectations during its first year of science operations and is well ahead of schedule. By the end of its 5-year survey, we estimate that DESI will have measured precise redshifts for approximately 50M unique galaxies and quasars and 25M stars in the Milky Way Galaxy.
Finally, we document how the data are organized and can be accessed publicly. The data being released in DR1 include not only individual and coadded spectra and redshift catalogs, but also the LSS catalogs used in all the DESI year-one cosmological analyses and more than 20 VACs spanning a broad range of classes of objects and scientific scope.
All the figures and key statistics in this paper have been produced using DR1 files and Jupyter notebooks and Python code kept in https://github.com/desihub/dr1paper.
Appendix A Guadalupe Spectroscopic Production
DR1 includes Guadalupe as a supplementary spectroscopic production, covering 653 tiles observed in the first two months of the DESI main survey from 2021 May 14 through 2021 July 9. It was run at the same time and using the same software tags as the Fuji production of the SV data which was released in the EDR (see Table 1; DESI Collaboration et al., 2024b). The purpose of Guadalupe was to provide a standardized dataset for early DESI main-survey analyses (see §1.2). We include Guadalupe in DR1 in support of those early publications, but in all other regards it is superseded by the Iron spectroscopic production and is not recommended for any new work.
The only code and data model difference with respect to the Fuji data described in DESI Collaboration et al. (2024b) are bug fixes to coadded metadata quantities in the redshift catalogs. The original catalogs, equivalent to Fuji, were moved to guadalupe/zcatalog/v0/ and the patched catalogs were created in guadalupe/zcatalog/v1/ (see Table 8). See Appendix E for further details regarding these bug fixes, including a list of impacted columns (the redshifts and classifications themselves are unchanged).
For the targets in common between Guadalupe and Iron, redshifts are consistent with a scatter of 1.3 km s-1 and a median offset of km s-1, with fewer than 1% of targets changing status from good to bad; consequently, the core results of the papers that used Guadalupe remain unchanged.
LSS catalogs were constructed from the main-survey tiles included in Guadalupe. The LSS catalog pipeline was at the stage described in DESI Collaboration et al. (2024b) and Moon et al. (2023) presents the choices specific to the Guadalupe LSS catalogs. Referring to the directory tree in Table 8, the Guadalupe LSS catalogs can be found in vac/dr1/lss/guadalupe/v1.0; the data model of these catalogs generally match the Fuji LSS catalogs which were released in the EDR as a VAC (see §4.2 of DESI Collaboration et al. 2024b).
Appendix B Primary Targets
This appendix outlines the primary targeting bit names, values, and descriptions for the DESI main survey. For details about earlier phases of DESI, such as SV1 (Target Selection Validation) and SV3 (One-Percent Survey), see the appendix of DESI Collaboration et al. (2024b).
Main survey bitmasks are recorded in fibermap columns DESI_TARGET, BGS_TARGET, and MWS_TARGET.404040Bitmasks such as SV3_DESI_TARGET (Myers et al., 2023a) are also typically present in the fibermap, but will be zero for Main Survey targets. Similarly, DESI_TARGET will be zero for other survey types. Table 11 lists the DESI_TARGET bits for dark-time targets and calibration targets such as standard stars and sky locations. Table 12 lists the BGS_TARGET bits for the Bright Galaxy Survey. Table 13 lists the MWS_TARGET bits for Milky Way Survey targets, together with some bits that represent calibration targets derived solely from Gaia instead of from Legacy Surveys imaging. These target selection bits are also defined programmatically in the open-source desitarget414141https://github.com/desihub/desitarget software package (Myers et al., 2023b). A YAML-format file describing the bits is in subdirectory py/desitarget/data/targetmask.yaml, with convenience wrapper objects in the Python module desitarget.targetmask. Examples of accessing these bitmasks using this code can be found in §2 of Myers et al. (2023a).
| Bit-name | Bit-value | Description |
|---|---|---|
| LRG | 0 | LRG |
| ELG | 1 | ELG |
| QSO | 2 | QSO |
| QSO_HIZ | 4 | QSO selected using high-redshift Random Forest |
| ELG_LOP | 5 | ELG at standard (ELG) priority |
| ELG_HIP | 6 | ELG randomly increased to higher (LRG) priority |
| ELG_VLO | 7 | Very-low priority ELG (filler) |
| LRG_NORTH | 8 | LRG cuts tuned for Bok/Mosaic data |
| ELG_NORTH | 9 | ELG cuts tuned for Bok/Mosaic data |
| QSO_NORTH | 10 | QSO cuts tuned for Bok/Mosaic data |
| ELG_LOP_NORTH | 11 | ELG at standard (ELG) priority tuned for Bok/Mosaic data |
| ELG_VLO_NORTH | 12 | Very-low priority ELG (filler) tuned for Bok/Mosaic data |
| LRG_SOUTH | 16 | LRG cuts tuned for DECam data |
| ELG_SOUTH | 17 | ELG cuts tuned for DECam data |
| QSO_SOUTH | 18 | QSO cuts tuned for DECam data |
| ELG_LOP_SOUTH | 19 | ELG at standard (ELG) priority tuned for DECam data |
| ELG_VLO_SOUTH | 20 | Very-low priority ELG (filler) tuned for DECam data |
| SKY | 32 | Blank sky locations |
| STD_FAINT | 33 | Standard stars for dark conditions |
| STD_WD | 34 | White dwarf stars |
| STD_BRIGHT | 35 | Standard stars for bright conditions |
| BAD_SKY | 36 | Blank sky locations that are imperfect but still useable |
| SUPP_SKY | 37 | SKY is based on Gaia-avoidance (SKY will be set, too) |
| NO_TARGET | 49 | No known target at this location |
| BRIGHT_OBJECT | 50 | Known bright object to avoid |
| IN_BRIGHT_OBJECT | 51 | Too near a bright object; DO NOT OBSERVE |
| NEAR_BRIGHT_OBJECT | 52 | Near a bright object but okay to observe |
| BGS_ANY | 60 | Any BGS bit is set |
| MWS_ANY | 61 | Any MWS bit is set |
| SCND_ANY | 62 | Any secondary bit is set |
Note. — Bits are stored in the desi_mask and accessed via the DESI_TARGET column (for more details see Myers et al. 2023a).
| Bit-name | Bit-value | Description |
|---|---|---|
| BGS_FAINT | 0 | BGS faint targets |
| BGS_BRIGHT | 1 | BGS bright targets |
| BGS_WISE | 2 | BGS WISE targets |
| BGS_FAINT_HIP | 3 | BGS faint targets at bright priority |
| BGS_FAINT_NORTH | 8 | BGS faint cuts tuned for Bok/Mosaic |
| BGS_BRIGHT_NORTH | 9 | BGS bright cuts tuned for Bok/Mosaic |
| BGS_WISE_NORTH | 10 | BGS WISE cuts tuned for Bok/Mosaic |
| BGS_FAINT_SOUTH | 16 | BGS faint cuts tuned for DECam |
| BGS_BRIGHT_SOUTH | 17 | BGS bright cuts tuned for DECam |
| BGS_WISE_SOUTH | 18 | BGS WISE cuts tuned for DECam |
Note. — Bits are stored in the bgs_mask and accessed via the BGS_TARGET column (see Myers et al. 2023a for more details).
| Bit-name | Bit-value | Description |
|---|---|---|
| MWS_BROAD | 0 | MWS magnitude-limited bulk sample |
| MWS_WD | 1 | MWS white dwarf |
| MWS_NEARBY | 2 | MWS volume-complete 100 pc sample |
| MWS_BROAD_NORTH | 4 | MWS cuts tuned for Bok/Mosaic |
| MWS_BROAD_SOUTH | 5 | MWS cuts tuned for DECam |
| MWS_BHB | 6 | MWS Blue Horizontal Branch stars |
| MWS_MAIN_BLUE | 8 | MWS magnitude-limited blue sample |
| MWS_MAIN_BLUE_NORTH | 9 | MWS magnitude-limited blue sample tuned for Bok/Mosaic |
| MWS_MAIN_BLUE_SOUTH | 10 | MWS magnitude-limited blue sample tuned for DECam |
| MWS_MAIN_RED | 11 | MWS magnitude-limited red sample |
| MWS_MAIN_RED_NORTH | 12 | MWS magnitude-limited red sample tuned for Bok/Mosaic |
| MWS_MAIN_RED_SOUTH | 13 | MWS magnitude-limited red sample tuned for DECam |
| MWS_FAINT_BLUE | 14 | MWS faint extension, blue side |
| MWS_FAINT_BLUE_NORTH | 15 | MWS faint extension, blue side (Bok/Mosaic) |
| MWS_FAINT_BLUE_SOUTH | 16 | MWS faint extension, blue side (DECam) |
| MWS_FAINT_RED | 17 | MWS faint extension, red side |
| MWS_FAINT_RED_NORTH | 18 | MWS faint extension, red side (Bok/Mosaic) |
| MWS_FAINT_RED_SOUTH | 19 | MWS faint extension, red side (DECam) |
| GAIA_STD_FAINT | 33 | Gaia-based standard stars for dark conditions |
| GAIA_STD_WD | 34 | Gaia-based white dwarf stars |
| GAIA_STD_BRIGHT | 35 | Gaia-based standard stars for bright conditions |
| BACKUP_GIANT_LOP | 58 | Giant candidate backup targets |
| BACKUP_GIANT | 59 | Giant candidate backup targets |
| BACKUP_BRIGHT | 60 | Bright backup Gaia targets |
| BACKUP_FAINT | 61 | Fainter backup Gaia targets |
| BACKUP_VERY_FAINT | 62 | Even fainter backup Gaia targets |
Note. — Bits are stored in the mws_mask and accessed via the MWS_TARGET column (see Myers et al. 2023a for more details).
Appendix C Secondary Targets
In addition to its primary science goals, the DESI survey incorporates a range of “secondary” targets to pursue bespoke research (see §2.2). In this appendix, we describe the secondary target campaigns included in the main survey and outline how the bit-values in their scnd_mask and SCND_TARGET column (see §2.4 of Myers et al., 2023a) can be linked back to the relevant program.424242Bitmasks such as SV3_SCND_TARGET (Myers et al., 2023a) are also typically present in the fibermap, but will be zero for main-survey targets. Similarly, SCND_TARGET will be zero for other survey types.
In Table 14 we list the bit-names and bit-values for secondary targets that were scheduled for observation during the DESI main survey. The vast majority of these secondary targeting programs are documented in Appendix B of DESI Collaboration et al. (2024b). Below, we describe the new programs that were added for the main survey. Further scientific justification for many of these new programs can be found in the MWS overview paper (Cooper et al., 2023). Details about the selection of each type of secondary target are also available at the associated docs link for main survey secondary targets.434343https://data.desi.lbl.gov/public/edr/target/secondary/main/docs
| Bit-name | Bit-value | Bit-name | Bit-value |
|---|---|---|---|
| VETO | 0 | WISE_VAR_QSO | 35 |
| UDG | 1 | Z5_QSO | 36 |
| FIRST_MALS | 2 | MWS_RR_LYRAE | 37 |
| QSO_RED | 5 | MWS_MAIN_CLUSTER_SV | 38 |
| MWS_CLUS_GAL_DEEP | 10 | BRIGHT_HPM | 40 |
| LOW_MASS_AGN | 11 | WD_BINARIES_BRIGHT | 41 |
| FAINT_HPM | 12 | WD_BINARIES_DARK | 42 |
| LOW_Z_TIER1 | 15 | PV_BRIGHT_HIGH | 43 |
| LOW_Z_TIER2 | 16 | PV_BRIGHT_MEDIUM | 44 |
| LOW_Z_TIER3 | 17 | PV_BRIGHT_LOW | 45 |
| BHB | 18 | PV_DARK_HIGH | 46 |
| SPCV | 19 | PV_DARK_MEDIUM | 47 |
| DC3R2_GAMA | 20 | PV_DARK_LOW | 48 |
| PSF_OUT_BRIGHT | 25 | GC_BRIGHT | 49 |
| PSF_OUT_DARK | 26 | GC_DARK | 50 |
| HPM_SOUM | 27 | DWF_BRIGHT_HI | 51 |
| SN_HOSTS | 28 | DWF_BRIGHT_LO | 52 |
| GAL_CLUS_BCG | 29 | DWF_DARK_HI | 53 |
| GAL_CLUS_2ND | 30 | DWF_DARK_LO | 54 |
| GAL_CLUS_SAT | 31 | BRIGHT_TOO_LOP | 59 |
| MWS_FAINT_BLUE | 32 | BRIGHT_TOO_HIP | 60 |
| MWS_FAINT_RED | 33 | DARK_TOO_LOP | 61 |
| STRONG_LENS | 34 | DARK_TOO_HIP | 62 |
Note. — Bits are stored in the scnd_mask and accessed via the SCND_TARGET column (see Myers et al. 2023a for more details).
C.1 MWS_FAINT_BLUE, MWS_FAINT_RED
C.2 MWS_RR_LYRAE
This bit denotes a target class that is identical to the Gaia DR2 RR Lyrae variable targets (MWS_RR_LYR) described in Appendix B of DESI Collaboration et al. (2024b). These RR Lyrae targets were observed during Target Selection Validation (SURVEY=sv1) but needed to be scheduled at a higher priority for the main survey. Because priority is a bit-specific feature in the context of the desitarget code, a new bit was required to denote the same target class.
C.3 GC_BRIGHT, GC_DARK
Primary target selections typically mask out sources near globular clusters using the Legacy Surveys CLUSTER bit-mask.444444https://www.legacysurvey.org/dr9/bitmasks/ The GC secondary programs are designed to select stars in globular clusters to ameliorate any paucity of DESI targets in these CLUSTER regions. The targets consist of high-probability () cluster members from Vasiliev & Baumgardt (2021). As the GC targets have a very low sky density () they are unlikely to interfere with DESI large scale structure analyses, so they are prioritized just below DESI primary targets and white dwarf targets. The GC_BRIGHT (GC_DARK) sample, intended for observations during bright (dark) time, is limited to (.
C.4 DWF_BRIGHT_HI, DWF_BRIGHT_LO, DWF_DARK_HI, DWF_DARK_LO
The DWF programs are philosophically similar to the GC programs outlined in §C.3, but are designed to target Milky Way satellite galaxies rather than globular clusters. As is the case for the GC programs, the DWF targets cover a relatively small sky area (), so are prioritized just below primary targets. The DWF_BRIGHT_HI and DWF_DARK_HI target classes are scheduled at slightly higher priority than the DWF_BRIGHT_LO and DWF_DARK_LO target classes, which, in turn share the priority of the GC programs. The target sample comprises members of known Milky Way satellite galaxies. The galaxies (see Table 15) are sub-selected to have a -band absolute magnitude mag, a declination north of 30∘, a half-light-radius of , at least 5 member stars in Gaia, and coverage in LS/DR9.
A star is considered a “member” of the relevant galaxy if it is within five (three) half-light-radii of the galactic center if the galaxy’s half-light-radius is . The selection is further refined by cross-matching to Gaia EDR3 (Gaia Collaboration et al., 2022) and restricting to likely members based on parallax and proper motion. For stars that are not in Gaia EDR3, imaging from LS/DR9 is used to estimate whether a target is a member of the appropriate galaxy. A star is assigned to be “high” (HI) or “low” (LO) priority based on whether information from Gaia and the Legacy Surveys implies that it is highly likely to be a member of the appropriate dwarf galaxy. We list the resulting numbers of targets and the area covered by each galaxy in Table 15. Finally, targets are assigned to the BRIGHT or DARK class, intended for observations during bright or dark time if they fall in the magnitude range or , respectively.
| Dwarf | Area | ||
|---|---|---|---|
| Galaxy | () | ||
| aquarius_2 | 16 | 268 | 0.57 |
| bootes_1 | 171 | 358 | 0.78 |
| bootes_2 | 22 | 56 | 0.22 |
| canes_venatici_1 | 141 | 231 | 0.40 |
| canes_venatici_2 | 15 | 24 | 0.05 |
| columba_1 | 6 | 40 | 0.11 |
| coma_berenices_1 | 41 | 176 | 0.69 |
| draco_1 | 1653 | 1913 | 0.73 |
| draco_2 | 25 | 59 | 0.20 |
| hercules_1 | 44 | 434 | 0.69 |
| leo_2 | 342 | 531 | 0.14 |
| leo_4 | 8 | 63 | 0.14 |
| leo_5 | 7 | 11 | 0.02 |
| segue_1 | 25 | 122 | 0.29 |
| segue_2 | 19 | 117 | 0.31 |
| sextans_1 | 1450 | 2482 | 2.14 |
| ursa_major_1 | 52 | 116 | 0.54 |
| ursa_major_2 | 52 | 323 | 1.50 |
| ursa_minor_1 | 2032 | 2680 | 2.63 |
| willman_1 | 8 | 27 | 0.14 |
Note. — and refer to the number of targets in the high-priority (DWF_BRIGHT_HI, DWF_DARK_HI) and low-priority (DWF_BRIGHT_LO, DWF_BRIGHT_LO) programs, respectively.
Appendix D Special Observations
As discussed in §2.3.3, DR1 contains a number of tiles that were dedicated to special observations. These tiles can be identified by having special in the SURVEY column of the DR1 tiles-iron.fits file (see §3.3). The vast majority of science targets for these programs have the SCND_ANY bit set in desi_mask (see Table 11) and the DARK_TOO_LOP or BRIGHT_TOO_LOP bit set in scnd_mask (see Table 14). This is because science targets for rapid-turnaround special tiles are all loosely interpreted to be “Targets of Opportunity.” In this appendix, we briefly describe the DR1 special observations summarized in Table 5.
D.1 backup
The special backup tiles were designed to test the backup program target selection algorithms and implementation before enabling routine observations of the backup program in the main survey (Cooper et al. 2023, Dey et al. 2025, in preparation). These tiles may use different versions of targeting than the eventual main survey backup tiles; consequently, we do not recommend combining special and main survey backup tiles.
D.2 bright
Multiple test tiles were taken in the context of the bright special program for different purposes:
-
•
Tiles 80978 and 80979 were designed to test how successfully DESI could acquire redshifts in very poor conditions, and duplicated the targets observed on standard bright tiles 20655 and 21071. The standard bright tiles and special-program bright tiles were assigned different TILEIDs to prevent inadvertently combining normal good data with the special (intentionally poor) data acquired as part of the special program tiles.
-
•
Tiles 80980 and 80981 were designed to include Targets of Opportunity (see, e.g. §3.2.2 of Myers et al., 2023a) in addition to normal bright targets, in order to test the infrastructure for handling candidate transient sources.
-
•
Tiles 82258–82268 were designed with a variety of updates to the DESI fiber assignment code to attempt to optimize the density of DESI fibers assigned to targets.
D.3 dark
The special dark program also covered tiles with a range of different purposes:
-
•
Tile 80977 was a deep tile designed to study the nature of QSO and ELG contaminants in the Sagittarius Stream (e.g. Lynden-Bell & Lynden-Bell, 1995).
-
•
Tiles 81100 and 81112 were test tiles used to validate the (ultimately adopted) process by which DESI uses nonfunctional positioners to help measure the sky background (see, e.g., §5.6 of Schlafly et al., 2023).
-
•
Tile 82237 was observed after DESI was shut down in the summer of 2021 to test preparedness for returning to normal operations.
D.4 m31
The m31 special tiles were designed to study the properties of the halo of M31. These observations are detailed in Dey et al. (2023).
D.5 odin
The odin special tile targeted Ly emitters (LAEs) and Lyman-break galaxies (LBGs) selected in the COSMOS field (Scoville et al., 2007). The scientific aim of this program was to investigate the capability of DESI to execute future, higher redshift surveys.
D.6 tertiary1
The tertiary1 special tiles obtained spectroscopy for a large fraction of magnitude galaxies in the COSMOS field, in order to provide a very dense and complete set of galaxy redshifts. This program marked the transition from using a variety of names to describe special tiles to incrementing each new special program as a “tertiary” program (see, e.g., Myers et al., 2023a).
Appendix E Known Issues
After the Iron production was finished, several problems were found in the coaddition of target metadata, impacting the FIBERMAP tables in coadd*.fits and redrock*.fits files, which are further propagated into the summary redshift catalogs in spectro/redux/iron/zcatalog/v0/. Note that the underlying spectra, coadded spectra, and redshift fits are not impacted by the following issues, only the metadata about those spectra are impacted. These issues have been fixed in all summary catalogs in spectro/redux/iron/zcatalog/v1/, including both tile- and HEALPix-based versions, and will be correct in future data releases. They have not been fixed in the 200k individual coadd and redrock files.
The following issues in the FIBERMAP metadata are resolved in the v1 catalogs, but not in v0 or the individual files:
-
•
0.03% of targets incorrectly have COADD_FIBERSTATUS=0 even though all of their data are masked. These targets will correctly have ZWARN bit 9 (NODATA) set in the redshift fits. Quality cuts based solely upon COADD_FIBERSTATUS without also cutting on ZWARN will have some contamination. This amounts to roughly 8,500 HEALPix-based entries in the individual files. Users who need COADD_FIBERSTATUS should get that information from the appropriate v1 summary catalog by matching on TARGETID.
-
•
MEAN_FIBER_{RA,DEC}, STD_FIBER_{RA,DEC}, MEAN_DELTA_{X,Y}, RMS_DELTA_{X,Y}, and MEAN_PSF_TO_FIBER_SPECFLUX incorrectly included all exposures, not just those that passed the quality cuts and were used in the coadd. This issue impacts approximately 0.7% of targets. This amounts to roughly 200,000 HEALPix-based entries in the individual files. Users who need these quantities should get that information from the appropriate v1 summary catalog by matching on TARGETID.
-
•
STD_FIBER_RA, the standard deviation of contributing FIBER_RA values, is incorrect for 17% of the targets. This amounts to roughly 4.75 million HEALPix-based entries in the individual files. It only impacts objects that were observed on more than one night, and all FIBER_RA values are correct. Users requiring STD_FIBER_RA should get that information from the appropriate v1 summary catalog by matching on TARGETID.
-
•
Targets that were originally observed under one survey/program and then were later reselected as secondary targets are missing their secondary target bits in the coadded DESI_TARGET, SCND_TARGET, SV1_DESI_TARGET, SV1_MWS_TARGET, and SV1_SCND_TARGET bit masks. This issue impacts 0.0006% of targets. This amounts to less than 200 HEALPix-based entries in the individual files. Those requiring these quantities should get that information from the appropriate v1 summary catalog by matching on TARGETID.
Other known issues that have not been resolved for DR1 include:
-
•
For both EDR and DR1 the coadd resolution matrices are suboptimal due to mis-weighting of the individual resolution matrices. However, these effects only affect spectra that were coadded from more than one exposure and are small, with % of pixels having resolution matrix elements incorrect by more than 0.01, and % of pixels incorrect by more than 0.1. This is generally insignificant but can impact detailed studies of spectra. This is now fixed in the latest version of desispec, which can be used with the Iron spectra files to generate new coadd files with the correct resolution matrices.
-
•
There was a bug in inverse variance estimation during flux calibration of all spectra, which caused the variance of all spectra to be underestimated. The effects are negligible at low signal-to-noise ratio (S/N) per pixel, but become significant at around S/N . At a S/N per pixel of , the underestimation of the uncertainties can be as much as a factor of 5.
-
•
Radial velocity systematics in DR1 main survey backup program data have been identified with a scatter of 2-3 km/s, which occasionally reach values up to 20 km/s, due to limitations in the wavelength calibration during Guadalupe and Iron processing.
-
•
We did not properly account for a change in the string representation of Boolean values between Gaia DR2 and EDR3 (Lindegren et al., 2018; Gaia Collaboration et al., 2022). Due to this oversight, the Gaia DUPLICATED_SOURCE column is always False for DESI targets that derived their values from EDR3. The implication of this is that no source in DESI targeted using Gaia EDR3 (see §4.1.4 of Myers et al. 2023a) would have been masked on DUPLICATED_SOURCE. Almost 2 million sources in the Iron HEALPix-based catalog were selected using Gaia EDR3. Approximately 2.8% of sources in Gaia EDR3 have the DUPLICATED_SOURCE column set, so roughly 56k of the 2M dark-time sources in DR1 may have been unintentionally targeted.
-
•
The QuasarNet afterburner provides Z_NEW computed from Redrock with only the quasar templates using a uniform prior of about its coarse estimated Z_QN. When the redshift prior overlaps with , only the high redshift quasar templates were used. This causes a slight excess of quasars with Z_NEW (the high redshift template lower bound) and an increased ZWARN rate for quasars with . This is propagated to the Z column in the LSS catalogs, impacting % of the quasars in the corresponding redshift range.
-
•
Redshifts for Ly quasars are systematically underestimated with increasing redshift owing to incorrect modeling of the Lyman series optical depth in Redrock, also present for EDR (Wu & Shen, 2023; Bault et al., 2025). The average bias is modest at , but exceeds 100 km/s at . This will be corrected in future releases, but remains present in Iron. The DR1 ZLyA VAC provides corrected redshifts for Ly quasars.
-
•
A calibration problem on petal/spectrograph 9 on night 20211212 led to many incorrect redshifts for fibers 4500–4999 on the 17 tiles observed on that night (8500 spectra, 0.03% of Iron). DR1 includes a supplementary release spectro/redux/reproc_20211212_iron/, produced using the same code tags as Iron but with a better choice of calibration data. All 17 tiles were reprocessed and provided as tile-based redshifts. This includes tile 7733 which was re-observed on 20211215 and thus included in the cumulative coadds for 20211215. All other impacted tiles were last observed on 20211212. HEALPix-based coadds and summary catalogs were not produced for this mini production. The reprocessed data were used for the LSS catalogs, but were not used to replace values in Iron itself.
-
•
FIBER_{RA,DEC} = FIBER_{X,Y} = 0.0 for broken fibers (whose locations cannot be measured) and for fibers whose positions were not measured by the Fiber View Camera on individual exposures. These cases have FIBERSTATUS bit 8 MISSINGPOSITION set.
-
•
In early main survey data, some non-target BAD_SKY locations near bright objects received the same TARGETID despite having different (RA,Dec) locations, and vice-a-versa (i.e., different TARGETID for the same (RA,Dec) on different overlapping tiles). This issue only impacts non-science, non-calibration spectra when a positioner was unable to reach a good target.
-
•
DESINAME, which gives an identifier for DESI objects based on sky location truncated to a precision of arcsseconds, is incorrect in the catalogs and individual files for . Correct DESINAME values can be generated using the modern version of desiutil by calling the function desiutil.names.radec_to_desiname with the object’s TARGET_RA and TARGET_DEC. This issue led to 121,132 incorrect names in the HEALPix-based catalog; or 0.4% of Iron.
-
•
Some stuck positioners from Survey Validation data with TARGETID<0 appear in the tile-based redshift catalogs, but not in the HEALPix-based redshift catalogs.
-
•
Tile 21917 (main survey bright program) has valid FIBER_{X,Y} values, but is missing the focal plane transform in the raw data and thus has FIBER_{RA,DEC} = 0.0. In this case, the TARGET_RA and TARGET_DEC values record the intended target position and the FIBER_{X,Y} and DELTA_{X,Y} values remain valid and were used for quality cuts to set FIBERSTATUS bits 9 BADPOSITION and 10 POORPOSITION if the fiber was away from the intended target.
Finally, the following known issues were present in the previous data release (EDR) and documented in DESI Collaboration et al. (2024b). They remain issues in DR1 and are included here for completeness:
-
•
Redrock templates do not include Active Galactic Nucleus (AGN)-like galaxies with a mixture of broad and narrow lines. As a result, these types of galaxies are often fit equally well (or equally poorly) with either GALAXY or QSO templates at the same redshift, which can also trigger ZWARN bit 2 (value ) for LOW_DELTACHI2 since the difference between the two fits is small, indicating an ambiguous answer.
-
•
There are cases where Redrock is overconfident and reports ZWARN=0, i.e., no known problems, even though the fit is incorrect. This can include unphysical fits due to the over-flexibility of PCA template linear combinations. This is particularly true for sky fibers which have a higher fraction of ZWARN=0 than would be expected from purely random fluctuations. Users should be especially cautious in any search for serendipitous targets in nominally blank sky fibers.
-
•
The Redrock galaxy fits extend to redshift , though the range is only constrained by the [O II] doublet in the midst of significant sky background and has no major emission line coverage. Thus is particularly susceptible to unphysical fits. This was the motivation for the LSS catalogs to only consider galaxies with .
-
•
For most of the tiles in Target Selection Validation (SV1), proper-motion corrections were applied in Fiberassign when the tile was designed.454545The design date can differ from when a tile was observed. A consequence is that the (TARGET_RA, TARGET_DEC, and REF_EPOCH) values are altered to have a REF_EPOCH of the date that the tile was designed, which makes them differ from the input photometric column values. The information is correct and consistent with the photometry, however.
Additional known issues and clarifications will be documented at https://data.desi.lbl.gov/doc/releases/dr1 as they arise.
Appendix F Summaries of Value Added Catalogs
This appendix expands upon the set of VACs introduced in §3.5 and summarized in Table 10. Specifically, Appendix F.1 contains general VACs not tied to a specific science case and spanning a variety of scientific applications; Appendix F.2 contains VACs that are primarily concerned with Milky Way or stellar science; Appendix F.3 contains VACs associated with extragalactic science, including voids, galaxy groups, galaxy statistics and strong lenses; Appendix F.4 contains VACs associated with quasar and active galactic nuclei (AGN) science, including summary statistics, updated redshifts, Mg II absorption systems and damped Ly (DLA) systems; and Appendix F.5 contains data products produced by the Ly Forest Working Group which were used in the analysis in DESI Collaboration et al. (2025a).
F.1 General VACs
LS/DR9 Photometry VAC delivers merged targeting catalogs (targetphot) and Tractor464646https://github.com/dstndstn/tractor (Lang et al., 2016) catalog photometry (tractorphot) from the Legacy Surveys DR9 (LS/DR9474747https://www.legacysurvey.org/dr9; Dey et al., 2019) for all observed and potential targets (excluding sky fibers) in DR1.484848https://github.com/moustakas/desi-photometry The observed targets in this VAC correspond to objects with at least one observation in DR1, while the potential targets are the targets that DESI could have observed in a given fiber-assignment configuration (including the objects that were actually observed).
Sky Spectra VAC provides over 9,000 sky spectra from DR1, accompanied by detailed metadata, derived from the DESI spectroscopic pipeline. These spectra are essential for understanding the sky background, enabling the identification of natural and artificial emission features, and improving the analysis of astronomical targets. The metadata include comprehensive observational parameters, such as exposure time, airmass, Galactic extinction, moon and sun positions, and atmospheric conditions, offering a rich context for each spectrum. The primary purpose of this catalog is to be a resource for studies of atmospheric phenomena, light pollution, and calibration.
F.2 Milky Way Survey VACs
MWS VAC provides analysis of stellar spectra by the Milky Way Survey Working Group (Koposov et al. 2025, in preparation). The analysis involves fitting DESI spectra using two pipelines: RVSpecFit (Koposov et al., 2024) and FERRE (Allende-Prieto & Apogee Team, 2023) (see Cooper et al. 2023 and Koposov et al. 2024 for more details). The RVSpecFit pipeline derives radial velocity measurements, stellar parameters, and abundances, while FERRE provides stellar parameters and abundance measurements. Both pipelines have been applied to approximately 6.5M coadded spectra of stars or possible stars from DESI DR1. Additionally, the RVSpecFit pipeline was run on approximately 9.5M single-exposure spectra, enabling radial velocity variability analyses. Since the DESI EDR, both pipelines have been significantly improved, with RVSpecFit now using neural networks to interpolate stellar spectra, thus eliminating issues with clustering of stellar parameters on grid nodes that was present in the EDR VAC. The data products in this VAC include tables of stellar parameters, radial velocities, their uncertainties, and the best-fit models for the DESI spectra. In addition, the data tables have been cross-matched with the latest Gaia DR3 release.
MWS BHB VAC contains spectroscopically confirmed BHB stars. BHB stars are excellent tracers of the Milky Way halo; they are intrinsically bright, so they can be observed to large distances, and there exists a simple polynomial relationship between their color and absolute magnitude (Deason et al., 2011; Belokurov & Koposov, 2016), meaning that their distances can be computed with high precision. BHB candidates were targeted in the MWS (see §4.4.4 in Cooper et al., 2023) and as secondary targets observed in dark time (see Myers et al., 2023a). Due to photometric uncertainties, targeted BHB candidates contain contamination primarily from more nearby blue straggler stars. The DESI spectroscopic observations, however, allow us to remove this contamination. The BHB VAC contains over 6,300 spectroscopically confirmed BHB stars, all having distances derived from photometry, as described in Byström et al. (2024). This BHB catalogue contains the stellar parameters from the RVSpecFit pipeline (Koposov et al., 2024), including radial velocity, surface gravity and effective temperature, and reaches heliocentric distances of about 120 kpc.
MWS SpecDis VAC provides distance measurements for over 4M stars from DR1 following the selection criteria outlined in Li et al. (2025). The VAC is based on a data-driven approach which adopts a neural network to establish the connection between stellar spectra and luminosity. It is trained on Gaia parallax and Gaia -band apparent magnitude measurements, with the following key improvements: (1) We adopt a special training label to avoid cutting off negative parallaxes; (2) We do not include any parallax uncertainty cuts for the training sample, but we include the parallax uncertainties in the loss function. This approach ensures that the training sample does not suffer from biases in parallax, and our training sample includes a significant number of distant giants. We can achieve significant improvements in our measurements than Gaia parallaxes beyond 7 kpc. (3) We adopt principal component analysis to decrease the noise and the dimensionality of the spectra. In general, the distance uncertainties decrease with increasing average signal-to-noise ratio in the B and R arms of the DESI stellar spectra (see Table 2). We adopt a Gaussian mixture model to identify candidate binary stars. The final catalog offers distance, distance uncertainty, the binary candidate flag plus other useful photometric and astrometric information, cross-matched from the RVSpecFit values reported in the MWS VAC (Koposov et al. 2025, in preparation) and Gaia DR3.
SPDist VAC provides spectrophotometric distances in the form of absolute magnitude in the Gaia -band for all stars observed by the DESI MWS, using a data-driven approach similar to Thomas & Battaglia (2022). Distances are estimated using a fully connected multi-layer perceptron (MLP) model using Gaia DR3 photometry (Gaia Collaboration et al., 2023), spectroscopic metallicity from the SP pipeline, and atmospheric parameters (effective temperature and surface gravity) derived from a combination of values from both the RV and SP pipelines (Koposov et al., 2024) as inputs. The MLP outputs the absolute magnitude in the Gaia -band, which is subsequently used to calculate distances. Some stars exhibit significant discrepancies in spectroscopic parameters derived by the RV and SP pipelines, likely leading to unreliable distance estimates. These suspicious stars are flagged with the FLAG_GOOD parameter. We recommend using this flag along with the quality flags recommended for the RV and SP pipelines (Koposov et al., 2024). For distance modulus computations, we recommend using the median of the absolute magnitude distribution (MG_50), while uncertainties can be derived from the 16th and 84th percentiles of the distribution. These uncertainties should be combined in quadrature with the intrinsic precision of the method (0.167 mag, 8% relative distance precision) to obtain the total uncertainty. The primary difference between the methodologies of SpecDist and SPdist is that SpecDist predicts distances from the stellar spectra, whereas SPdist predicts distances from a full list of stellar parameters by the MWS RV and SP pipelines. A forthcoming paper will present a detailed comparison of the two methods.
Stellar Reddening VAC contains the observed spectra and the RVSpecFit model spectra of stars that provided reddening measurements for the DESI dust map (Zhou et al., 2024). The DESI dust map, publicly released with Zhou et al. (2024), is used in the DESI DR1 cosmology analysis (DESI Collaboration et al., 2024c). Also included in this VAC is the stellar catalog containing the per-star reddening measurements in the Dark Energy Camera (DECam; Flaugher et al., 2015) filters as well as other properties from the DESI pipeline and the imaging catalogs. While the paper uses the first two years of DESI data, only the DR1 portion of the data is released in the VAC. Also note that while both the MWS VAC and this VAC use RVSpecFit and are based on the same DESI data, there are some key differences: (1) the RVSpecFit model spectra in this VAC are the zero-extinction spectra, whereas the MWS VAC model spectra include an additional multiplicative term to fit the smooth-varying component of the observed spectra; and (2) the DR1 MWS VAC uses a different (newer) version of RVSpecFit than the version used here. For general purposes (other than for studying dust), the MWS VAC should be used instead of this VAC.
F.3 Extragalactic Science VACs
HETDEX VAC contains HETDEX (Hill et al., 2021) and DESI spectra of HETDEX-selected Ly emitter candidates followed up by DESI. The VAC also contains the emission line fits from both sets of spectra. Details of the analysis can be found in Landriau et al. (2025).
DESIVAST VAC contains cosmic voids identified within the DESI DR1 volume. The void locations are computed using a volume-limited subsample of the BGS Bright sample (see Hahn et al. 2023) extending to . We apply evolutionary corrections to 479,486 galaxies and enforce a magnitude cut of . We then apply three void-finding algorithms: VoidFinder (El-Ad & Piran, 1997; Hoyle & Vogeley, 2002; Douglass et al., 2022), V2/VIDE (Neyrinck, 2008; Sutter et al., 2015), and V2/REVOLVER (Nadathur et al., 2019), to obtain three comparable void catalogs. Our VoidFinder catalog contains 3,765 voids, with 1,489 non-edge voids defined as those not bordering on the survey edges. For V2/VIDE (V2/REVOLVER), we find 1,478 (1,992) voids with 297 (389) non-edge voids. Further information regarding this VAC can be found in Rincon et al. (2024).
Dwarf Galaxy VAC presents a sample of extragalactic dwarf galaxies () identified in DESI DR1. The catalog includes galaxies selected from the BGS and ELG samples, as well as the LOW-Z secondary target program (Darragh-Ford et al., 2023), spanning a redshift range of . However, due to differences in target selection criteria across these samples, the catalog is not uniformly selected. Stellar masses are derived using CIGALE494949https://cigale.lam.fr (Boquien et al., 2019; Siudek et al., 2024) and optical color-based prescriptions (Mao et al., 2024; de los Reyes et al., 2024). In a forthcoming paper (Manwadkar et al. 2025, in preparation), we will supplement this catalog with information on spectroscopic and photometric completeness, and an analysis of quenched fractions as a function of environment.
EmFit VAC provides emission-line fitting results using the EmFit code (Pucha et al., 2024) run on low-redshift () galaxy spectra, focusing on eight nebular emission lines and doublets: H, [O III] 4959,5007, [N II] 6548,83, H, and [S II] 6716,31. The code tests for the presence of extra components in the [S II] and [O III] doublets independently, and the profiles of the rest of the narrow components are designed to match the profile of the [S II] lines. It further tests for the presence of a possible broad component in the Balmer lines. The flux and width measurements along with their uncertainties for all detected components are reported in this catalog (Pucha et al. 2025, in preparation).
FastSpecfit VAC delivers a broad range of observed-frame, rest-frame, and intrinsic physical parameters for all extragalactic () targets in DR1 observed by DESI (Moustakas 2023; Moustakas et al. 2025, in preparation).505050https://fastspecfit.readthedocs.io It uses physically motivated stellar population synthesis and emission-line templates to model each DESI spectrum jointly with the optical through infrared broadband photometry. The measurements included in this VAC include: stellar velocity dispersions; stellar masses; K-corrections and rest-frame colors and magnitudes; emission-line velocity widths, velocity shifts, fluxes, and equivalent widths (separately both narrow and broad emission-line components); and much more.
Extended Halo-based Group VAC is the updated version of the extended halo-based group catalog derived from the Legacy Surveys DR9 for a galaxy sample limited to -band apparent magnitude . For all the DESI target classes included in DR1, the photometric redshifts will be updated to spectroscopic redshifts. Yang et al. (2021) provide more details regarding the extended halo-based group finder and sample selection.
Mass EMLines VAC provides stellar mass and emission line measurements for all galaxies in DESI DR1 with reliable redshift measurements. Stellar masses are derived using CIGALE (Boquien et al., 2019), which employs the broadband -, -, -, -, and -band photometry from the Legacy Surveys, and spectrophotometry of 10 artificial bands generated through convolution with DESI spectra. A main set of optical emission lines are measured by a single Gaussian fit, with absorption correction through stellar continuum fitting performed using STARLIGHT515151http://www.starlight.ufsc.br (Cid Fernandes et al., 2005, 2011). Additionally, the catalog includes stellar population properties derived by CIGALE and those obtained by STARLIGHT using DESI spectra. For additional information see Zou et al. (2024) and Zou et al. (2025, in preparation).
Strong Lensing VAC provides a comprehensive catalog of spectroscopic observation of strong gravitational lenses observed by DESI. The observations are primarily obtained through a program that seeks to obtain spectroscopic redshifts for both the lensing galaxies and the lensed sources for 1800 new strong lensing candidate systems (Huang et al. 2025, in preparation; Storfer et al. 2025, in preparation). Objects included in the catalog were visually inspected in order to make a determination on the quality of the Redrock redshift, and to determine the nature of the system. Systems with at least one confirmed redshift for either the lens or source are included in the VAC. In addition to relevant data from the default DESI pipeline, the VAC includes data from the FastSpecFit VAC, including velocity dispersion, star-formation rate, and stellar mass. Also included is diameter aperture photometry at the location of the fibers targeting lenses and sources. Lastly, with a number of Ly emitters and absorbers not currently fit for redshifts via Redrock, we use custom template-fitting within the Redrock framework to fit for our own redshifts. Systems that are assigned redshifts this way are noted in the catalog.
F.4 Quasar Science VACs
AGN/QSO Summary VAC provides AGN and QSO identification for all target classes observed within DR1 for objects with at least one DESI spectrum. Identification of QSOs and AGN is achieved through multiple means, including optical and ultraviolet emission-line diagnostics and multi-wavelength photometry. The VAC enables rapid selection of more complete versus more pure methodologies, as well as selection through any one AGN diagnostic (Juneau et al. 2025, in preparation). A tutorial accompanies the catalog which demonstrates both how to use the catalog for rapid AGN / QSO selection as well as using the open source diagnostic code to select a specific line diagnostic and to choose the dividing line methodologies of those diagnostics. An example might be to test the [S II] Baldwin et al. (1981) classification assuming the more recent dividing lines of Law et al. (2021, implemented by default) compared with the traditional dividing lines of Kewley et al. (2001), which were reported to potentially overestimate the presence of AGN (e.g., Pucha et al., 2024).
AGN Host Properties VAC provides physical properties for approximately 17M galaxies derived through spectral energy distribution fitting using CIGALE (v.22.1; Boquien et al., 2019). This analysis accounts for contributions from both stars and, if present, an AGN. CIGALE uses the principle of energy balance, where dust-absorbed stellar emission in the ultraviolet and optical bands is re-emitted in the infrared; it estimates key galaxy and AGN properties such as stellar mass, star formation rate, and the AGN fraction (the contribution of the AGN dusty torus to the total IR luminosity (e.g., Ciesla et al., 2015; Salim et al., 2018; Yang et al., 2020, 2022). A detailed description of the catalog and its statistical properties based on data in the DESI EDR can be found in Siudek et al. (2024), with additional follow-up analysis using spectral energy distribution modeling to identify AGN to be described in Siudek et al. (2025, in preparation).
BHMass VAC provides Mg II-based supermassive black hole mass estimates for 490,648 quasars at from DESI DR1. Approximately 35% of the sample have mass uncertainties less than 0.5 dex. The iron-corrected mass is estimated using the fitting process and estimator introduced by Pan et al. (2025), which accounts for the effects of the Eddington ratio. Additionally, we integrate fitting results from the FastSpecFit VAC and offer alternative mass estimates based on the formulations by Shen et al. (2011); Le et al. (2020); Yu et al. (2023), providing users with flexibility in choosing their preferred estimator. This catalog will be periodically updated and extended to include more DESI quasars.
DLA NN and GP Finder VAC contains the catalog of DLAs used for the DR1 Ly BAO analysis. The catalog results from the combination of two DLA finding algorithms. The first one is based on a convolution neural network trained with mock DESI spectra whose algorithm and performance is described in Wang et al. (2022). The second algorithm, which uses a Gaussian Process (GP), is based on the GP model of Ho et al. (2020). Both outputs from these algorithms are retained in the combined catalog and DLA candidates are merged when they are found by both methods with a velocity difference of less than 800 km s-1. The merged catalog includes estimated redshifts and H I column densities together with confidence flags from both algorithms. It contains 54,416 candidate DLAs with H I column density cm-2 within Ly forest spectra with signal-to-noise ratio larger than three.
DLA Template Finder VAC contains candidate DLAs identified with the DLA Toolkit software, which uses spectral template-fitting. The catalog was constructed from quasar spectra with , allowing for a maximum of three detections per sight-line; it contains an estimated DLA redshift, HI column density, and detection significance for each DLA. Brodzeller et al. (2025, in preparation) provide the full details on the catalog’s construction, parameter accuracy, and recommended quality cuts to maximize sample purity and completeness. This catalog is supplemental to the DLA NN and GP Finder VAC.
Mg II Absorber VAC contains information regarding the detection and characterization of Mg II absorption systems in DESI quasar spectra. The catalog is based on a search for Mg II absorbers in spectra from all quasar targets. Our search technique employs both a non-negative matrix factorization continuum construction step, which identifies possible doublet candidates, as well as an Markov Chain Monte Carlo-based line-fitting step which determines accurate line-statistics. From a parent sample of 1.47M DESI DR1 quasars we detect a total of 270,529 Mg II absorbers with velocity offsets from the background quasar of km s-1, and 392 Mg II absorbers with velocity offsets km s-1. From an analysis of results from DESI EDR, we estimate this catalog to have a purity greater than 99% and a completeness greater than 90% for absorbers with rest-frame equivalent widths greater than 0.8 Å.
ZLyA VAC contains the redshifts and broad absorption line (BAL) information used for the DR1 Ly forest BAO analysis (DESI Collaboration et al., 2025a) The catalog was constructed with main-survey, dark-program quasars with a Redrock ZWARN flag of either zero or four (see §3.1.2).525252https://desidatamodel.readthedocs.io/en/latest/bitmasks.html#zwarn, Redshifts were updated from the LSS catalog redshifts to correct for a systematic underestimation of quasar redshifts introduced by improper handling of Lyman-series optical depth (Brodzeller et al., 2023; Bault et al., 2025). The new redshifts were determined using a modified version of the Redrock HIZ quasar templates that incorporate the Kamble et al. (2020) model for Ly effective optical depth redshift evolution. BAL attributes were derived using the method presented in Filbert et al. (2024).
F.5 Lyman-Alpha Forest VACs
Lyman Alpha Forest Year 1 Deltas VAC contains the flux-transmission field used in the DR1 Ly BAO measurement. The fluctuations in the calibration region (rest-frame wavelength from 1600 to 1850 Å), the Ly region A (rest-frame wavelength from 1040 to 1205 Å), and Ly region B (rest-frame wavelength from 920 to 1020 Å) were obtained using Python Code for IGM Cosmological-Correlations Analyses (PICCA; du Mas des Bourboux et al. 2020). The continuum-fitting process is discussed in detail by Ram´ırez-Pérez et al. (2024). This catalog provides the estimated quasar continua, the fluctuations in the spectra, and their associated weights for all lines-of-sight for each HEALPix pixel. The fitted variance functions, stack of fluctuations, and the mean continuum are stored for each iteration during the continuum-fitting process.
Lyman Alpha Forest Year 1 Correlations VAC contains the correlation data products that are used in the DR1 Ly BAO measurement. It contains correlation measurements between Ly forest fluctuations in both regions A (1040 to 1205 Å) and B (920 to 1020 Å), and tracer quasars. For each of the four combinations, we provide the correlation function and the distortion matrix. The latter is used to forward-model the effect of reconstructing the unabsorbed flux of quasar spectra (see, e.g., du Mas des Bourboux et al. 2020). Furthermore, we provide one smoothed covariance matrix that includes the cross-covariances between the different correlation function measurements.
References
- Albrecht et al. (2006) Albrecht, A., Bernstein, G., Cahn, R., et al. 2006, arXiv e-prints, astro. https://arxiv.org/abs/astro-ph/0609591
- Alexander et al. (2023) Alexander, D. M., Davis, T. M., Chaussidon, E., et al. 2023, AJ, 165, 124, doi: 10.3847/1538-3881/acacfc
- Allende-Prieto & Apogee Team (2023) Allende-Prieto, C., & Apogee Team. 2023, FERRE: Match physical models to measurements, Astrophysics Source Code Library, record ascl:2301.016
- Anand et al. (2024) Anand, A., Guy, J., Bailey, S., et al. 2024, AJ, 168, 124. https://arxiv.org/abs/2405.19288
- Astropy Collaboration et al. (2013) Astropy Collaboration, Robitaille, T. P., Tollerud, E. J., et al. 2013, A&A, 558, A33. https://arxiv.org/abs/1307.6212
- Astropy Collaboration et al. (2018) Astropy Collaboration, Price-Whelan, A. M., Sipőcz, B. M., et al. 2018, AJ, 156, 123. https://arxiv.org/abs/1801.02634
- Astropy Collaboration et al. (2022) Astropy Collaboration, Price-Whelan, A. M., Lim, P. L., et al. 2022, ApJ, 935, 167. https://arxiv.org/abs/2206.14220
- Baldwin et al. (1981) Baldwin, J. A., Phillips, M. M., & Terlevich, R. 1981, PASP, 93, 5
- Bault et al. (2025) Bault, A., Kirkby, D., Guy, J., et al. 2025, J. Cosmology Astropart. Phys, 2025, 130, doi: 10.1088/1475-7516/2025/01/130
- Bayer (2012) Bayer, M. 2012, in The Architecture of Open Source Applications Volume II: Structure, Scale, and a Few More Fearless Hacks, ed. A. Brown & G. Wilson (aosabook.org)
- Belokurov & Koposov (2016) Belokurov, V., & Koposov, S. E. 2016, MNRAS, 456, 602. https://arxiv.org/abs/1511.03667
- Bianchi et al. (2024) Bianchi, D., Hanif, M. M. S., Carnero Rosell, A., et al. 2024, arXiv e-prints, arXiv:2411.12025, doi: 10.48550/arXiv.2411.12025
- Blanton et al. (2017) Blanton, M. R., Bershady, M. A., Abolfathi, B., et al. 2017, AJ, 154, 28. https://arxiv.org/abs/1703.00052
- Bolton & Schlegel (2010) Bolton, A. S., & Schlegel, D. J. 2010, PASP, 122, 248. https://arxiv.org/abs/0911.2689
- Boquien et al. (2019) Boquien, M., Burgarella, D., Roehlly, Y., et al. 2019, A&A, 622, A103. https://arxiv.org/abs/1811.03094
- Brodzeller et al. (2023) Brodzeller, A., Dawson, K., Bailey, S., et al. 2023, AJ, 166, 66, doi: 10.3847/1538-3881/ace35d
- Busca & Balland (2018) Busca, N., & Balland, C. 2018, arXiv e-prints, arXiv:1808.09955. https://arxiv.org/abs/1808.09955
- Byström et al. (2024) Byström, A., Koposov, S. E., Lilleengen, S., et al. 2024, arXiv e-prints, arXiv:2410.09149. https://arxiv.org/abs/2410.09149
- Chaussidon et al. (2023) Chaussidon, E., Yèche, C., Palanque-Delabrouille, N., et al. 2023, ApJ, 944, 107, doi: 10.3847/1538-4357/acb3c2
- Chaussidon et al. (2024) Chaussidon, E., Yèche, C., de Mattia, A., et al. 2024, arXiv e-prints, arXiv:2411.17623, doi: 10.48550/arXiv.2411.17623
- Cid Fernandes et al. (2005) Cid Fernandes, R., Mateus, A., Sodré, L., Stasińska, G., & Gomes, J. M. 2005, MNRAS, 358, 363. https://arxiv.org/abs/astro-ph/0412481
- Cid Fernandes et al. (2011) Cid Fernandes, R., Mateus, A., Sodré, L., Stasinska, G., & Gomes, J. M. 2011, STARLIGHT: Spectral Synthesis Code, Astrophysics Source Code Library, record ascl:1108.006
- Ciesla et al. (2015) Ciesla, L., Charmandaris, V., Georgakakis, A., et al. 2015, A&A, 576, A10. https://arxiv.org/abs/1501.03672
- Cooper et al. (2023) Cooper, A. P., Koposov, S. E., Allende Prieto, C., et al. 2023, ApJ, 947, 37, doi: 10.3847/1538-4357/acb3c0
- Darragh-Ford et al. (2023) Darragh-Ford, E., Wu, J. F., Mao, Y.-Y., et al. 2023, ApJ, 954, 149. https://arxiv.org/abs/2212.07433
- Dawson et al. (2013) Dawson, K. S., Schlegel, D. J., Ahn, C. P., et al. 2013, AJ, 145, 10. https://arxiv.org/abs/1208.0022
- de los Reyes et al. (2024) de los Reyes, M. A. C., Asali, Y., Wechsler, R., et al. 2024, arXiv e-prints, arXiv:2409.03959. https://arxiv.org/abs/2409.03959
- Deason et al. (2011) Deason, A. J., Belokurov, V., & Evans, N. W. 2011, MNRAS, 416, 2903. https://arxiv.org/abs/1104.3220
- DESI Collaboration et al. (2016a) DESI Collaboration, Aghamousa, A., Aguilar, J., et al. 2016a, arXiv e-prints, arXiv:1611.00036. https://arxiv.org/abs/1611.00036
- DESI Collaboration et al. (2016b) —. 2016b, arXiv e-prints, arXiv:1611.00037. https://arxiv.org/abs/1611.00037
- DESI Collaboration et al. (2022) DESI Collaboration, Abareshi, B., Aguilar, J., et al. 2022, AJ, 164, 207, doi: 10.3847/1538-3881/ac882b
- DESI Collaboration et al. (2024a) DESI Collaboration, Adame, A. G., Aguilar, J., et al. 2024a, AJ, 167, 62, doi: 10.3847/1538-3881/ad0b08
- DESI Collaboration et al. (2024b) —. 2024b, AJ, 168, 58, doi: 10.3847/1538-3881/ad3217
- DESI Collaboration et al. (2024c) —. 2024c, arXiv e-prints, arXiv:2411.12020, doi: 10.48550/arXiv.2411.12020
- DESI Collaboration et al. (2024d) DESI Collaboration, Adame, A. G., Aguilar, J., et al. 2024d, arXiv e-prints, arXiv:2404.03000, doi: 10.48550/arXiv.2404.03000
- DESI Collaboration et al. (2024e) DESI Collaboration, Adame, A. G., Aguilar, J., et al. 2024e, arXiv e-prints, arXiv:2411.12021, doi: 10.48550/arXiv.2411.12021
- DESI Collaboration et al. (2024f) —. 2024f, arXiv e-prints, arXiv:2411.12022, doi: 10.48550/arXiv.2411.12022
- DESI Collaboration et al. (2025a) —. 2025a, J. Cosmology Astropart. Phys, 2025, 124, doi: 10.1088/1475-7516/2025/01/124
- DESI Collaboration et al. (2025b) —. 2025b, J. Cosmology Astropart. Phys, 2025, 021, doi: 10.1088/1475-7516/2025/02/021
- Dey et al. (2019) Dey, A., Schlegel, D. J., Lang, D., et al. 2019, AJ, 157, 168, doi: 10.3847/1538-3881/ab089d
- Dey et al. (2023) Dey, A., Najita, J. R., Koposov, S. E., et al. 2023, ApJ, 944, 1. https://arxiv.org/abs/2208.11683
- Douglass et al. (2022) Douglass, K., Veyrat, D., O’Neill, S., et al. 2022, The Journal of Open Source Software, 7, 4033
- du Mas des Bourboux et al. (2020) du Mas des Bourboux, H., Rich, J., Font-Ribera, A., et al. 2020, ApJ, 901, 153. https://arxiv.org/abs/2007.08995
- El-Ad & Piran (1997) El-Ad, H., & Piran, T. 1997, ApJ, 491, 421. https://arxiv.org/abs/astro-ph/9702135
- Farr et al. (2020) Farr, J., Font-Ribera, A., & Pontzen, A. 2020, J. Cosmology Astropart. Phys, 2020, 015. https://arxiv.org/abs/2007.10348
- Fawcett et al. (2023) Fawcett, V. A., Alexander, D. M., Brodzeller, A., et al. 2023, MNRAS, 525, 5575. https://arxiv.org/abs/2308.14790
- Filbert et al. (2024) Filbert, S., Martini, P., Seebaluck, K., et al. 2024, MNRAS, 532, 3669. https://arxiv.org/abs/2309.03434
- Flaugher et al. (2015) Flaugher, B., Diehl, H. T., Honscheid, K., et al. 2015, AJ, 150, 150. https://arxiv.org/abs/1504.02900
- Gaia Collaboration et al. (2016) Gaia Collaboration, Prusti, T., de Bruijne, J. H. J., et al. 2016, A&A, 595, A1. https://arxiv.org/abs/1609.04153
- Gaia Collaboration et al. (2022) Gaia Collaboration, Klioner, S. A., Lindegren, L., et al. 2022, A&A, 667, A148. https://arxiv.org/abs/2204.12574
- Gaia Collaboration et al. (2023) Gaia Collaboration, Vallenari, A., Brown, A. G. A., et al. 2023, A&A, 674, A1. https://arxiv.org/abs/2208.00211
- Gordon et al. (2023) Gordon, C., Cuceu, A., Chaves-Montero, J., et al. 2023, J. Cosmology Astropart. Phys, 2023, 045. https://arxiv.org/abs/2308.10950
- Górski et al. (2005) Górski, K. M., Hivon, E., Banday, A. J., et al. 2005, ApJ, 622, 759. https://arxiv.org/abs/astro-ph/0409513
- Guy et al. (2023) Guy, J., Bailey, S., Kremin, A., et al. 2023, AJ, 165, 144, doi: 10.3847/1538-3881/acb212
- Hahn et al. (2023) Hahn, C., Wilson, M. J., Ruiz-Macias, O., et al. 2023, AJ, 165, 253, doi: 10.3847/1538-3881/accff8
- Harris et al. (2020) Harris, C. R., Millman, K. J., van der Walt, S. J., et al. 2020, Nature, 585, 357. https://arxiv.org/abs/2006.10256
- Herrera-Alcantar et al. (2023) Herrera-Alcantar, H. K., Muñoz-Gutiérrez, A., Tan, T., et al. 2023, arXiv e-prints, arXiv:2401.00303. https://arxiv.org/abs/2401.00303
- Hill et al. (2021) Hill, G. J., Lee, H., MacQueen, P. J., et al. 2021, AJ, 162, 298. https://arxiv.org/abs/2110.03843
- Ho et al. (2020) Ho, M.-F., Bird, S., & Garnett, R. 2020, MNRAS, 496, 5436. https://arxiv.org/abs/2003.11036
- Hoyle & Vogeley (2002) Hoyle, F., & Vogeley, M. S. 2002, ApJ, 566, 641. https://arxiv.org/abs/astro-ph/0109357
- Hunter (2007) Hunter, J. D. 2007, Computing in Science and Engineering, 9, 90
- Juneau et al. (2021) Juneau, S., Olsen, K., Nikutta, R., Jacques, A., & Bailey, S. 2021, Computing in Science and Engineering, 23, 15. https://arxiv.org/abs/2104.06527
- Juneau et al. (2024a) Juneau, S., Canning, R., Alexander, D. M., et al. 2024a, arXiv e-prints, arXiv:2404.03621. https://arxiv.org/abs/2404.03621
- Juneau et al. (2024b) Juneau, S., Jacques, A., Pothier, S., et al. 2024b, arXiv e-prints, arXiv:2401.05576. https://arxiv.org/abs/2401.05576
- Jurić et al. (2008) Jurić, M., Ivezić, Ž., Brooks, A., et al. 2008, ApJ, 673, 864. https://arxiv.org/abs/astro-ph/0510520
- Kamble et al. (2020) Kamble, V., Dawson, K., du Mas des Bourboux, H., Bautista, J., & Scheinder, D. P. 2020, ApJ, 892, 70. https://arxiv.org/abs/1904.01110
- Karaçaylı et al. (2024) Karaçaylı, N. G., Martini, P., Guy, J., et al. 2024, MNRAS, 528, 3941. https://arxiv.org/abs/2306.06316
- Kewley et al. (2001) Kewley, L. J., Heisler, C. A., Dopita, M. A., & Lumsden, S. 2001, ApJS, 132, 37
- Kirkby et al. (2025) Kirkby et al. 2025, , in preparation
- Kluyver et al. (2016) Kluyver, T., Ragan-Kelley, B., Pérez, F., et al. 2016, in IOS Press, 87–90
- Kollmeier et al. (2017) Kollmeier, J. A., Zasowski, G., Rix, H.-W., et al. 2017, arXiv e-prints, arXiv:1711.03234. https://arxiv.org/abs/1711.03234
- Koposov & Bartunov (2006) Koposov, S., & Bartunov, O. 2006, in Astronomical Society of the Pacific Conference Series, Vol. 351, Astronomical Data Analysis Software and Systems XV, ed. C. Gabriel, C. Arviset, D. Ponz, & S. Enrique, 735
- Koposov & Bartunov (2019) Koposov, S., & Bartunov, O. 2019, Q3C: A PostgreSQL package for spatial queries and cross-matches of large astronomical catalogs, Astrophysics Source Code Library, record ascl:1905.008
- Koposov et al. (2024) Koposov, S. E., Allende Prieto, C., Cooper, A. P., et al. 2024, MNRAS, 533, 1012. https://arxiv.org/abs/2407.06280
- Lan et al. (2023) Lan, T.-W., Tojeiro, R., Armengaud, E., et al. 2023, ApJ, 943, 68, doi: 10.3847/1538-4357/aca5fa
- Landriau et al. (2025) Landriau, M., Mentuch Cooper, E., Davis, D., et al. 2025, arXiv e-prints, arXiv:2503.02229. https://arxiv.org/abs/2503.02229
- Lang et al. (2016) Lang, D., Hogg, D. W., & Schlegel, D. J. 2016, AJ, 151, 36. https://arxiv.org/abs/1410.7397
- Lasker et al. (2025) Lasker, J., Carnero Rosell, A., Myers, A. D., et al. 2025, J. Cosmology Astropart. Phys, 2025, 127, doi: 10.1088/1475-7516/2025/01/127
- Law et al. (2021) Law, D. R., Ji, X., Belfiore, F., et al. 2021, ApJ, 915, 35. https://arxiv.org/abs/2011.06012
- Le et al. (2020) Le, H. A. N., Woo, J.-H., & Xue, Y. 2020, ApJ, 901, 35. https://arxiv.org/abs/2008.02990
- Levi et al. (2013) Levi, M., Bebek, C., Beers, T., et al. 2013, arXiv e-prints, arXiv:1308.0847. https://arxiv.org/abs/1308.0847
- Li et al. (2025) Li, S., Wang, W., Koposov, S. E., et al. 2025, arXiv e-prints, arXiv:2503.02291. https://arxiv.org/abs/2503.02291
- Lindegren et al. (2018) Lindegren, L., Hernández, J., Bombrun, A., et al. 2018, A&A, 616, A2. https://arxiv.org/abs/1804.09366
- Lynden-Bell & Lynden-Bell (1995) Lynden-Bell, D., & Lynden-Bell, R. M. 1995, MNRAS, 275, 429
- Majewski et al. (2003) Majewski, S. R., Skrutskie, M. F., Weinberg, M. D., & Ostheimer, J. C. 2003, ApJ, 599, 1082. https://arxiv.org/abs/astro-ph/0304198
- Majewski et al. (2017) Majewski, S. R., Schiavon, R. P., Frinchaboy, P. M., et al. 2017, AJ, 154, 94. https://arxiv.org/abs/1509.05420
- Manser et al. (2024) Manser, C. J., Izquierdo, P., Gänsicke, B. T., et al. 2024, MNRAS, 535, 254. https://arxiv.org/abs/2402.18641
- Mao et al. (2024) Mao, Y.-Y., Geha, M., Wechsler, R. H., et al. 2024, ApJ, 976, 117. https://arxiv.org/abs/2404.14498
- Miller et al. (2024) Miller, T. N., Doel, P., Gutierrez, G., et al. 2024, AJ, 168, 95, doi: 10.3847/1538-3881/ad45fe
- Moon et al. (2023) Moon, J., Valcin, D., Rashkovetskyi, M., et al. 2023, MNRAS, 525, 5406, doi: 10.1093/mnras/stad2618
- Moustakas (2023) Moustakas, J. 2023, FastSpecFit: Fast spectral synthesis and emission-line fitting of DESI spectra, Astrophysics Source Code Library, record ascl:2308.005. http://ascl.net/2308.005
- Moustakas et al. (2023) Moustakas, J., Lang, D., Dey, A., et al. 2023, ApJS, 269, 3, doi: 10.3847/1538-4365/acfaa2
- Myers et al. (2023a) Myers, A. D., Moustakas, J., Bailey, S., et al. 2023a, AJ, 165, 50, doi: 10.3847/1538-3881/aca5f9
- Myers et al. (2023b) —. 2023b, desitarget: Selecting DESI targets from photometric catalogs, Astrophysics Source Code Library, record ascl:2301.025
- Nadathur et al. (2019) Nadathur, S., Carter, P. M., Percival, W. J., Winther, H. A., & Bautista, J. E. 2019, Phys. Rev. D, 100, 023504. https://arxiv.org/abs/1904.01030
- Napolitano et al. (2023) Napolitano, L., Pandey, A., Myers, A. D., et al. 2023, AJ, 166, 99. https://arxiv.org/abs/2305.20016
- Newberg et al. (2002) Newberg, H. J., Yanny, B., Rockosi, C., et al. 2002, ApJ, 569, 245. https://arxiv.org/abs/astro-ph/0111095
- Neyrinck (2008) Neyrinck, M. C. 2008, MNRAS, 386, 2101. https://arxiv.org/abs/0712.3049
- Palmese et al. (2021) Palmese, A., BenZvi, S., Bailey, S., et al. 2021, GRB Coordinates Network, 30923, 1
- Pan et al. (2025) Pan, Z., Jiang, L., Guo, W.-J., et al. 2025, arXiv e-prints, arXiv:2502.03684. https://arxiv.org/abs/2502.03684
- Poppett et al. (2024) Poppett, C., Tyas, L., Aguilar, J., et al. 2024, AJ, 168, 245, doi: 10.3847/1538-3881/ad76a4
- Price-Whelan (2017) Price-Whelan, A. M. 2017, The Journal of Open Source Software, 2, 388
- Pucha et al. (2024) Pucha, R., Juneau, S., Dey, A., et al. 2024, arXiv e-prints, arXiv:2411.00091. https://arxiv.org/abs/2411.00091
- Raichoor et al. (2020) Raichoor, A., Eisenstein, D. J., Karim, T., et al. 2020, Research Notes of the American Astronomical Society, 4, 180, doi: 10.3847/2515-5172/abc078
- Raichoor et al. (2023) Raichoor, A., Moustakas, J., Newman, J. A., et al. 2023, AJ, 165, 126, doi: 10.3847/1538-3881/acb213
- Ram´ırez-Pérez et al. (2024) Ramírez-Pérez, C., Pérez-Ràfols, I., Font-Ribera, A., et al. 2024, MNRAS, 528, 6666. https://arxiv.org/abs/2306.06312
- Ravoux et al. (2023) Ravoux, C., Abdul Karim, M. L., Armengaud, E., et al. 2023, MNRAS, 526, 5118. https://arxiv.org/abs/2306.06311
- Rincon et al. (2024) Rincon, H., BenZvi, S., Douglass, K., et al. 2024, arXiv e-prints, arXiv:2411.00148. https://arxiv.org/abs/2411.00148
- Ross et al. (2020) Ross, A. J., Bautista, J., Tojeiro, R., et al. 2020, MNRAS, 498, 2354. https://arxiv.org/abs/2007.09000
- Ross et al. (2025) Ross, A. J., Aguilar, J., Ahlen, S., et al. 2025, J. Cosmology Astropart. Phys, 2025, 125, doi: 10.1088/1475-7516/2025/01/125
- Ruiz-Macias et al. (2020) Ruiz-Macias, O., Zarrouk, P., Cole, S., et al. 2020, Research Notes of the American Astronomical Society, 4, 187, doi: 10.3847/2515-5172/abc25a
- Salim et al. (2018) Salim, S., Boquien, M., & Lee, J. C. 2018, ApJ, 859, 11. https://arxiv.org/abs/1804.05850
- Saulder et al. (2023) Saulder, C., Howlett, C., Douglass, K. A., et al. 2023, MNRAS, 525, 1106. https://arxiv.org/abs/2302.13760
- Schlafly et al. (2023) Schlafly, E. F., Kirkby, D., Schlegel, D. J., et al. 2023, AJ, 166, 259, doi: 10.3847/1538-3881/ad0832
- Scoville et al. (2007) Scoville, N., Aussel, H., Brusa, M., et al. 2007, ApJS, 172, 1. https://arxiv.org/abs/astro-ph/0612305
- Shen et al. (2011) Shen, Y., Richards, G. T., Strauss, M. A., et al. 2011, ApJS, 194, 45. https://arxiv.org/abs/1006.5178
- Silber et al. (2023) Silber, J. H., Fagrelius, P., Fanning, K., et al. 2023, AJ, 165, 9, doi: 10.3847/1538-3881/ac9ab1
- Siudek et al. (2024) Siudek, M., Pucha, R., Mezcua, M., et al. 2024, A&A, 691, A308. https://arxiv.org/abs/2409.19066
- Soumagnac et al. (2024) Soumagnac, M. T., Nugent, P., Knop, R. A., et al. 2024, ApJS, 275, 22. https://arxiv.org/abs/2405.03857
- Sutter et al. (2015) Sutter, P. M., Lavaux, G., Hamaus, N., et al. 2015, Astronomy and Computing, 9, 1. https://arxiv.org/abs/1406.1191
- Taylor (2005) Taylor, M. B. 2005, in Astronomical Society of the Pacific Conference Series, Vol. 347, Astronomical Data Analysis Software and Systems XIV, ed. P. Shopbell, M. Britton, & R. Ebert, 29
- Thomas & Battaglia (2022) Thomas, G. F., & Battaglia, G. 2022, A&A, 660, A29. https://arxiv.org/abs/2112.03973
- Valluri et al. (2025) Valluri, M., Fagrelius, P., Koposov, S. E., et al. 2025, ApJ, 980, 71. https://arxiv.org/abs/2407.06336
- Vasiliev & Baumgardt (2021) Vasiliev, E., & Baumgardt, H. 2021, MNRAS, 505, 5978. https://arxiv.org/abs/2102.09568
- Virtanen et al. (2020) Virtanen, P., Gommers, R., Oliphant, T. E., et al. 2020, Nature Methods, 17, 261. https://arxiv.org/abs/1907.10121
- Wang et al. (2022) Wang, B., Zou, J., Cai, Z., et al. 2022, ApJS, 259, 28. https://arxiv.org/abs/2201.00827
- Weinberg et al. (2013) Weinberg, D. H., Mortonson, M. J., Eisenstein, D. J., et al. 2013, Phys. Rep., 530, 87. https://arxiv.org/abs/1201.2434
- Wu & Shen (2023) Wu, Q., & Shen, Y. 2023, Research Notes of the American Astronomical Society, 7, 190. https://arxiv.org/abs/2308.15586
- Yang et al. (2020) Yang, G., Boquien, M., Buat, V., et al. 2020, MNRAS, 491, 740. https://arxiv.org/abs/2001.08263
- Yang et al. (2022) Yang, G., Boquien, M., Brandt, W. N., et al. 2022, ApJ, 927, 192. https://arxiv.org/abs/2201.03718
- Yang et al. (2023) Yang, J., Fan, X., Gupta, A., et al. 2023, ApJS, 269, 27. https://arxiv.org/abs/2302.01777
- Yang et al. (2021) Yang, X., Xu, H., He, M., et al. 2021, ApJ, 909, 143. https://arxiv.org/abs/2012.14998
- Yèche et al. (2020) Yèche, C., Palanque-Delabrouille, N., Claveau, C.-A., et al. 2020, Research Notes of the American Astronomical Society, 4, 179, doi: 10.3847/2515-5172/abc01a
- York et al. (2000) York, D. G., Adelman, J., Anderson, Jr., J. E., et al. 2000, AJ, 120, 1579
- Yu et al. (2023) Yu, Z., Martini, P., Penton, A., et al. 2023, MNRAS, 522, 4132. https://arxiv.org/abs/2208.05491
- Zhou et al. (2020) Zhou, R., Newman, J. A., Dawson, K. S., et al. 2020, Research Notes of the American Astronomical Society, 4, 181, doi: 10.3847/2515-5172/abc0f4
- Zhou et al. (2023) Zhou, R., Dey, B., Newman, J. A., et al. 2023, AJ, 165, 58, doi: 10.3847/1538-3881/aca5fb
- Zhou et al. (2024) Zhou, R., Guy, J., Koposov, S. E., et al. 2024, arXiv e-prints, arXiv:2409.05140. https://arxiv.org/abs/2409.05140
- Zonca et al. (2019) Zonca, A., Singer, L., Lenz, D., et al. 2019, Journal of Open Source Software, 4, 1298
- Zou et al. (2017) Zou, H., Zhou, X., Fan, X., et al. 2017, PASP, 129, 064101, doi: 10.1088/1538-3873/aa65ba
- Zou et al. (2024) Zou, H., Sui, J., Saintonge, A., et al. 2024, ApJ, 961, 173. https://arxiv.org/abs/2312.00300