DESI Collaboration
Constraints on Neutrino Physics from DESI DR2 BAO and DR1 Full Shape
Abstract
The Dark Energy Spectroscopic Instrument (DESI) Collaboration has obtained robust measurements of baryon acoustic oscillations (BAO) in the redshift range, , based on the Lyman- forest and galaxies from Data Release 2 (DR2). We combine these measurements with external cosmic microwave background (CMB) data from Planck and ACT to place our tightest constraints yet on the sum of neutrino masses. Assuming the cosmological CDM model and three degenerate neutrino states, we find (95%). When accounting for neutrino oscillation constraints, we find a preference for the normal mass ordering and an upper bound of (95%) on the lightest neutrino mass. However, we determine using frequentist and Bayesian methods that our constraints are in moderate tension with the lower limits derived from neutrino oscillations. Correcting for the physical boundary at zero mass, we report a 95% Feldman-Cousins upper bound of , breaching the lower limit from neutrino oscillations. Considering a more general Bayesian analysis with an effective cosmological neutrino mass parameter, , that allows for negative energy densities and removes unsatisfactory prior weight effects, we derive constraints that are in tension with the same oscillation limit. In the absence of unknown systematics, this finding could be interpreted as a hint of new physics not necessarily related to neutrinos. The preference of DESI and CMB data for an evolving dark energy model offers one possible solution. In the CDM model, we find (95%), resolving the neutrino tension. These constraints all rely on the effect of neutrino masses on the cosmic expansion history. Using the full-shape power spectrum measurements of DR1 galaxies, we place complementary constraints that rely on neutrino free streaming. Our strongest such limit in CDM, using selected CMB priors, is (95%).
I Introduction
The connection between cosmic neutrinos and the large-scale structure of the Universe has a long history, dating back to the 1950s (e.g. [1]), when the concept of dark matter was beginning to take hold. One of the first particles proposed as dark matter was a massive neutrino created in the early Universe [2, 3, 4]. Years later, a reported laboratory measurement of a mass of 30 eV for the electron neutrino [5] –a mass large enough to provide the critical density needed to close the Universe– gave great impetus to the neutrino dark-matter model.
Such relatively light particles would remain relativistic until relatively late times (hence their generic name ‘hot dark matter’) and their thermal motions would wash out density perturbations below a free-streaming scale (which varies inversely with neutrino mass), corresponding to the typical comoving distance that a particle travels in the age of the Universe, Mpc for a 30 eV neutrino at recombination [6]. Shortly after, one of the first cosmological simulations showed that such a large damping scale would result in a galaxy clustering pattern inconsistent with observations [7, 8]. That electron neutrinos could not have a mass of eV, an early instance of input from cosmology into particle physics, was later confirmed experimentally [9, 10, 11, 12, 13, 14].
The recent upper limit on the neutrino mass from the KATRIN experiment, eV (90%) [15, 16, 17], indicates that neutrinos make up no more than a few percent of the total dark matter. However, their free streaming would have left an imprint in the power spectrum of density fluctuations, in the form of a small dip of amplitude (where is the mean density in units of the critical density), below the free-streaming scale. Such a distortion is, in principle, measurable in a sufficiently large and accurate galaxy survey. The first constraints on the sum of neutrino masses from the shape of the galaxy power spectrum were obtained from the 2dFGRS redshift survey, eV (95%) [18], and subsequently from the SDSS [19] in combination with cosmic microwave background (CMB) data from WMAP [20, 21].
The free-streaming distortion can also be constrained by measuring the shape of the Lyman- forest flux power spectrum along the line of sight, with the first such constraint, (95%), by Croft et al. [22] predating the galaxy power-spectrum limit from 2dFGRS. Significant improvements were made in subsequent years with the arrival of large samples of quasar spectra from SDSS and BOSS [23, 24, 25, 26, 27, 28, 29].
In addition to this small distortion of the fluctuation power spectrum, neutrinos also affect the expansion history of the Universe because they behave as radiation in the early Universe and as dark matter at later times. Since the expansion history of the Universe is reflected in the position of the peaks of the ‘baryon acoustic oscillations’ (BAO) in the matter (and galaxy) power spectra, BAO can also be used to constrain , when combined with other cosmological probes, particularly the power spectrum of temperature anisotropies of the CMB. In recent years, this signature has provided the strongest limits on [30, 31, 32, 33, 34, 35, 36, 37], culminating in the latest constraints from the Dark Energy Spectroscopic Instrument (DESI) [38, 39, 40].
DESI [41, 42, 43], in combination with CMB data from Planck [44, 45] and ACT [46, 47], has set the strongest current astrophysical constraints on [38, 39]. This has been achieved using two complementary approaches. One is based on the BAO traced by over 6 million galaxies, quasars, and the Lyman- forest over the redshift range [38]. The other is based on simultaneously analyzing the BAO and the power spectrum (‘full shape’, FS) of 4.7 million galaxies and QSOs over the redshift range [39]. In both cases, in order to break parameter degeneracies, the DESI data can be supplemented with other data, such as the power spectrum of temperature anisotropies, polarization and lensing of the CMB. The estimates are always made within the framework of an assumed cosmological model.
Adding FS to the DESI BAO analysis, an interesting constraint can already be obtained without including CMB data, but adopting two external priors to break parameter degeneracies. The first is a prior on the physical baryon density, , with the dimensionless Hubble constant, which can be determined from Big Bang Nucleosynthesis (BBN) [48]. The second is a prior on the spectral index of the matter power spectrum, . Assuming the CDM cosmology and taking a weak prior on , corresponding to ten times the uncertainty () from Planck, denoted as , the DESI upper bound for three degenerate neutrino species, from the combined FS and BAO datasets is
| (1) |
This bound can be significantly tightened by adding CMB data, as in [39], yielding111The suffix (plik) is used to differentiate the baseline CMB likelihoods from [44] used in [39] from the baseline CMB dataset used in this paper (see Section III.3).
| (2) |
These upper bounds were obtained adopting the minimal physical prior, , and assuming three degenerate neutrino mass states. The constraints are very close to the lower bounds from neutrino oscillations: for the normal neutrino ordering222Normal ordering, or hierarchy, corresponds to the case when the smallest mass splitting among the three neutrino species is between the lowest mass eigenstates. In contrast, the inverted ordering refers to the case when the smallest mass splitting is between the two highest eigenstates., and for the inverted ordering [49, 50, 51, 52].
One of the most tantalizing results from the analysis of the DESI DR1 data, when combined with CMB, is that the CDM model is disfavored at in comparison to models with dynamical dark energy. This discrepancy increases to when DESY5 supernovae are also included [38]. A similar conclusion was obtained from the DESI DR1 FS analysis [39] which, furthermore, showed that the constraints strongly depend on the assumed dark energy model; a consequence of the well-known degeneracy between and the dark energy equation of state [53, 54, 55, 56, 57, 33, 58, 59, 60, 61]. The datasets are consistent with an evolving dark energy equation of state, , based on constraints in terms of the CPL parametrization [62, 63], which assumes that the dark energy equation of state evolves with redshift, , as
| (3) |
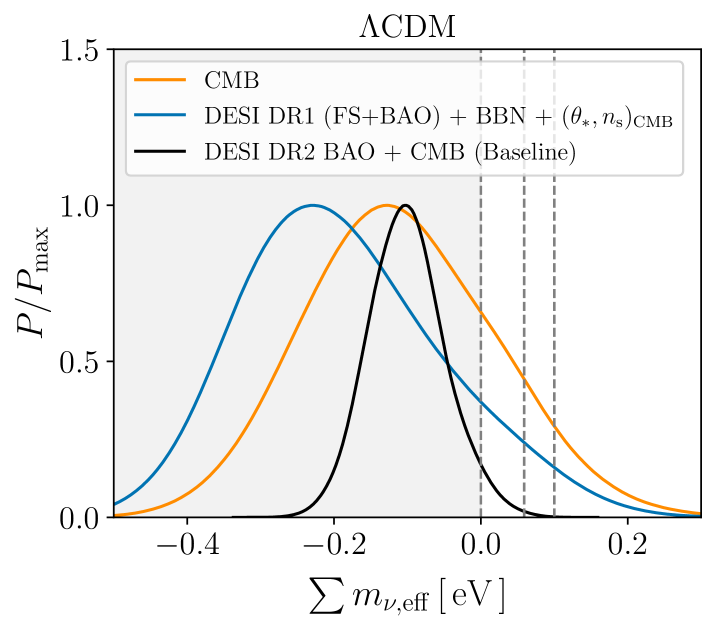
For this ‘CDM’ model, the same combination of data (DESI+CMB+DESY5) relaxes the neutrino mass constraint to eV (95%), which is now consistent with neutrino oscillations for both mass orderings.
A puzzling aspect of the DESI analysis in both the BAO and FS+BAO cases is that the marginalized posterior distribution of peaks at the lower edge of the prior, , and resembles the tail of a distribution with a central value in the negative mass range. Not only are the strongest constraints in slight tension with neutrino oscillations, presenting a close-to- discrepancy, but the posterior distributions are also dominated by “prior weight effects”, which arise when the prior on a parameter forces the posterior away from its maximum likelihood value.
In fact, this feature was already present, albeit at less significance, in cosmological analyses prior to DESI. It was discussed by the Planck [64] and SDSS [65] collaborations, but gained urgency following the release of the DESI DR1 results [66, 67, 68, 69, 70, 71, 72, 73, 74]. Craig et al. [66] proposed a model in which the gravitational lensing effect of neutrinos on the CMB was captured by a new parameter, , that could be extended to negative values. Using this parametrization, the authors derived negative values of from the combination of DESI BAO and CMB data, suggesting a preference of the data for more lensing than could be accommodated by a CDM model with positive neutrino masses [66, 67].
To address explicitly the impact of prior weight effects on the behavior of the posterior distribution of , Elbers et al. [68] introduced the concept of an effective cosmological neutrino mass parameter, . This parameter coincides exactly with for positive values, but allows for negative energy densities, which can be seen as a mathematical continuation of the parameter to negative values. Assuming CDM and a wide uniform prior for , the authors obtained a marginalized posterior distribution that peaks in the negative sector, with a posterior mean of (68%). Furthermore, the tension found earlier with the neutrino oscillation bounds turned out stronger: for the normal ordering and for the inverted ordering. When was analyzed for evolving dark energy models, the results were gratifying: for CDM, the marginalized posterior distribution peaks at a positive value, with a posterior mean of eV (68%), which coincides with the lower bound from neutrino oscillations.
The neutrino mass analysis has now been updated using BAO measurements from the second data release (DR2) of DESI, which includes redshift data for over 14 million galaxies and quasars, as well as Lyman- forest spectra from more than 820,000 quasars [75]. With these measurements, DESI is well placed to detect the distinctive imprints of massive neutrinos on cosmological observables, as discussed in Section II below. In Section III, we present the data and methods used in our analysis. Our constraints on neutrino mass are the tightest obtained so far and it is important to establish their robustness. We do this in Section III.8, where we introduce a new set of mock catalogs constructed from -body simulations with a full treatment of neutrinos of different mass which we use for additional validation of our BAO methodology.
The baseline results of our analysis are then presented in Section IV. In this paper, we combine the DESI data with constraints from neutrino oscillation experiments to set limits on the lightest neutrino mass and to determine the preference for the normal ordering (Section IV.3). The matter of the neutrino mass tension is addressed in Section V, using both frequentist and Bayesian approaches. The analysis with effective neutrino masses is revisited in Section V.2.
Previous DESI analyses of neutrino mass left a number of important questions open. One of them is the actual source of the neutrino mass signal in the full-shape analysis: geometry, expansion rate, the shape of the density perturbation power spectrum, or a combination of these. We discuss this interesting question in Section VI. Finally, our conclusions are presented in Section VII.
II Neutrinos in cosmology
Neutrinos leave distinctive imprints on cosmological observables that DESI is uniquely positioned to detect. See the reviews [76, 77, 78] and references therein, as well as [79, 71, 80, 72, 81] for other recent studies on the source of the neutrino mass signal in cosmology.
Weak interactions in the early Universe produce a background of cosmic neutrinos, which decouple from the primordial plasma at a temperature of about . They subsequently move freely, essentially without interacting, and thus preserve their thermal phase-space distribution until late times.
However, their relativistic energies are lost over time due to cosmological redshift. As the Universe expands, neutrinos transition from relativistic to non-relativistic states, with their energy density given by Eq. 42. Neutrinos become non-relativistic when , which happens at . In the relativistic limit, , the energy density of neutrinos depends only on their number and temperature:
| (4) |
where is the effective number of relativistic species and their present-day temperature. After becoming non-relativistic, , their energy density scales with mass:
| (5) |
Hence, neutrinos contribute to the radiation density at early times and to the matter density at late times, leaving a unique imprint on the cosmic expansion history.
II.1 Expansion history
Galaxy BAO measurements determine a particular angular scale and a redshift separation,
| (6) |
in the clustering of galaxies. These measurements probe the dimensionless ratio of a characteristic length scale, , imprinted on the matter distribution in the early Universe, to the late-time comoving angular diameter distance, , or expansion length, , at the effective redshift, , of the galaxy sample. The scale corresponds to the sound horizon,
| (7) |
at the baryon drag epoch, , when baryons decouple from photons. In the above expression, is the sound speed of the primordial baryon-photon plasma. When it comes to neutrino masses, the power of the BAO technique lies in a key property that distinguishes neutrinos from cold dark matter: they are relativistic at the time, , when the scale is imprinted in the matter distribution, but non-relativistic at the time when the BAO measurements are made.
The late-time quantities probed by BAO are the Hubble rate, , and the transverse comoving distance, . The former is given by
| (8) | ||||
Here, is the fraction of the critical density in cold dark matter and baryons, the fraction of radiation, the fraction of curvature, the present fraction of massive neutrinos, and the fraction of dark energy, in the simplest case of a cosmological constant. In a flat FLRW cosmology, the transverse comoving distance is
| (9) |
DESI measures the BAO scale after the non-relativistic transition, , when massive neutrinos contribute simply to the matter density, . At late times, neglecting also for simplicity, we thus have
| (10) |
Regardless of any calibration of , BAO measurements at different redshifts constrain the relative distances and expansion rates . From Eqs. 6, 9 and 10, we see that these measurements constrain , but cannot distinguish massive neutrinos from cold dark matter. Moreover, Eq. 5 shows that we additionally need to determine in order to infer from , and this requires calibration of the standard ruler, .
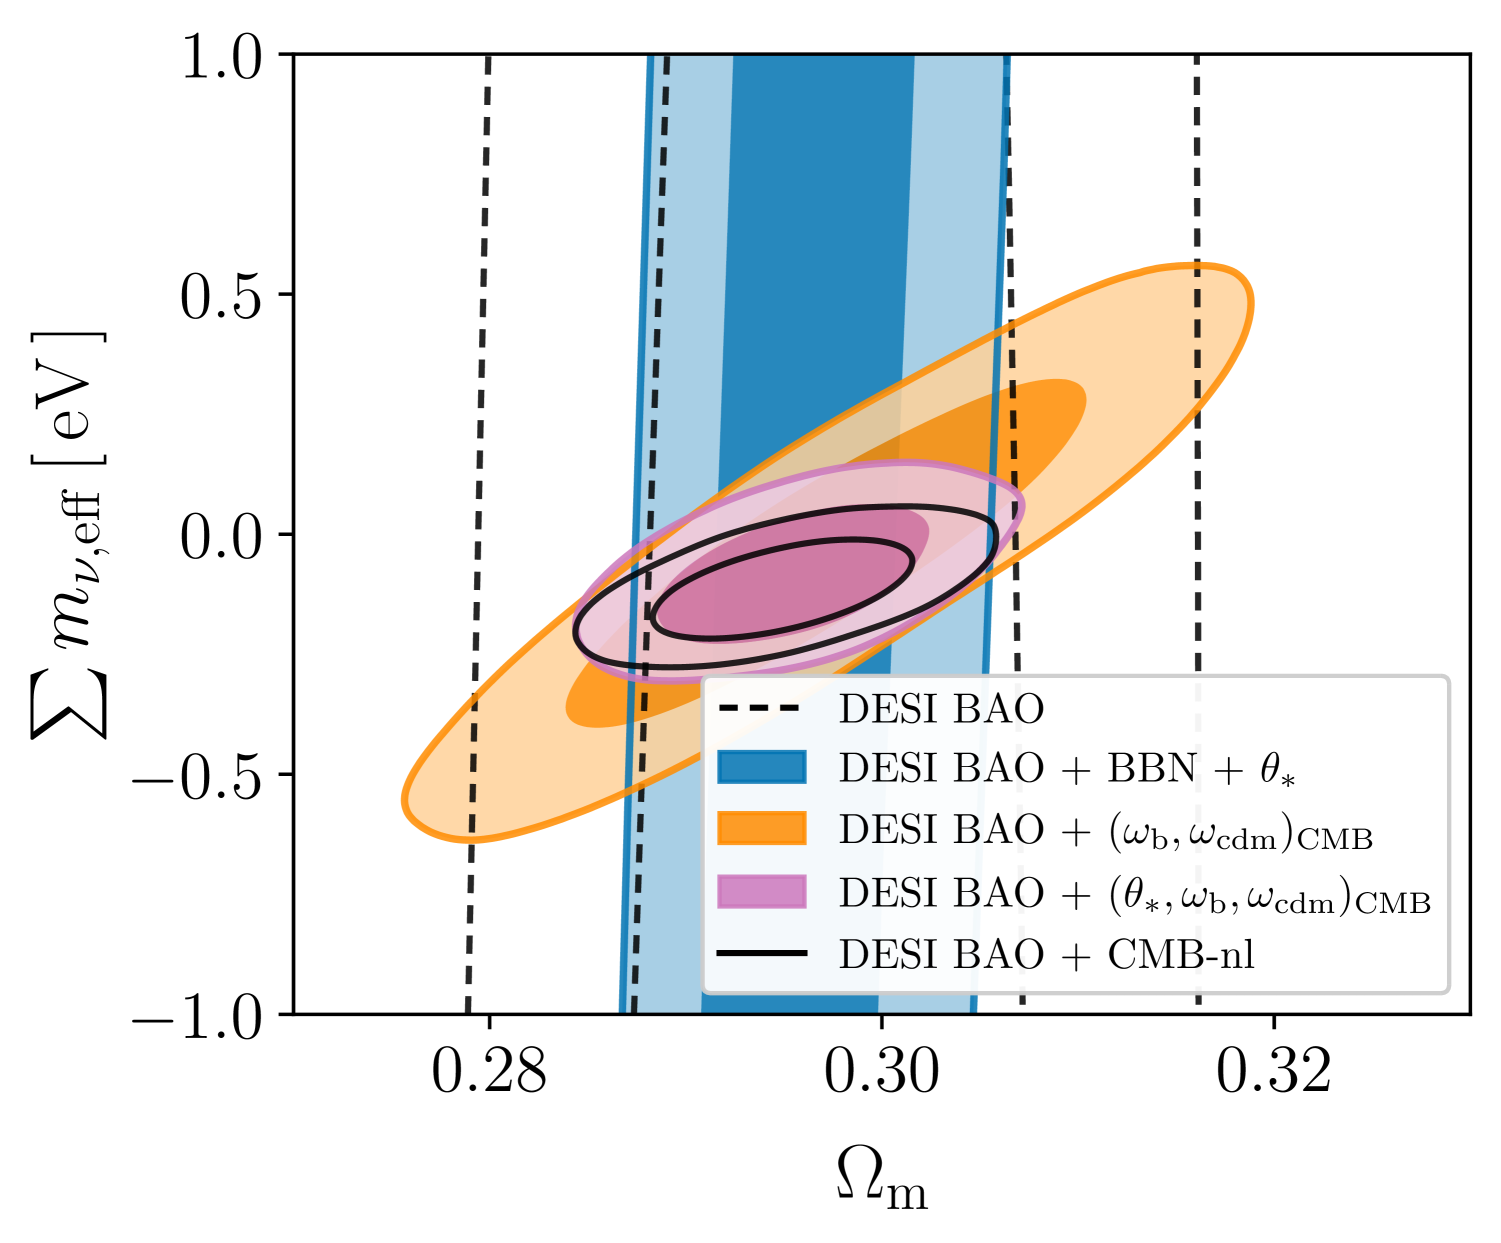
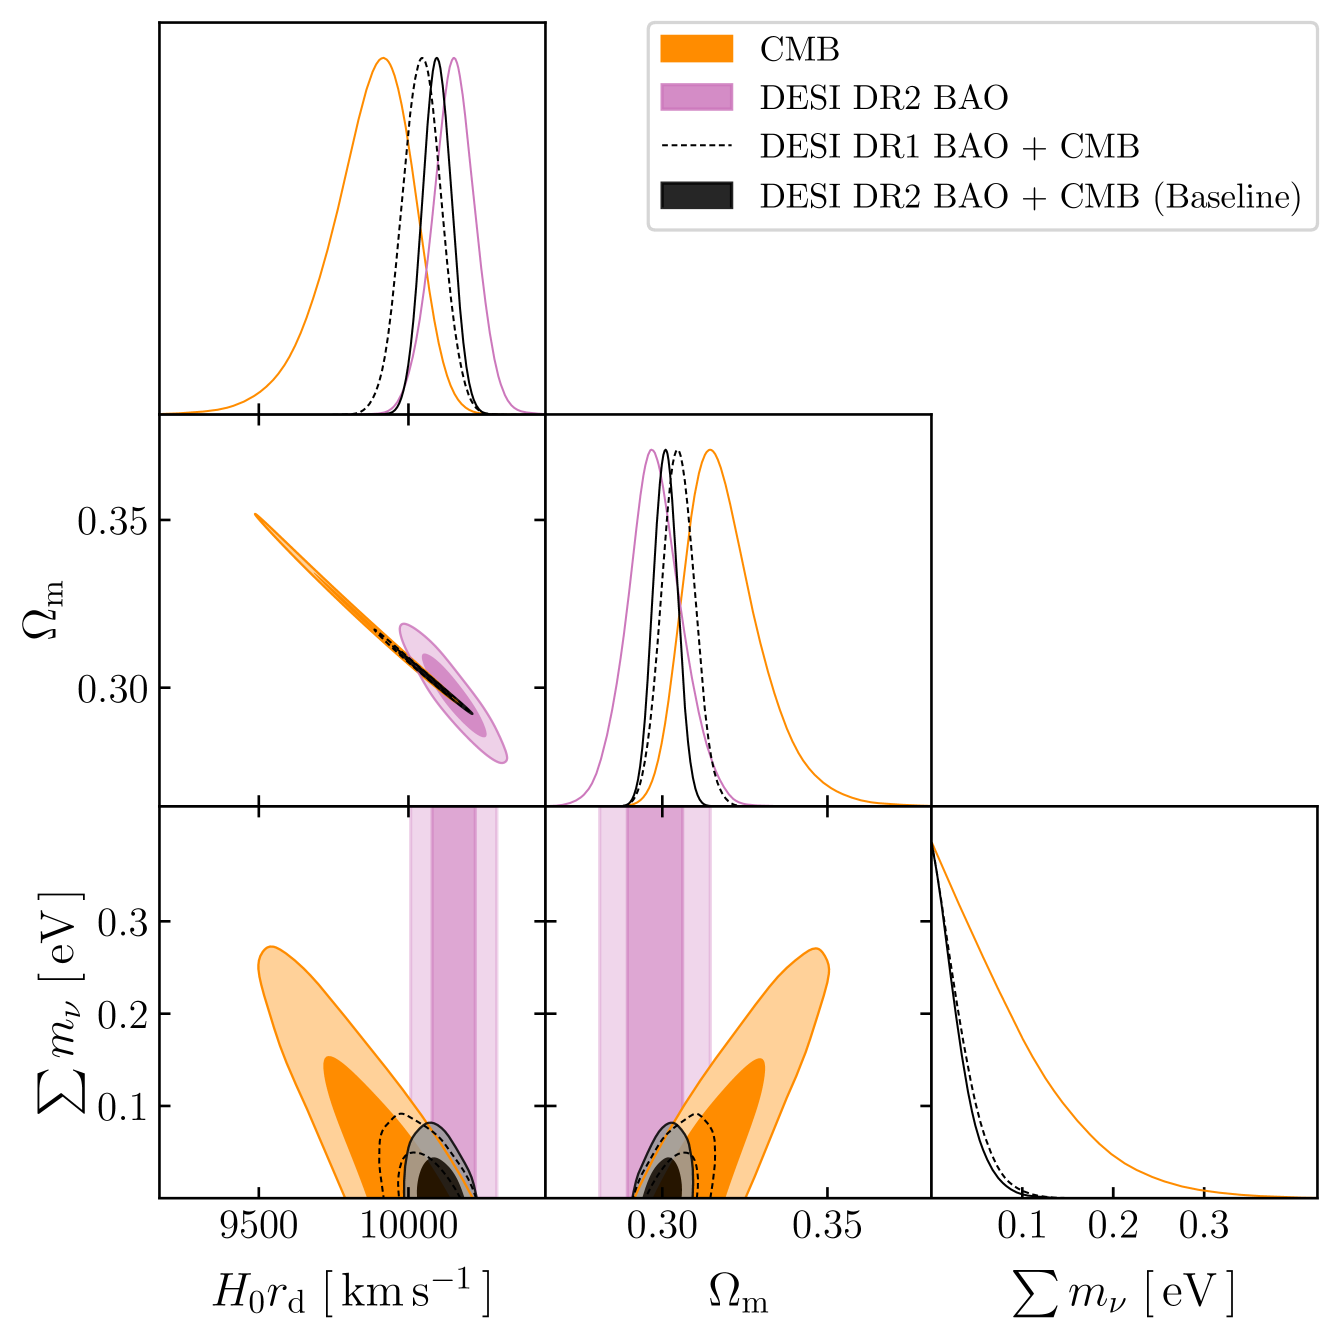
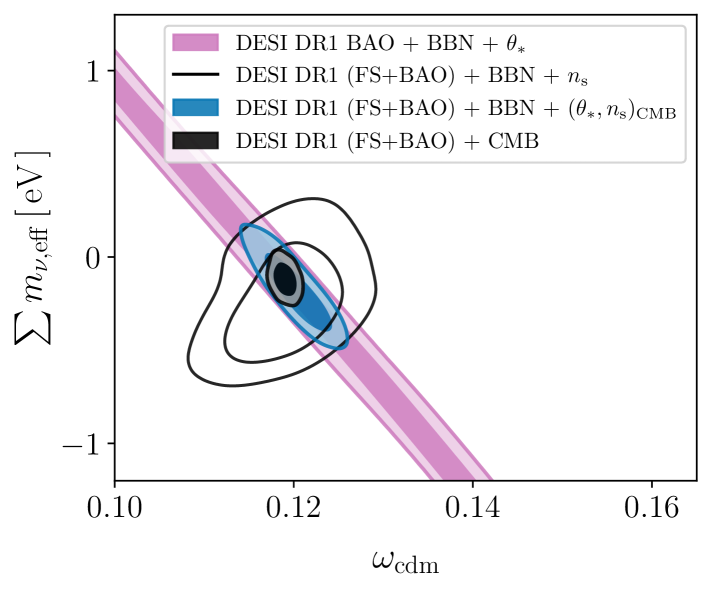
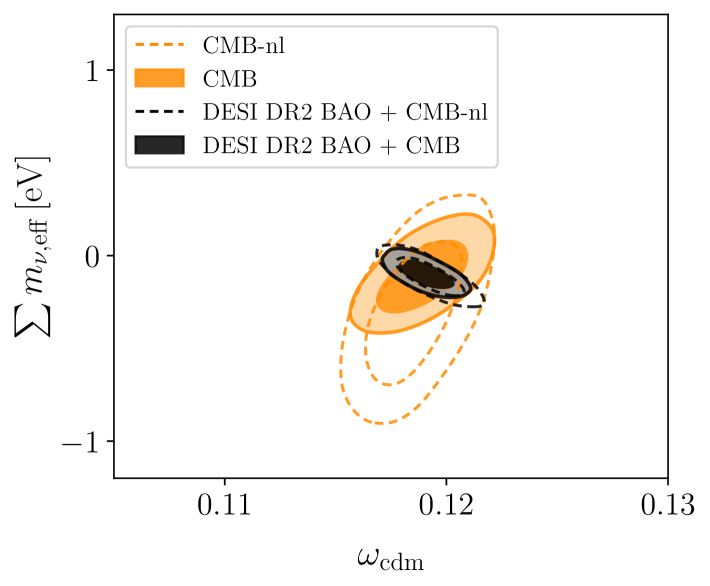
To illustrate that remains entirely unconstrained from BAO alone, we present the cosmological constraints from DESI DR2 BAO on and in Fig. 1. These results were obtained using the data and methods described in detail in Section III.
Additional information on can be obtained from measurements of the acoustic angular scale, , in the CMB. Although this is a close analogue of the BAO feature, measures the sound horizon at the epoch of recombination, . The relative timing of and depends on the baryon density, which cannot be determined from BAO and alone. An external BBN prior [48] on the baryon density, , allows us to relate and , effectively extending the relative BAO measurements to . Fig. 1 shows that this combination of DESI BAO + BBN + improves the precision on , but is unable to constrain as and remain degenerate.
Independent of , CMB data constrain the densities of baryons, , and cold dark matter, , through the relative amplitudes of the acoustic peaks. As neutrinos are still relativistic at recombination, these amplitudes depend only very weakly on . This distinguishing feature makes it possible both to break the degeneracy between and and to calibrate the standard ruler, , thus providing the necessary information to constrain , as shown in Fig. 1.333Note that in the cases where we include priors on multiple CMB parameters, we account for their correlations; see Section III.7. We note here in passing that the shape of the galaxy power spectrum provides another way to distinguish between neutrinos and cold dark matter, as we will discuss in Section VI.
The positive correlation between and , shown in Fig. 1, can be understood as follows. Eqs. 6, 9 and 10 show that BAO measurements constrain both , from the overall amplitude of the distance measurements, and , from their redshift dependence, resulting in a tight positive correlation between and . Once and (and hence ) are constrained by the CMB, this translates into a tight positive correlation between and . The strong connection between and is discussed extensively in [79].
Finally, we consider the case where are all constrained by the CMB. This amounts to the intersection of the two cases considered before: with greater precision on due to the additional leverage of a distance measurement at , with the degeneracy between and broken, and with calibrated, we obtain tight constraints on and that approach the limits obtained from the full combination of DESI and CMB-nl (CMB without lensing reconstruction), also shown in Fig. 1. As expected, the latter combination offers still more constraining power, because CMB-nl data depend on neutrino masses through other effects, such as the integrated Sachs–Wolfe effect, the lensing-induced smoothing of the acoustic peaks, and the damping tail. Among these, the lensing effect is particularly potent.
II.2 Growth of structure
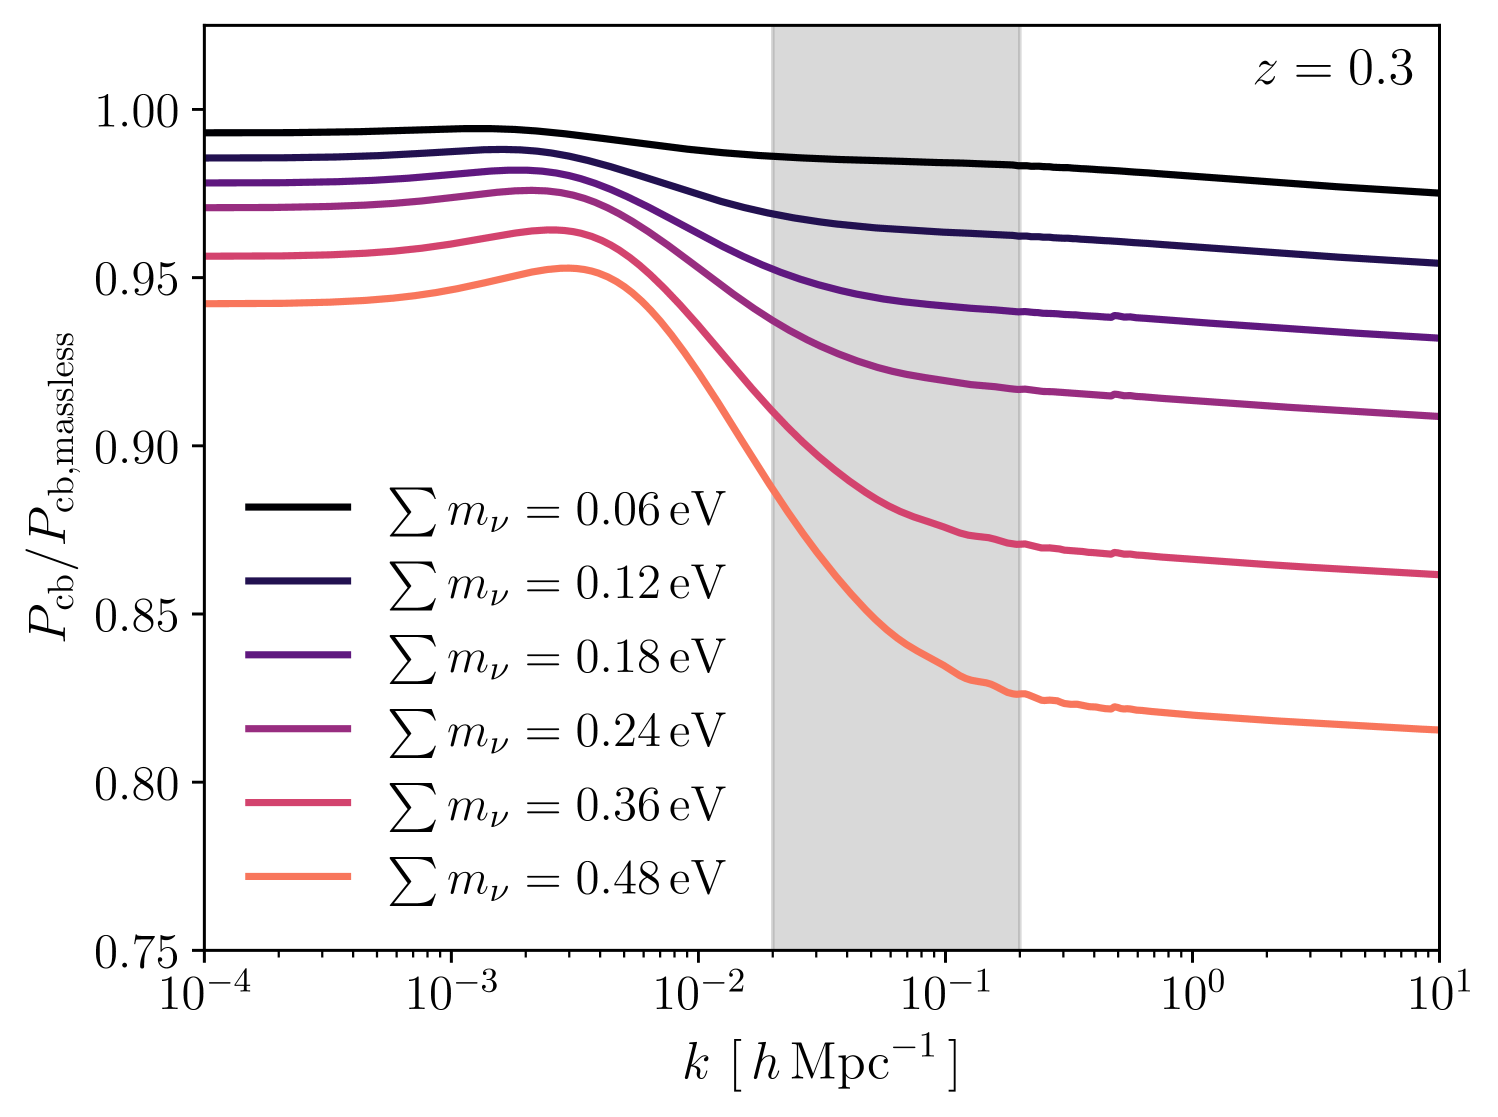
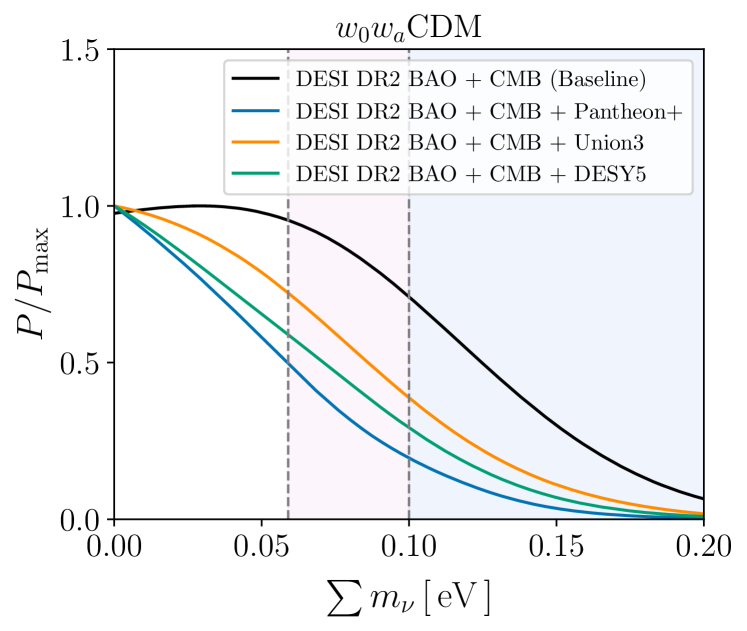
Another prominent effect of massive neutrinos is a suppression of the growth of cosmic structure on small scales. This effect is caused by the thermal phase-space distribution, as neutrinos escape regions smaller than a typical free-streaming length due to their large thermal velocities. Since neutrinos still contribute to the Hubble expansion, as in Eq. 10, but cluster less efficiently on small scales, the growth of density perturbations is reduced. This produces a characteristic scale-dependent suppression of the matter power spectrum, , as depicted in Fig. 2. The magnitude of this effect, [82, 83] (with the precise scaling dependent on which parameters are kept fixed), is significant even for neutrino mass fractions, , well below one percent.
BAO measurements are blind to neutrino free streaming. However, this information can be captured by properly modeling the full-shape galaxy power spectrum. We will analyze constraints from the full-shape analysis of DR1 galaxies in Section VI.
III Data and methodology
In this section we provide a brief overview of the DESI DR2 BAO and DR1 FS data and modeling, as well as the external datasets and codes used in the analysis.
DESI stands out as the current largest and most precise spectroscopic galaxy survey [41, 42, 43]. The instrument is equipped with 5,000 fibers [84] in a robotic focal plate assembly [85] on the Mayall Telescope at Kitt Peak National Observatory. With a high-performing optical design based on a 3.2 degree prime-focus corrector [86], DESI plans to measure over 40 million galaxy redshifts during a five-year period [87]. Indeed, with its target selection [88] over the imaging Legacy Survey [89, 90], DESI had a successful survey validation campaign [91] (including visual inspections [92, 93]) with an early data release [94]. The spectroscopic processing pipeline [95] and redshift estimation [96, 97] met the requirements, appropriate for a Stage-IV survey. DESI survey operations [98] already provided us with the first data release (DR1) [99], and measurements of galaxy clustering [100] were used to derive very precise BAO measurements, from both galaxy and quasars clustering [101] and the Lyman- forest [102], as well as a FS analysis of galaxies and quasars [103]. DR1 cosmological results were presented in [38, 39].
III.1 DESI DR2 BAO
We use BAO measurements from DESI DR2, based on 14 million galaxy and quasar spectroscopic redshift measurements, and 820,000 Lyman- forest spectra, as well as their cross-correlation with 1.2 million quasar positions. As discussed in Section II.1, DESI can measure the BAO scale along the line of sight and transverse to it, expressed either as the ratio of or to the sound horizon at the drag epoch, . On the other hand, isotropic BAO measurements constrain , where is the spherically-averaged distance.
The data are split into BAO measurements at various effective redshifts given by the different combinations of DESI tracers: BGS [104], LRG [105], ELG [106], QSO with their Lyman- forests [107]. In the case of our lowest redshift measurement, the BGS tracer in the range , we use the isotropic BAO measurement of . The rest of our BAO measurements from galaxy and quasar clustering consist of a combination of correlated measurements of and , namely: anisotropic BAO measurements for the LRG tracer in the redshift bins and ; a combined tracer measurement for LRG+ELG in ; another ELG tracer at ; and the QSO tracer in the range . These BAO measurements are described in detail in [40] and their systematic error tests are presented in [108]. Additionally, we complement these studies with further tests in the presence of massive neutrinos, as discussed in Section III.8. Finally, we also include BAO measurements of and from the Lyman- forest autocorrelation and cross-correlation with the QSOs, covering a higher redshift range ; see [109] for the measurement details, and their companion papers [110, 111].
III.2 DESI DR1 Full Shape
We use the Effective Field Theory of Large Scale Structure (EFT) [112, 113, 114, 115] to model the power spectrum multipoles of DR1 galaxies and quasars in a full-shape analysis. To this end, we rely on the same pipeline used for the DR1 publications [103, 39], but allow the neutrino mass to vary, as explored in [116]. We use the monopole and quadrupole moments of the power spectrum across 6 redshift bins: BGS (), LRG1 (), LRG2 (), LRG3 (), ELG1 (), QSO (). For further details on this analysis, including blinding strategies, random catalogs, the window function, radial and angular integral constraints, fiber-assignment mitigation, and the combination of galactic caps, the reader is referred to [103] and the supporting DESI references therein. Additionally, these sources provide broader discussions on the effects of various systematics arising from theoretical modeling [117, 118, 116, 119, 120], HOD assumptions [121], fiducial cosmology [122], and both imaging and spectroscopic considerations [123].
The baseline fitting range of scales is , covering the regime where nonlinear physics is still under control within EFT. Apart from the cosmological parameters, the modeling includes 7 nuisances parameters per tracer, that account for nonlinear contributions through EFT, the bias prescription, and stochastic effects. Some of these parameters are degenerate with those specifying the cosmological model, potentially leading to projection effects. To partially mitigate these effects, we implement physically motivated priors on the nuisance parameters; see [103].
Accurate covariance matrices are essential for both the BAO and FS analyses. For DR1, these were computed from 1000 samples of EZmocks, with corrections based on studies of DESI DR1 mocks from the Abacus suite and analytical Gaussian methods using the RascalC algorithm [124, 125, 126].
As expected, the FS description naturally incorporates information from the BAO peak, leading to a strong cross correlation that must be accurately modeled to combine both analyses. In particular, the covariances derived from the calibrated EZmocks effectively captured these cross correlations for the DR1 results presented in [103, 39].
In this paper, we present constraints from DESI DR1 (FS+BAO) that properly account for the cross correlation between the FS and BAO measurements of DR1 galaxies. At the time of writing, the DR2 FS analysis is still blinded. In principle, therefore, the combination of DR1 FS and DR2 BAO provides the most powerful dataset available. We estimated that this combination provides a slight improvement over the constraints that are possible with DESI DR2 BAO alone. However, a proper calculation of the cross correlation between DR1 FS and DR2 BAO requires mock catalogues that are not yet available. We therefore leave analyses of this combination for future work.
III.3 CMB data
We additionally combine our measurements with various external CMB datasets. We utilize measurements of temperature and polarization anisotropies from Planck [44] and lensing measurements from both Planck [45] and the Atacama Cosmology Telescope (ACT) [46]. The likelihoods used in this paper include the original released likelihoods from the Planck collaboration [44] and further releases made by Rosenberg et al. [127] and Tristram et al. [128, 129] in the years since.
The CMB likelihoods are broadly broken down into two components, the first, computed for high- (i.e. ) components of the temperature and polarization auto and cross spectra; the second, computed for low- (i.e. ) temperature and polarization auto spectra. The two regimes are treated differently due to a breakdown in the Gaussian approximations that can be made at high . Anisotropies at low must be treated differently due to the non-Gaussian and highly correlated measurements.
We use the following combinations of likelihoods:
-
•
PR3 plik: The original likelihoods from [44], where we specifically use the SimAll and Commander likelihoods for the low- temperature and polarization auto spectra (low- TTEE) and the plik likelihoods for the high- temperature and polarization auto and cross spectra (high- TTTEEE).
- •
- •
Finally, we make use of a CMB lensing likelihood based on a combination of Planck and ACT DR6 data [46, 47, 45].
The baseline CMB dataset used in this paper, denoted simply as ‘CMB’ from now on, consists of low- TTEE from Commander and SimAll, high- TTTEEE from CamSpec, and CMB lensing as described above.
III.4 SNe data
In this analysis we also use distance measurements from three compilations of Type Ia supernovae (SNe): Pantheon+ [131, 132], Union3 [133] and DESY5 [134]. Type Ia SNe have been observed since the late 90s from various survey programs utilizing many different telescopes in different observing conditions. Pantheon+ and Union3 both attempt to compile various SN observations from public and private legacy data, with much of these datasets overlapping between the two compilations. DESY5 constitutes an independent set of SNe data obtained from photometric observations of the Dark Energy Survey (DES) for , while also incorporating supernovae from spectroscopic surveys at low redshits, , including some from Union3 and Pantheon+.
| parametrization | parameter | default | prior |
| CDM | — | ||
| — | |||
| 444In some cases, where we use the CLASS code, we adopt instead of . This has no effect on the results. | — | ||
| — | |||
| — | |||
| — | |||
| Dark energy | or | ||
| Baseline neutrinos | |||
| Ordered neutrino | — | ||
| masses | — | 555See Eqs. 11 and 12 for the values of and . | |
| — | |||
| — | |||
| — | |||
| Effective neutrino | |||
| masses |
III.5 Neutrino oscillation data
In our analysis, we also rely on terrestrial constraints on the neutrino mass splittings, obtained from a global fit to solar, atmospheric, reactor, and accelerator experiments [49, 50, 51, 52]. We specifically use the values for the mass squared differences from NuFIT 6.0 [49, 50],
| (11) | ||||
| (12) |
with for the normal ordering (NO) and for the inverted ordering (IO). These imply lower bounds on the sum of neutrino masses,
| (13) |
For our purposes in this paper, the uncertainties on these lower bounds can be neglected.
III.6 Cosmological inference
We use the Cobaya code [135, 136] for cosmological parameter inference employing Metropolis-Hastings Markov-Chain-Monte-Carlo (MCMC) sampling. Cobaya in turn calls the Boltzmann codes CAMB [137] and CLASS [138, 139], as well as likelihoods for various datasets. The posterior chains are analyzed to derive summary statistics and plots using the getdist package [140].
The first set of runs are performed with a CDM model, specified by the first 6 parameters listed in Table 1, complemented with the sum of neutrino masses. The parameter is an approximation to the acoustic angular scale . This parameter is used only to make steps in the MCMC algorithm, while the actual likelihood calculations employ . The remaining parameters are the the amplitude of primordial scalar perturbations, , their spectral index, , and the optical depth, . The same model is later considered but with the sum of neutrino masses replaced by the effective number of relativistic degrees of freedom, , as a varied parameter.
We also consider variations of this model that have an additional parameter to represent a constant equation of state of dark energy that is allowed to take values different from , denoted as CDM+. A further extension is considered where the equation of state, , is allowed to vary in time with the parameter being its value today and the slope of its time evolution, denoted as CDM+. Prior ranges on these cosmological parameters are all given in Table 1.
In subsequent analyses, the neutrino masses are either modeled using a parametrization in terms of the lightest neutrino mass, , and squared mass splittings, or in terms of an effective neutrino mass parameter, . Details of these prescriptions are given in the corresponding sections. Most analyses use the CAMB code. In some cases, when considering the parameter, we instead use CLASS.
III.7 External priors
We also make use of certain external priors that compress the information from other experiments on parameters that are not measured well by DESI alone. These include a Gaussian prior on from Big Bang Nucleosynthesis (BBN) [48], given by . Following [39], we also use a Gaussian prior on , centered on the Planck value, [34]. In many cases, we adopt a looser prior with 10 times this uncertainty, , which we denote as . Finally, we also use more expansive multivariate Gaussian priors that compress the CMB information on or . We constructed these priors by analyzing the baseline CMB dataset (including lensing) for a CDM model with the effective neutrino mass parameter, , to properly capture the broader uncertainties that apply in this more general case.
III.8 Validation on mocks
Here, we present the results of an additional validation test of the neutrino analysis using a new set of mock catalogs that target massive neutrinos. Although the methodology has been thoroughly tested with mocks before (see [101, 108, 141, 142, 143] and many references therein), including with mocks based on high-fidelity simulations from the AbacusSummit suite [144, 145], we corroborate these results with a new set of high-fidelity simulations from the Peregrinus suite [146], which were specifically designed for neutrino mass analyses. Key differences with high-fidelity simulations used previously by DESI include the use of third-order initial conditions, the choice of -body code, the method for identifying bound structures, and the implementation of massive neutrino particles.
Let us briefly summarize the key properties of the Peregrinus simulations. They were carried out with the cosmological -body code SWIFT [147, 148], using the particle mesh and fast multipole methods for the gravitational force calculations, on the COSMA-8 system in Durham. The initial conditions were generated with third-order Lagrangian perturbation theory at using the monofonIC code [149, 150], accounting for the presence of neutrinos [151, 152]. The simulations followed the evolution of dark matter and baryon particles and massive neutrino particles in a comoving volume of , giving a dark matter particle mass of . Massive neutrinos were implemented in the simulation with the method [153] to model efficiently their non-linear evolution. Dark matter structures were identified using the hierarchical bound tracing (HBT+) method [154, 155, 156], which is particularly suited for accurately identifying and tracking substructures.
From these simulations, we created a set of specialized mock catalogs that target the DESI Bright Galaxy Survey (BGS), using the halo occupation distribution (HOD) mock pipeline outlined in [157], adapted for use with the Peregrinus simulations. This process entails fitting an HOD to each of a number of galaxy luminosity bins ranging from magnitude to , such that the resulting set of galaxies in each bin reproduces a target projected two-point correlation function and the entire set reproduces a target luminosity function. These target functions are designed to match the results of the DESI One-Percent survey [91]. The pipeline performs this HOD-fitting procedure for each simulation in the suite, and produces a mock catalog using this HOD applied to the simulation snapshots or lightcones.
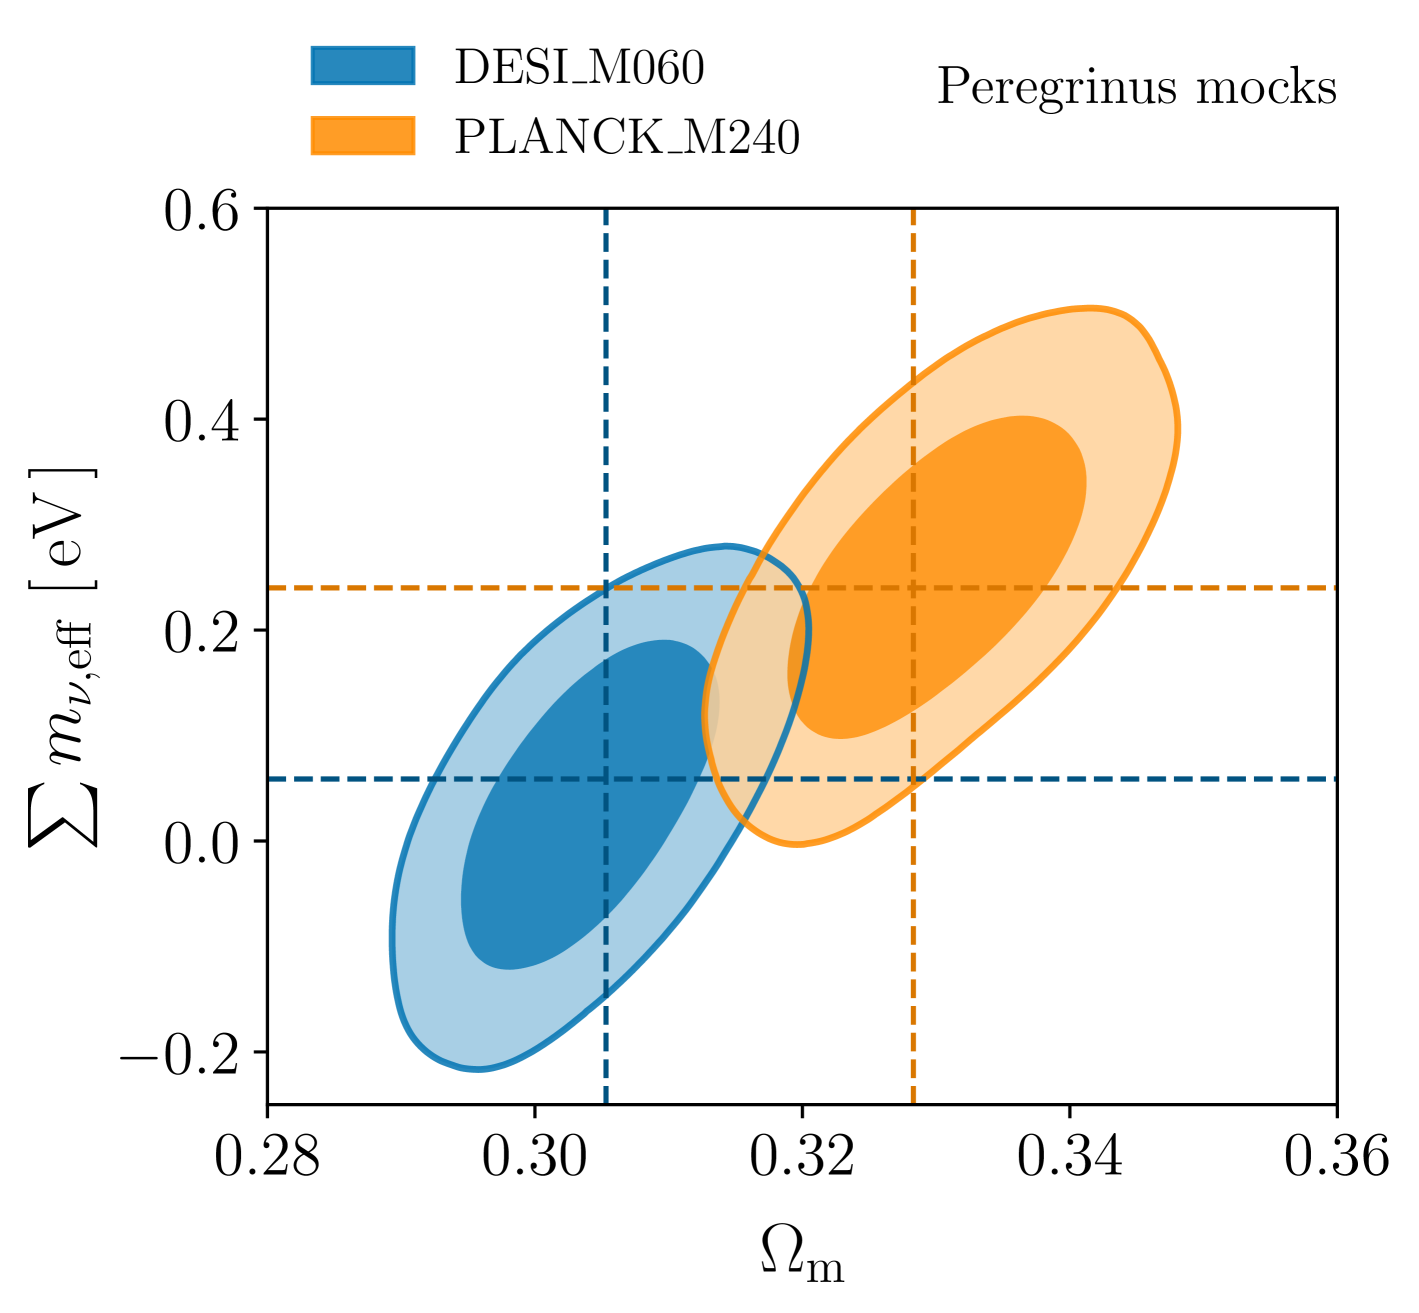
In the validation test presented here, we make use of two Peregrinus simulations: one with a Planck-based CDM cosmology with a large neutrino mass of and one with a DESI-like CDM cosmology with a neutrino mass of . The tests are based on cubic-box mocks at redshift with an absolute magnitude cutoff of , matching the fiducial DR2 cutoff, and RSD imposed along one of the Cartesian axes. We compute the galaxy correlation function from the pre-reconstruction distribution of galaxies and fit an isotropic BAO template, following the choices of [101]. The resulting determination of the distance ratio, , is combined with a synthetic correlated CMB prior on , with the uncertainties matching the real baseline CMB dataset used in this paper, in an MCMC analysis to place constraints on the cosmological parameters. Fig. 3 shows that we obtain unbiased constraints on and the effective sum of neutrino masses, , for both Peregrinus mocks. This confirms the expectation that the baseline DESI choices can be reliably applied in models with large neutrino masses, even when accounting for any possible non-linear effects or changes in galaxy-halo connection. Further tests using these mocks will be presented in an upcoming work.
IV Standard neutrino results
In this section, we report our baseline constraints on the sum of neutrino masses, , and on the effective number of relativistic species, , in the early Universe. We also present results on the preference for the normal mass ordering and constraints on the lightest neutrino mass. Finally, we investigate the impact of different CMB likelihoods and supernova datasets.
IV.1 Baseline neutrino mass constraints
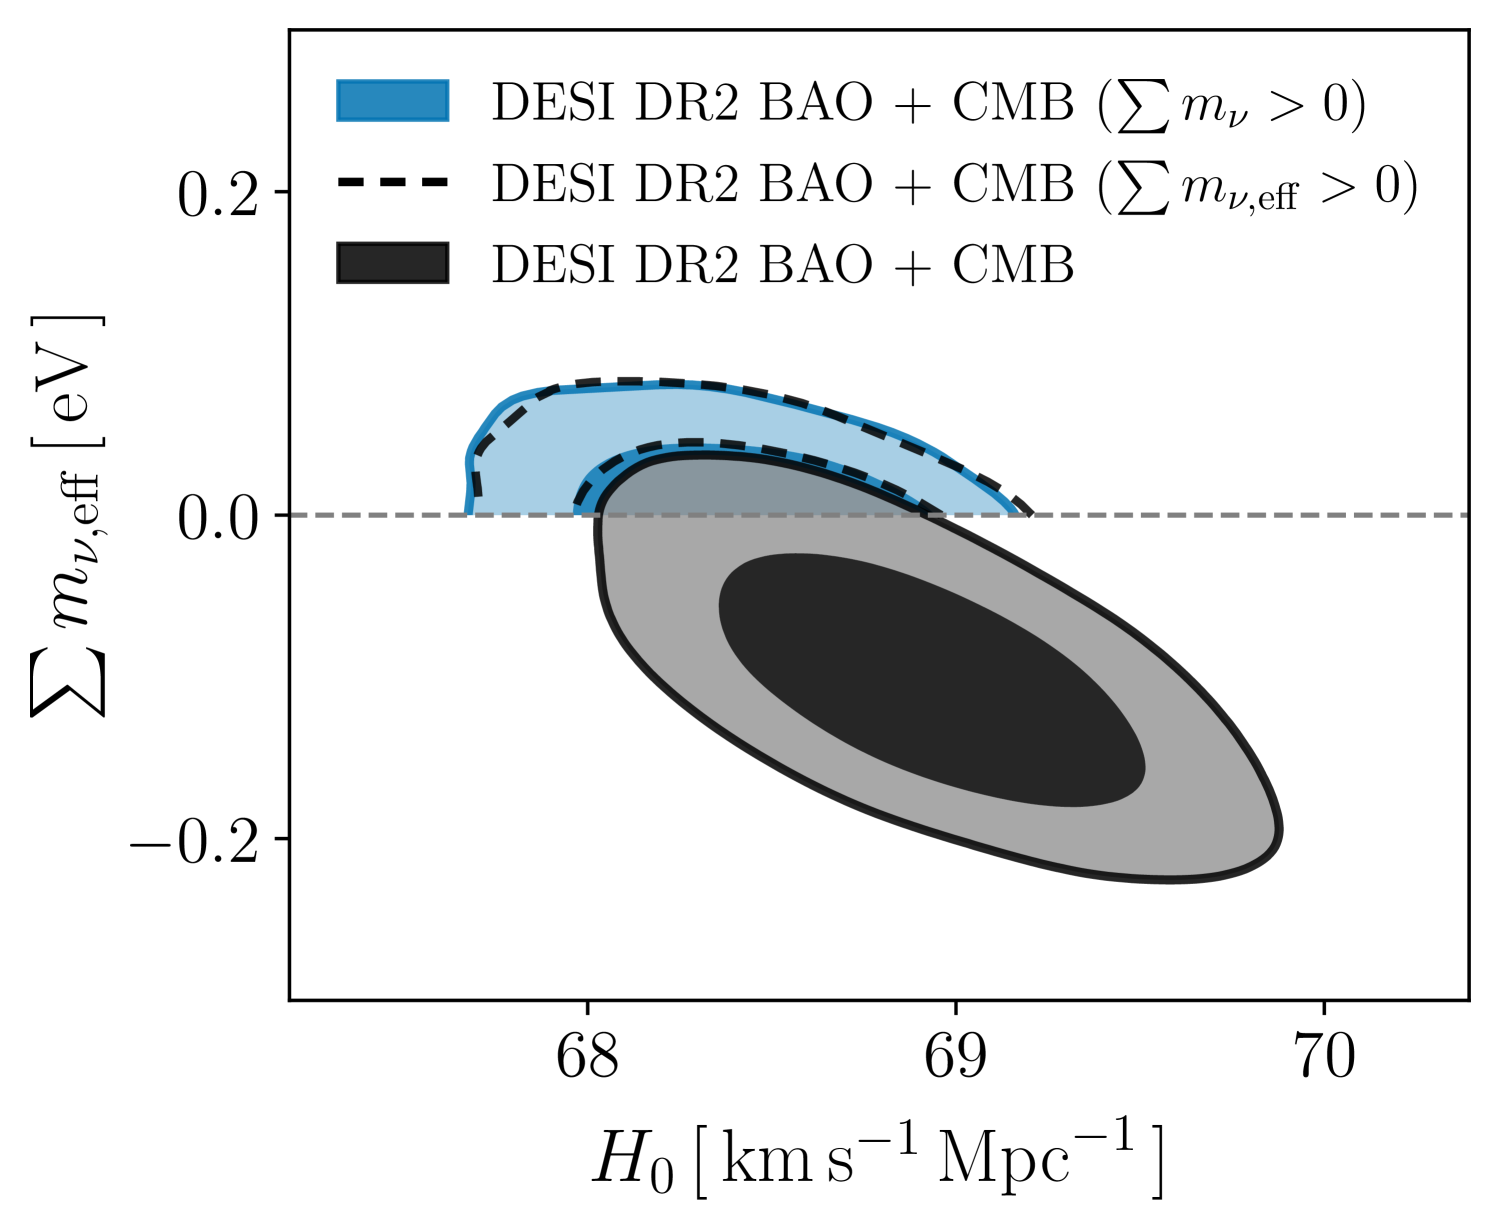
We first report the baseline constraint on the sum of neutrino masses, , described in the companion paper [75]. Assuming the CDM model and adopting a degenerate mass spectrum accompanied only with a prior that , the combination of DESI DR2 BAO with CMB data yields a tight upper bound of
| (14) |
This constraint is obtained using our baseline CMB dataset, which we refer to simply as ‘CMB’ throughout the paper. This dataset includes both CMB lensing reconstruction from Planck PR4 and ACT [46, 47, 45], the low- SimAll and Commander likelihoods [44] and the high- CamSpec likelihood [130]. The corresponding marginalized posterior distribution is shown in Fig. 4, showcasing the improvement compared to DESI DR1 BAO.
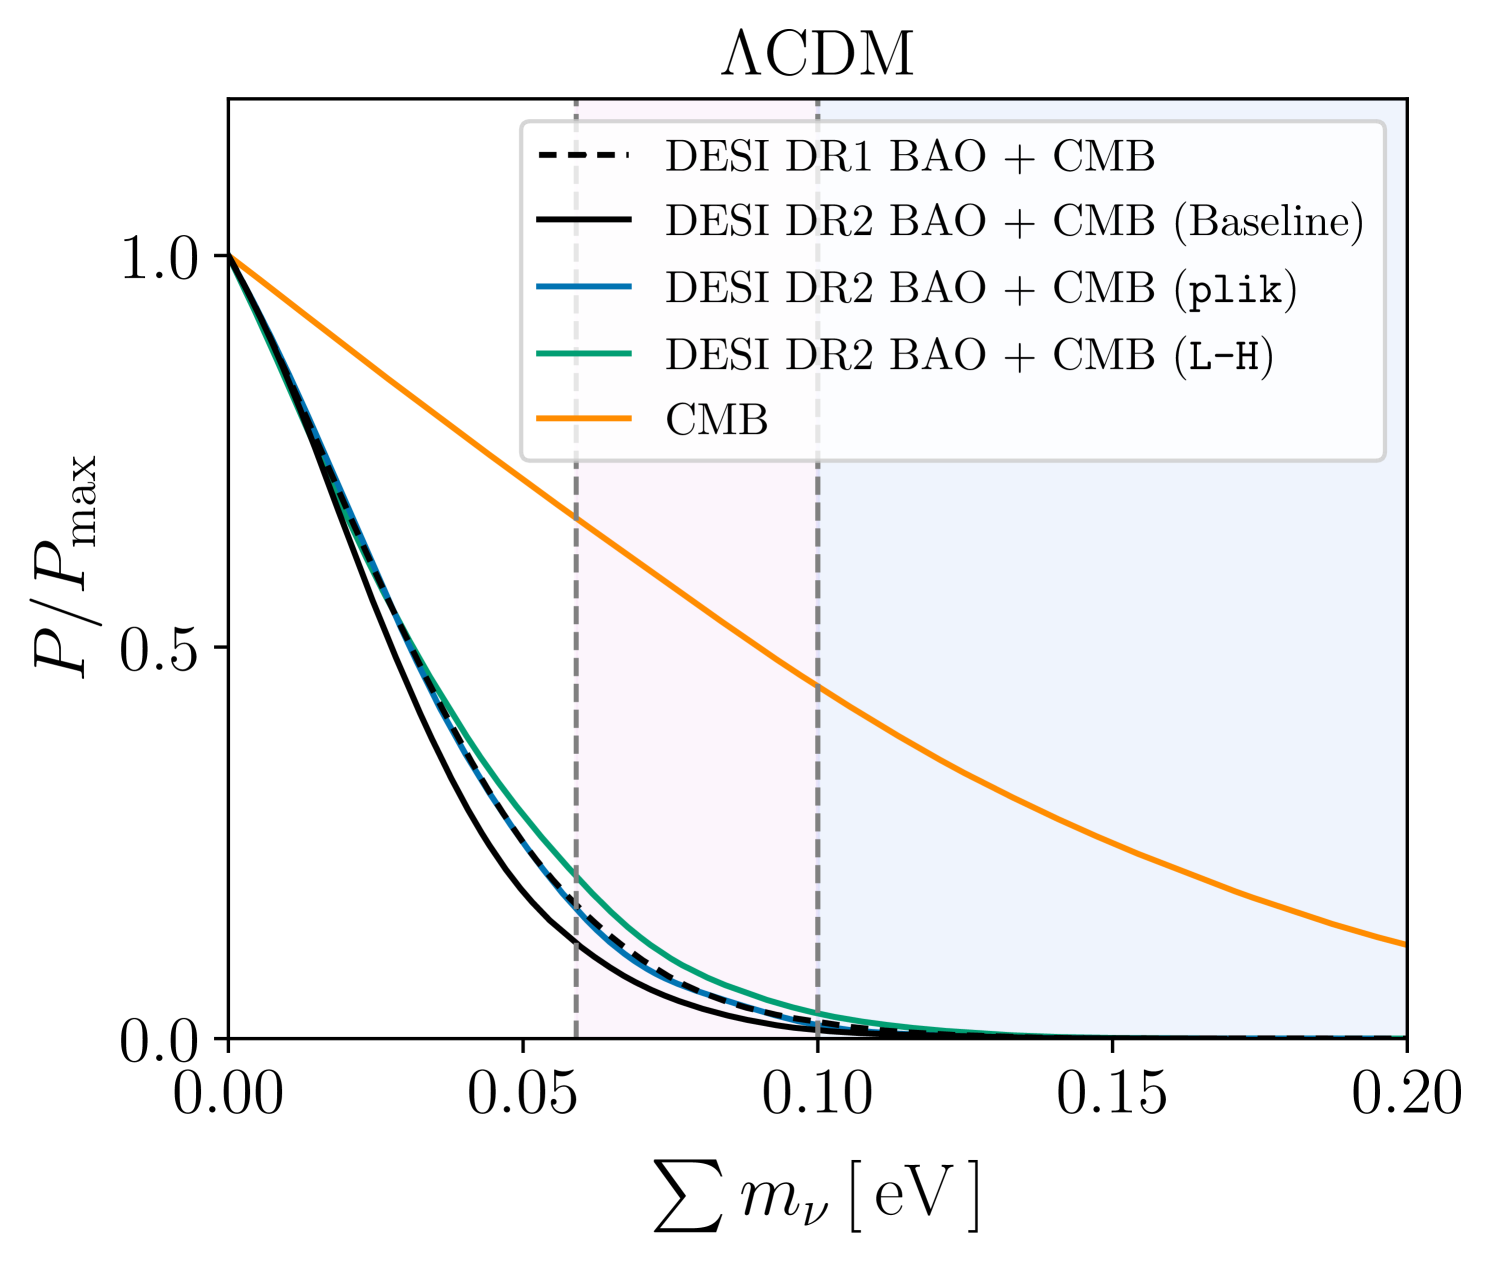
The power of CMB and BAO measurements to constrain the sum of neutrino masses is illustrated by Fig. 5. Within the CDM model, there is a geometric degeneracy between CMB constraints on and the basic parameters and , as each impact the cosmic expansion rate at late times, thereby changing the distance to the surface of last scattering and shifting the angular size of CMB anisotropies. This degeneracy can be broken with measurements of the BAO distance scale at late times. The figure demonstrates that DESI DR1 BAO measurements prefer values of and in the tail of the CMB posteriors, leading to a preference for small masses along the degeneracy direction. This tendency is even stronger for DESI DR2 BAO, giving rise to the tight upper bound of Eq. 14.
This limit already violates the lower bound from neutrino oscillations for the inverted ordering () and approaches the lower bound for the normal ordering (). The consequences of this will be explored in detail in Sections IV.3 and V.
However, these results depend on the assumed CDM model. Generalizing to a dark energy model in which the equation of state, , is constant but may be different from , we obtain
| (15) |
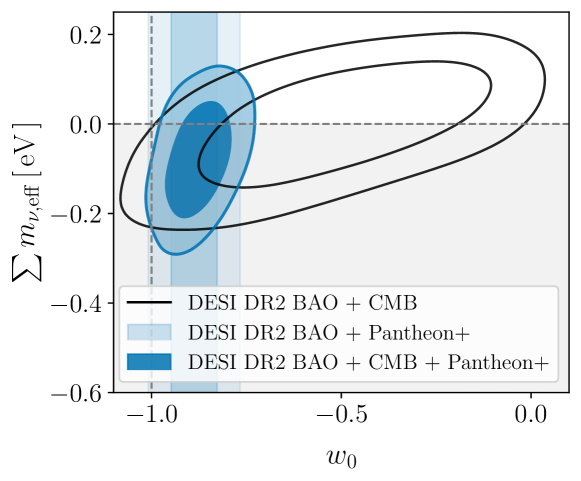
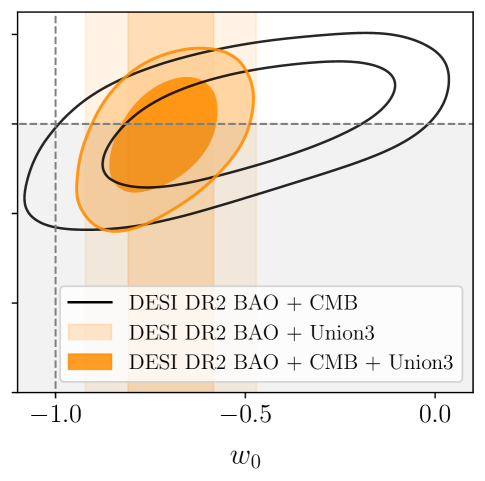
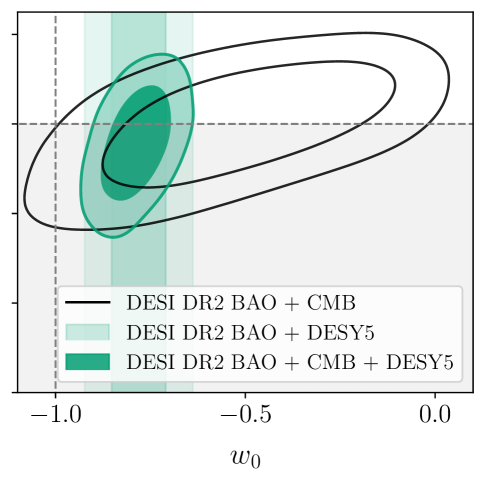
where we additionally added supernovae from the DESY5 dataset to further constrain the equation of state. We obtain values, , consistent with a cosmological constant, and a neutrino mass bound that is even tighter than in CDM. Similar results are found for supernovae from Union3 and Pantheon+ (see Table 2). It is only when we allow for a varying dark energy equation of state, parametrized by and , that we obtain a relaxed bound
| (16) |
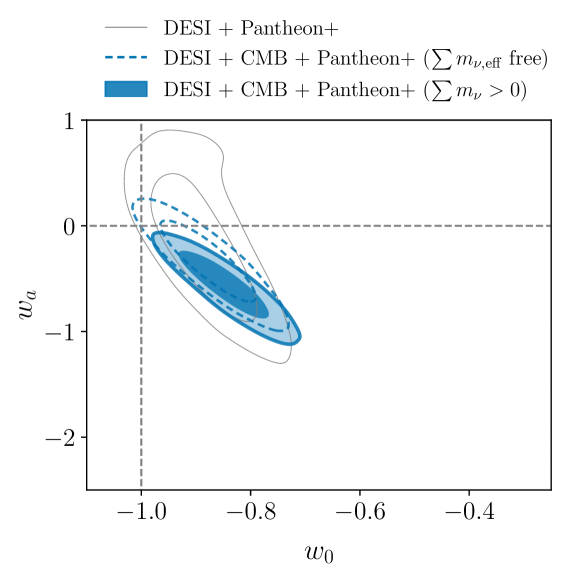
This upper limit remains consistent with the lower limit for both mass orderings. Although the marginalized posterior distribution of , shown in the right panel of Fig. 7, still peaks at the prior edge, , our analyses based on profile likelihoods and on models with effective neutrino masses in Section V, will show that moving to CDM shifts the most likely value of in the positive direction. The connection between evolving dark energy and neutrino masses will be discussed further in that section.
IV.2 Effective number of relativistic species
DESI BAO and CMB can also constrain the effective number of relativistic species in the early Universe, . For the one-parameter extension CDM+, we obtain
| (17) |
This value is higher than in the DR1 analysis [38], which we similarly attribute to the preference for larger and smaller . In the more general case, where we constrain and simultaneously, we find
| (18) |
The correlation between the two parameters is not very significant and consequently the upper bound on only increases marginally. In all cases, our constraints on remain compatible with the Standard Model prediction that , as detailed in Table 2.
In addition to the geometrical signature of probed by our standard analysis of DESI BAO and CMB data, neutrinos also induce a phase shift in the BAO that has already been detected with DESI DR1 data [158]. The origin of this effect lies in a temporal shift in the gravitational potential at the time the BAO propagate through space, which occurs because neutrinos carry energy and move faster than the sound speed of the primordial plasma (see [159, 160] for details). It was first measured using a template parameterization in [161]. In the Standard Model with , it is expected that the phase shift amplitude in this parameterization, , should be ; would correspond to no detection of a phase shift and . In [158], was measured using DESI DR1 BAO data, giving at from a combination of tracers. Repeating this analysis with DESI DR2 BAO gives at .
IV.3 Neutrino mass ordering
Our baseline analysis assumes that , where is the mass of three degenerate neutrino mass eigenstates. While this is a reasonable approximation for the cosmological effects of massive neutrinos [31, 162, 163, 164, 165], it is clearly incompatible with the non-zero squared mass differences implied by the finding of neutrino oscillations. An alternative approach is to adopt a parametrization for the sum of neutrino masses in terms of the lightest neutrino mass, , and the squared mass splittings and [32, 33]. In the case of the normal ordering (NO), we have
| (19) |
with , while in the case of the inverted ordering (IO),
| (20) |
with . To be completely general, we may also introduce a binary variable, , for the mass ordering. In this most general case with free (denoted as NO/IO), we will assign equal prior probability to both mass orderings. While this prescription offers a natural way to fold in prior information from neutrino oscillation experiments, it also leads to highly non-linear priors for the heavier neutrino masses. If the same mechanism is responsible for generating all three neutrino masses, then a prior that is linear for all masses may be better motivated.
From the combination of DESI BAO, CMB, and a global fit to neutrino oscillation experiments (NuFIT 6.0) [49], we obtain the following constraint on the lightest neutrino mass,
| (21) |
when assuming the normal mass ordering or in the general case (NO/IO). When assuming the inverted mass ordering, we find a very similar bound of
| (22) |
This is a significant improvement with respect to a similar analysis utilizing BOSS DR12 [166], Planck 2015 [167], Pantheon SNe Ia [168], and BBN information [169], that yielded (95%) [32]. The result may also be compared with the constraint, [33] from Planck 2018[34], BOSS DR12 [166], the DR7 Main Galaxy Survey [170], and the Six-degree-Field Galaxy Survey (6dFGS) [171].
In the general case, the data moderately prefer the normal mass ordering. Assuming CDM, we find a posterior probability from DESI BAO + CMB + NuFIT of
| (23) |
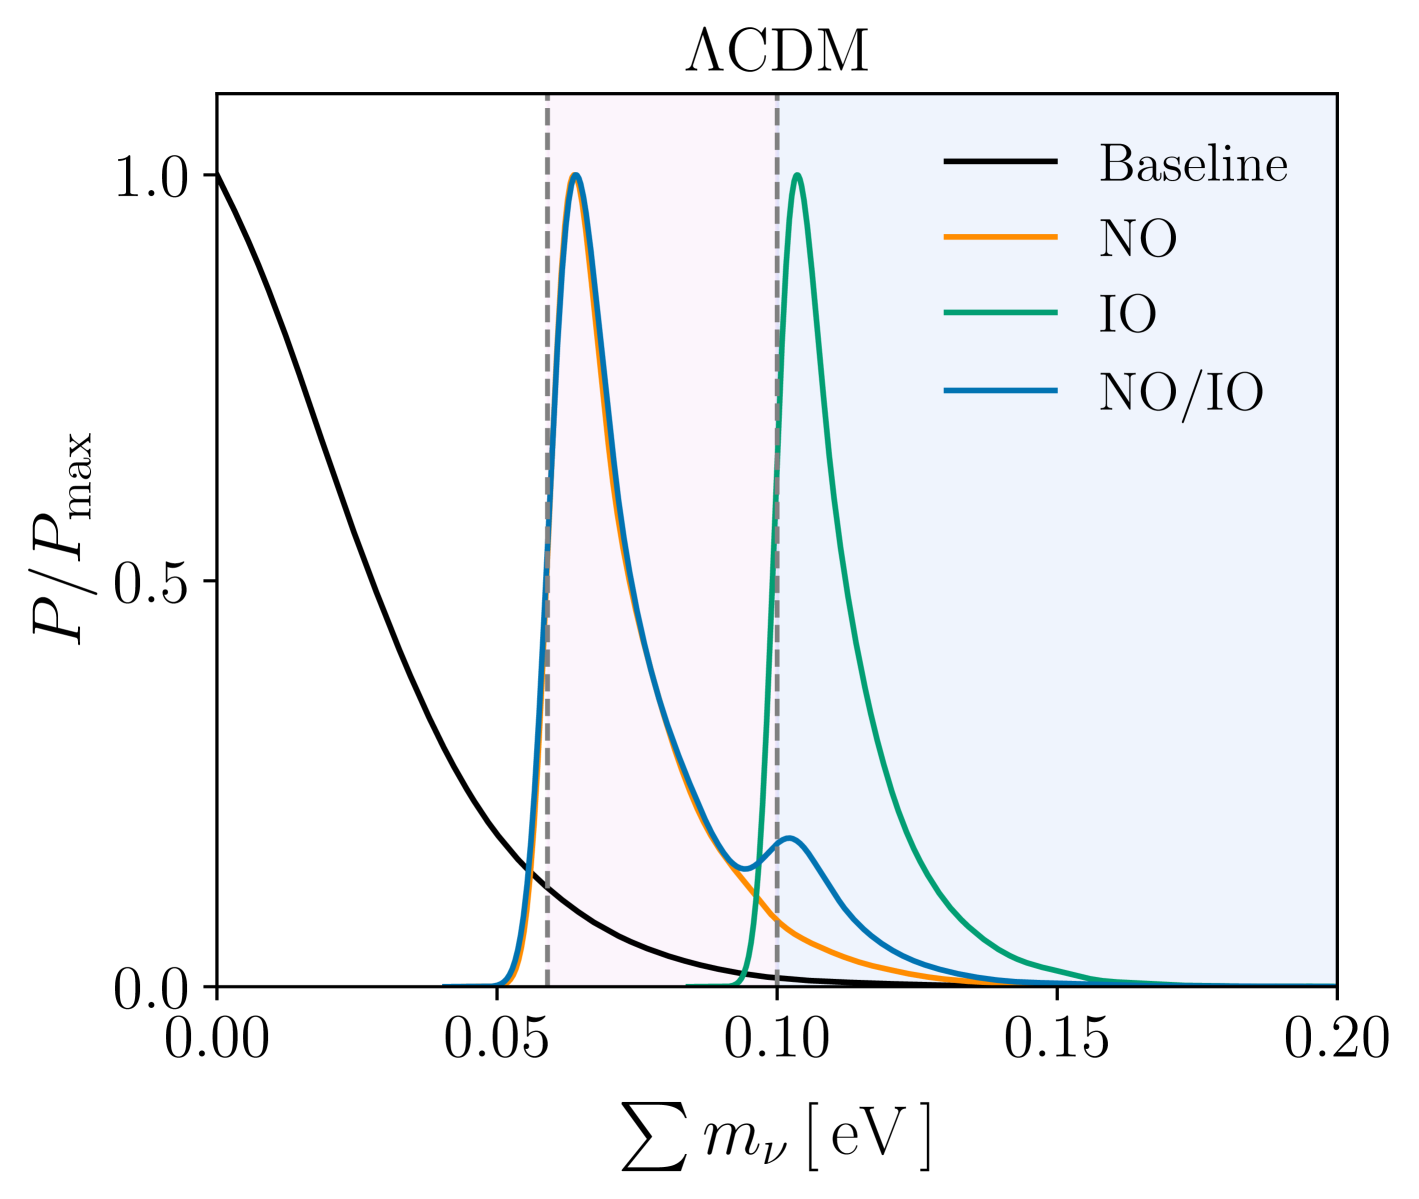
This corresponds to a Bayes factor of . The evidence is slightly weaker for the alternative CMB likelihoods ( for L-H and for plik). Overall, this analysis thus provides substantial evidence in support of the normal mass ordering, under the assumption of the CDM + cosmology. See Fig. 6 for the marginalized posterior distributions on the sum of neutrino masses for the different mass ordering scenarios.
In a previous DESI analysis based on DR1 BAO data [38], the upper limits for the normal and inverted mass orderings were determined by assuming a degenerate mass spectrum (as in the baseline case here) and imposing the additional prior that (NO) or (IO). The posteriors obtained under this approximation agree well in the tail of the distribution. Consequently, we confirm that the approximate procedure produces accurate upper limits. In the case of the normal ordering, we find
| (24) | ||||
| (25) |
while in the case of the inverted mass ordering
| (26) | ||||
| (27) |
thus validating the results from [38].
| Model/Dataset | [km s-1 Mpc-1] | [eV] | or | |||
| CDM+ | ||||||
| DESI BAO+CMB (Baseline) | — | — | — | |||
| DESI BAO+CMB (L-H) | — | — | — | |||
| DESI BAO+CMB (plik) | — | — | — | |||
| DESI BAO+CMB+Pantheon+ | — | — | — | |||
| DESI BAO+CMB+Union3 | — | — | — | |||
| DESI BAO+CMB+DESY5 | — | — | — | |||
| CDM+ | ||||||
| DESI BAO+CMB | — | — | — | |||
| CDM++ | ||||||
| DESI BAO+CMB | — | — | ||||
| CDM+ | ||||||
| DESI BAO+CMB | — | — | ||||
| DESI BAO+CMB+Pantheon+ | — | — | ||||
| DESI BAO+CMB+Union3 | — | — | ||||
| DESI BAO+CMB+DESY5 | — | — | ||||
| CDM+ | ||||||
| DESI BAO+CMB | — | — | ||||
| DESI BAO+CMB+Pantheon+ | — | — | ||||
| DESI BAO+CMB+Union3 | — | — | ||||
| DESI BAO+CMB+DESY5 | — | — | ||||
| CDM+ | ||||||
| DESI BAO+CMB | — | |||||
| DESI BAO+CMB+Pantheon+ | — | |||||
| DESI BAO+CMB+Union3 | — | |||||
| DESI BAO+CMB+DESY5 | — | |||||
| CDM+ | ||||||
| DESI BAO+CMB | — | |||||
| DESI BAO+CMB+Pantheon+ | — | |||||
| DESI BAO+CMB+Union3 | — | |||||
| DESI BAO+CMB+DESY5 | — |
IV.4 Impact of CMB likelihoods
We investigate the dependence of neutrino mass constraints on the Planck CMB likelihood, specifically comparing the plik, CamSpec and L-H combinations within CDM. The three likelihoods produce some notable differences in their constraints on the broader CDM parameter space, the most striking being a preference for a smaller in CamSpec and L-H in comparison to plik. In addition, the L-H likelihoods produce smaller degeneracies between the primordial power spectrum amplitude, , and optical depth, . These differences, while important in their own respect, do not appear to be directly responsible for the slight offsets between the resulting constraints on the summed neutrino mass.
One of the key differences in the three likelihoods, that may be driving the subtle differences in neutrino mass, are their reported measurements of [172, 173, 174], a phenomenological parameter used to test for preferences in the data for increases in the amplitude of gravitational lensing. This is often used as a diagnostic to test for unknown systematics or incompatibilities with the assumed cosmological model. Original results from plik resulted in values of at greater than significance. Subsequent analysis with CamSpec reduced this anomaly. For L-H, the obtained values of are slightly smaller still and consistent with unity. While the importance of for neutrino mass constraints has long been recognized [175, 33, 176, 69, 66, 68, 70], the exact causes of the lensing anomaly are complex and may be due to a combination of choices in data processing and modeling.
In combination with DESI DR2 BAO, the plik and CamSpec likelihoods from Planck provide similar constraints of and , respectively. Although is less discrepant from unity in CamSpec than in plik, perhaps suggesting a relaxation of the neutrino mass bound, CamSpec also uses more data from Planck PR4 and provides tighter parameter constraints overall. For L-H, the upper bound is significantly larger, . The broader constraints from L-H remain even when incorporating the squared mass splittings for the normal or inverted mass orderings. See Fig. 4 for a comparison of the 1D marginalized posterior distributions when adopting the different likelihoods.
IV.5 Impact of SNe data
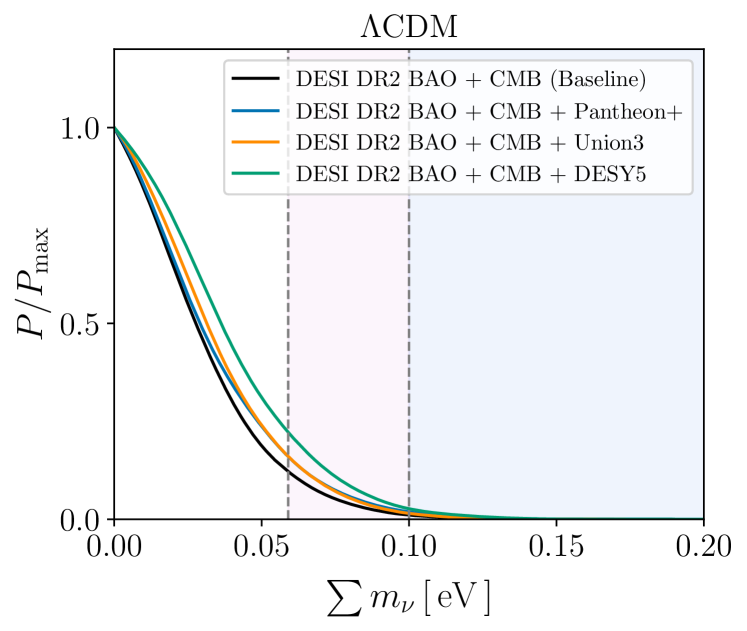
Within the CDM framework, we find that the influence of the three ensembles of Type Ia supernovae on neutrino mass is significantly weaker than that of the selected CMB likelihood. In all cases, the constraints are slightly relaxed compared to the case without SNe, and accompanied by marginally higher values of and lower values of . For our baseline CMB likelihood (CamSpec), Union3 gives the strongest bound of , while Pantheon+ gives . DESY5 generally pushes the constraints to larger values, yielding . However, within CDM, the offsets between CMB likelihoods dominate (see Table 2).
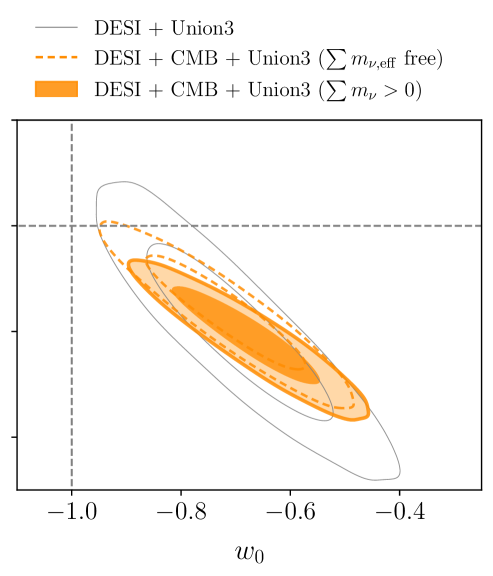
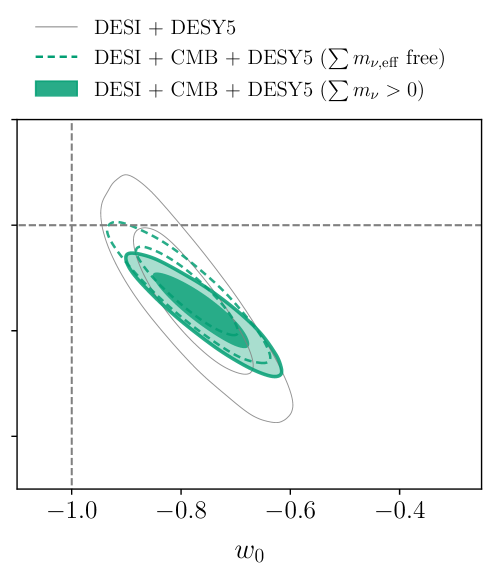
Once we move to a dynamical dark energy in the – parameter space, the differences between the CMB likelihoods are relatively smaller. For DESY5, we find similar constraints of for plik and for CamSpec, while for L-H the upper bound is . On the other hand, changing the SNe dataset produces considerably larger differences in the constraints, as can be seen from Fig. 7. With Pantheon+, the upper bound is given by , while this is with Union3 and for DESY5. These differences are driven by their relative departures from CDM, which is largest for Union3 and smallest for Pantheon+ (see Fig. 13 for the case with effective neutrino masses) and their relative constraining power, which is similarly highest for Pantheon+ and lowest for Union3. This is different from the constraints in CDM, where Pantheon+ and Union3 present similar upper bounds of and , respectively, while for DESY5, we obtain tighter constraints of .
V Neutrino mass tension
As discussed in Section IV.1, our baseline constraint on in CDM approaches but remains compatible with the lower limit from neutrino oscillations under the normal mass ordering. We can thus combine our cosmological results with the constraints from neutrino oscillation experiments. This combination was used in Section IV.3 to constrain the lightest neutrino mass and determine the preference of current data for the normal mass ordering.
However, an unsatisfactory feature of the posterior distribution in our baseline analysis is that it peaks at the edge of the prior, , and that most of the posterior volume is excluded by neutrino oscillations. Below, we confirm from a frequentist perspective that the data appear to prefer values that lie in the negative mass range. This motivates the analysis in the following subsection, where we use an effective neutrino mass parameter, , to explore such scenarios in detail.
V.1 Profile likelihood
We build profile likelihoods for the sum of neutrino masses by fixing to certain values, and then performing maximization of the likelihood over all nuisance parameters and other cosmological parameters. This frequentist method does not require the use of priors, aside from imposing bounds on the explored domain for the minimization which can be seen as a “uniform prior”. In particular, we limit ourselves to probing the physical region where . In the case of nuisance parameters in the CMB and the DESI FS likelihoods, we apply penalties as prescribed by their respective frameworks.
In practice, we perform a numerical minimization over the log-likelihood, i.e. , using the Minuit [177] minimizer through its Python frontend, iminuit [178]. The number of free parameters ranges from 14 for the DESI BAO + CMB combination to 44 for DESI (FS+BAO) + CMB.
As in the Bayesian formalism, profile likelihoods for the neutrino mass are often truncated by the limit, sometimes not even exhibiting a trough in the positive sector. Instead, the apparent minimum is located at the physical boundary, . Since we find the resulting profiles to be in good agreement with a parabolic fit, owing to the Gaussian nature of the data (see also [179, 70]), we extend them into a fully-fledged parabola. The resulting parameters are the parameters of a corresponding distribution. We report the minimum of the parabola, , and its scale, , which in turn can be directly interpreted as the constraining power of the likelihood combination.
Considering the overlap between the parabola and the negative sector, we follow the prescription detailed by Feldman and Cousins in [180] to build a 95% confidence level, , based on and . These three parameters are reported for different data combinations in Table 3.
Graphically, constitutes a good proxy for the Feldman-Cousins upper limit and can be used to visually compare profiles. Unlike the Feldman-Cousins upper limit, it is not sensitive to the determination of by the parabolic fit. In the figures, we plot as a function of , where is the physically allowed neutrino mass that minimizes the log-likelihood. Since most of the profiles presented below exhibit a negative , and the former equation reduces to . Additionally, when the ‘best-fitting’ value of is 0, the difference informs us about the tension between the recovered minimum and a non-negative neutrino mass.
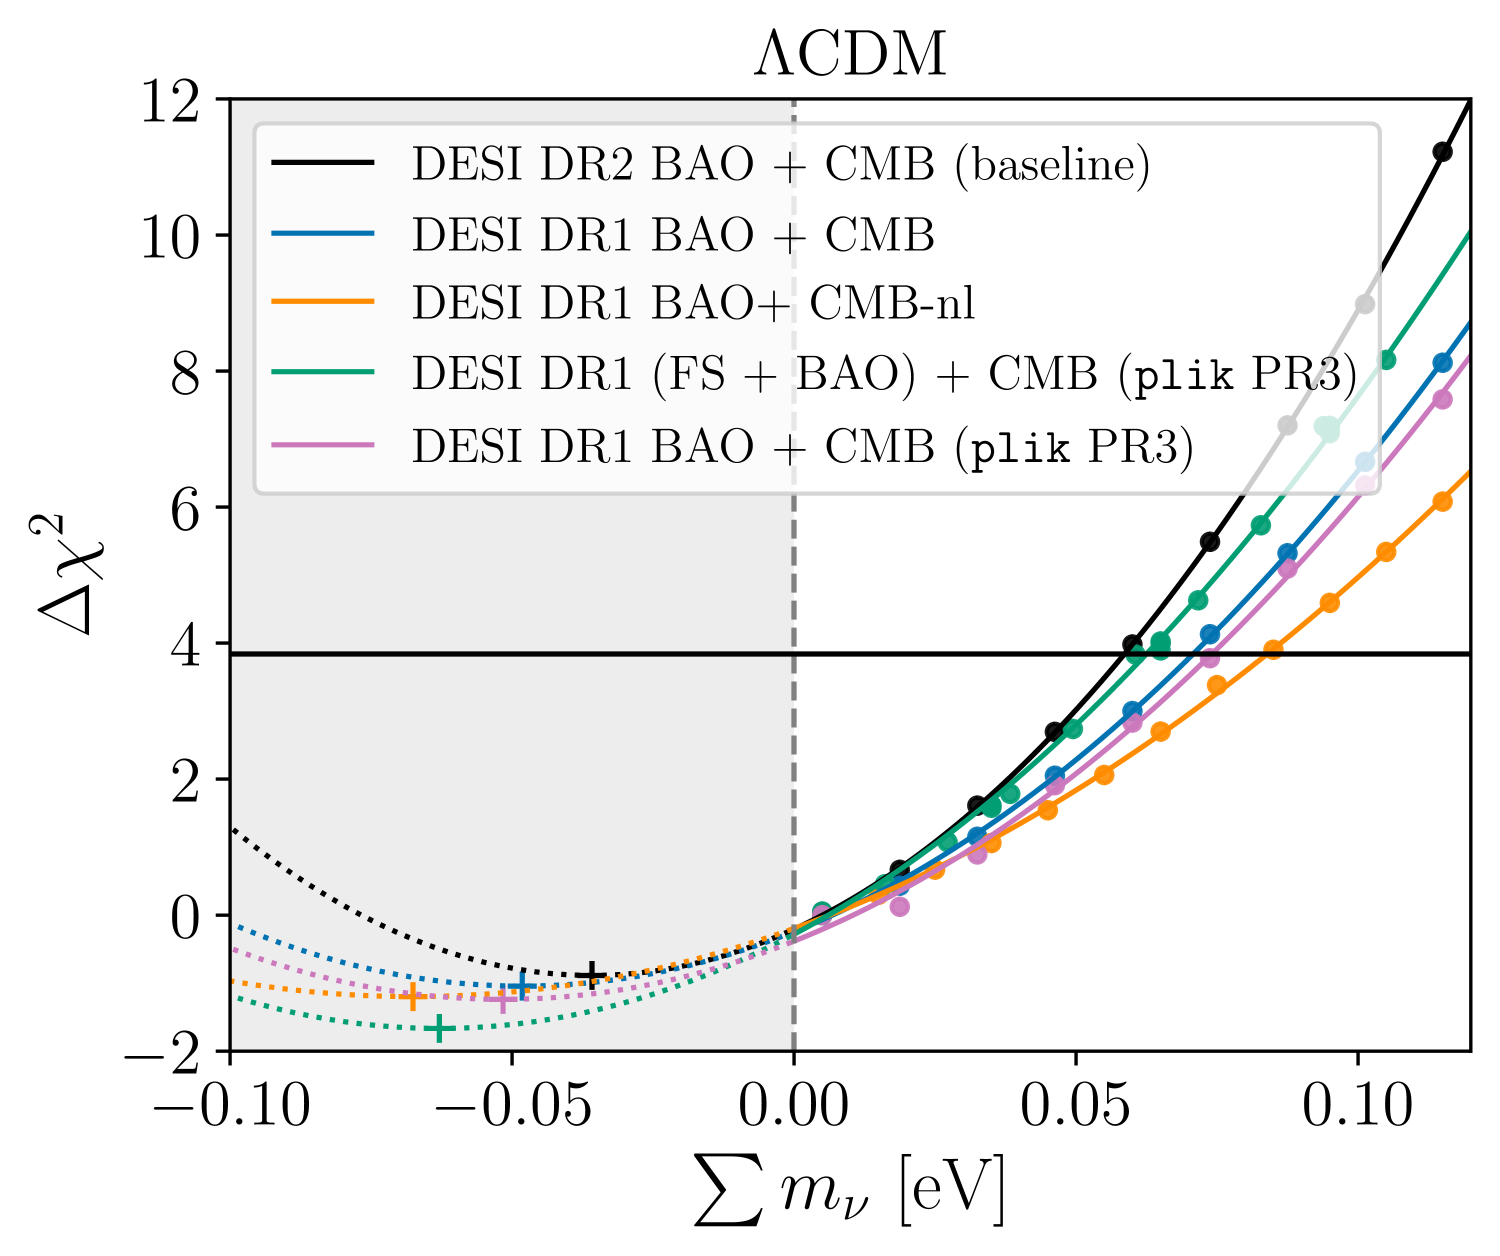
We first consider combinations of DESI DR1 and DR2 with CMB information. Profiles are shown in Fig. 8, and all parameter values are reported in Table 3. As could be anticipated from the shape of the Bayesian posteriors in the main analysis, we find that all profiles show a trough firmly in the negative sector once extrapolated to a full parabola. Using the baseline CMB dataset along with DESI DR1 BAO, we obtain an upper limit of \qty0.063eV for the sum of neutrino masses. Moving from DESI DR1 BAO to DR2 BAO, the constraint improves to
| (28) |
showcasing a \qty0.010 reduction compared to the DR1 result. The constraining power, , also improves by \qty0.011, as expected from the higher precision of DR2 BAO data. However, the curve shifts in the positive direction by \qty0.012, limiting the improvement on the upper bound.
Returning to the DESI DR1 BAO + CMB result, we compare this to the same case deprived of CMB lensing information, which yields a larger limit of \qty0.074eV. In principle, the constraint on comes from a geometrical constraint on , as determined by DESI BAO and CMB measurements, and neutrino free streaming through small-scale suppression of the matter power spectrum, measured through CMB lensing. Adding CMB lensing information as we do, or the full-shape information from DESI DR1 as we will do next, should thus improve the constraint on the sum of neutrino masses. This is indeed what we observe here, as the limit decreases by \qty0.011 when adding CMB lensing information. The profile likelihood technique reveals that this is a two-fold effect, as both and contribute to the determination of the upper limit, . In this case, the constraining power, , actually improves by \qty0.023, but this improvement is partly reduced by a shift of the parabola toward the positive region by \qty0.020. A similar effect is seen in the Bayesian case (see the right panel of Fig. 16).
We see a different situation when comparing FS + BAO with combinations that only include BAO. For this comparison, we revert to using the plik Planck likelihood as was done for the baseline results in [39]. Nevertheless, just like in Section IV.4 and [39] in the Bayesian framework, we find that DESI BAO + CMB plik and CamSpec exhibit extremely similar profiles. We expect an improvement on DESI DR1 BAO when considering the full-shape analysis, which unlike BAO is able to measure the small-scale suppression effect on the matter power spectrum. As in the previous case, we see an improvement of the upper limit by \qty0.011. The statistical power of the data as measured by is very close for both curves, with a difference of \qty0.003 in favor of the analysis that includes FS.
These findings show that, in terms of statistical strength, the switch from DESI DR1 BAO to DESI DR2 BAO and the inclusion of CMB lensing are most important, while the improved upper limit in the BAO + FS case is mostly due to a shift toward negative values.
| Model/Dataset | [eV] | [eV] | 95% CL [eV] |
|---|---|---|---|
| CDM+ | |||
| DESI DR2 BAO+CMB (CamSpec) | |||
| DESI DR1 BAO+CMB (CamSpec) | |||
| DESI DR1 BAO+CMB-nl (CamSpec) | |||
| DESI DR1 BAO+CMB (plik) | |||
| DESI DR1 (FS+BAO)+CMB (plik) | |||
| DESI DR1 (FS+BAO)+BBN+ | |||
| DESI DR1 (FS+BAO)+BBN+ | |||
| DESI DR1 (FS+BAO)+BBN++ | |||
| CDM+ | |||
| DESI DR2 BAO+CMB | |||
| DESI DR2 BAO+CMB+DESY5 |
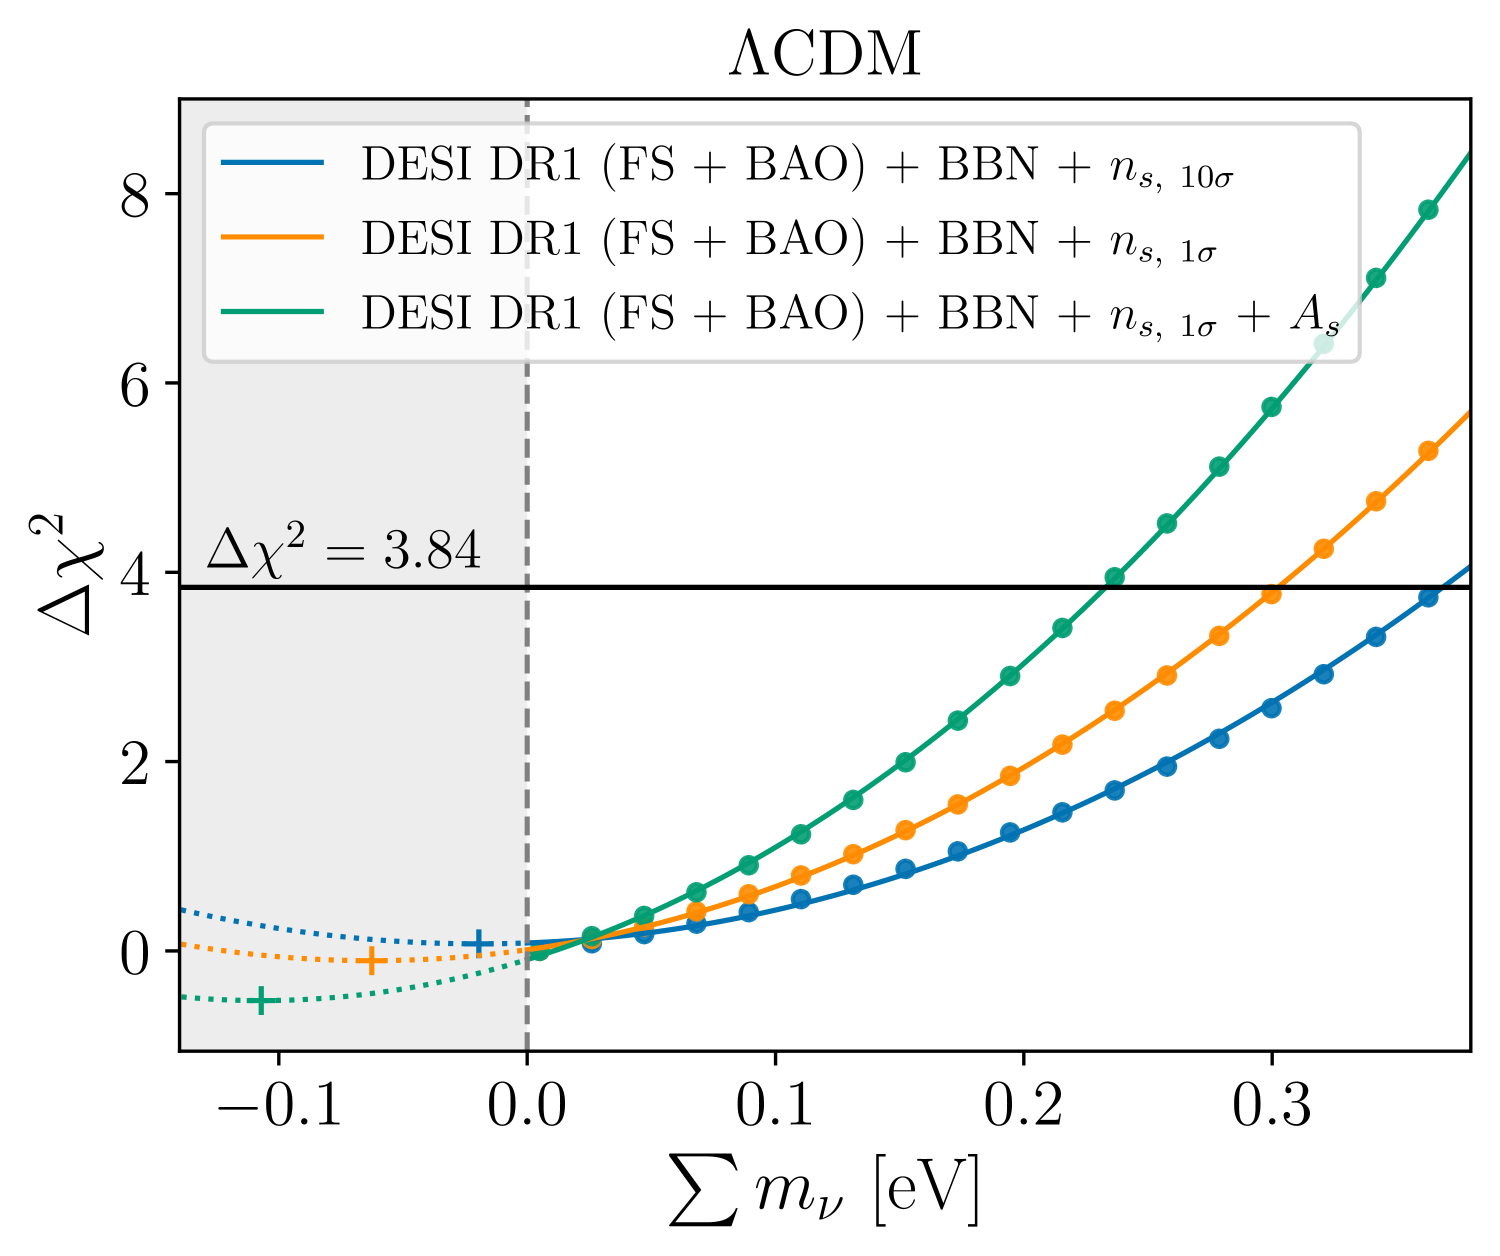
DESI can constrain the sum of neutrino masses with limited external information. In Fig. 9, we consider the combination of DESI DR1 (FS+BAO) along with a BBN prior on and CMB information on and . The full-shape analysis makes it possible to measure the small-scale suppression effect caused by neutrinos without involving CMB information, while geometric information is provided by the BAO measurement. If the preference for negative effective neutrino masses is a symptom of some tension between different datasets, then reducing the amount of external information could lessen the preference.
We find that all parabola minima still lie in the negative sector, although the tension with is less than . Compared to baseline CMB + DESI combinations, the constraints are relaxed, with upper limits as high as \qty0.373 along with . As more stringent CMB information is added to the analysis, such as a narrower constraint on or additional information on , both constraining power, , and upper limits improve. The minimum also shifts further toward the negatives by about , resulting in a decrease in the upper limits of around for each step.
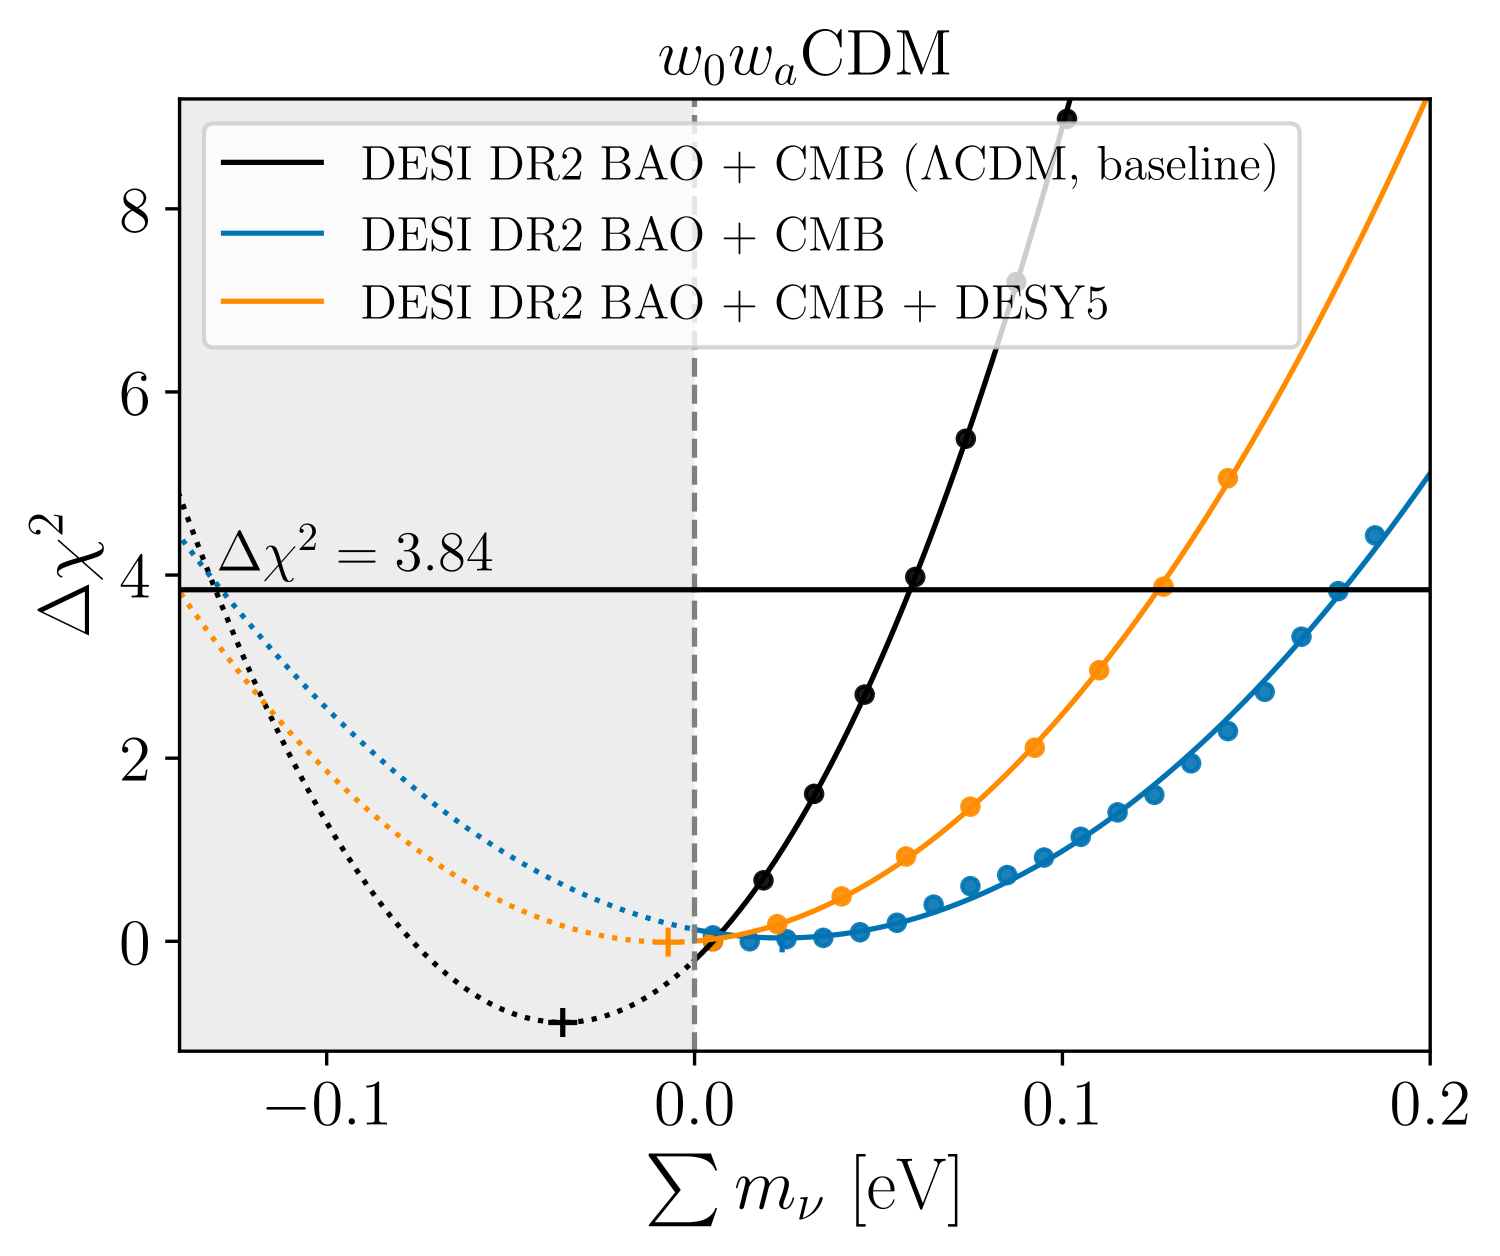
We now consider the impact of allowing evolving dark energy, under the framework of the – parametrization. DESI data, in combination with external datasets, have been shown to favor dynamical dark energy [38, 39, 40, 181], especially when including supernova information. Moving to a dynamical dark energy model helps to alleviate the tension that could be driving the neutrino mass sum toward the negatives. As shown in Fig. 10, the minima of the parabolas shift very close to the positive sector. The combination of DESI DR2 BAO and the baseline CMB dataset imposes an upper limit of
| (29) |
which represents a \qty0.123 relaxation compared to the CDM case. A large part of this increase is caused by the shift of the parabola toward the positives by \qty0.06, although further relaxation is expected from the degradation of from \qty0.043 to \qty0.078. When adding SNe information from DESY5, and both improve to \qty0.068 and \qty0.126, while the central value, , becomes negative again, although barely.
Finally, the profile likelihoods can also be used to probe the preference for the normal mass ordering. The profiles are calculated using a degenerate mass approximation with three neutrinos of equal mass, which is still a reasonable approximation for recent DESI data [31, 162, 163, 164, 165]. We use the NuFIT 6.0 constraints [49] on the difference of squared masses, from current oscillation experiments, and we consider a situation in which the lightest neutrino has zero mass. We can then determine a total sum of neutrino masses both in normal and inverted ordering, and compute a between the two. For baseline CMB + DESI DR2 BAO in , this procedure yields , which is in very good agreement with the Bayes factor reported in Section IV.3. This indicates that baseline CMB + DESI DR2 BAO seems to favor the normal ordering.
Almost all profiles presented here, especially for , exhibit a minimum in the negative mass region. Only when introducing dynamical dark energy do we recover minima closer to or inside the positive sector. Nevertheless, when the minima are in the negatives, they mostly remain in agreement with to within . The presented upper bounds Eqs. 28 and 29 are \qty0.01 lower for the CDM case and \qty0.01 higher for CDM, than those obtained from the Bayesian analysis. Considering that we operate with limited statistics, and that our method to exclude the negative region differs, it is not unexpected that we recover somewhat different values.
V.2 Effective neutrino masses
The results of Section IV.3 illustrate that current cosmological constraints on are dominated by prior weight effects, at least in the context of the CDM model. For all cases considered so far, the marginal posterior distribution peaks at the smallest mass allowed by the prior, whether it be for a degenerate mass spectrum or when an oscillation-based parametrization is adopted. Furthermore, the profile likelihood analysis shows that our baseline constraints are already in tension with the lower limits from neutrino oscillations and that the minimum of the likelihood appears to be in the negative sector. This motivates a Bayesian analysis with an effective neutrino mass parameter, , that can be extended to negative values.
We utilize the effective neutrino mass parameter of [68], which allows for a negative neutrino contribution to the energy density at late times. The parameter is implemented at the level of cosmological perturbation theory, ensuring that all cosmological effects of are extended consistently to negative values. By definition, it agrees exactly with for positive values. We refer to Appendix A for details. It should be emphasized that this is an effective parameter and any evidence for negative values should be interpreted as a signature of unidentified systematic errors or possibly of new physics which may be unrelated to neutrinos, rather than as a direct sign of negative mass neutrinos.
While unorthodox, the effective neutrino mass parameter, , has a number of advantages compared to the standard approach. First of all, it allows for constraints that are driven by the data rather than by the prior. It thus provides a robust metric for the tension between cosmological data and oscillation constraints. Moreover, extending the model to negative values provides significant insight, given that the standard analysis reveals only the tail of the distribution of . This helps, for instance, to differentiate parameter shifts from changes in precision and clarifies the directions of parameter degeneracies.
Adopting the parametrization in CDM, we obtain the following constraint from the combination of DESI DR2 BAO and our baseline CMB dataset:
| (30) |
This amounts to a slight shift and a improvement in precision compared to the constraint, , from [68] obtained for DESI DR1 BAO and CMB data. The tension with the lower bound, , for the normal mass ordering is (an increase from the quoted in [68]).666We compute the tension in terms of the probability to exceed the lower bound from neutrino oscillations, using the 1D marginalized posterior distribution of . See Section V.3 for alternative tension metrics. The marginal posterior distribution is shown in the left panel of Fig. 11 and the constraints on other parameters are given in Table 5. As the asymmetric error bars in Eq. 30 indicate, the posterior is non-Gaussian and slightly skewed toward negative values.
The preference for negative effective masses agrees with the profile likelihood analysis of Section V.1, but the tension is markedly stronger for the Bayesian analysis presented here. This is not unexpected, as the profile curves are extrapolated from the positive region, which becomes less accurate the further the minimum is in the negative region. Moreover, the profiles are not exact parabolas. A similar effect was seen for Gaussian extrapolations of the Bayesian posterior distribution [68, 70].
Fig. 11 also shows the posterior for CMB data alone, which yield
| (31) |
This agrees well with Eq. 30 and, while showing a preference for negative values, is still compatible with neutrino oscillations to within . For the first time, we also obtain results for a full-shape power spectrum analysis with effective neutrino masses. Using DESI DR1 (FS+BAO), along with a BBN prior on and CMB priors on the parameters and , we find
| (32) |
This particular combination of data and priors exploits the ability of the DESI full-shape analysis to constrain the sum of neutrino masses through the scale-dependent suppression of the power spectrum due to neutrino free streaming, as will be discussed further in Section VI. Interestingly, despite relying on different physical signatures and using no CMB information on or , this constraint also agrees well with Eq. 30 and again shows a preference for negative values, while still being compatible with neutrino oscillations to just within .
V.2.1 Origin of the anomaly
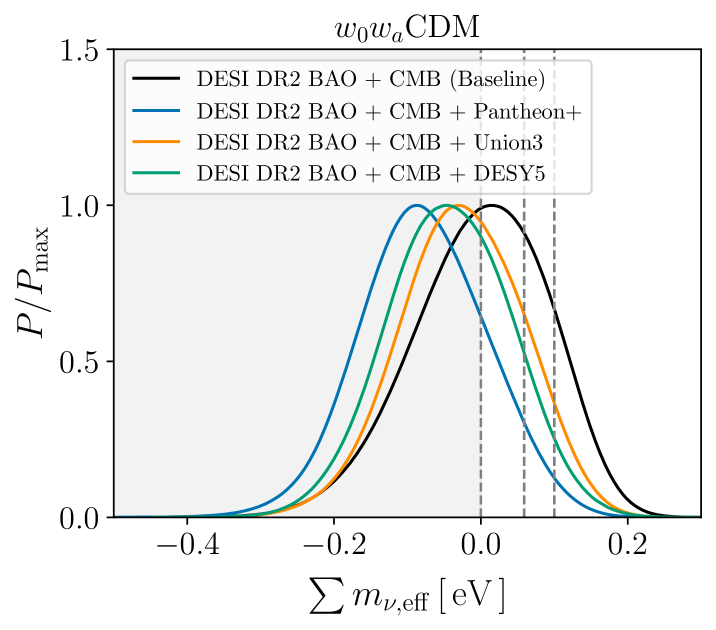
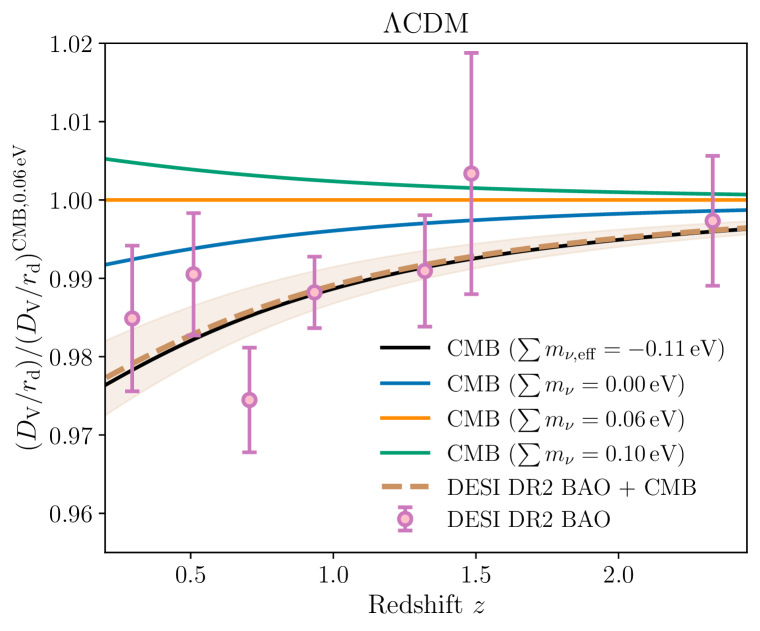
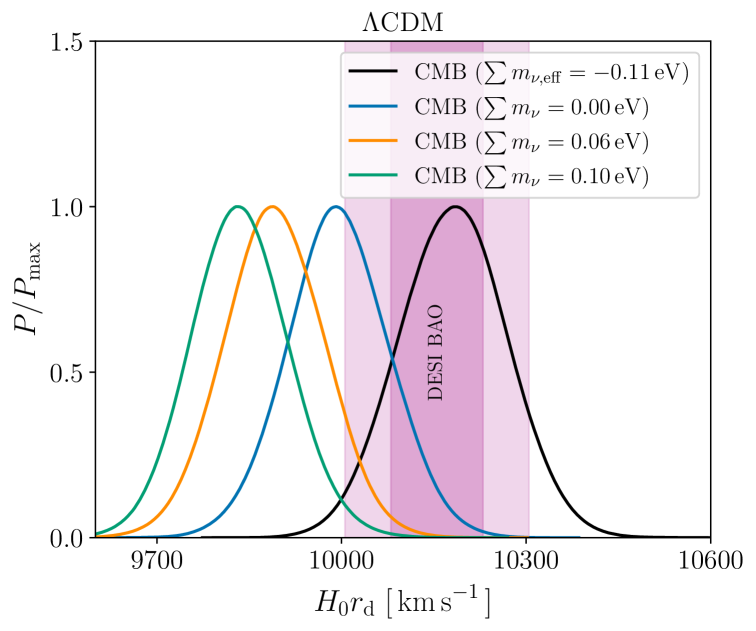
We can trace the origin of the preference for negative effective neutrino masses from DESI BAO and CMB to a number of different effects [68]. A major contribution comes from the overall amplitude of the BAO distance measurements, which are smaller than what is allowed by CMB data for a CDM model with positive neutrino masses, as shown in the left panel of Fig. 12. This tension can be expressed as a discrepancy between the values of obtained from DESI BAO and CMB data [71]. For a fixed , a small from the CMB can be compensated by lowering the total neutrino mass. To illustrate this effect, the right panel of Fig. 12 presents the posterior distributions for fixed neutrino mass values of and from CMB data alone, showing that the inferred small neutrino mass is associated with the aforementioned discrepancy in . The shifts in are almost entirely due to changes in along the geometric degeneracy.
It is remarkable that when is allowed, the effective neutrino mass sum, Eq. 31, preferred by the CMB, independent of any BAO information, yields values of that agree very well the DESI DR2 BAO measurements. In this case with fixed, the CMB constrains , in line with the distance ladder measurements of [182].
The neutrino mass tension is also related to the presence of an oscillatory feature in the small-scale CMB temperature power spectrum, which is unaccounted for in CDM models with positive neutrino masses, and is also degenerate with the parameter discussed in Section IV.4 (see [175, 33, 176, 69, 66, 68, 70]). The preference for is present to different degrees in alternative CMB analyses. We therefore derive constraints on for the alternative plik and L-H CMB likelihoods. In both cases, we obtain results that are quite similar to Eq. 30, as shown in Table 5. As expected, the tension is weaker with L-H, which prefers a slightly lower value of that is consistent with unity, but the finding of negative effective neutrino masses is clearly robust to the choice of CMB likelihood; however, see also [69, 70].
A third contribution comes from the large-scale polarization measurements by Planck. These data are primarily responsible for constraining the reionization optical depth, . For negative effective neutrino masses, CMB data allow smaller values of , which improves the fit with Planck polarization at large scales. This effect is also related to the problem, given that an increase in leads to larger primordial and lensing amplitudes (since is measured precisely). Compared to Planck [34, 183], WMAP found significantly larger values of [184], which would help to accommodate larger neutrino masses [66, 79].
We tested explicitly that adopting larger values of shifts the posterior distribution of in the positive direction. When fixing the optical depth at or , corresponding to a or shift from the baseline value of , the posteriors move in the positive direction, but the discrepancy with neutrino oscillations remains at or , respectively. When combined with astrophysical constraints on reionization, such large values of are further disfavored [185]. Although recent observations with JWST might challenge the standard reionization picture [186], the Planck value of is generally consistent with most astrophysical observations suggesting a later end to reionization [187, 188, 189, 190, 191, 192]. The combination with DESI BAO also limits our ability to explain negative effective neutrino masses in terms of alone, since at fixed neutrino mass, increasing only slightly increases the preferred CMB value of . Nevertheless, if we exclude large-scale CMB polarization data on account of systematic errors, the tension could be explained as a statistical fluctuation.
V.2.2 Relation to dark energy
The same effects that are responsible for negative values of in CDM also drive DESI and CMB data away from CDM toward evolving dark energy models such as CDM and mirage dark energy [68]. When the background cosmology is generalized to CDM, DESI BAO and CMB data can be reconciled with positive neutrino masses. For this combination, we find
| (33) |
which is fully compatible with the lower bounds on the sum of the neutrino masses from neutrino oscillations. Furthermore, the right panel of Fig. 11 shows that the marginalized one-dimensional posterior peaks at a positive value. However, as these data do not strongly constrain the dark energy equation of state parameters, and , the results still depend on the priors on and . The addition of SNe Ia helps to constrain these parameters. In the case of DESY5, we obtain:
| (34) |
which is also compatible with neutrino oscillations. While the error increases by about compared to the CDM constraint of Eq. 30, the reduction in tension is mostly due to a shift of in the central value toward zero.
Compared to the case where is fixed, allowing to be free does not significantly impact the constraints on and . This is no longer the case with free. We find
| (35) |
which corresponds to a shift toward CDM compared to the case with fixed. When we use Pantheon+ or Union3, the conclusions are qualitatively the same, albeit with minor differences in the preferred values, as can be seen from the right panel of Fig. 11 and Table 5. In all cases, we have viable solutions with positive neutrino masses when adopting CDM. At the same time, the preference for CDM is significantly reduced when is allowed.
The connection with evolving dark energy can be traced to the degeneracy between the dark energy equation of state, , and [53, 54, 193, 55, 56, 57, 33, 58], associated primarily with their effects on the expansion history. This degeneracy becomes particularly clear in terms of , as shown in Fig. 13. The figures demonstrate that one can obtain positive neutrino masses for all three supernova datasets if one adopts an evolving dark energy model. At the same time, it also shows that imposing CDM (by fixing and ) forces the effective neutrino mass parameter to be negative.
Although adopting allows DESI + CMB to be more compatible with CDM, the preference for CDM is not reduced below the level obtained from DESI + SNe with positive neutrino masses, as shown in Fig. 14. The reason for this is simply that it is the total matter density fraction, , that determines the late-time expansion history (as probed by BAO, SNe, and the distance to the surface of last scattering), while matters for the primary CMB anisotropies. Hence, negative effective neutrino masses may ameliorate the tension between DESI and CMB data, but make no impact on the DESI + SNe constraints.
Interestingly, Fig. 14 also shows that models with are compatible with and , whereas models with are not. Indeed, when considering the CDM model with a constant equation of state of dark energy, , we find that the data prefer and , particularly for the combinations with Union3 and DESY5. In this case, the neutrino mass tension can be as high as for DESI + CMB + DESY5. Refer to Table 5 for the parameter constraints for different data combinations.
V.3 Tension metrics
In the previous subsection, we identified a moderate tension between our cosmological constraints on and the lower bound from terrestrial oscillation experiments, which applies in the case of three positive neutrino masses under the normal ordering, [49, 51, 52]. The tension was quantified by considering the 1D marginalized posterior distribution of and computing the probability to exceed (PTE) this lower bound. Here, we briefly consider two alternative tension metrics, following [194, 73].
The first of these is a goodness-of-fit-loss metric based on the , evaluated at the maximum a posteriori (MAP) points of our MCMC chains with free and with fixed. Here, is defined in terms of the likelihood, . We neglect the for the oscillation experiments.
The second is a parameter shift metric that quantifies the probability of a non-zero parameter difference between two datasets [195, 196]. The posterior probability of a given parameter difference, , between independent datasets and is given by
| (36) |
where and are the posterior probabilities for datasets and . The probability that there is a non-zero offset is
| (37) |
| Datasets | ||||
|---|---|---|---|---|
| CMB | ||||
| DESI+CMB (no lensing) | ||||
| DESI+CMB |
For the terrestrial dataset, we assume a uniform distribution between the lower bound, , and the upper bound from tritium -decay, , set by KATRIN [17] and converted to a bound as in [49]. We experimented with more complicated parametrizations, taking into account the mass splittings, but these gave broadly consistent answers. For all three metrics, we convert the test statistic to a significance level, , corresponding to an equivalent two-sided Gaussian probability with standard deviation .
For our baseline DESI + CMB combination, we find a tension of using the goodness-of-fit-loss metric, which agrees well with the tension obtained from the PTE, in line with the results of [68]. In [194, 73], it was shown that this metric also agrees well with the Bayesian suspiciousness, which we do not consider here. By contrast, these authors showed that the parameter shift metric indicates significantly stronger tensions. We confirm that expectation here, finding a tension using the parameter shift metric for DESI + CMB. Overall, this validates the tension reported above for the baseline DESI + CMB combination. See Table 4 for tensions computed with other data combinations.
| Model/Dataset | [km s-1 Mpc-1] | [eV] | or | ||
|---|---|---|---|---|---|
| CDM+ | |||||
| DESI BAO+CMB (Baseline) | — | — | |||
| DESI BAO+CMB (plik) | — | — | |||
| DESI BAO+CMB (L-H) | — | — | |||
| CDM+ | |||||
| DESI BAO+CMB | — | ||||
| DESI BAO+CMB+Pantheon+ | — | ||||
| DESI BAO+CMB+Union3 | — | ||||
| DESI BAO+CMB+DESY5 | — | ||||
| CDM+ | |||||
| DESI BAO+CMB | |||||
| DESI BAO+CMB+Pantheon+ | |||||
| DESI BAO+CMB+Union3 | |||||
| DESI BAO+CMB+DESY5 |
VI Constraints from free streaming
In [39], DESI presented a constraint from DR1, including both FS and BAO, and using minimal CMB information. Using a BBN prior on and a weak prior on the spectral index, , corresponding to ten times the uncertainty of Planck, they derived a constraint of (95%) in the presence of a cosmological constant.
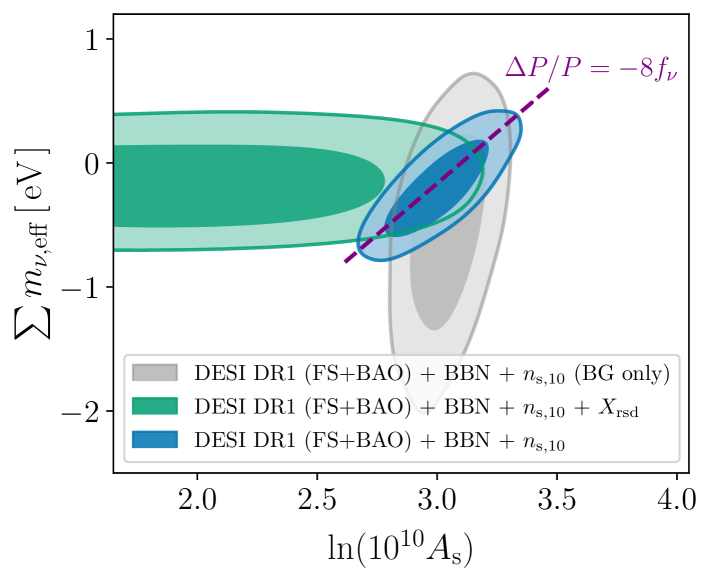
A question that was left open was the actual source of the information. We will address that here. The left panel of Fig. 15 shows the constraints from this data combination in the plane of and the large-scale amplitude of the primordial power spectrum, . The two parameters are degenerate with a slope, , which would be naively expected if DESI were constraining neutrino masses through the neutrino free-streaming effect on the small-scale amplitude of the power spectrum, but this should be tested.
To gain physical insight into the mechanism behind the constraint, we artificially modify our theory calculations such that neutrino masses only affect the background expansion, but are neglected at the level of cosmological perturbations [80]. The remaining effect on the matter power spectrum of raising , at a fixed cold dark matter density, is a nearly scale-independent suppression combined with a change in the BAO. The constraints obtained with this theoretical modification are significantly weaker, as shown in the left panel of Fig. 15. This is a clear indication that the FS analysis exploits the scale-dependent effect due to neutrino free streaming.
As galaxies are biased tracers of the matter field, the amplitude of the matter power spectrum, , is degenerate with the galaxy bias. This degeneracy can be broken by exploiting redshift space distortion (RSD) information on the growth rate. To determine whether the information on neutrino masses is indeed coming from the amplitude, we marginalize over the growth rate, such that the amplitude can no longer be constrained.
To see this, consider that the galaxy power spectrum in redshift space, , can be written in terms of the auto and cross power spectra of the density fluctuation, , and the velocity divergence, .777We define , with the peculiar velocity field. For clarity, we do not include the growth factor in the definition, unlike the common practice. In linear theory, these quantities are related as
| (38) |
where is the linear growth rate, which is scale dependent in the presence of massive neutrinos. Let us now introduce a new fudge factor, , such that the above relationship becomes
| (39) |
By marginalizing over the unknown parameter, , we break the theoretical link between and that allows to be constrained. The left panel of Fig. 15 shows that, although the amplitude indeed becomes unconstrained in this case, the limits on are not significantly affected. This suggests that the constraint on is unrelated to the amplitude. In principle, information could still be coming from the slight differences in the suppression of the amplitude at different redshifts. However, this effect is negligible.
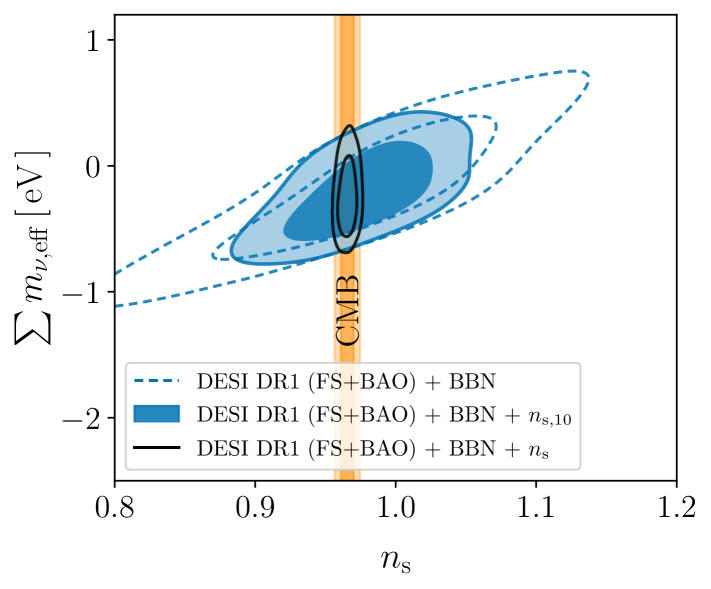
Alternatively, the free-streaming effect could be detected from the shape of the power spectrum. Fig. 2 shows that, on the scales used in the FS analysis, the neutrino effect manifests as a change in the slope compared to the power spectrum on large scales. The analysis must then be anchored to an external prior on the large-scale slope, , from the CMB. The right panel of Fig. 15 shows what happens when the weak prior on is replaced with a less informative uniform prior on : the neutrino mass limits degrade significantly. Conversely, imposing a stronger prior on , corresponding to the uncertainty from Planck, yields [39]
| (40) |
assuming CDM. These tests suggest that DESI alone, with minimal external information, is sensitive to the free-streaming effect through the shape of the power spectrum rather than its amplitude or through pure background effects, in line with the findings of [37].
Although Eq. 40 is not competitive with the limits obtained from the geometrical effect, this nevertheless represents an interesting bound that does not rely on any CMB determination of the physical density, . Continuing along these lines, it is worth obtaining a constraint from DESI that exploits both geometrical and shape information, without using any CMB prior on or . For the combination DESI DR1 (FS+BAO) + BBN with CMB priors on and , we find:
| (41) |
We already considered this combination in Section V.2, where we showed that it preferred negative effective neutrino masses, but was still compatible with the lower limit under the normal mass ordering to just within . Interestingly, the geometric constraint from DESI BAO + and the constraint based on shape information from DESI (FS+BAO) + are highly complementary, as can be seen from the left panel of Fig. 16. Physically, this can be traced to the fact that CDM and neutrinos are essentially indistinguishable as far as the late-time expansion history is concerned, but affect differently the formation of structure. We can use the observed information, , or the second derivative of the posterior probability with respect to the parameter , as a criterion to quantify the information content on of different data combinations. In terms of this quantity, we find that geometry and shape each contribute about half of the observed information to the limit in Eq. 41.
However, it has been shown that projection effects significantly distort the geometrical information extracted from the full-shape analysis alone, even with a CMB prior on [71]. Furthermore, when additional information from the CMB is incorporated, particularly on and , the constraints on the neutrino mass become small to the point that the suppression of the power spectrum is unobservable with current sensitivity.
As another dataset that probes large-scale density perturbations, CMB lensing is also sensitive to neutrino free streaming. In the right panel of Fig. 16, we present constraints from the CMB with and without CMB lensing. We find that lensing information particularly helps to exclude the tail of the distribution with large negative values of , as well as slightly improving the precision overall. When combined with DESI DR2 BAO, lensing information particularly helps to constrain without shifting the posterior in terms of .
VII Discussion and conclusions
In recent years, cosmological upper limits on the sum of neutrino masses have steadily crept down and approached the lower limits from neutrino oscillations (e.g. [31, 32, 34, 33, 35, 36, 37]), leaving little room for a measurement that satisfies both laboratory and astrophysical constraints, when assuming the standard CDM model of cosmology.
This trend continues with the latest results from the DESI collaboration, presented in this paper. Using BAO measurements of more than 14 million galaxies and quasars from the second data release (DR2), combined with external CMB data from Planck (PR4) and ACT, we have placed our tightest constraints yet on the sum of neutrino masses. We summarize the key results obtained in this paper in Table 6. In our baseline setup, assuming the CDM model and three degenerate neutrino species with the minimal physical prior that , we derive an upper limit of (95%) from the combination of DESI DR2 BAO and CMB with the PR4 CamSpec likelihood [130], including CMB lensing from ACT [46]. This is tantalizingly close to the lower bound from neutrino oscillations, which applies in the case of three neutrino species with positive masses under the normal mass ordering, [49, 51, 52]. Moreover, this result already challenges the alternative inverted mass ordering. In an analysis where we account for the fact that a large fraction of the posterior volume violates the constraints for both mass orderings, we nevertheless find a Bayes factor of in favor of the normal mass ordering, when adopting a uniform prior on the lightest neutrino mass, , and Gaussian priors on the squared mass splittings based on oscillation constraints [49]. In this setup, we constrain the lightest neutrino mass to be (95%).
Alternative choices for the CMB likelihood or the inclusion of SNe data lead to small differences in the derived upper bounds. The greatest bound is found in the case where the baseline CamSpec likelihood [130] is replaced with L-H [129], (95%). The inclusion of SNe data has a comparatively smaller impact, with the greatest bound resulting from the inclusion of DESY5 SNe [134], (95%). However, in all cases we find that the marginalized posterior distribution peaks at , suggesting that there is no evidence from our data for non-zero neutrino masses. Instead, our baseline constraints are affected by prior weight effects, such that the prior pulls the posterior distribution away from the maximum likelihood value.
Using the profile likelihood method, a frequentist approach that does not rely on explicit priors, we establish that the minimum of the parabolic likelihood curve is in the unphysical negative mass range when extrapolated. In the case of CDM, we find a 95% Feldman-Cousins upper bound of , which corrects for the physical lower limit of zero neutrino mass.
We continued our investigations with a more general Bayesian analysis of a model with the effective cosmological neutrino mass parameter, , of [68]. This parameter coincides exactly with for positive values, but allows for negative energy densities, which can be seen as a mathematical continuation of to negative values. Assuming CDM, we find (68%; DESI DR2 + CMB) and a tension with the lower bound for the normal mass ordering. From CMB data alone, we obtain (68%). By keeping this value fixed, and fitting the remaining cosmological parameters within the CDM framework, using again CMB data without other datasets, we find that remarkably matches the value derived solely from DESI DR2 BAO, as illustrated in Fig. 12. This again shows consistency of CMB and DESI data within CDM when we allow for the effective neutrino mass parameter.
In the context of the main DESI results presented in the key paper [75], this neutrino tension could be seen as a further hint that the CDM model is being challenged by DESI BAO and CMB data. While the level of statistical significance is by no means conclusive, it is interesting to consider explanations that could reconcile cosmological neutrino mass bounds with the laboratory constraints.
| Result | Section |
|---|---|
| Strongest limits from DESI BAO and CMB in CDM in CDM | Section IV.1 |
| Limit on the number of relativistic species | Section IV.2 |
| Preference for the normal mass ordering and limit on the lightest neutrino mass | Section IV.3 |
| Frequentist Feldman-Cousins bounds in CDM in CDM | Section V.1 |
| Effective neutrino mass parameter constraints in CDM in CDM | Section V.2 |
| Tension with the oscillations lower bound between and , assuming CDM | Section V.3 |
| Strongest constraint from free streaming | Section VI |
First, despite extensive testing [101, 108, 141, 142, 143], the possibility of systematic errors cannot be dismissed. Considering the mismatch in between DESI BAO and CMB, the tension could be resolved by scaling the isotropic distance measurements of all galaxy tracers, but this would require unknown systematic errors in excess of , well above the size of all known systematics [108]. The consistency of DESI DR2 BAO [75] with prior measurements from DESI DR1 [101], SDSS [197, 198, 65, 75] and supernova data [131, 132, 133, 134] makes this less likely. On the CMB side, effects associated with the lensing amplitude, , and the optical depth, , could also play a role, but the consistency between L-H and CamSpec shows that other factors might be needed as well.
Models of evolving dark energy, further elaborated upon in the accompanying paper on dark energy [199], also provide a possible solution. In our baseline setup with DESI BAO and CMB data, we find (95%) when assuming a dynamical dark energy with an evolving equation of state, i.e. the CDM model. Our frequentist analysis yields an upper bound of (95%), which is only slightly higher than the Bayesian limit. Even when allowing for negative effective neutrino masses, we obtain viable solutions with positive neutrino masses when adopting the CDM parametrization. This is made possible by the degenerate effects of and the dark energy equation of state parameters, and , on the cosmic expansion history. The neutrino fluid violates the null-energy condition when , which it has in common with a single-field dark energy component in the phantom regime [199]. This may point to a common origin of the observed trends.
Alternatively, the tension with neutrino oscillations could be relaxed by introducing new physics in the neutrino sector, such as neutrino decay [200, 201, 202, 203, 204]. However, negative effective masses require more exotic explanations, such as long-range interactions [205, 206, 207, 208, 209, 66, 210]. New physics at the time of recombination could also provide an explanation [211, 212, 213] by changing the sound horizon at the baryon drag epoch, , from the CDM expectation. This may help to reconcile the CMB and BAO determinations of without invoking changes to the late-time expansion history. To differentiate between these possibilities, it is interesting to obtain constraints on that do not rely on calibration of the BAO standard ruler, , but instead exploit the effect of neutrino free streaming on the galaxy power spectrum.
Using a BBN prior on [48] and a weak prior on the spectral index, , corresponding to ten times the uncertainty of Planck [34], DESI already derived such a constraint, (95%), from the full-shape clustering of DR1 galaxies and quasars [39]. In this paper, we strengthen the constraint by adding stronger CMB priors on and , finding (95%). Despite relying on different physical mechanisms, this combination yields (68%) in terms of the effective neutrino mass parameter, which agrees well with the aforementioned CMB-only and CMB + DESI constraints. While not currently competitive with constraints from the expansion history, further improvements can be expected from the full-shape clustering analysis of DR2 tracers.
Our results indicate that there is a neutrino mass tension between the latest cosmological bounds on from DESI BAO and CMB data, derived within the CDM framework, and the values inferred from neutrino oscillations. The tension stands at using our baseline choice of datasets, which is a slight increase compared to DESI DR1 [38, 39, 68]. Our findings are supported by complementary statistical analyses using frequentist and Bayesian methods, and could point to unidentified systematic errors or an inconsistency with the CDM model. Upcoming analyses of DESI data, including the full-shape clustering of DR2 galaxies and quasars, will shed further light on this issue. With a projected sensitivity of [87], the final DESI survey could make a significant detection of neutrino mass or further challenge the CDM model if the tension persists.
VIII Data Availability
The data used in this analysis will be made public along the Data Release 2 (details in https://data.desi.lbl.gov/doc/releases/). BAO likelihoods for the DESI DR2 likelihoods will be provided integrated in the cobaya code at https://github.com/CobayaSampler/bao_data.
Acknowledgements.
This work used the DiRAC@Durham facility managed by the Institute for Computational Cosmology on behalf of the STFC DiRAC HPC Facility (www.dirac.ac.uk). The equipment was funded by BEIS capital funding via STFC capital grants ST/K00042X/1, ST/P002293/1, ST/R002371/1 and ST/S002502/1, Durham University and STFC operations grant ST/R000832/1. DiRAC is part of the National e-Infrastructure. WE, CSF, and AM acknowledge STFC Consolidated Grant ST/X001075/1 and support from the European Research Council (ERC) Advanced Investigator grant DMIDAS (GA 786910). AA, HEN, DG and GN acknowledge support by CONAHCyT CBF2023-2024-162. AA, DG and HEN acknowledge support by PAPIIT IA101825. AA acknowledges support by PAPIIT IG102123. GN and DG also acknowledge support by DAIP-UG and DCI-UG DataLab. CGQ acknowledges support provided by NASA through the NASA Hubble Fellowship grant HST-HF2-51554.001-A awarded by the Space Telescope Science Institute, which is operated by the Association of Universities for Research in Astronomy, Inc., for NASA, under contract NAS5-26555. KN acknowledges support from the Royal Society grant number URF\R\231006. MI acknowledges that this material is based upon work supported in part by the Department of Energy, Office of Science, under Award Number DE-SC0022184 and also in part by the U.S. National Science Foundation under grant AST2327245. This material is based upon work supported by the U.S. Department of Energy (DOE), Office of Science, Office of High-Energy Physics, under Contract No. DE–AC02–05CH11231, and by the National Energy Research Scientific Computing Center, a DOE Office of Science User Facility under the same contract. Additional support for DESI was provided by the U.S. National Science Foundation (NSF), Division of Astronomical Sciences under Contract No. AST-0950945 to the NSF’s National Optical-Infrared Astronomy Research Laboratory; the Science and Technology Facilities Council of the United Kingdom; the Gordon and Betty Moore Foundation; the Heising-Simons Foundation; the French Alternative Energies and Atomic Energy Commission (CEA); the National Council of Humanities, Science and Technology of Mexico (CONAHCYT); the Ministry of Science, Innovation and Universities of Spain (MICIU/AEI/10.13039/501100011033), and by the DESI Member Institutions: https://www.desi.lbl.gov/collaborating-institutions. Any opinions, findings, and conclusions or recommendations expressed in this material are those of the author(s) and do not necessarily reflect the views of the U. S. National Science Foundation, the U. S. Department of Energy, or any of the listed funding agencies. The authors are honored to be permitted to conduct scientific research on I’oligam Du’ag (Kitt Peak), a mountain with particular significance to the Tohono O’odham Nation.References
- Alpher et al. [1953] R. A. Alpher, J. W. Follin, and R. C. Herman, Phys. Rev. 92, 1347 (1953).
- Gershtein and Zel’dovich [1966] S. S. Gershtein and Y. B. Zel’dovich, Soviet Journal of Experimental and Theoretical Physics Letters 4, 120 (1966).
- Cowsik and McClelland [1973] R. Cowsik and J. McClelland, ApJ 180, 7 (1973).
- Szalay and Marx [1976] A. S. Szalay and G. Marx, A&A 49, 437 (1976).
- Lubimov et al. [1980] V. A. Lubimov, E. G. Novikov, V. Z. Nozik, E. F. Tretyakov, and others, Physics Letters B 94, 266 (1980).
- Bond et al. [1980] J. R. Bond, G. Efstathiou, and J. Silk, Physical Review Letters 45, 1980 (1980).
- Frenk et al. [1983] C. S. Frenk, S. D. M. White, and M. Davis, ApJ 271, 417 (1983).
- White et al. [1983] S. D. M. White, C. S. Frenk, and M. Davis, ApJ 274, L1 (1983).
- Fritschi et al. [1986] M. Fritschi, E. Holzschuh, W. Kündig, J. W. Petersen, and others, Physics Letters B 173, 485 (1986).
- Wilkerson et al. [1987] J. F. Wilkerson, T. J. Bowles, J. C. Browne, M. P. Maley, and others, Phys. Rev. Lett. 58, 2023 (1987).
- Belesev et al. [1995] A. I. Belesev, A. I. Bleule, E. V. Geraskin, A. A. Golubev, and others, Physics Letters B 350, 263 (1995).
- Weinheimer et al. [1999] C. Weinheimer, B. Degenddag, A. Bleile, J. Bonn, and others, Physics Letters B 460, 219 (1999).
- Lobashev et al. [1999] V. M. Lobashev, V. N. Aseev, A. I. Belesev, A. I. Berlev, and others, Physics Letters B 460, 227 (1999).
- Bonn et al. [2001] J. Bonn, B. Bornschein, L. Bornschein, L. Fickinger, and others, Nuclear Physics B Proceedings Supplements 91, 273 (2001).
- Aker et al. [2019] M. Aker, K. Altenmüller, M. Arenz, M. Babutzka, and others, Phys. Rev. Lett. 123, 221802 (2019), arXiv:1909.06048 [hep-ex] .
- The Katrin Collaboration et al. [2022] The Katrin Collaboration, M. Aker, A. Beglarian, J. Behrens, and others, Nature Physics 18, 160 (2022), arXiv:2105.08533 [hep-ex] .
- Aker et al. [2024] M. Aker, D. Batzler, A. Beglarian, J. Behrens, and others, arXiv e-prints , arXiv:2406.13516 (2024), arXiv:2406.13516 [nucl-ex] .
- Elgarøy et al. [2002] Ø. Elgarøy, O. Lahav, W. J. Percival, J. A. Peacock, and others, Phys. Rev. Lett. 89, 061301 (2002), arXiv:astro-ph/0204152 [astro-ph] .
- Tegmark et al. [2004] M. Tegmark, M. A. Strauss, M. R. Blanton, K. Abazajian, and others, Phys. Rev. D 69, 103501 (2004), arXiv:astro-ph/0310723 [astro-ph] .
- Bennett et al. [2003] C. L. Bennett, M. Halpern, G. Hinshaw, N. Jarosik, and others, ApJS 148, 1 (2003), arXiv:astro-ph/0302207 [astro-ph] .
- Spergel et al. [2003] D. N. Spergel, L. Verde, H. V. Peiris, E. Komatsu, and others, ApJS 148, 175 (2003), arXiv:astro-ph/0302209 [astro-ph] .
- Croft et al. [1999] R. A. C. Croft, W. Hu, and R. Davé, Phys. Rev. Lett. 83, 1092 (1999), arXiv:astro-ph/9903335 [astro-ph] .
- Seljak et al. [2005] U. Seljak, A. Makarov, P. McDonald, S. F. Anderson, and others, Phys. Rev. D 71, 103515 (2005), arXiv:astro-ph/0407372 [astro-ph] .
- Goobar et al. [2006] A. Goobar, S. Hannestad, E. Mörtsell, and H. Tu, J. Cosmology Astropart. Phys 2006, 019 (2006), arXiv:astro-ph/0602155 [astro-ph] .
- Seljak et al. [2006] U. Seljak, A. Slosar, and P. McDonald, J. Cosmology Astropart. Phys 2006, 014 (2006), arXiv:astro-ph/0604335 [astro-ph] .
- Viel et al. [2010] M. Viel, M. G. Haehnelt, and V. Springel, J. Cosmology Astropart. Phys 2010, 015 (2010), arXiv:1003.2422 [astro-ph.CO] .
- Palanque-Delabrouille et al. [2015] N. Palanque-Delabrouille, C. Yèche, J. Baur, C. Magneville, and others, J. Cosmology Astropart. Phys 2015, 011 (2015), arXiv:1506.05976 [astro-ph.CO] .
- Rossi et al. [2015] G. Rossi, C. Yèche, N. Palanque-Delabrouille, and J. Lesgourgues, Phys. Rev. D 92, 063505 (2015), arXiv:1412.6763 [astro-ph.CO] .
- Yèche et al. [2017] C. Yèche, N. Palanque-Delabrouille, J. Baur, and H. du Mas des Bourboux, J. Cosmology Astropart. Phys 2017, 047 (2017), arXiv:1702.03314 [astro-ph.CO] .
- Parkinson et al. [2012] D. Parkinson, S. Riemer-Sørensen, C. Blake, G. B. Poole, and others, Phys. Rev. D 86, 103518 (2012), arXiv:1210.2130 [astro-ph.CO] .
- Vagnozzi et al. [2017] S. Vagnozzi, E. Giusarma, O. Mena, K. Freese, and others, Phys. Rev. D 96, 123503 (2017), arXiv:1701.08172 [astro-ph.CO] .
- Loureiro et al. [2019] A. Loureiro, A. Cuceu, F. B. Abdalla, B. Moraes, and others, Phys. Rev. Lett. 123, 081301 (2019), arXiv:1811.02578 [astro-ph.CO] .
- Choudhury and Hannestad [2020] S. R. Choudhury and S. Hannestad, J. Cosmology Astropart. Phys 2020, 037 (2020), arXiv:1907.12598 [astro-ph.CO] .
- Planck Collaboration [2020a] Planck Collaboration, A&A 641, A6 (2020a), arXiv:1807.06209 [astro-ph.CO] .
- Palanque-Delabrouille et al. [2020] N. Palanque-Delabrouille, C. Yèche, N. Schöneberg, J. Lesgourgues, and others, J. Cosmology Astropart. Phys 2020, 038 (2020), arXiv:1911.09073 [astro-ph.CO] .
- Di Valentino et al. [2021] E. Di Valentino, S. Gariazzo, and O. Mena, Phys. Rev. D 104, 083504 (2021), arXiv:2106.15267 [astro-ph.CO] .
- Brieden et al. [2022] S. Brieden, H. Gil-Marín, and L. Verde, J. Cosmology Astropart. Phys 2022, 024 (2022), arXiv:2204.11868 [astro-ph.CO] .
- DESI Collaboration et al. [2025a] DESI Collaboration, A. G. Adame, J. Aguilar, S. Ahlen, and others, J. Cosmology Astropart. Phys 2025, 021 (2025a), arXiv:2404.03002 [astro-ph.CO] .
- DESI Collaboration et al. [2024a] DESI Collaboration, A. G. Adame, J. Aguilar, S. Ahlen, and others, arXiv e-prints , arXiv:2411.12022 (2024a), arXiv:2411.12022 [astro-ph.CO] .
- DESI Collaboration et al. [2025b] DESI Collaboration, M. A. Karim, J. Aguilar, S. Ahlen, and others, arXiv e-prints , arXiv:2503.14738 (2025b), arXiv:2503.14738 [astro-ph.CO] .
- Levi et al. [2013] M. Levi, C. Bebek, T. Beers, R. Blum, and others, arXiv e-prints , arXiv:1308.0847 (2013), arXiv:1308.0847 [astro-ph.CO] .
- DESI Collaboration et al. [2022] DESI Collaboration, B. Abareshi, J. Aguilar, S. Ahlen, and others, AJ 164, 207 (2022), arXiv:2205.10939 [astro-ph.IM] .
- DESI Collaboration et al. [2016a] DESI Collaboration, A. Aghamousa, J. Aguilar, S. Ahlen, and others, arXiv e-prints , arXiv:1611.00037 (2016a), arXiv:1611.00037 [astro-ph.IM] .
- Planck Collaboration [2020b] Planck Collaboration, A&A 641, A5 (2020b), arXiv:1907.12875 [astro-ph.CO] .
- Carron et al. [2022] J. Carron, M. Mirmelstein, and A. Lewis, J. Cosmology Astropart. Phys 2022, 039 (2022), arXiv:2206.07773 [astro-ph.CO] .
- Madhavacheril et al. [2024] M. S. Madhavacheril, F. J. Qu, B. D. Sherwin, N. MacCrann, and others, ApJ 962, 113 (2024), arXiv:2304.05203 [astro-ph.CO] .
- Qu et al. [2024] F. J. Qu, B. D. Sherwin, M. S. Madhavacheril, D. Han, and others, ApJ 962, 112 (2024), arXiv:2304.05202 [astro-ph.CO] .
- Schöneberg [2024] N. Schöneberg, J. Cosmology Astropart. Phys 2024, 006 (2024), arXiv:2401.15054 [astro-ph.CO] .
- Esteban et al. [2024] I. Esteban, M. C. Gonzalez-Garcia, M. Maltoni, I. Martinez-Soler, and others, Journal of High Energy Physics 2024, 216 (2024).
- nuf [2024] NuFIT 6.0 (2024), www.nu-fit.org.
- Capozzi et al. [2021] F. Capozzi, E. Di Valentino, E. Lisi, A. Marrone, and others, arXiv e-prints , arXiv:2107.00532 (2021), arXiv:2107.00532 [hep-ph] .
- de Salas et al. [2021] P. F. de Salas, D. V. Forero, S. Gariazzo, P. Martínez-Miravé, and others, Journal of High Energy Physics 2021, 71 (2021), arXiv:2006.11237 [hep-ph] .
- Hannestad [2005] S. Hannestad, Phys. Rev. Lett. 95, 221301 (2005), arXiv:astro-ph/0505551 [astro-ph] .
- Lorenz et al. [2017] C. S. Lorenz, E. Calabrese, and D. Alonso, Phys. Rev. D 96, 043510 (2017), arXiv:1706.00730 [astro-ph.CO] .
- Vagnozzi et al. [2018] S. Vagnozzi, S. Dhawan, M. Gerbino, K. Freese, and others, Phys. Rev. D 98, 083501 (2018), arXiv:1801.08553 [astro-ph.CO] .
- Upadhye [2019] A. Upadhye, J. Cosmology Astropart. Phys 2019, 041 (2019), arXiv:1707.09354 [astro-ph.CO] .
- Liu and Miao [2020] Z. Liu and H. Miao, International Journal of Modern Physics D 29, 2050088 (2020), arXiv:2002.05563 [astro-ph.CO] .
- Sharma et al. [2022] R. K. Sharma, K. L. Pandey, and S. Das, ApJ 934, 113 (2022), arXiv:2202.01749 [astro-ph.CO] .
- Roy Choudhury and Okumura [2024] S. Roy Choudhury and T. Okumura, ApJ 976, L11 (2024), arXiv:2409.13022 [astro-ph.CO] .
- Shao et al. [2024] H. Shao, J. J. Givans, J. Dunkley, M. Madhavacheril, and others, arXiv e-prints , arXiv:2409.02295 (2024), arXiv:2409.02295 [astro-ph.CO] .
- Yadav et al. [2024] A. Yadav and others, arXiv e-prints , arXiv:2406.18496 (2024), arXiv:2406.18496 [astro-ph.CO] .
- Chevallier and Polarski [2001] M. Chevallier and D. Polarski, International Journal of Modern Physics D 10, 213 (2001), arXiv:gr-qc/0009008 [gr-qc] .
- Linder [2003] E. V. Linder, Phys. Rev. Lett. 90, 091301 (2003), arXiv:astro-ph/0208512 [astro-ph] .
- Planck Collaboration [2014] Planck Collaboration, A&A 566, A54 (2014), arXiv:1311.1657 [astro-ph.CO] .
- Alam et al. [2021] S. Alam, M. Aubert, S. Avila, C. Balland, and others, Phys. Rev. D 103, 083533 (2021), arXiv:2007.08991 [astro-ph.CO] .
- Craig et al. [2024] N. Craig, D. Green, J. Meyers, and S. Rajendran, Journal of High Energy Physics 2024, 97 (2024), arXiv:2405.00836 [astro-ph.CO] .
- Green and Meyers [2024] D. Green and J. Meyers, arXiv e-prints , arXiv:2407.07878 (2024), arXiv:2407.07878 [astro-ph.CO] .
- Elbers et al. [2025] W. Elbers, C. S. Frenk, A. Jenkins, B. Li, and others, Phys. Rev. D 111, 063534 (2025), arXiv:2407.10965 [astro-ph.CO] .
- Allali and Notari [2024] I. J. Allali and A. Notari, arXiv e-prints , arXiv:2406.14554 (2024), arXiv:2406.14554 [astro-ph.CO] .
- Naredo-Tuero et al. [2024] D. Naredo-Tuero, M. Escudero, Enrique Fernandez-Martinez, X. Marcano, and others, Phys. Rev. D 110, 123537 (2024), arXiv:2407.13831 [astro-ph.CO] .
- Noriega and Aviles [2024] H. E. Noriega and A. Aviles, arXiv e-prints , arXiv:2407.06117 (2024), arXiv:2407.06117 [astro-ph.CO] .
- Garc´ıa Escudero and Abazajian [2024] H. García Escudero and K. N. Abazajian, arXiv e-prints , arXiv:2412.05451 (2024), arXiv:2412.05451 [astro-ph.CO] .
- Jiang et al. [2025] J.-Q. Jiang, W. Giarè, S. Gariazzo, M. G. Dainotti, and others, J. Cosmology Astropart. Phys 2025, 153 (2025), arXiv:2407.18047 [astro-ph.CO] .
- Rebouças et al. [2025] J. Rebouças, D. H. F. de Souza, K. Zhong, V. Miranda, and others, J. Cosmology Astropart. Phys 2025, 024 (2025).
- DESI Collaboration [2025] DESI Collaboration, in prep. (2025).
- Lesgourgues and Pastor [2006] J. Lesgourgues and S. Pastor, Phys. Rep. 429, 307 (2006), arXiv:astro-ph/0603494 [astro-ph] .
- Wong [2011] Y. Y. Y. Wong, Annual Review of Nuclear and Particle Science 61, 69 (2011), arXiv:1111.1436 [astro-ph.CO] .
- Abazajian and Kaplinghat [2016] K. N. Abazajian and M. Kaplinghat, Annual Review of Nuclear and Particle Science 66, 401 (2016).
- Loverde and Weiner [2024] M. Loverde and Z. J. Weiner, J. Cosmology Astropart. Phys 2024, 048 (2024), arXiv:2410.00090 [astro-ph.CO] .
- Bertólez-Mart´ınez et al. [2024] T. Bertólez-Martínez, I. Esteban, R. Hajjar, O. Mena, and others, arXiv e-prints , arXiv:2411.14524 (2024), arXiv:2411.14524 [astro-ph.CO] .
- Racco et al. [2025] D. Racco, P. Zhang, and H. Zheng, Physics of the Dark Universe 47, 101803 (2025), arXiv:2412.04959 [astro-ph.CO] .
- Hu et al. [1998] W. Hu, D. J. Eisenstein, and M. Tegmark, Phys. Rev. Lett. 80, 5255 (1998), arXiv:astro-ph/9712057 [astro-ph] .
- Kiakotou et al. [2008] A. Kiakotou, Ø. Elgarøy, and O. Lahav, Phys. Rev. D 77, 063005 (2008), arXiv:0709.0253 [astro-ph] .
- Poppett et al. [2024] C. Poppett, L. Tyas, J. Aguilar, C. Bebek, and others, AJ 168, 245 (2024).
- Silber et al. [2023] J. H. Silber, P. Fagrelius, K. Fanning, M. Schubnell, and others, AJ 165, 9 (2023), arXiv:2205.09014 [astro-ph.IM] .
- Miller et al. [2024] T. N. Miller, P. Doel, G. Gutierrez, R. Besuner, and others, AJ 168, 95 (2024), arXiv:2306.06310 [astro-ph.IM] .
- DESI Collaboration et al. [2016b] DESI Collaboration, A. Aghamousa, J. Aguilar, S. Ahlen, and others, arXiv e-prints , arXiv:1611.00036 (2016b), arXiv:1611.00036 [astro-ph.IM] .
- Myers et al. [2023] A. D. Myers, J. Moustakas, S. Bailey, B. A. Weaver, and others, AJ 165, 50 (2023), arXiv:2208.08518 [astro-ph.IM] .
- Dey et al. [2019] A. Dey, D. J. Schlegel, D. Lang, R. Blum, and others, AJ 157, 168 (2019), arXiv:1804.08657 [astro-ph.IM] .
- Zou et al. [2017] H. Zou, X. Zhou, X. Fan, T. Zhang, and others, PASP 129, 064101 (2017), arXiv:1702.03653 [astro-ph.GA] .
- DESI Collaboration et al. [2024b] DESI Collaboration, A. G. Adame, J. Aguilar, S. Ahlen, and others, AJ 167, 62 (2024b), arXiv:2306.06307 [astro-ph.CO] .
- Lan et al. [2023] T.-W. Lan, R. Tojeiro, E. Armengaud, J. X. Prochaska, and others, ApJ 943, 68 (2023), arXiv:2208.08516 [astro-ph.CO] .
- Alexander et al. [2023] D. M. Alexander, T. M. Davis, E. Chaussidon, V. A. Fawcett, and others, AJ 165, 124 (2023), arXiv:2208.08517 [astro-ph.GA] .
- DESI Collaboration et al. [2024c] DESI Collaboration, A. G. Adame, J. Aguilar, S. Ahlen, and others, AJ 168, 58 (2024c), arXiv:2306.06308 [astro-ph.CO] .
- Guy et al. [2023] J. Guy, S. Bailey, A. Kremin, S. Alam, and others, AJ 165, 144 (2023), arXiv:2209.14482 [astro-ph.IM] .
- Bailey et al. [2025] Bailey et al., , in preparation (2025).
- Brodzeller et al. [2023] A. Brodzeller, K. Dawson, S. Bailey, J. Yu, and others, AJ 166, 66 (2023), arXiv:2305.10426 [astro-ph.IM] .
- Schlafly et al. [2023] E. F. Schlafly, D. Kirkby, D. J. Schlegel, A. D. Myers, and others, AJ 166, 259 (2023), arXiv:2306.06309 [astro-ph.CO] .
- DESI Collaboration et al. [2025c] DESI Collaboration, M. A. Karim, A. G. Adame, D. Aguado, and others, arXiv e-prints , arXiv:2503.14745 (2025c), arXiv:2503.14745 [astro-ph.CO] .
- DESI Collaboration et al. [2024d] DESI Collaboration, A. G. Adame, J. Aguilar, S. Ahlen, and others, arXiv e-prints , arXiv:2411.12020 (2024d), arXiv:2411.12020 [astro-ph.CO] .
- DESI Collaboration et al. [2024e] DESI Collaboration, A. G. Adame, J. Aguilar, S. Ahlen, and others, arXiv e-prints , arXiv:2404.03000 (2024e), arXiv:2404.03000 [astro-ph.CO] .
- DESI Collaboration et al. [2025d] DESI Collaboration, A. G. Adame, J. Aguilar, S. Ahlen, and others, J. Cosmology Astropart. Phys 2025, 124 (2025d), arXiv:2404.03001 [astro-ph.CO] .
- DESI Collaboration et al. [2024f] DESI Collaboration, A. G. Adame, J. Aguilar, S. Ahlen, and others, arXiv e-prints , arXiv:2411.12021 (2024f), arXiv:2411.12021 [astro-ph.CO] .
- Hahn et al. [2023] C. Hahn, M. J. Wilson, O. Ruiz-Macias, S. Cole, and others, AJ 165, 253 (2023), arXiv:2208.08512 [astro-ph.CO] .
- Zhou et al. [2023] R. Zhou, B. Dey, J. A. Newman, D. J. Eisenstein, and others, AJ 165, 58 (2023), arXiv:2208.08515 [astro-ph.CO] .
- Raichoor et al. [2023] A. Raichoor, J. Moustakas, J. A. Newman, T. Karim, and others, AJ 165, 126 (2023), arXiv:2208.08513 [astro-ph.CO] .
- Chaussidon et al. [2023] E. Chaussidon, C. Yèche, N. Palanque-Delabrouille, D. M. Alexander, and others, ApJ 944, 107 (2023), arXiv:2208.08511 [astro-ph.CO] .
- Andrade et al. [2025] U. Andrade, E. Paillas, J. Mena-Fernández, Q. Li, and others, arXiv e-prints , arXiv:2503.14742 (2025), arXiv:2503.14742 [astro-ph.CO] .
- DESI Collaboration et al. [2025e] DESI Collaboration, M. A. Karim, J. Aguilar, S. Ahlen, and others, arXiv e-prints , arXiv:2503.14739 (2025e), arXiv:2503.14739 [astro-ph.CO] .
- Casas et al. [2025] L. Casas, H. K. Herrera-Alcantar, J. Chaves-Montero, A. Cuceu, and others, arXiv e-prints , arXiv:2503.14741 (2025), arXiv:2503.14741 [astro-ph.IM] .
- Brodzeller et al. [2025] A. Brodzeller, M. Wolfson, D. M. Santos, M. Ho, and others, arXiv e-prints , arXiv:2503.14740 (2025), arXiv:2503.14740 [astro-ph.CO] .
- McDonald and Roy [2009] P. McDonald and A. Roy, J. Cosmology Astropart. Phys 2009, 020 (2009), arXiv:0902.0991 [astro-ph.CO] .
- Baumann et al. [2012] D. Baumann, A. Nicolis, L. Senatore, and M. Zaldarriaga, J. Cosmology Astropart. Phys 2012, 051 (2012), arXiv:1004.2488 [astro-ph.CO] .
- Carrasco et al. [2012] J. J. M. Carrasco, M. P. Hertzberg, and L. Senatore, Journal of High Energy Physics 2012, 82 (2012), arXiv:1206.2926 [astro-ph.CO] .
- Vlah et al. [2015] Z. Vlah, M. White, and A. Aviles, J. Cosmology Astropart. Phys 2015, 014 (2015), arXiv:1506.05264 [astro-ph.CO] .
- Noriega et al. [2025] H. E. Noriega, A. Aviles, H. Gil-Marín, S. Ramirez-Solano, and others, J. Cosmology Astropart. Phys 2025, 136 (2025), arXiv:2404.07269 [astro-ph.CO] .
- Maus et al. [2025a] M. Maus, Y. Lai, H. E. Noriega, S. Ramirez-Solano, and others, J. Cosmology Astropart. Phys 2025, 134 (2025a), arXiv:2404.07272 [astro-ph.CO] .
- Maus et al. [2025b] M. Maus, S. Chen, M. White, J. Aguilar, and others, J. Cosmology Astropart. Phys 2025, 138 (2025b), arXiv:2404.07312 [astro-ph.CO] .
- Lai et al. [2025] Y. Lai, C. Howlett, M. Maus, H. Gil-Marín, and others, J. Cosmology Astropart. Phys 2025, 139 (2025), arXiv:2404.07283 [astro-ph.CO] .
- Ramirez-Solano et al. [2025] S. Ramirez-Solano, M. Icaza-Lizaola, H. E. Noriega, M. Vargas-Magaña, and others, J. Cosmology Astropart. Phys 2025, 129 (2025), arXiv:2404.07268 [astro-ph.CO] .
- Findlay et al. [2024] N. Findlay, S. Nadathur, W. J. Percival, A. de Mattia, and others, arXiv e-prints , arXiv:2411.12023 (2024), arXiv:2411.12023 [astro-ph.CO] .
- R. Gsponer, F. Rodr´ıguez-Mart´ınez et al. [2025] R. Gsponer, F. Rodríguez-Martínez et al., in preparation (2025).
- R. Zhao et al. [2025] R. Zhao et al., in preparation (2025).
- Rashkovetskyi et al. [2023] M. Rashkovetskyi, D. J. Eisenstein, J. N. Aguilar, D. Brooks, and others, MNRAS 524, 3894 (2023), arXiv:2306.06320 [astro-ph.CO] .
- Rashkovetskyi et al. [2025] M. Rashkovetskyi, D. Forero-Sánchez, A. de Mattia, D. J. Eisenstein, and others, J. Cosmology Astropart. Phys 2025, 145 (2025), arXiv:2404.03007 [astro-ph.CO] .
- Forero-Sánchez et al. [2024] D. Forero-Sánchez, M. Rashkovetskyi, O. Alves, A. de Mattia, and others, arXiv e-prints , arXiv:2411.12027 (2024), arXiv:2411.12027 [astro-ph.CO] .
- Rosenberg et al. [2022] E. Rosenberg, S. Gratton, and G. Efstathiou, MNRAS 517, 4620 (2022), arXiv:2205.10869 [astro-ph.CO] .
- Tristram et al. [2021] M. Tristram, A. J. Banday, K. M. Górski, R. Keskitalo, and others, A&A 647, A128 (2021), arXiv:2010.01139 [astro-ph.CO] .
- Tristram et al. [2024] M. Tristram, A. J. Banday, M. Douspis, X. Garrido, and others, A&A 682, A37 (2024), arXiv:2309.10034 [astro-ph.CO] .
- Efstathiou and Gratton [2021] G. Efstathiou and S. Gratton, The Open Journal of Astrophysics 4, 8 (2021), arXiv:1910.00483 [astro-ph.CO] .
- Scolnic et al. [2022] D. Scolnic, D. Brout, A. Carr, A. G. Riess, and others, ApJ 938, 113 (2022), arXiv:2112.03863 [astro-ph.CO] .
- Brout et al. [2022] D. Brout, D. Scolnic, B. Popovic, A. G. Riess, and others, ApJ 938, 110 (2022), arXiv:2202.04077 [astro-ph.CO] .
- Rubin et al. [2023] D. Rubin, G. Aldering, M. Betoule, A. Fruchter, and others, arXiv e-prints , arXiv:2311.12098 (2023), arXiv:2311.12098 [astro-ph.CO] .
- DES Collaboration [2024] DES Collaboration, ApJ 973, L14 (2024), arXiv:2401.02929 [astro-ph.CO] .
- Torrado and Lewis [2021] J. Torrado and A. Lewis, J. Cosmology Astropart. Phys 2021, 057 (2021), arXiv:2005.05290 [astro-ph.IM] .
- Torrado and Lewis [2019] J. Torrado and A. Lewis, Cobaya: Bayesian analysis in cosmology, Astrophysics Source Code Library, record ascl:1910.019 (2019), ascl:1910.019 .
- Lewis et al. [2000] A. Lewis, A. Challinor, and A. Lasenby, ApJ 538, 473 (2000), arXiv:astro-ph/9911177 [astro-ph] .
- Lesgourgues [2011] J. Lesgourgues, arXiv e-prints , arXiv:1104.2932 (2011), arXiv:1104.2932 [astro-ph.IM] .
- Lesgourgues and Tram [2011] J. Lesgourgues and T. Tram, J. Cosmology Astropart. Phys 2011, 032 (2011), arXiv:1104.2935 [astro-ph.CO] .
- Lewis [2019] A. Lewis, arXiv e-prints , arXiv:1910.13970 (2019), arXiv:1910.13970 [astro-ph.IM] .
- Pérez-Fernández et al. [2025] A. Pérez-Fernández, L. Medina-Varela, R. Ruggeri, M. Vargas-Magaña, and others, J. Cosmology Astropart. Phys 2025, 144 (2025), arXiv:2406.06085 [astro-ph.CO] .
- Mena-Fernández et al. [2025] J. Mena-Fernández, C. Garcia-Quintero, S. Yuan, B. Hadzhiyska, and others, J. Cosmology Astropart. Phys 2025, 133 (2025), arXiv:2404.03008 [astro-ph.CO] .
- Garcia-Quintero et al. [2025] C. Garcia-Quintero, J. Mena-Fernández, A. Rocher, S. Yuan, and others, J. Cosmology Astropart. Phys 2025, 132 (2025), arXiv:2404.03009 [astro-ph.CO] .
- Garrison et al. [2019] L. H. Garrison, D. J. Eisenstein, and P. A. Pinto, MNRAS 485, 3370 (2019), arXiv:1810.02916 [astro-ph.CO] .
- Maksimova et al. [2021] N. A. Maksimova, L. H. Garrison, D. J. Eisenstein, B. Hadzhiyska, and others, MNRAS 508, 4017 (2021), arXiv:2110.11398 [astro-ph.CO] .
- Elbers and et al. [2025] W. Elbers and et al., in preparation (2025).
- Schaller et al. [2018] M. Schaller, P. Gonnet, A. B. Chalk, and P. W. Draper, Astrophysics Source Code Library (2018).
- Schaller et al. [2024] M. Schaller, J. Borrow, P. W. Draper, M. Ivkovic, and others, MNRAS 530, 2378 (2024), arXiv:2305.13380 [astro-ph.IM] .
- Hahn et al. [2020] O. Hahn, M. Michaux, C. Rampf, C. Uhlemann, and others, MUSIC2-monofonIC: 3LPT initial condition generator, Astrophysics Source Code Library, record ascl:2008.024 (2020), ascl:2008.024 .
- Michaux et al. [2020] M. Michaux, O. Hahn, C. Rampf, and R. E. Angulo, Mon. Not. Roy. Astron. Soc. 500, 663 (2020), arXiv:2008.09588 [astro-ph.CO] .
- Elbers et al. [2022] W. Elbers, C. S. Frenk, A. Jenkins, B. Li, and others, MNRAS 516, 3821 (2022), arXiv:2202.00670 [astro-ph.CO] .
- Elbers [2022] W. Elbers, J. Cosmology Astropart. Phys 2022, 058 (2022), arXiv:2207.14256 [astro-ph.CO] .
- Elbers et al. [2021] W. Elbers, C. S. Frenk, A. Jenkins, B. Li, and others, Mon. Not. Roy. Astron. Soc. 507, 2614 (2021), arXiv:2010.07321 [astro-ph.CO] .
- Han et al. [2012] J. Han, Y. P. Jing, H. Wang, and W. Wang, Mon. Not. Roy. Astron. Soc. 427, 2437 (2012), arXiv:1103.2099 [astro-ph.CO] .
- Han et al. [2018] J. Han, S. Cole, C. S. Frenk, A. Benitez-Llambay, and others, MNRAS 474, 604 (2018), arXiv:1708.03646 [astro-ph.CO] .
- Forouhar Moreno et al. [2025] V. J. Forouhar Moreno, J. Helly, R. McGibbon, J. Schaye, and others, arXiv e-prints , arXiv:2502.06932 (2025), arXiv:2502.06932 [astro-ph.CO] .
- Smith et al. [2024] A. Smith, C. Grove, S. Cole, P. Norberg, and others, MNRAS 532, 903 (2024), arXiv:2312.08792 [astro-ph.CO] .
- Whitford et al. [2024] A. M. Whitford, H. Rivera-Morales, C. Howlett, M. Vargas-Magaña, and others, arXiv e-prints , arXiv:2412.05990 (2024), arXiv:2412.05990 [astro-ph.CO] .
- Bashinsky and Seljak [2004] S. Bashinsky and U. Seljak, Phys. Rev. D 69, 083002 (2004), arXiv:astro-ph/0310198 [astro-ph] .
- Baumann et al. [2016] D. Baumann, D. Green, J. Meyers, and B. Wallisch, J. Cosmology Astropart. Phys 2016, 007 (2016), arXiv:1508.06342 [astro-ph.CO] .
- Baumann et al. [2019] D. Baumann, F. Beutler, R. Flauger, D. Green, and others, Nature Physics 15, 465 (2019), arXiv:1803.10741 [astro-ph.CO] .
- Archidiacono et al. [2020] M. Archidiacono, S. Hannestad, and J. Lesgourgues, J. Cosmology Astropart. Phys 2020, 021 (2020), arXiv:2003.03354 [astro-ph.CO] .
- Lesgourgues and Pastor [2005] J. Lesgourgues and S. Pastor, arXiv e-prints , hep-ph/0505148 (2005), arXiv:hep-ph/0505148 [hep-ph] .
- Di Valentino et al. [2018] E. Di Valentino, T. Brinckmann, M. Gerbino, V. Poulin, and others, J. Cosmology Astropart. Phys 2018, 017 (2018), arXiv:1612.00021 [astro-ph.CO] .
- Herold and Kamionkowski [2024] L. Herold and M. Kamionkowski, arXiv e-prints , arXiv:2412.03546 (2024), arXiv:2412.03546 [astro-ph.CO] .
- Reid et al. [2016] B. Reid, S. Ho, N. Padmanabhan, W. J. Percival, and others, MNRAS 455, 1553 (2016), arXiv:1509.06529 [astro-ph.CO] .
- Planck Collaboration [2016] Planck Collaboration, A&A 594, A1 (2016), arXiv:1502.01582 [astro-ph.CO] .
- Scolnic et al. [2018] D. M. Scolnic, D. O. Jones, A. Rest, Y. C. Pan, and others, ApJ 859, 101 (2018), arXiv:1710.00845 [astro-ph.CO] .
- Pitrou et al. [2018] C. Pitrou, A. Coc, J.-P. Uzan, and E. Vangioni, Phys. Rep. 754, 1 (2018), arXiv:1801.08023 [astro-ph.CO] .
- Ross et al. [2015] A. J. Ross, L. Samushia, C. Howlett, W. J. Percival, and others, MNRAS 449, 835 (2015), arXiv:1409.3242 [astro-ph.CO] .
- Beutler et al. [2012] F. Beutler, C. Blake, M. Colless, L. Staveley-Smith, and others, in American Astronomical Society Meeting Abstracts, Vol. 219 (2012) p. 402.01.
- Calabrese et al. [2008] E. Calabrese, A. Slosar, A. Melchiorri, G. F. Smoot, and others, Phys. Rev. D 77, 123531 (2008), arXiv:0803.2309 [astro-ph] .
- Renzi et al. [2018] F. Renzi, E. Di Valentino, and A. Melchiorri, Phys. Rev. D 97, 123534 (2018), arXiv:1712.08758 [astro-ph.CO] .
- Mokeddem et al. [2023] R. Mokeddem, W. S. Hipólito-Ricaldi, and A. Bernui, J. Cosmology Astropart. Phys 2023, 017 (2023), arXiv:2209.11660 [astro-ph.CO] .
- McCarthy et al. [2018] I. G. McCarthy, S. Bird, J. Schaye, J. Harnois-Deraps, and others, MNRAS 476, 2999 (2018), arXiv:1712.02411 [astro-ph.CO] .
- Di Valentino et al. [2020] E. Di Valentino, A. Melchiorri, and J. Silk, J. Cosmology Astropart. Phys 2020, 013 (2020), arXiv:1908.01391 [astro-ph.CO] .
- James and Roos [1975] F. James and M. Roos, Comput. Phys. Commun. 10, 343 (1975).
- Dembinski and et al. [2020] H. Dembinski and P. O. et al., scikit-hep/iminuit (2020).
- Herold et al. [2024] L. Herold, E. G. M. Ferreira, and L. Heinrich, arXiv e-prints , arXiv:2408.07700 (2024), arXiv:2408.07700 [astro-ph.CO] .
- Feldman and Cousins [1998] G. J. Feldman and R. D. Cousins, Phys. Rev. D 57, 3873 (1998), arXiv:physics/9711021 [physics.data-an] .
- Lodha et al. [2025] K. Lodha, R. Calderon, W. L. Matthewson, A. Shafieloo, and others, arXiv e-prints , arXiv:2503.14743 (2025), arXiv:2503.14743 [astro-ph.CO] .
- Freedman et al. [2024] W. L. Freedman, B. F. Madore, I. S. Jang, T. J. Hoyt, and others, arXiv e-prints , arXiv:2408.06153 (2024), arXiv:2408.06153 [astro-ph.CO] .
- Planck Collaboration et al. [2020] Planck Collaboration, Y. Akrami, K. J. Andersen, M. Ashdown, and others, A&A 643, A42 (2020), arXiv:2007.04997 [astro-ph.CO] .
- Hinshaw et al. [2013] G. Hinshaw, D. Larson, E. Komatsu, D. N. Spergel, and others, ApJS 208, 19 (2013), arXiv:1212.5226 [astro-ph.CO] .
- Paoletti et al. [2024] D. Paoletti, D. K. Hazra, F. Finelli, and G. F. Smoot, arXiv e-prints , arXiv:2405.09506 (2024), arXiv:2405.09506 [astro-ph.CO] .
- Muñoz et al. [2024] J. B. Muñoz, J. Mirocha, J. Chisholm, S. R. Furlanetto, and others, MNRAS 535, L37 (2024), arXiv:2404.07250 [astro-ph.CO] .
- Becker et al. [2015] G. D. Becker, J. S. Bolton, P. Madau, M. Pettini, and others, MNRAS 447, 3402 (2015), arXiv:1407.4850 [astro-ph.CO] .
- Bouwens et al. [2015] R. J. Bouwens, G. D. Illingworth, P. A. Oesch, J. Caruana, and others, ApJ 811, 140 (2015), arXiv:1503.08228 [astro-ph.CO] .
- Planck Collaboration et al. [2016] Planck Collaboration, R. Adam, N. Aghanim, M. Ashdown, and others, A&A 596, A108 (2016), arXiv:1605.03507 [astro-ph.CO] .
- Kulkarni et al. [2019] G. Kulkarni, L. C. Keating, M. G. Haehnelt, S. E. I. Bosman, and others, MNRAS 485, L24 (2019), arXiv:1809.06374 [astro-ph.CO] .
- Choudhury et al. [2021] T. R. Choudhury, A. Paranjape, and S. E. I. Bosman, MNRAS 501, 5782 (2021), arXiv:2003.08958 [astro-ph.CO] .
- Zhu et al. [2024] Y. Zhu, G. D. Becker, S. E. I. Bosman, C. Cain, and others, MNRAS 533, L49 (2024), arXiv:2405.12275 [astro-ph.CO] .
- Choudhury and Choubey [2018] S. R. Choudhury and S. Choubey, J. Cosmology Astropart. Phys 2018, 017 (2018), arXiv:1806.10832 [astro-ph.CO] .
- Gariazzo et al. [2023] S. Gariazzo, O. Mena, and T. Schwetz, Physics of the Dark Universe 40, 101226 (2023), arXiv:2302.14159 [hep-ph] .
- Raveri et al. [2020] M. Raveri, G. Zacharegkas, and W. Hu, Phys. Rev. D 101, 103527 (2020), arXiv:1912.04880 [astro-ph.CO] .
- Raveri and Doux [2021] M. Raveri and C. Doux, Phys. Rev. D 104, 043504 (2021), arXiv:2105.03324 [astro-ph.CO] .
- Bautista et al. [2021] J. E. Bautista, R. Paviot, M. Vargas Magaña, S. de la Torre, and others, MNRAS 500, 736 (2021), arXiv:2007.08993 [astro-ph.CO] .
- Gil-Mar´ın et al. [2020] H. Gil-Marín, J. E. Bautista, R. Paviot, M. Vargas-Magaña, and others, MNRAS 498, 2492 (2020), arXiv:2007.08994 [astro-ph.CO] .
- K. Lodha et al. [2025] K. Lodha et al., in preparation (2025).
- Serpico [2007] P. D. Serpico, Phys. Rev. Lett. 98, 171301 (2007), arXiv:astro-ph/0701699 [astro-ph] .
- Escudero and Fairbairn [2019] M. Escudero and M. Fairbairn, Phys. Rev. D 100, 103531 (2019), arXiv:1907.05425 [hep-ph] .
- Escudero et al. [2020] M. Escudero, J. Lopez-Pavon, N. Rius, and S. Sandner, Journal of High Energy Physics 2020, 119 (2020), arXiv:2007.04994 [hep-ph] .
- Chacko et al. [2021] Z. Chacko, A. Dev, P. Du, V. Poulin, and others, Phys. Rev. D 103, 043519 (2021), arXiv:2002.08401 [astro-ph.CO] .
- Abellán et al. [2022] G. F. Abellán, Z. Chacko, A. Dev, P. Du, and others, Journal of High Energy Physics 2022, 76 (2022), arXiv:2112.13862 [hep-ph] .
- Esteban and Salvado [2021] I. Esteban and J. Salvado, J. Cosmology Astropart. Phys 2021, 036 (2021), arXiv:2101.05804 [hep-ph] .
- Archidiacono et al. [2022] M. Archidiacono, E. Castorina, D. Redigolo, and E. Salvioni, J. Cosmology Astropart. Phys 2022, 074 (2022), arXiv:2204.08484 [astro-ph.CO] .
- Esteban et al. [2022] I. Esteban, O. Mena, and J. Salvado, Phys. Rev. D 106, 083516 (2022), arXiv:2202.04656 [astro-ph.CO] .
- Bogorad et al. [2024] Z. Bogorad, P. Graham, and H. Ramani, arXiv e-prints , arXiv:2410.07324 (2024), arXiv:2410.07324 [hep-ph] .
- Bottaro et al. [2024] S. Bottaro, E. Castorina, M. Costa, D. Redigolo, and others, Phys. Rev. Lett. 132, 201002 (2024), arXiv:2309.11496 [astro-ph.CO] .
- Kaplan et al. [2025] D. E. Kaplan, X. Luo, and S. Rajendran, Phys. Rev. D 111, 055019 (2025), arXiv:2412.20766 [hep-ph] .
- Baryakhtar et al. [2024] M. Baryakhtar, O. Simon, and Z. J. Weiner, Phys. Rev. D 110, 083505 (2024), arXiv:2405.10358 [astro-ph.CO] .
- Lynch et al. [2024] G. P. Lynch, L. Knox, and J. Chluba, Phys. Rev. D 110, 083538 (2024), arXiv:2406.10202 [astro-ph.CO] .
- Hamidreza Mirpoorian et al. [2024] S. Hamidreza Mirpoorian, K. Jedamzik, and L. Pogosian, arXiv e-prints , arXiv:2411.16678 (2024), arXiv:2411.16678 [astro-ph.CO] .
- Ma and Bertschinger [1995] C.-P. Ma and E. Bertschinger, ApJ 455, 7 (1995), arXiv:astro-ph/9506072 [astro-ph] .
Appendix A Details of the effective neutrino mass model
The energy density of massive neutrinos is given by
| (42) |
where is the degeneracy factor and the mass of neutrino species . The neutrino energy is in terms of the scale factor, , and the present-day neutrino temperature is . To describe perturbations in the cosmological neutrino fluid, it is standard to write the neutrino phase-space distribution as , where is the background Fermi-Dirac distribution and is the perturbation, which is commonly expressed as a Legendre series in Fourier space [214]
| (43) |
where is the comoving momentum. In terms of , the Boltzmann equation becomes an infinite tower of equations. In conformal Newtonian gauge, these are given by [214]
| (44) | ||||
| (45) | ||||
| (46) |
where dots denote conformal time derivatives, and and are the metric perturbations.
In the effective neutrino mass model of [68], the neutrino energy in the above equations (including in similar expressions as Eq. 42 for the pressure, shear, etc.) is replaced by an effective neutrino energy, defined as
| (47) |
such that the sign is reversed for . This is easily implemented in cosmological Boltzmann solvers and allows the model to be extended to negative values. It was shown that negative values effectively reverse the cosmological effects of massive neutrinos. For instance, the suppression of the matter power spectrum becomes an enhancement, and similarly the effect on cosmic distances is reversed.
We maintain the same expansion history in the early Universe with by adjusting the number of massless neutrinos, . We choose the standard CLASS value of for , but set for .
By definition, the model coincides exactly with the standard analysis in terms of when the effective neutrino mass parameter is restricted to positive values, as shown in Fig. 17.