No [CII] or dust detection in two Little Red Dots at
Little Red Dots (LRDs) are compact, point-like sources characterized by their red color and broad Balmer lines, which have been debated to be either dominated by active galactic nuclei (AGN) or dusty star-forming galaxies (DSFGs). Here we report two LRDs (ID9094 and ID2756) at , recently discovered in the JWST FRESCO GOODS-North field. Both satisfy the “v-shape” colors and compactness criteria for LRDs and are identified as Type-I AGN candidates based on their broad H emission lines (full width at half maximum: km s-1 for ID9094 and km s-1 for ID2756) and narrow [O iii] lines ( km s-1). To investigate their nature, we conduct deep NOEMA follow-up observations targeting the [C ii] emission line and the 1.3 mm dust continuum. We do not detect [C ii] or 1.3 mm continuum emission for either source. Notably, in the scenario that the two LRDs were DSFGs, we would expect significant detections: for [C ii] and for the 1.3 mm continuum of ID9094, and for [C ii] of ID2756. Using the upper limits of [C ii] and 1.3 mm, we perform two analyses: (1) UV-to-FIR spectral energy distribution (SED) fitting with and without AGN components, and (2) comparison of their properties with the –SFRtot empirical relation. Both analyses indicate that LRDs favor the presence of AGN to explain their observed properties. Our results highlight the importance of far-infrared observations for studying LRDs, a regime that remains largely unexplored.
Key Words.:
galaxies: high-redshift – galaxies: active – galaxies: star-formation – galaxies: photometry – submillimetre: galaxies1 Introduction
Little Red Dots (LRDs; e.g., Fujimoto et al., 2022; Labbe et al., 2023; Matthee et al., 2024; Barro et al., 2024) have emerged as one of the most intriguing populations studied with the JWST (Gardner et al., 2023). The term ”LRDs” was first introduced by Matthee et al. (2024) to describe galaxies exhibiting broad H emission lines, with a red point-source morphology. In a broader context, the name LRD has also been applied to a variety of compact, red sources – predominantly at high redshifts () – with “v-shaped” (blue UV and red optical slopes in rest-frame) spectral energy distributions (SEDs), based mainly on photometric measurements only. The samples of these sources overlap, contributing to the complexity of their classification. As a result, their nature has sparked significant debate, with interpretations ranging from dusty star-forming galaxies (DSFGs; Pérez-González et al., 2024; Labbé et al., 2023; Baggen et al., 2024; Guia et al., 2024; Williams et al., 2024) to AGN-dominated systems (e.g., Kocevski et al., 2023, 2024; Ji et al., 2025), and hybrid scenarios involving both stellar and AGN contributions dominating different parts of the SED (e.g., Greene et al., 2024; Kokorev et al., 2024; Wang et al., 2024b; Akins et al., 2025).
Multi-wavelength studies of LRDs have primarily focused on optical, near-infrared (NIR), mid-infrared (MIR), X-ray, and radio data, whereas far-infrared (FIR) studies remain relatively scarce in comparison. FIR observations, however, are crucial for disentangling the roles of AGN activity and dusty starburst processes, as they directly probe dust properties, star formation rates, and possible AGN contributions. Some studies have started to investigate LRDs in the FIR (e.g., Labbe et al., 2023; Casey et al., 2024; Akins et al., 2024; Williams et al., 2024), but most rely on photometric redshifts – either through stacked analyses or individual source studies – which might introduce large uncertainties in interpreting their dust properties and star formation activity. Current evidence shows that many LRDs are faint in X-rays (e.g., Ananna et al., 2024; Maiolino et al., 2024; Yue et al., 2024), exhibit weak or no radio emission (e.g., Akins et al., 2024), and lack detectable hot dust in the MIR (e.g., Pérez-González et al., 2024; Williams et al., 2024). These properties could result from heavily obscured AGNs, extreme dusty starbursts, or even hybrid scenarios. Without robust FIR constraints, however, distinguishing between these possibilities remains challenging.
Another potential issue is the partial overlap in photometric selection methods for LRDs (e.g., Labbe et al., 2023; Greene et al., 2024; Kokorev et al., 2024) and optical/NIR-selected DSFGs (optically dark/faint galaxies; e.g., Wang et al., 2019; Franco et al., 2018; Alcalde Pampliega et al., 2019; Williams et al., 2019; Gómez-Guijarro et al., 2023; Xiao et al., 2023; Gómez-Guijarro et al., 2022; Barrufet et al., 2023; Williams et al., 2024; McKinney et al., 2023; Akins et al., 2023; Pérez-González et al., 2023; Barro et al., 2024), due to their similar red colors. This may pose a challenge for DSFG studies, as optical/NIR-selected DSFGs typically have more relaxed selection criteria, relying solely on color and/or magnitude cuts without considering morphology. As a result, LRDs could inadvertently be included in DSFG samples. Additionally, studies also show that some DSFGs have compact morphology (e.g., Gómez-Guijarro et al., 2023). This overlap introduces ambiguity, as both populations could appear in the same sample category despite potentially distinct physical origins. For example, DSFGs are typically powered by intense star formation obscured by large amounts of dust, while AGN-driven LRDs may exhibit similar photometric properties due to their reddened SEDs but have fundamentally different drivers of energy output.
In this study, we investigate two LRDs, ID9094 and ID2756111ID9094 and ID2756 correspond to gn17537 and gn28924, respectively, in the FRESCO [O iii] catalog (Meyer et al., 2024)., located in the JWST FRESCO GOODS-North field (Oesch et al., 2023). Due to the overlap in photometric selection criteria between DSFGs and LRDs, these two sources were initially classified as optically faint, dust-obscured galaxy candidates with red colors (F182M F444W 1.5 mag) and as the most massive candidates at () based on optical-to-near-IR SED fitting (Xiao et al., 2024). However, as revealed in this study, deep JWST NIRCam grism spectra later reveal the presence of broad H emission lines (Sect. 2.4) – previously tentative in FRESCO spectra and at the time of the NOEMA proposal – along with a red, point-source-like morphology, indicating potential AGN activity.
To further investigate their nature, we present follow-up FIR observations from NOEMA, targeting the [C ii] emission line and the 1.3 mm dust continuum. This study, along with Setton et al. (submitted), represents one of the first efforts to investigate LRDs with both dust and [C ii] emission. These observations provide crucial constraints on the dust temperature, allowing us to assess whether the observed properties of these LRDs are consistent with DSFGs or if AGN-driven processes dominate. By combining FIR data with existing multi-wavelength photometry, this work addresses the critical question of whether DSFG scenarios can be ruled out for LRDs in the absence of spectroscopic confirmation.
This paper is organized as follows. In Section 2, we describe the data and observational details. Section 3 presents our results, including the non-detection of the dust continuum and [C ii] line in the FIR and its implications for the nature of these LRDs. In Section 4, we discuss the impact of LRDs on our understanding of DSFGs. We summarize our conclusions in Section 5.
Throughout this paper, we adopt a Chabrier initial mass function (IMF; Chabrier, 2003) to estimate SFR and stellar mass. We assume a Planck cosmology (Planck Collaboration et al., 2020) with . When necessary, data from the literature have been converted with a conversion factor of (Salpeter, 1955, IMF) = 1.7 (Chabrier, 2003, IMF). All magnitudes are on the AB system (Oke & Gunn, 1983), such that log(Sν [Jy]).
2 Data and sample
The two sources ID9094 (, [J2000] = 189.019240, 62.243531) at and ID2756 (, [J2000] = 189.083488, 62.202579) at are located in the GOODS-N field, and were first discovered in the JWST FRESCO survey (Oesch et al., 2023) and reported in Xiao et al. (2024). They have a red color of F182M F444W 1.5 mag and faint F182M 26.4 mag. As such, they were selected as optically faint dusty galaxy candidates, with high inferred stellar masses. With the broad H emission line, “v-shape” colors, and compact morphology in F444W, we now confirm that they are, in fact, LRDs (see details in Sect. 2.4).
2.1 JWST observations
The two sources were initially observed by the JWST FRESCO survey (Oesch et al., 2023), which provides NIRCam/grism spectroscopy in the F444W filter and direct imaging in F182M, F210M, and F444W over 62 arcmin2 in each GOODS field, North and South. The grism spectra cover a wavelength range of 3.8 to 5.0 m at a resolution of R1,600, reaching a 5 line sensitivity of 10-18 erg s-1 cm-2. The images reach typical 5 depths of 28.3, 28.1, and 28.2 mag, respectively, in a 016 circular aperture. Data reduction was performed using the grizli pipeline222https://github.com/gbrammer/grizli, including continuum subtraction and optimal 1D spectral extraction.
Recently, we obtained deeper NIRCam/grism spectroscopy from a Cycle 3 JWST program (GO-4762; PIs: S. Fujimoto & G. Brammer), using the F410M filter instead of F444W. This choice improves spectral sensitivity by blocking the high thermal background beyond 4.4 m, at the cost of reduced wavelength coverage. Despite a slightly shorter exposure time (by a factor of 1.3) than FRESCO, this dataset thus achieves a 5 line sensitivity of 10-19 erg s-1 cm-2. The continuum subtraction was optimized to explicitly mask emission lines and a wide kernel (for the running median) to prevent over-subtraction of broad wings (see Matthee et al., 2024).
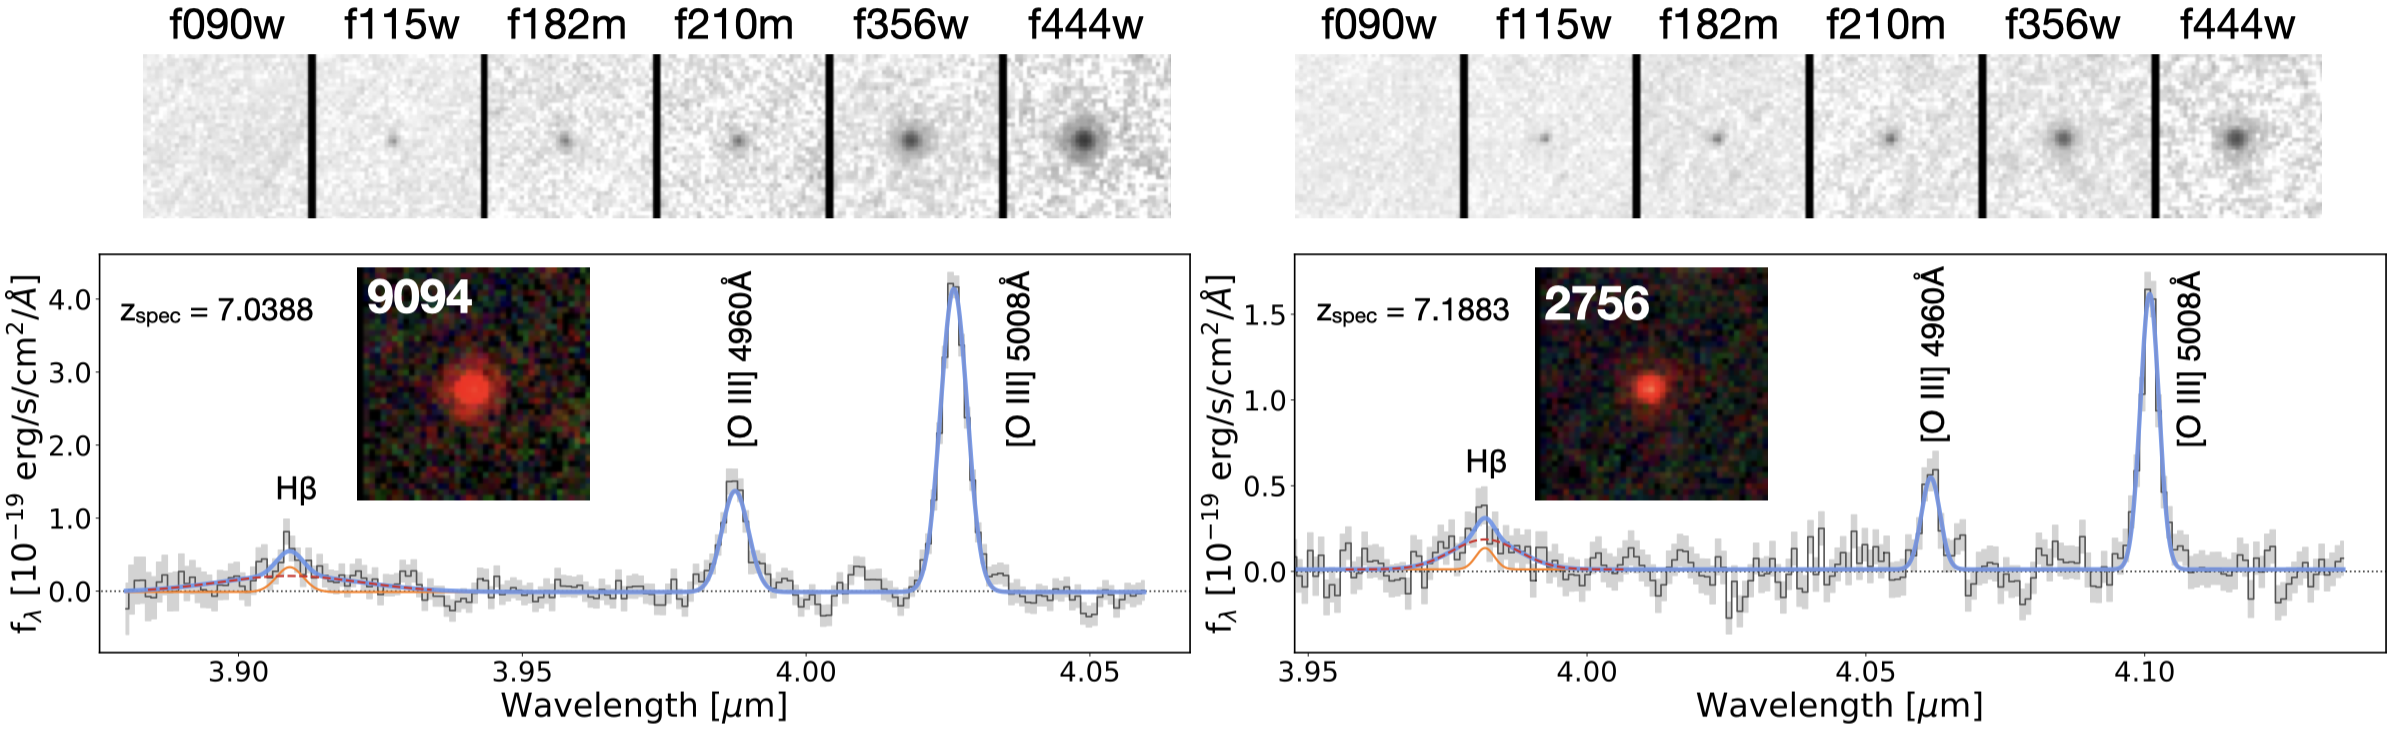
The NIRCam images and grism spectra of ID9094 and ID2756 are shown in Fig. 1, updated with the latest data.
| Instrument | Units | ID2756 | ID9094 | |
|---|---|---|---|---|
| Chandraa | 0.5–7 keV | erg s-1 cm-2 | ||
| 2–7 keV | erg s-1 cm-2 | |||
| 0.5–2 keV | erg s-1 cm-2 | |||
| HST/ACS F435W | 0.43 µm | nJy | ||
| HST/ACS F606W | 0.59 µm | nJy | ||
| HST/ACS F775W | 0.77 µm | nJy | ||
| HST/ACS F814W | 0.80 µm | nJy | ||
| HST/ACS F850LP | 0.90 µm | nJy | ||
| HST/WFC3 F105W | 1.06 µm | nJy | 33.0 8.4 | … |
| HST/WFC3 F125W | 1.25 µm | nJy | 87.5 10.8 | 75.7 9.8 |
| HST/WFC3 F140W | 1.40 µm | nJy | 84.7 6.6 | … |
| HST/WFC3 F160W | 1.54 µm | nJy | 91.3 7.8 | 109.7 10.4 |
| JWST/NIRCam F090W | 0.90 µm | nJy | ||
| JWST/NIRCam F115W | 1.15 µm | nJy | 79.2 4.4 | 64.8 6.2 |
| JWST/NIRCam F150W | 1.50 µm | nJy | … | 93.7 12.9 |
| JWST/NIRCam F182M | 1.85 µm | nJy | 80.0 4.0 | 99.3 6.7 |
| JWST/NIRCam F200W | 1.99 µm | nJy | … | 109.6 11.5 |
| JWST/NIRCam F210M | 2.10 µm | nJy | 117.8 5.9 | 130.2 8.8 |
| JWST/NIRCam F356W | 3.57 µm | nJy | 225.8 11.3 | 443.8 22.2 |
| JWST/NIRCam F444W | 4.40 µm | nJy | 372.4 18.6 | 887.7 44.4 |
| Spitzer/IRAC | 3.6 µm | nJy | 191.0 15.4 | 400.4 13.0 |
| 4.5 µm | nJy | 340.2 17.6 | 592.7 16.5 | |
| 5.8 µm | nJy | 933.7 243.5 | ||
| 8.0 µm | nJy | 351.2 284.8 | 2683.0 289.4 | |
| Spitzer/MIPSb | 24 µm | µJy | ||
| 70 µm | mJy | |||
| Herschel/PACSb | 100 µm | mJy | ||
| 160 µm | mJy | |||
| Herschel/SPIREb | 250 µm | mJy | ||
| 350 µm | mJy | |||
| 500 µm | mJy | |||
| SCUBA-2c | 850 µm | mJy | ||
| NOEMA | 1.3 mm | µJy | ||
| [C ii]158μm | Jy km s-1 | |||
| NIKA-2d | 1.2 mm | µJy | ||
| 2.0 mm | µJy | |||
| VLA 1.5 GHze | 20 cm | uJy |
-
•
Note: We use 1 for uncertainties and 3 upper limits for non-detections. (a) We calculate 3 upper limits based on the mean sensitivity limits achieved in the central 1 arcmin2 area at the average aim point from 2 Ms Chandra Deep Field-North survey (Xue et al., 2016). (b) Sources are not detected, we adopt 3 upper limits from the GOODS-Herschel survey (Elbaz et al., 2011). (c) We adopt the confusion limit for a 3 detection in the central region of GOODS-N from Cowie et al. (2017). (d) We adopt 3 upper limits according to the N2CLS depth from Bing et al. (2023). (e) Calculated based on the rms noise for a 16 resolution in the field center from Owen (2018).
| ID | FluxHβ,broad | FluxHβ,narrow | Flux | |||
|---|---|---|---|---|---|---|
| erg s-1cm-2 | erg s-1cm-2 | erg s-1cm-2 | km s-1 | km s-1 | ||
| ID9094 | ||||||
| ID2756 |
2.2 NOEMA observations
The NOEMA observations of ID9094 and ID2756 were carried out in the summer of 2023 using the PolyFiX correlator (Project ID: S23CY, PIs: D. Elbaz & M. Xiao). Conducted with array configuration D in band 3, the observations targeted the [C ii] emission line, and the 1.3 mm dust continuum, with representative frequencies of 232.052 GHz for ID9094 and 236.576 GHz for ID2756. The total on-source time was 6 hours and 4.5 hours for ID2756 and ID9094, respectively.
All the calibrations and the creation of table were performed using CLIC package from the IRAM GILDAS software333https://www.iram.fr/IRAMFR/GILDAS/ with the support of IRAM astronomers. We then performed further analysis with version 6.5.5 of the Common Astronomy Software Application package (CASA; McMullin et al., 2007).
For the [C ii] emission line, imaging was carried out using the tclean task with 0.4′′ pixels and a channel width of 50 km s-1 with a natural weighting. The natural weighting provides the best point-source sensitivity, which is optimal for source detection. The resulting data cube has a synthesized beam size of full width at half maximum (FWHM) 1838 1472 (9.8 kpc 7.8 kpc in physical scale) and 2859 1854 ( 15.0 kpc 9.7 kpc) with a root mean square (rms) sensitivity of 0.45 and 0.84 mJy beam-1 per channel at the phase center, for ID9094 and ID2756, respectively.
We also created the observed 1.3 mm continuum maps using natural weighting and the same method as for the [C ii] emission line. For ID9094, the rms level is 30.4 Jy beam-1 in the map of 1725 1383 ( 9.2 kpc 7.4 kpc) angular resolution. For ID2756, the rms level is 50.3 Jy beam-1 in the map of 2712 1743 ( 14.3 kpc 9.2 kpc) angular resolution.
2.3 Multi-wavelength observations
Besides the JWST FRESCO and NOEMA observations, the two sources are also covered by a wide array of multi-wavelength observations. In Table 1, we summarize the multi-wavelength dataset for our two sources from X-ray to radio: () X-ray: Chandra 2 Ms (0.5–7.0keV, 0.5–2.0keV, and 2–7keV bands) images in the Chandra Deep Field-North field (CDF-N; Xue et al., 2016); () HST/ACS (F435W, F606W, F775W, F814W, F850LP) and HST/WFC3 (F105W, F125W, F140W, F160W) images from the Hubble Legacy Fields Program (HLF444https://archive.stsci.edu/prepds/hlf/; Whitaker et al., 2019); () JWST/NIRCam (F090W, F115W, F150W, F182M, F200W, F210M, F356W, F444W) from FRESCO (Oesch et al., 2023), CONGRESS (Egami et al., 2023), and JADES (Eisenstein et al., 2023; D’Eugenio et al., 2024). The two sources are not yet covered by any publicly available JWST/MIRI observations; () Spitzer/IRAC from the GREATS program (3.6 µm, 4.5 µm, 5.8 µm, 8 µm; Stefanon et al., 2021, new catalogs based on FRESCO sources are taken from Stefanon et al. in prep; priv. comm.); () Spitzer/MIPS, Herschel/PACS and SPIRE catalog is taken from the GOODS-Herschel survey (Elbaz et al., 2011); () JCMT/SCUBA-2 at 850 µm (Cowie et al., 2017); () NOEMA data from this study (see Sect. 2.2); () NIKA2 Cosmological Legacy Survey at 1.2 mm and 2.0 mm (Bing et al., 2023); and () VLA 1.5 GHz (Owen, 2018).
We note that the photometric measurements from HST and JWST images are derived following the same procedure as outlined in Weibel et al. (2024). Briefly, we use SExtractor (Bertin & Arnouts, 1996) in dual image mode with an inverse-variance weighted stack of the F210M+F444W with FRESCO-only imaging, as the detection image. In this study, fluxes are measured in 016 radius circular apertures in images that are point spread function (PSF)-matched to the F444W band. Total fluxes are derived from the Kron AUTO aperture provided by SExtractor in the F444W band, in addition to a correction based on the encircled energy of the Kron aperture on the F444W PSF. Detailed descriptions of data reduction and photometric measurements are provided in Weibel et al. (2024) and Xiao et al. (2024).
2.4 Our sample: two “Little Red Dots” at
Although there is no uniform definition of LRDs, we identify our two sources as LRDs because they satisfy both of two commonly used selection criteria: 1) an initial criterion – sources with broad Balmer emission lines ( km s-1; Matthee et al., 2024); and 2) a widely used criterion based only on photometric measurements – a combination of “v-shape” SED and compactness selection (e.g., Labbe et al., 2023; Kokorev et al., 2024; Greene et al., 2024).
Fig. 1 presents the JWST/NIRCam images and grism spectra of ID9094 and ID2756. The RGB images show that both sources appear red with point-like morphology. The grism spectra show H and [O iii] emission lines. Both sources exhibit a broad H line. We fit the H line with both narrow and broad Gaussian components, assuming the narrow component has the same width as the [O iii] lines. The best-fit line properties are shown in Table 2. The broad component of H has a FWHM of km s-1 for ID9094 and km s-1 for ID2756, suggesting a possible Type I (broad emission line) AGN. Notably, ID2756 has also been identified as a strong Lyman- emitter, with a considerable equivalent width of 221 Å (Leonova et al. in prep.).
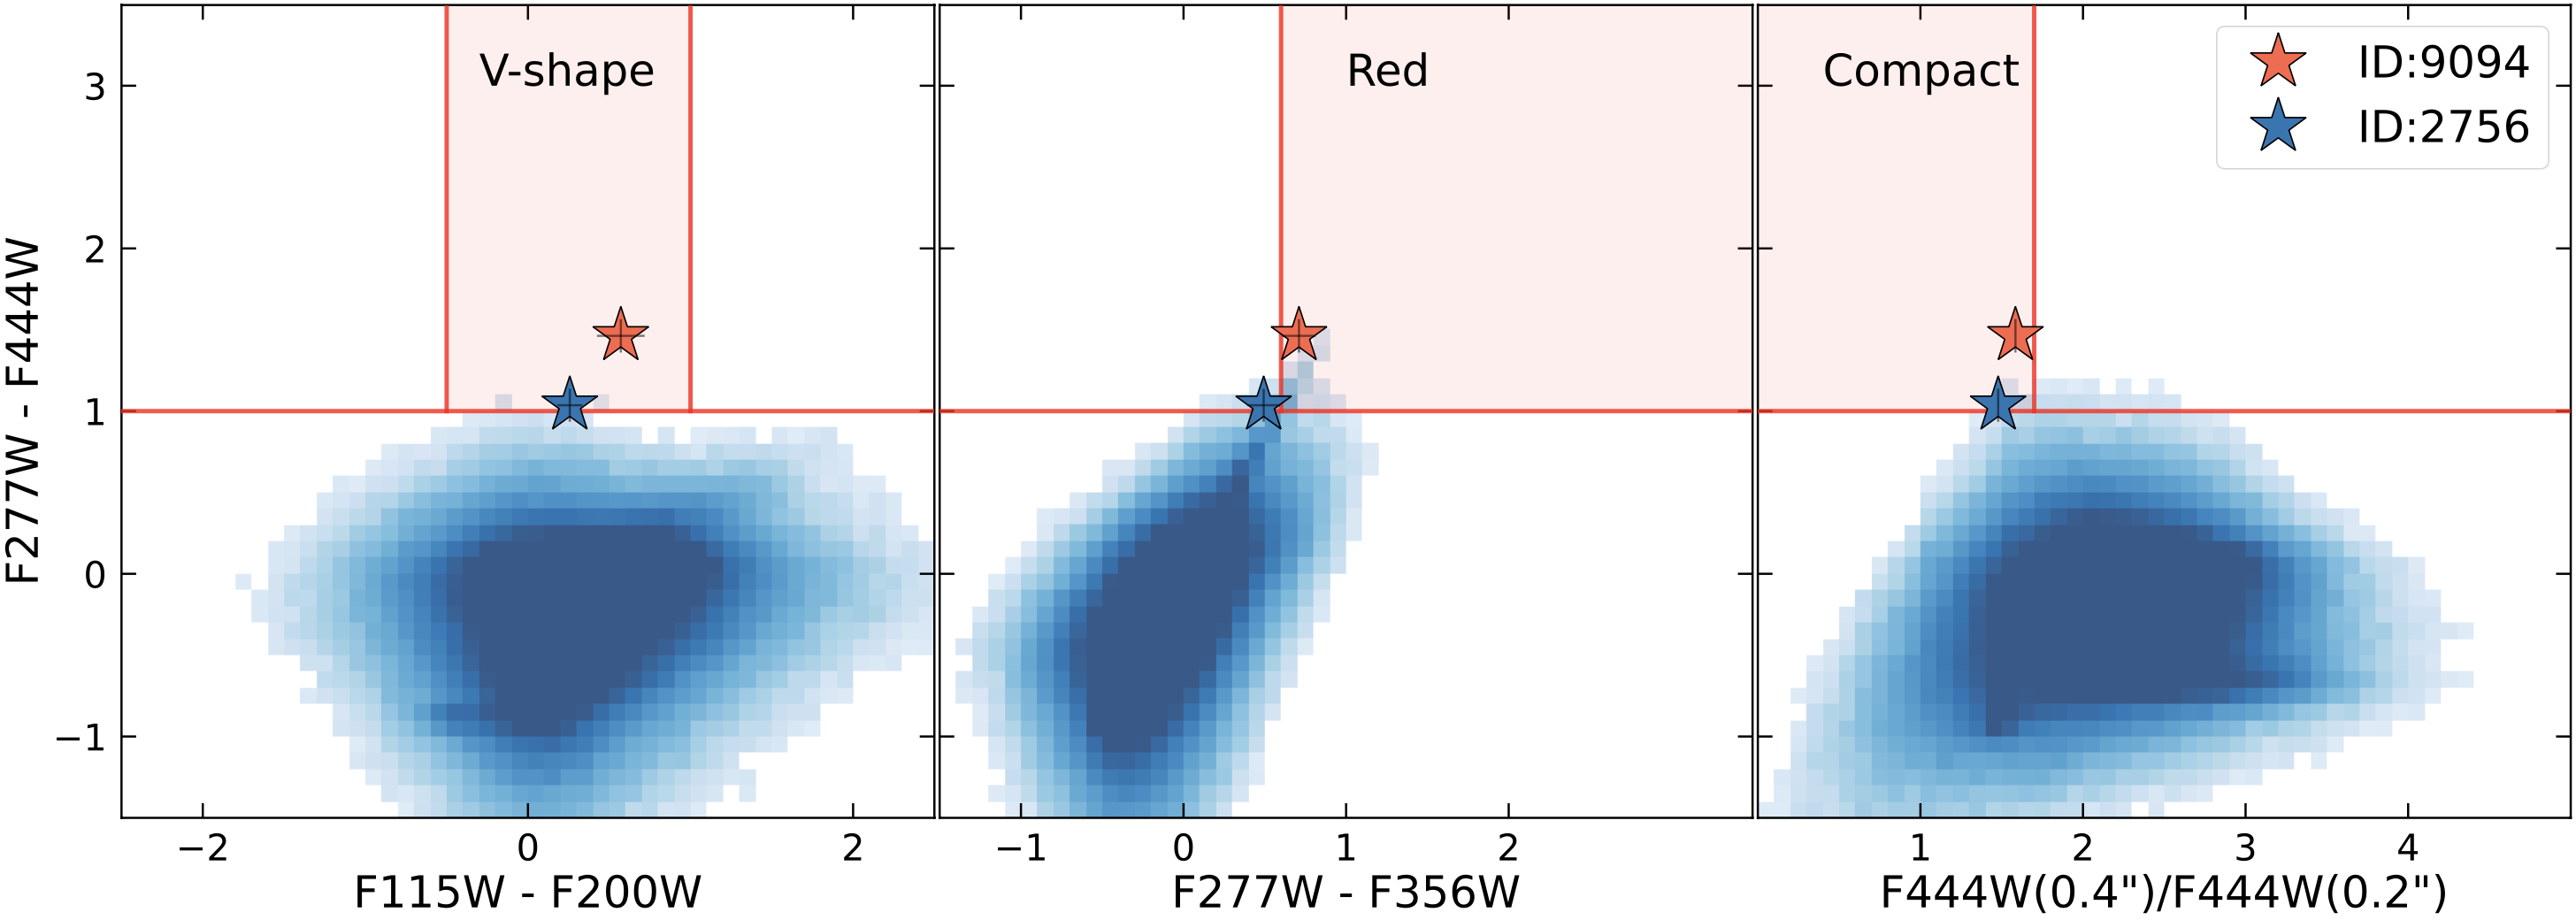
We further compare our two sources to an alternative color and compactness selection criteria for LRDs, designed to identify compact, red objects with “v-shape” SEDs (e.g., Kokorev et al., 2024; Greene et al., 2024):
Both sources are bright in F444W, with magnitudes of mag (ID9094) and mag (ID2756), consistent with the LRD selection. Since ID2756 lacks observations in F277W and F200W, while ID9094 is missing F277W, the corresponding fluxes used here are derived from the best-fit SED and the 16th–84th percentile range (as shown later in Fig. 4). The detailed comparison is shown in Fig. 2. ID9094 lies within the red region, perfectly matching the LRD selection. ID2756 exhibits a ”v-shaped” color and compact morphology, aligning with the LRD classification. Its F277W – F356W color is slightly bluer than the selection threshold but still within the 1 uncertainty. We therefore classify both sources as LRDs. Compared to the majority of sources from various JWST blank legacy fields (blue-shaded region in Fig. 2), obtained from the DAWN JWST Archive (DJA555https://dawn-cph.github.io/dja/imaging/v7/; Valentino et al., 2023), these two LRDs stand out as particularly exceptional, exhibiting redder colors and more compact morphologies.
Altogether, we find that both sources are consistent with standard criteria for LRDs based on their morphology and “v-shape” SED. In addition, both sources show the broad H line, making them strong Type I AGN candidates.
3 Results
3.1 Non-detections in both [C ii] and 1.3 mm of two LRDs
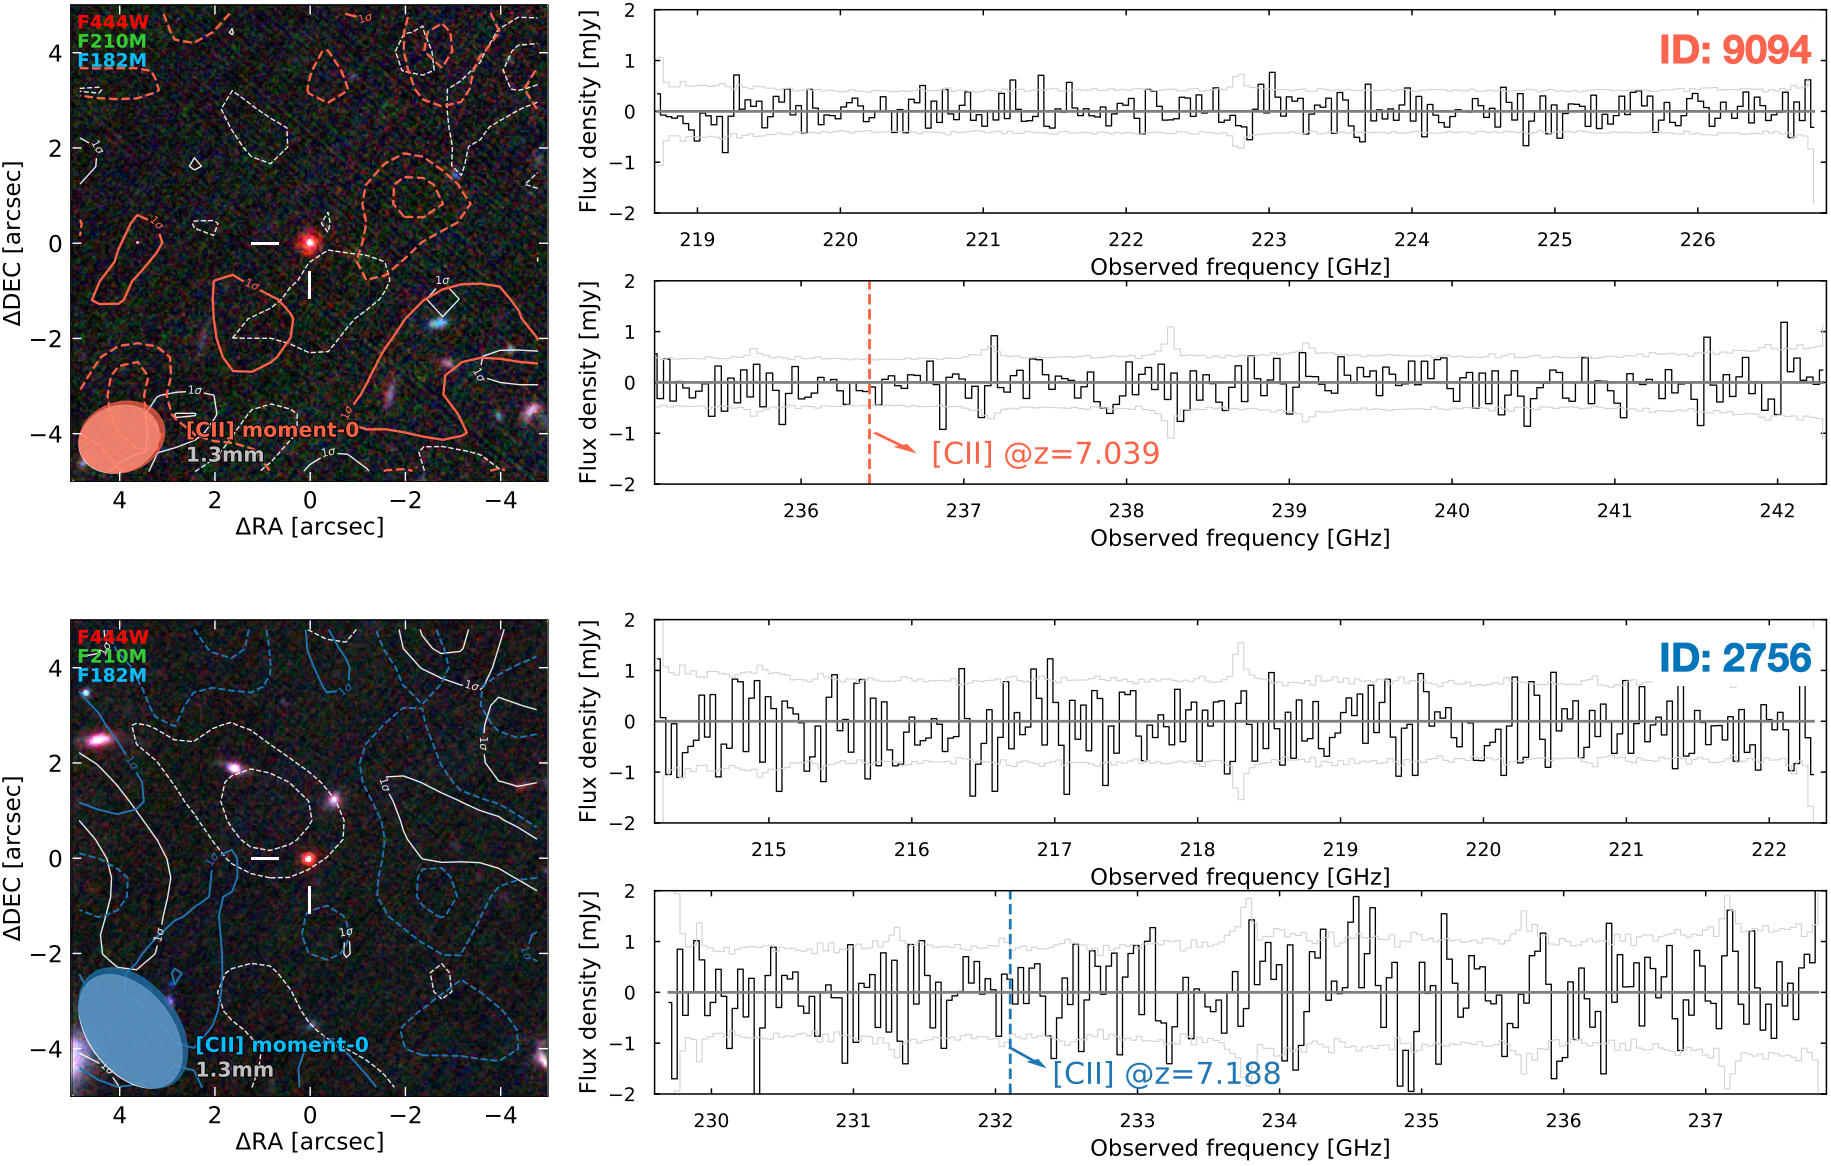
We conduct NOEMA observations targeting the [C ii] emission line and 1.3 mm continuum, generating data cubes and 1.3 mm continuum maps (see Sect. 2.2). Using the data cube, we extract spectra at the positions of our sources with an aperture consistent with the NOEMA beam size. The resulting spectra, shown in Fig. 3, reveal no significant signal at the expected [C ii] frequency (). Assuming a [C ii] line width of 250 km s-1 – a typical value for high-redshift galaxies (Béthermin et al., 2020; Endsley et al., 2022) – we construct the velocity-integrated intensity map (moment-0). Fig. 3 overlays the contours from the [C ii] moment-0 and 1.3 mm maps on the JWST RGB image, showing no detections () at the source positions and in the surrounding regions. We therefore conclude that neither the [C ii] emission line nor the 1.3 mm dust continuum emission are detected for the two LRDs in the current NOEMA data.
We then determine 3 upper limits for both [C ii] and dust continuum. Using the rms of the 1.3 mm map (see Sect. 2.2) and assuming our sources are not resolved, we derive 3 upper limits of 91 Jy and 151 Jy for ID9094 and ID2756, respectively. In addition, the 3 upper limits for [C ii] are calculated as three times the pixel-by-pixel rms of the moment-0 map, which gives upper limits of 0.157 Jy km s-1 and 0.310 Jy km s-1 for ID9094 and ID2756, respectively. The corresponding 3 upper limits on the [C ii] emission-line luminosity are log for ID9094 and log for ID2756. Using , we further calculate the 3 upper limits on the molecular gas mass (Zanella et al., 2018) to be log for ID9094 and log for ID2756.
Intriguingly, when requesting the NOEMA observations, we assumed these two galaxies to be DSFGs. Given their stellar masses from Xiao et al. (2024), we estimated their total star formation rates (SFRtot) assuming that they lie on the star-forming main sequence (SFMS; Schreiber et al., 2015) and predicted their expected [C ii] fluxes using the –SFRtot relation for SFGs (Schaerer et al., 2020). Similarly, we predicted their 1.3 mm continuum fluxes by assuming an infrared SED shape consistent with typical dust-obscured galaxies (optically dark/faint galaxies; Xiao et al., 2023). Given the depth of our NOEMA observations, we expected ID9094 to be detected at in [C ii] and in the 1.3 mm continuum, while ID2756 should be detected in [C ii] at . However, the complete absence of [C ii] and 1.3 mm emission suggests that these two LRDs are not the dusty SFGs initially assumed. This result aligns with our findings in Sect. 2.4, where both sources exhibit a broad H emission line, being Type-I AGN candidates.
3.2 The hints of AGNs in two LRDs from FIR non-detections
In this section, we utilize the 3 upper limits on the [C ii] emission line and the 1.3 mm continuum to investigate the possible presence of AGN activity in the LRDs. While both sources have already been identified as strong Type-I AGN candidates based on their broad H emission lines, our primary goal here is to investigate whether the FIR non-detections can effectively rule out the DSFG scenario for LRDs, independently of spectral information. Here, we focus primarily on ID9094, which benefits from deeper NOEMA observations compared to ID2756, allowing for more robust constraints. We assess the AGN contribution through two independent approaches: 1) UV-to-FIR spectral energy distribution (SED) fitting analysis and 2) the –SFRtot empirical relation.
3.2.1 SED fitting analysis
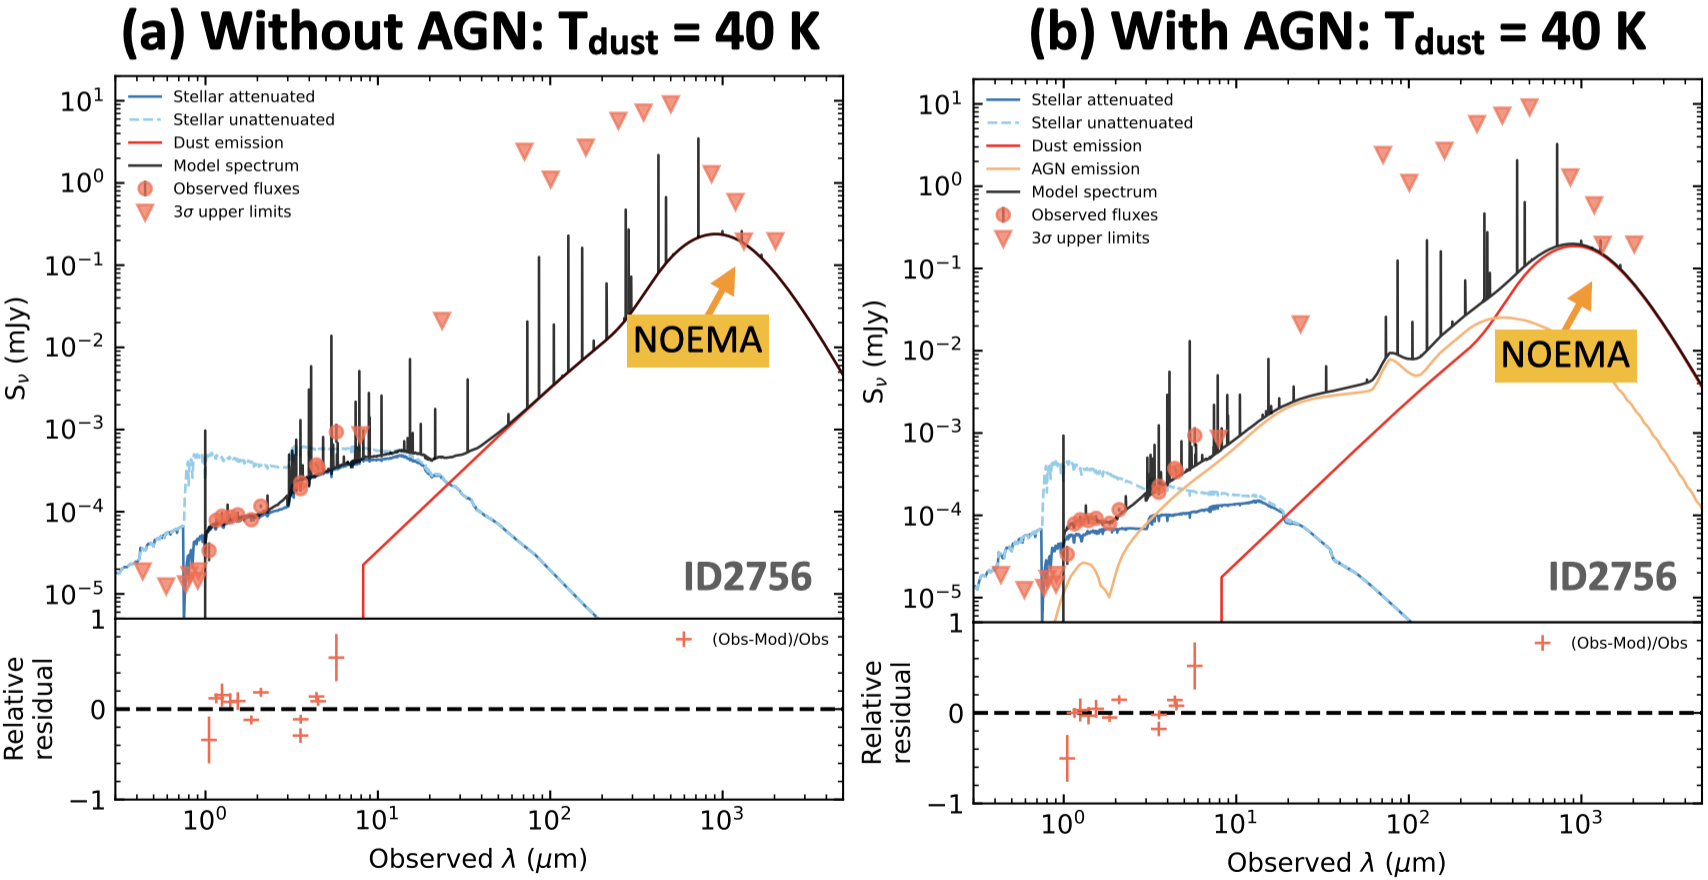
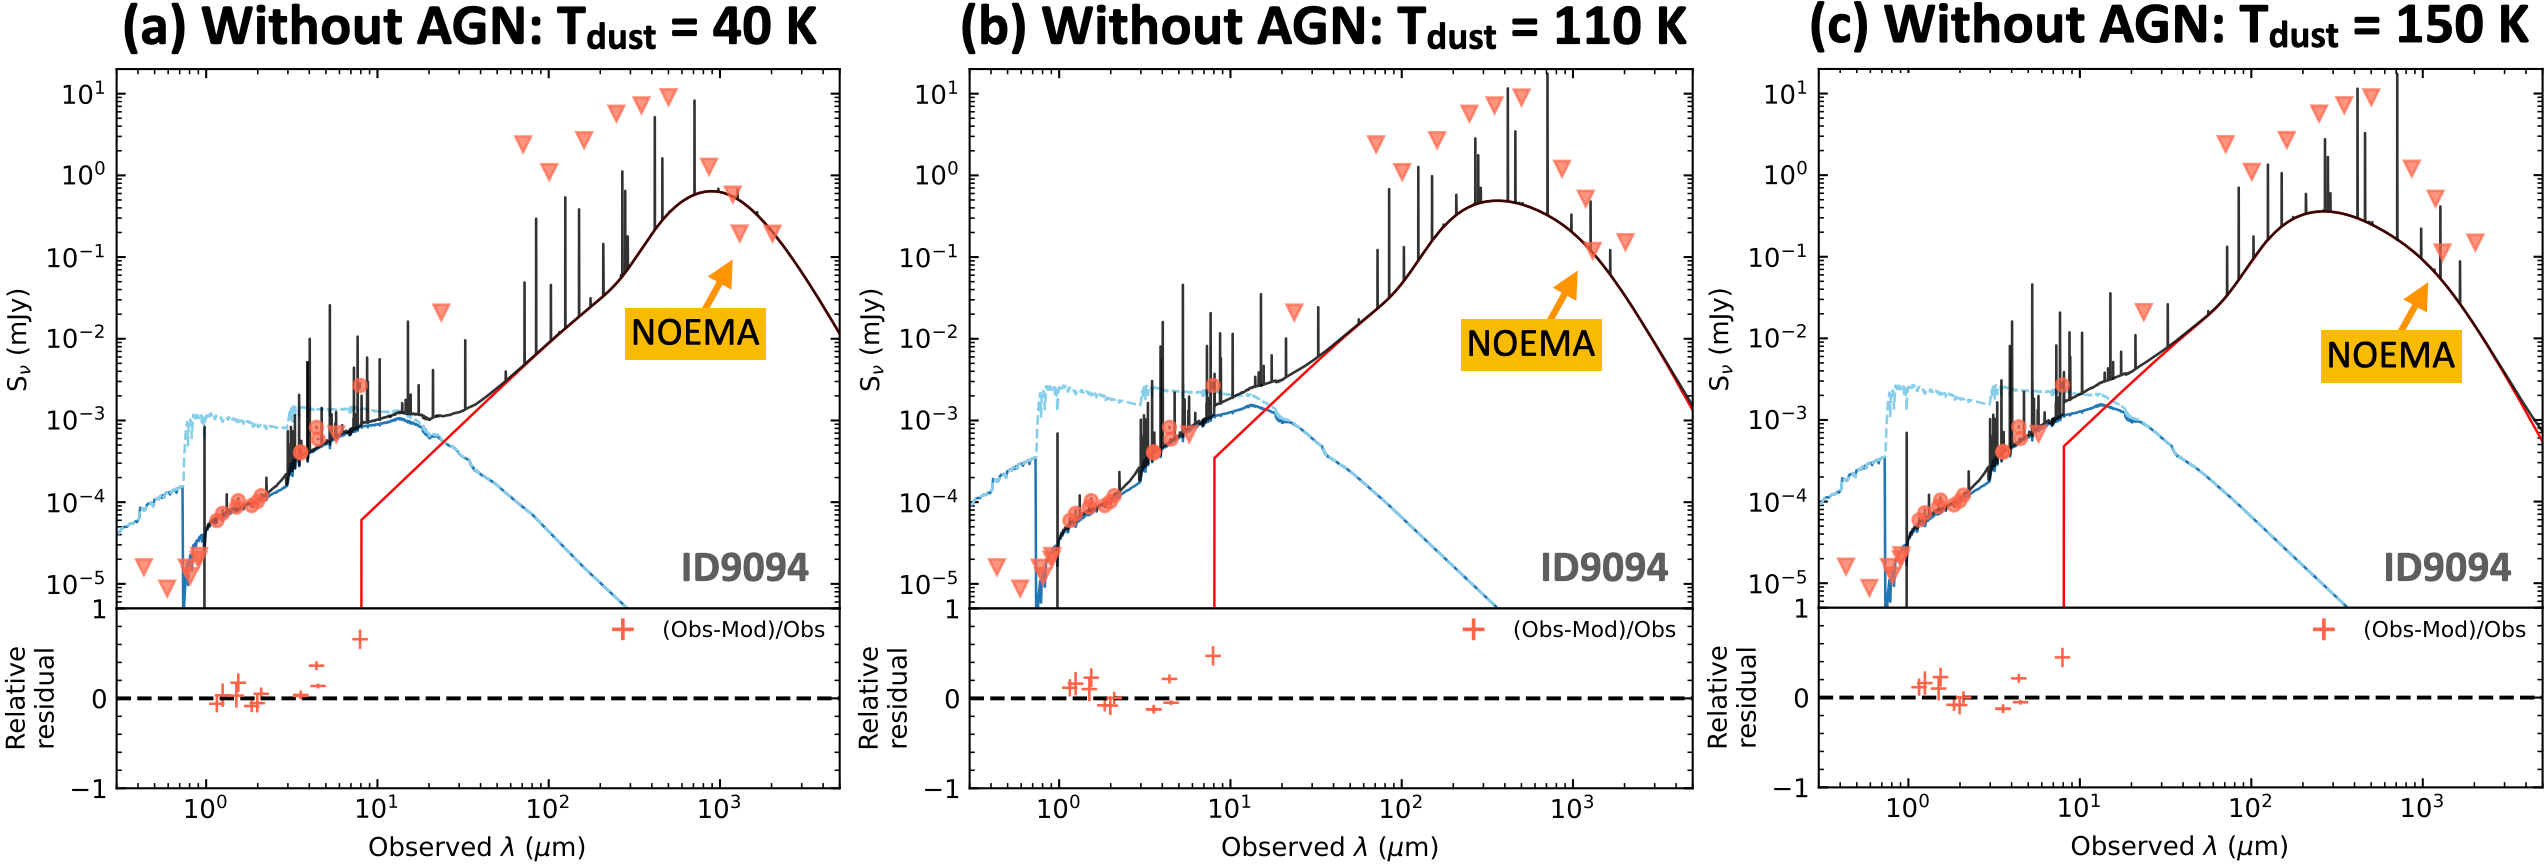
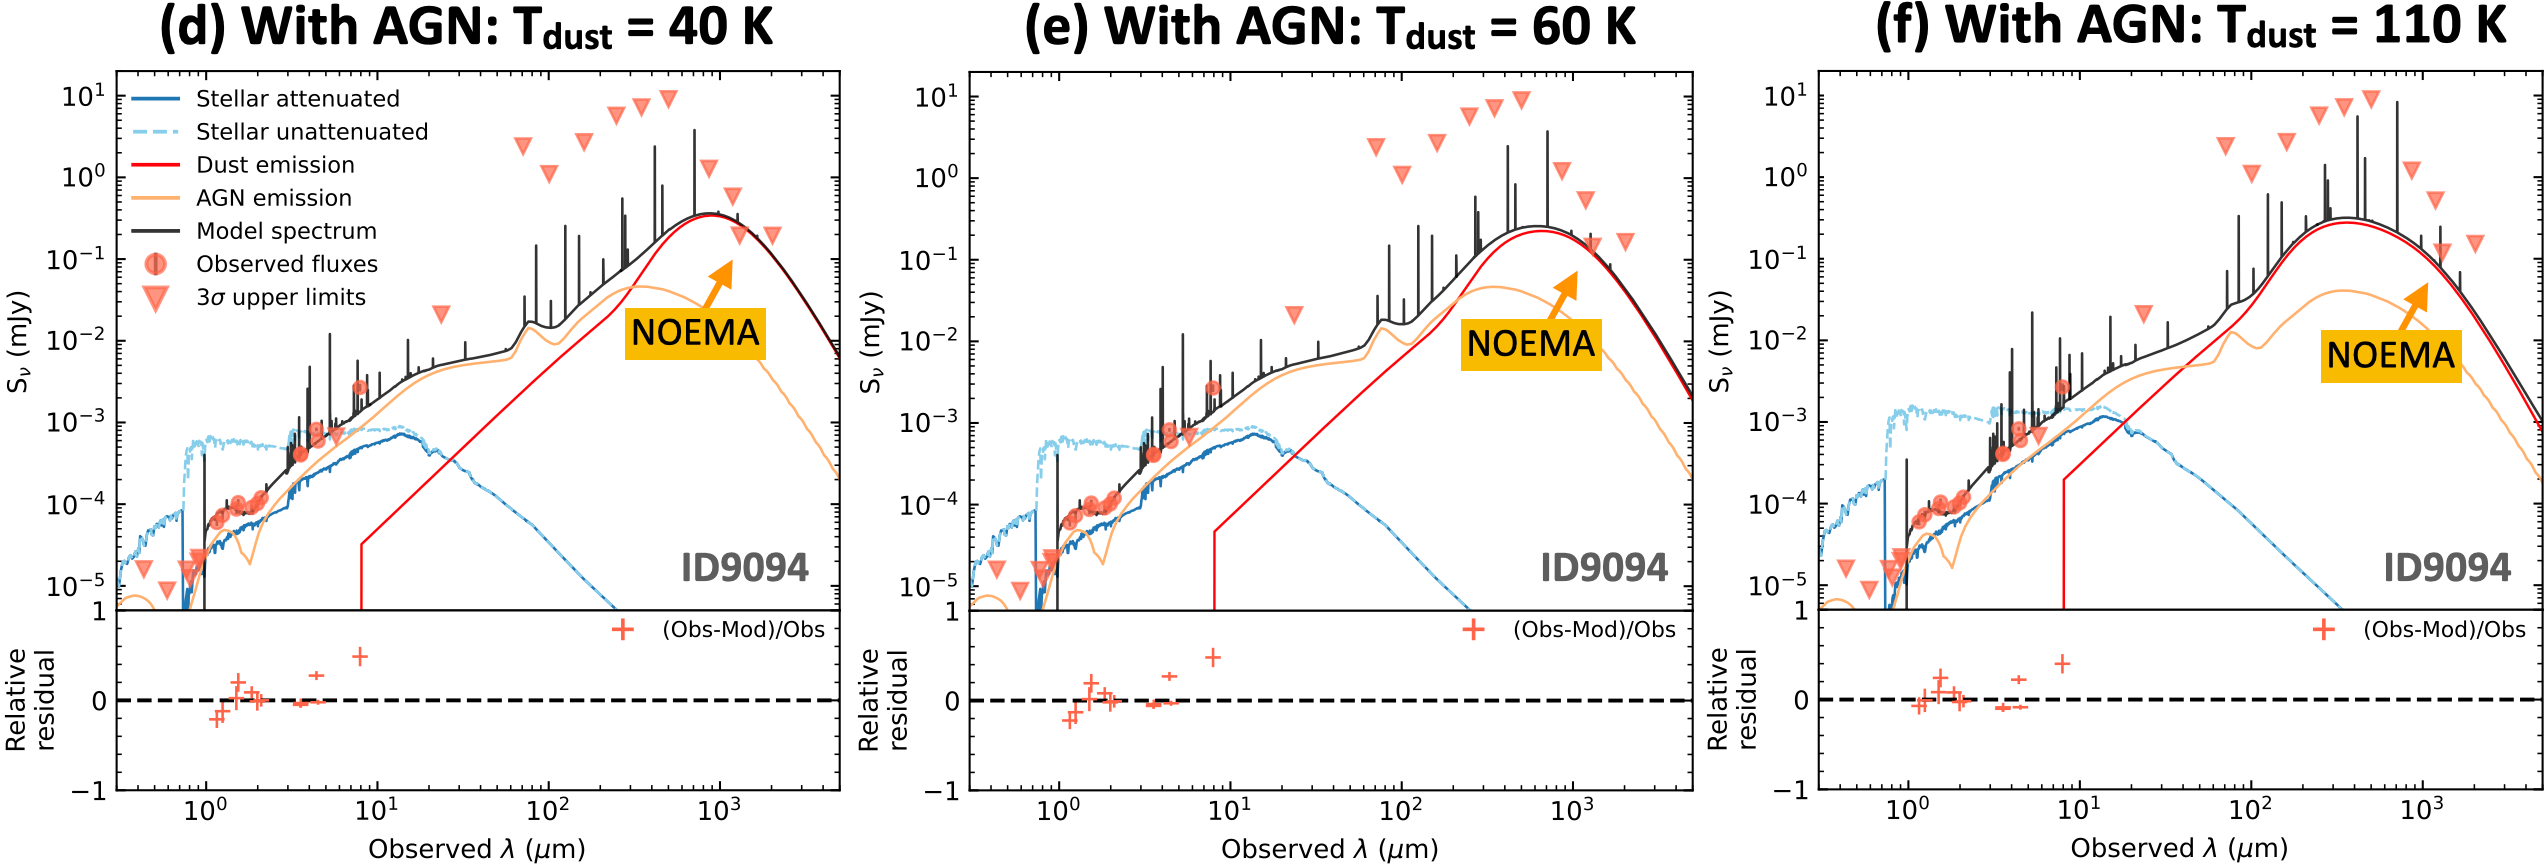
We perform a UV-to-FIR SED fitting analysis using CIGALE (Boquien et al., 2019), which is based on an energy balance principle, fixing the redshift to . We assume a constant star formation history (SFH) and adopt Bruzual & Charlot (2003) stellar population models with the Calzetti et al. (2000) dust attenuation law. We adopt a broad metallicity range of 0.004 to 0.02, dust attenuation to the rest-frame V band () values from 0 to 6 magnitudes, and ionization parameters log of -2.0. The AGN component is modeled using the Fritz et al. (2006) template, with the AGN fraction (), i.e., the contribution of the AGN to the total IR luminosity, ranging from 0.01 to 0.8. The angle between the equatorial axis and the viewing angle at the line of sight () ranges from 40 to 90. With a fixed open angle of the AGN torus at 100 degrees, this range of refers to Type I AGN. We note that recent MIR observations (Wang et al., 2024a; Williams et al., 2024; Barro et al., 2024) suggest a lack of hot torus dust emission in LRDs, which may deviate from the Fritz et al. (2006) template adopted. However, with the absence of deep MIR observations, we anticipate little change in the quality of SED fitting on our sample by only changing the AGN torus emission in the templates. On the contrary, the inclusion of continuum from accretion disk by limiting to Type I AGN is critical, as we robustly detected broad lines in H.
Given that we only have upper limits in the FIR, we adopt a simple FIR dust model from Casey (2012), using the default dust emissivity index () and MIR power-law slope (). During the fitting process, we find that when the dust temperature () is allowed to vary across a defined range, the best-fit is strongly influenced by the upper boundary of the input range. This effect arises due to the absence of deep MIR data, which prevents us from constraining the maximum . Consequently, we cannot determine a precise best-fit value for , but the deep NOEMA data allow us to place a lower limit.
To refine our constraints, we adopt an optimized fitting approach that allows us to constrain the minimum allowed using the NOEMA 1.3 mm 3 upper limits. In this approach, we fix during the fitting and perform multiple fits with different values, ranging from 30 K to 150 K. In addition, we also correct the effect of the cosmic microwave background (CMB) as an observing background on photometry, following da Cunha et al. (2013). The CMB has the effect of raising the apparent dust temperature with increasing redshift, as the CMB temperature scales with redshift and provides an additional background source of radiation for dust heating. We assume , consistent with previous studies for galaxies (Sommovigo et al., 2022). In this way, we derive the intrinsic FIR photometry starting from MIPS 70m, which is used for SED fitting. The best-fit SEDs, with and without AGN components considered, are presented in Fig. 4.
For ID9094, without including an AGN component (Fig.4-), we present three representative examples of best-fit SEDs with () K, () K, and () K. These correspond to results that the predicted flux density at 1.3 mm exceeds, matches, and falls below the observed 3 upper limits, respectively, under the energy balance assumption of CIGALE. At K – a typical value for star-forming UV-bright galaxies in the REBELS survey at (Sommovigo et al., 2022) – the predicted 1.3 mm flux exceeds the observed 3 upper limit by nearly a factor of three. This discrepancy suggests that, with our current NOEMA observations, we should have detected the source at a significance level of , which is clearly not the case. As increases, the peak of the FIR SED moves towards the shorter wavelength and the fit improves. At K (Fig.4-), the predicted 1.3 mm flux aligns with the observed 3 upper limit. However, given that the actual signal-to-noise ratio at 1.3 mm is well below 3, this implies that the real must be greater than 110 K.
Therefore, without including an AGN component, we obtain a lower limit of K. At fixed K, as in Table 3, the best-fit IR luminosity is , yr-1 (we use this for the analysis in Sect. 3.2.2), and stellar mass of . Remarkably, even this lower limit is significantly higher than the typical K observed in REBELS galaxies at similar redshifts (Sommovigo et al., 2022). Similar findings have been reported in studies of 675 LRDs at , regardless of heating mechanism, whether AGN or star formation, where an average luminosity-weighted dust temperature of K is reported (Casey et al., 2024). Such an extreme dust temperature is challenging to explain solely through heating by star formation. In typical star-forming galaxies, the dust temperature is primarily driven by the ultraviolet radiation field of young stars, which is insufficient to reach the high values observed here.
Based on the best-fit without AGN at fixed K, we derived the dust emitting region size is pc, based on a black-body assumption. A crucial parameter to consider is the stellar surface density, given by pc-2 (similar findings are reported in, e.g., Baggen et al., 2024). This is about one order of magnitude higher than the densest systems in the local universe (Hopkins et al., 2010) and SFGs at observed by JWST (Morishita et al., 2024; Schaerer et al., 2024), highlighting a general issue for LRD models that rely solely on stellar components. Expanding the star formation region would reduce , but it would also decrease below the observed values (e.g., De Rossi et al., 2018), leading to an inconsistency with our findings. All these results suggest that additional heating mechanisms, such as AGN-driven radiation, must play a significant role in explaining the elevated dust temperatures of ID9094.
| ID9094 | fixed minimum [K] | log ] | SFR [yr-1] | [] | |
|---|---|---|---|---|---|
| Without AGN | 110 | ||||
| With AGN | 60 |
When the AGN component is included in the SED fitting (Fig. 4-), the results become more physically plausible. Similar to Fig.4-, we also show three representative examples of best-fit SEDs with () K, () K, and () K. These correspond to results that the predicted flux density at 1.3 mm exceeds, matches, and falls below the observed 3 upper limits, respectively. The best-fit results indicate the lower limit of K, which is consistent with AGN and/or quasar host galaxies at ( K; e.g., Walter et al., 2022; Tsukui et al., 2023; Tripodi et al., 2023; Decarli et al., 2023; Meyer et al., 2025). At fixed K, the AGN fraction is , indicating a scenario where both AGN and star formation contribute significantly to the FIR emission. The corresponding best-fit , yr-1, and (see Table 3).
For ID2756, we perform SED fitting using the same strategy as for ID9094 (see Appendix A). However, the current 1.3 mm observations for ID2756 (rms level 50.3 Jy beam-1) are not sufficiently deep to constrain the SED effectively. The lack of sensitivity prevents us from distinguishing between the DSFG and AGN scenarios based solely on the SED fitting results. To achieve meaningful constraints, deeper FIR/submillimeter observations are required. Specifically, observations at least as deep as for ID9094 (rms level 30.4 Jy beam-1) are necessary to provide tighter limits on the 1.3 mm flux density and help refine the SED fitting.
In summary, our analysis highlights the role of deep FIR observations in distinguishing between DSFG and AGN-dominated scenarios for LRDs. For ID9094, the FIR SED fitting indicates that the best-fit results, including the high values, are inconsistent with typical SFGs and suggest the presence of an AGN. For ID2756, deeper FIR data are needed to drive comparable constraints. Despite the non-detection in the FIR, the energy balance imposed by the deep NOEMA upper limits provides meaningful constraints on the shape of the FIR SED. These results demonstrate the importance of FIR data in studying the nature of LRDs and ruling out purely star formation-driven scenarios.
3.2.2 –SFRtot relation
In this section, we compare the locations of our LRDs with the well-established –SFRtot scaling relation to investigate their alignment with expectations for star-forming galaxies or the potential influence of AGN activity. The –SFRtot relation has been shown to hold across a wide range of redshifts, with no significant evolution observed up to (e.g., Lagache et al., 2018; Schaerer et al., 2020; Carniani et al., 2020; Pallottini et al., 2022). Additionally, studies indicate that the relation is consistent for both AGN-hosting galaxies and typical star-forming galaxies, suggesting that the presence of AGN does not significantly alter the global –SFRtot relation (e.g., Herrera-Camus et al., 2018).
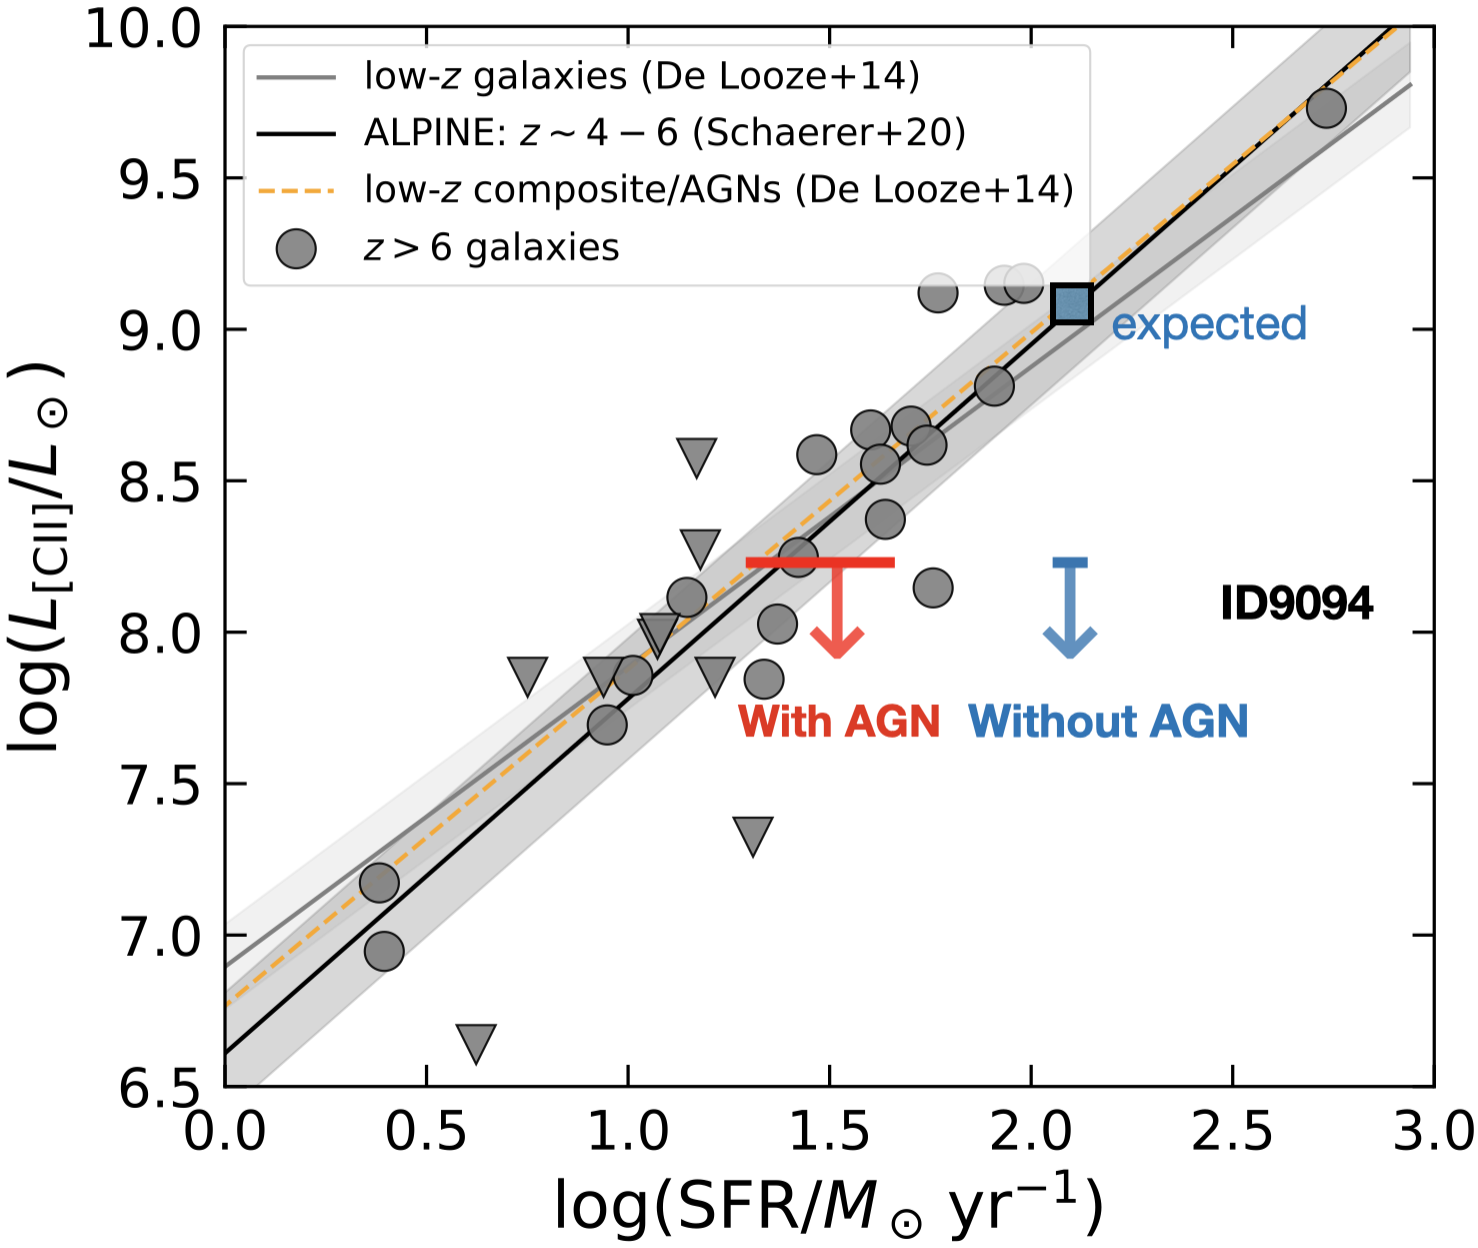
For ID9094, when no AGN component is included in the SED fitting, the SFR derived corresponds to K. Combining this SFR with the 3 upper limits of the (log; Sect. 3.1) places ID9094 significantly below the –SFRtot relation, with a deviation of approximately dex (see Fig. 5). This large offset suggests that the observed properties of ID9094 cannot be explained solely by typical star formation processes in dusty star-forming galaxies. In contrast, when including an AGN component in the SED fitting, the resulting SFR with the K template is about four times lower than that returned by SED fitting without an AGN component. In this case, ID9094 lies within the scatter of the –SFRtot relation, indicating consistency with the scaling relation. This result strongly favors the AGN scenario for ID9094, providing the second hint of an AGN scenario.
For ID2756, its 3 upper limits of the [C ii] emission line luminosity is log (Sect. 3.1). Due to the shallower NOEMA observations, we cannot constrain SFR well with and without AGN components in the SED (as described in Sect. 3.2.1). Therefore, we are unable to place meaningful constraints on its position in the versus SFRtot plane without deeper FIR observations.
In summary, the –SFRtot relation analysis provides a second hint in this work of AGN activity in the LRDs, complementing the first hint derived from the SED fitting analysis. These two independent methods, together with the broad H emission, consistently support the presence of an AGN in the two LRDs of our study, highlighting the critical role AGN-driven processes play in shaping their observed properties.
4 Impact of LRDs on our understanding of DSFGs
As introduced earlier, the two LRDs analyzed in this study were initially selected as the most massive DSFG candidates at in the JWST FRESCO GOODS-North field (Xiao et al., 2024). This misclassification arose due to the overlap in selection criteria between LRDs and DSFGs, particularly for optical/NIR-selected DSFGs – often referred to as optically dark/faint galaxies (also known as HST-dark galaxies or H-dropouts; e.g., Wang et al., 2019; Alcalde Pampliega et al., 2019; Williams et al., 2019; Xiao et al., 2023; Gómez-Guijarro et al., 2022; Barrufet et al., 2023; Akins et al., 2023; Pérez-González et al., 2023; Barro et al., 2024). Typically, DSFGs identified in optical/NIR observations are selected based on their red colors and rest-frame optical faintness, as these characteristics correlate strongly with dust attenuation at similar redshifts (e.g., Wang et al., 2016; Xiao et al., 2023). Additionally, the optical faintness criterion helps exclude quiescent galaxies, which are generally optically bright. For instance, DSFGs are often selected using a color cut such as F150W–F444W mag and F150W mag, though specific band choices and thresholds slightly vary across studies.
With the increasing availability of JWST spectroscopic data, emission-line detections have become an additional criterion for DSFG selection (e.g., Xiao et al., 2024; Barrufet et al., 2025). In Xiao et al. (2024), DSFG candidates were selected based on their red color (F182M F444W ¿ 1.5 mag) and strong emission lines (e.g., H+[NII]+[SII] lines or [O iii]+H lines). This approach also allows for the identification of LRDs among DSFG candidates. Among 26 DSFG candidates with detected H lines (), seven () were found to be LRDs, exhibiting broad H emission lines (see Matthee et al., 2024).
Over the past decade, numerous studies have shown that optically-dark/faint galaxies tend to have high stellar masses and may dominate the massive end of the stellar mass function (e.g., Wang et al., 2019; Gottumukkala et al., 2024). Additionally, these galaxies could contribute significantly to the cosmic star formation rate density (SFRD) at , with contributions of of the SFRD, depending on the methodology (see a direct comparison in Xiao et al. 2023; e.g., Wang et al. 2019; Williams et al. 2019; Gruppioni et al. 2020; Fudamoto et al. 2021; Talia et al. 2021; Enia et al. 2022; Shu et al. 2022; Barrufet et al. 2023; van der Vlugt et al. 2023). Notably, while different studies employ varying selection criteria for optically dark/faint galaxies, some adopt stricter definitions, requiring FIR/submm (e.g., ALMA/NOEMA) detection and/or non-detection in HST. Given that LRDs have been found to 1) lack FIR/submm detections (see also e.g., Labbe et al., 2023; Williams et al., 2024), 2) exhibit a characteristic “v-shaped” SED (indicating detection in HST), they are unlikely to contaminate the DSFG sample in these studies.
On a global scale, these findings suggest that LRD contamination should not significantly bias SFRD estimates derived from DSFG samples. However, their presence may still impact number density estimates of optical/NIR-selected DSFG populations, particularly when broader color-based selection criteria are used. A more statistical study is needed to determine how much the number density estimates of DSFG populations are affected by LRDs. These results highlight the importance of refining DSFG selection methods to minimize potential contamination from AGN-dominated LRDs, ensuring a more accurate census of dust-obscured star formation in the early Universe.
5 Conclusions
In this paper, we present a study of two LRDs, ID9094 and ID2756, recently discovered in the JWST FRESCO GOODS-North field at . These sources, characterized by their compact, red morphology and ”v-shaped” SEDs, exhibit broad H emission lines, suggesting them as AGN candidates. Using NOEMA observations targeting the [C ii] emission line, and the 1.3 mm dust continuum, we obtain the following key results:
-
•
Both sources are undetected in the [C ii] and 1.3 mm continuum. For ID9094, the [C ii] and 1.3 mm upper limits are far below expectations for a typical SFG, where it would have been detected at in [C ii] and at 1.3 mm. For ID2756, the expected [C ii] detection at is also not observed.
-
•
Benefiting from the 1.3 mm upper limits, we conduct UV-to-FIR SED fitting, which provides the first hint of an AGN scenario in this work. For ID9094, we find that without an AGN component, the SED fitting suggests an unreasonably high dust temperature ( K), significantly exceeding typical values for SFGs at similar redshifts. Including an AGN component, however, yields more reasonable dust temperatures ( K), supporting the presence of AGN activity. The analysis of ID2756 is less conclusive due to the shallower NOEMA observations, underscoring the need for deeper FIR/submillimeter data.
-
•
Leveraging the [C ii] upper limits, we compare the sources to the –SFRtot relation, providing the second hint of an AGN scenario in this work. For ID9094, its [C ii] upper limit places it significantly below the scaling relation when no AGN component is included, but consistent with the relation when an AGN contribution is considered. This provides further evidence for the AGN scenario in ID9094, with implications for ID2756 pending further observations.
These results underscore the power of FIR observations, combined with short-wavelength photometry, in constraining the nature of LRDs, especially in the absence of spectroscopic data. For ID9094, the FIR constraints strongly support an AGN-dominated scenario, while the current data for ID2756 remain inconclusive, highlighting the need for deeper FIR/submillimeter observations. More broadly, this study demonstrates the critical role of FIR data in resolving the ambiguous classification of LRDs, which are often difficult to distinguish using optical or near-infrared photometry alone. Future deeper FIR/submillimeter campaigns, along with high-resolution spectroscopy and multi-wavelength data, will be essential to fully understand the physical properties of these LRDs and their role in early galaxy evolution.
Acknowledgements.
This work is based on observations carried out under project number S23CY with the IRAM NOEMA Interferometer. IRAM is supported by INSU/CNRS (France), MPG (Germany) and IGN (Spain). This work is based on observations made with the NASA/ESA/CSA James Webb Space Telescope. The data were obtained from the Mikulski Archive for Space Telescopes at the Space Telescope Science Institute, which is operated by the Association of Universities for Research in Astronomy, Inc., under NASA contract NAS 5-03127 for JWST. These observations are associated with programs # 1895 and #4762. Support for this work was provided by NASA through grants JWST-GO-01895 and JWST-GO-04762 awarded by the Space Telescope Science Institute, which is operated by the Association of Universities for Research in Astronomy, Inc., under NASA contract NAS 5-26555. This work has received funding from the Swiss State Secretariat for Education, Research and Innovation (SERI) under contract number MB22.00072, as well as from the Swiss National Science Foundation (SNSF) through project grant 200020_207349. The Cosmic Dawn Center (DAWN) is funded by the Danish National Research Foundation under grant DNRF140. This work is partially supported from the National Natural Science Foundation of China (12073003, 11721303, 11991052), and the China Manned Space Project (CMS-CSST-2021-A04 and CMS-CSST-2021-A06). Y.F. is supported by JSPS KAKENHI Grant Numbers JP22K21349 and JP23K13149. M.V. gratefully acknowledges financial support from the Independent Research Fund Denmark via grant numbers DFF 8021-00130 and 3103-00146 and from the Carlsberg Foundation via grant CF23-0417. VK acknowledges support from the University of Texas at Austin Cosmic Frontier Center. S.F. acknowledges support from NASA through the NASA Hubble Fellowship grant HST-HF2-51505.001-A awarded by the Space Telescope Science Institute, which is operated by the Association of Universities for Research in Astronomy, Incorporated, under NASA contract NAS5-26555. Support for this work for RPN was provided by NASA through the NASA Hubble Fellowship grant HST-HF2-51515.001-A awarded by the Space Telescope Science Institute, which is operated by the Association of Universities for Research in Astronomy, Incorporated, under NASA contract NAS5-26555.References
- Akins et al. (2023) Akins, H. B., Casey, C. M., Allen, N., et al. 2023, ApJ, 956, 61
- Akins et al. (2025) Akins, H. B., Casey, C. M., Berg, D. A., et al. 2025, ApJ, 980, L29
- Akins et al. (2024) Akins, H. B., Casey, C. M., Lambrides, E., et al. 2024, arXiv e-prints, arXiv:2406.10341
- Alcalde Pampliega et al. (2019) Alcalde Pampliega, B., Pérez-González, P. G., Barro, G., et al. 2019, ApJ, 876, 135
- Ananna et al. (2024) Ananna, T. T., Bogdán, Á., Kovács, O. E., Natarajan, P., & Hickox, R. C. 2024, ApJ, 969, L18
- Baggen et al. (2024) Baggen, J. F. W., van Dokkum, P., Brammer, G., et al. 2024, ApJ, 977, L13
- Barro et al. (2024) Barro, G., Pérez-González, P. G., Kocevski, D. D., et al. 2024, ApJ, 963, 128
- Barrufet et al. (2025) Barrufet, L., Oesch, P. A., Marques-Chaves, R., et al. 2025, MNRAS[arXiv:2404.08052]
- Barrufet et al. (2023) Barrufet, L., Oesch, P. A., Weibel, A., et al. 2023, MNRAS, 522, 449
- Bertin & Arnouts (1996) Bertin, E. & Arnouts, S. 1996, A&AS, 117, 393
- Béthermin et al. (2020) Béthermin, M., Fudamoto, Y., Ginolfi, M., et al. 2020, A&A, 643, A2
- Bing et al. (2023) Bing, L., Béthermin, M., Lagache, G., et al. 2023, A&A, 677, A66
- Boquien et al. (2019) Boquien, M., Burgarella, D., Roehlly, Y., et al. 2019, A&A, 622, A103
- Bruzual & Charlot (2003) Bruzual, G. & Charlot, S. 2003, MNRAS, 344, 1000
- Calzetti et al. (2000) Calzetti, D., Armus, L., Bohlin, R. C., et al. 2000, ApJ, 533, 682
- Carniani et al. (2020) Carniani, S., Ferrara, A., Maiolino, R., et al. 2020, MNRAS, 499, 5136
- Casey (2012) Casey, C. M. 2012, MNRAS, 425, 3094
- Casey et al. (2024) Casey, C. M., Akins, H. B., Shuntov, M., et al. 2024, ApJ, 965, 98
- Chabrier (2003) Chabrier, G. 2003, PASP, 115, 763
- Cowie et al. (2017) Cowie, L. L., Barger, A. J., Hsu, L. Y., et al. 2017, ApJ, 837, 139
- da Cunha et al. (2013) da Cunha, E., Groves, B., Walter, F., et al. 2013, ApJ, 766, 13
- De Looze et al. (2014) De Looze, I., Cormier, D., Lebouteiller, V., et al. 2014, A&A, 568, A62
- De Rossi et al. (2018) De Rossi, M. E., Rieke, G. H., Shivaei, I., Bromm, V., & Lyu, J. 2018, ApJ, 869, 4
- Decarli et al. (2023) Decarli, R., Pensabene, A., Diaz-Santos, T., et al. 2023, A&A, 673, A157
- D’Eugenio et al. (2024) D’Eugenio, F., Cameron, A. J., Scholtz, J., et al. 2024, arXiv e-prints, arXiv:2404.06531
- Egami et al. (2023) Egami, E., Sun, F., Alberts, S., et al. 2023, Complete NIRCam Grism Redshift Survey (CONGRESS), JWST Proposal. Cycle 2, ID. #3577
- Eisenstein et al. (2023) Eisenstein, D. J., Willott, C., Alberts, S., et al. 2023, arXiv e-prints, arXiv:2306.02465
- Elbaz et al. (2011) Elbaz, D., Dickinson, M., Hwang, H. S., et al. 2011, A&A, 533, A119
- Endsley et al. (2022) Endsley, R., Stark, D. P., Bouwens, R. J., et al. 2022, MNRAS, 517, 5642
- Enia et al. (2022) Enia, A., Talia, M., Pozzi, F., et al. 2022, ApJ, 927, 204
- Franco et al. (2018) Franco, M., Elbaz, D., Béthermin, M., et al. 2018, A&A, 620, A152
- Fritz et al. (2006) Fritz, J., Franceschini, A., & Hatziminaoglou, E. 2006, MNRAS, 366, 767
- Fudamoto et al. (2024) Fudamoto, Y., Inoue, A. K., Coe, D., et al. 2024, ApJ, 961, 71
- Fudamoto et al. (2021) Fudamoto, Y., Oesch, P. A., Schouws, S., et al. 2021, Nature, 597, 489
- Fujimoto et al. (2022) Fujimoto, S., Brammer, G. B., Watson, D., et al. 2022, Nature, 604, 261
- Gardner et al. (2023) Gardner, J. P., Mather, J. C., Abbott, R., et al. 2023, PASP, 135, 068001
- Gómez-Guijarro et al. (2022) Gómez-Guijarro, C., Elbaz, D., Xiao, M., et al. 2022, A&A, 658, A43
- Gómez-Guijarro et al. (2023) Gómez-Guijarro, C., Magnelli, B., Elbaz, D., et al. 2023, A&A, 677, A34
- Gottumukkala et al. (2024) Gottumukkala, R., Barrufet, L., Oesch, P. A., et al. 2024, MNRAS, 530, 966
- Greene et al. (2024) Greene, J. E., Labbe, I., Goulding, A. D., et al. 2024, ApJ, 964, 39
- Gruppioni et al. (2020) Gruppioni, C., Béthermin, M., Loiacono, F., et al. 2020, A&A, 643, A8
- Guia et al. (2024) Guia, C. A., Pacucci, F., & Kocevski, D. D. 2024, Research Notes of the American Astronomical Society, 8, 207
- Harikane et al. (2020) Harikane, Y., Ouchi, M., Inoue, A. K., et al. 2020, ApJ, 896, 93
- Herrera-Camus et al. (2018) Herrera-Camus, R., Sturm, E., Graciá-Carpio, J., et al. 2018, ApJ, 861, 95
- Hopkins et al. (2010) Hopkins, P. F., Murray, N., Quataert, E., & Thompson, T. A. 2010, MNRAS, 401, L19
- Ji et al. (2025) Ji, X., Maiolino, R., Übler, H., et al. 2025, arXiv e-prints, arXiv:2501.13082
- Kocevski et al. (2024) Kocevski, D. D., Finkelstein, S. L., Barro, G., et al. 2024, arXiv e-prints, arXiv:2404.03576
- Kocevski et al. (2023) Kocevski, D. D., Onoue, M., Inayoshi, K., et al. 2023, ApJ, 954, L4
- Kokorev et al. (2024) Kokorev, V., Caputi, K. I., Greene, J. E., et al. 2024, ApJ, 968, 38
- Labbe et al. (2023) Labbe, I., Greene, J. E., Bezanson, R., et al. 2023, arXiv e-prints, arXiv:2306.07320
- Labbé et al. (2023) Labbé, I., van Dokkum, P., Nelson, E., et al. 2023, Nature, 616, 266
- Lagache et al. (2018) Lagache, G., Cousin, M., & Chatzikos, M. 2018, A&A, 609, A130
- Maiolino et al. (2024) Maiolino, R., Risaliti, G., Signorini, M., et al. 2024, arXiv e-prints, arXiv:2405.00504
- Matthee et al. (2024) Matthee, J., Naidu, R. P., Brammer, G., et al. 2024, ApJ, 963, 129
- McKinney et al. (2023) McKinney, J., Pope, A., Kirkpatrick, A., et al. 2023, ApJ, 955, 136
- McMullin et al. (2007) McMullin, J. P., Waters, B., Schiebel, D., Young, W., & Golap, K. 2007, in Astronomical Society of the Pacific Conference Series, Vol. 376, Astronomical Data Analysis Software and Systems XVI, ed. R. A. Shaw, F. Hill, & D. J. Bell, 127
- Meyer et al. (2024) Meyer, R. A., Oesch, P. A., Giovinazzo, E., et al. 2024, MNRAS, 535, 1067
- Meyer et al. (2025) Meyer, R. A., Walter, F., Di Mascia, F., et al. 2025, arXiv e-prints, arXiv:2502.14539
- Morishita et al. (2024) Morishita, T., Stiavelli, M., Chary, R.-R., et al. 2024, ApJ, 963, 9
- Oesch et al. (2023) Oesch, P. A., Brammer, G., Naidu, R. P., et al. 2023, MNRAS, 525, 2864
- Oke & Gunn (1983) Oke, J. B. & Gunn, J. E. 1983, ApJ, 266, 713
- Owen (2018) Owen, F. N. 2018, ApJS, 235, 34
- Pallottini et al. (2022) Pallottini, A., Ferrara, A., Gallerani, S., et al. 2022, MNRAS, 513, 5621
- Pérez-González et al. (2023) Pérez-González, P. G., Barro, G., Annunziatella, M., et al. 2023, ApJ, 946, L16
- Pérez-González et al. (2024) Pérez-González, P. G., Barro, G., Rieke, G. H., et al. 2024, ApJ, 968, 4
- Planck Collaboration et al. (2020) Planck Collaboration, Aghanim, N., Akrami, Y., et al. 2020, A&A, 641, A6
- Salpeter (1955) Salpeter, E. E. 1955, ApJ, 121, 161
- Schaerer et al. (2020) Schaerer, D., Ginolfi, M., Béthermin, M., et al. 2020, A&A, 643, A3
- Schaerer et al. (2024) Schaerer, D., Marques-Chaves, R., Xiao, M., & Korber, D. 2024, A&A, 687, L11
- Schouws et al. (2023) Schouws, S., Bouwens, R., Smit, R., et al. 2023, ApJ, 954, 103
- Schreiber et al. (2015) Schreiber, C., Pannella, M., Elbaz, D., et al. 2015, A&A, 575, A74
- Shu et al. (2022) Shu, X., Yang, L., Liu, D., et al. 2022, ApJ, 926, 155
- Sommovigo et al. (2022) Sommovigo, L., Ferrara, A., Pallottini, A., et al. 2022, MNRAS, 513, 3122
- Stefanon et al. (2021) Stefanon, M., Labbé, I., Oesch, P. A., et al. 2021, ApJS, 257, 68
- Talia et al. (2021) Talia, M., Cimatti, A., Giulietti, M., et al. 2021, ApJ, 909, 23
- Tripodi et al. (2023) Tripodi, R., Feruglio, C., Kemper, F., et al. 2023, ApJ, 946, L45
- Tsukui et al. (2023) Tsukui, T., Wisnioski, E., Krumholz, M. R., & Battisti, A. 2023, MNRAS, 523, 4654
- Valentino et al. (2023) Valentino, F., Brammer, G., Gould, K. M. L., et al. 2023, ApJ, 947, 20
- van der Vlugt et al. (2023) van der Vlugt, D., Hodge, J. A., Jin, S., et al. 2023, ApJ, 951, 131
- Walter et al. (2022) Walter, F., Neeleman, M., Decarli, R., et al. 2022, ApJ, 927, 21
- Wang et al. (2024a) Wang, B., de Graaff, A., Davies, R. L., et al. 2024a, arXiv e-prints, arXiv:2403.02304
- Wang et al. (2024b) Wang, B., Leja, J., de Graaff, A., et al. 2024b, ApJ, 969, L13
- Wang et al. (2016) Wang, T., Elbaz, D., Schreiber, C., et al. 2016, ApJ, 816, 84
- Wang et al. (2019) Wang, T., Schreiber, C., Elbaz, D., et al. 2019, Nature, 572, 211
- Weibel et al. (2024) Weibel, A., Oesch, P. A., Barrufet, L., et al. 2024, MNRAS, 533, 1808
- Whitaker et al. (2019) Whitaker, K. E., Ashas, M., Illingworth, G., et al. 2019, ApJS, 244, 16
- Williams et al. (2024) Williams, C. C., Alberts, S., Ji, Z., et al. 2024, ApJ, 968, 34
- Williams et al. (2019) Williams, C. C., Labbe, I., Spilker, J., et al. 2019, ApJ, 884, 154
- Xiao et al. (2024) Xiao, M., Oesch, P. A., Elbaz, D., et al. 2024, Nature, 635, 311
- Xiao et al. (2023) Xiao, M. Y., Elbaz, D., Gómez-Guijarro, C., et al. 2023, A&A, 672, A18
- Xue et al. (2016) Xue, Y. Q., Luo, B., Brandt, W. N., et al. 2016, ApJS, 224, 15
- Yue et al. (2024) Yue, M., Eilers, A.-C., Ananna, T. T., et al. 2024, ApJ, 974, L26
- Zanella et al. (2018) Zanella, A., Daddi, E., Magdis, G., et al. 2018, Monthly Notices of the Royal Astronomical Society, 481, 1976
Appendix A Best-fit SED of ID2756 with K.