Water dissociation and rotational broadening in the atmosphere of KELT-20 b from high-resolution spectroscopy
Abstract
We present atmospheric retrievals from Keck/KPIC phase II observations of the ultra-hot Jupiter KELT-20/MASCARA-2 b. Previous free retrievals of molecular abundances for ultra-hot Jupiters have been impacted by significant model biases due to variations in vertical abundance profiles, which we address by including molecular dissociation into our retrieval framework as an additional free parameter. We measure the abundance of CO () and obtain a lower limit on the abundance of H2O (, at 95% confidence) in the atmosphere of KELT-20 b. These abundances yield an atmospheric ( at 95% confidence) and suggest a metallicity approximately solar to solar. H2O is dissociated at pressures below bar, roughly consistent with predictions from chemical equilibrium models, and suggesting that the retrieved composition is not a result of assumptions about the vertical mixing profiles. We also constrain the rotational velocity of KELT-20 b to , suggesting the presence of a jet comparable to the sound speed in the direction of the planet’s rotation, assuming the actual rotation of the planet is tidally locked.
1 Introduction
| Property | Value | Ref. |
|---|---|---|
| KELT-20 | ||
| RA | 19:38:38.7 | Gaia Collab. et al. (2021) |
| Dec | +31:13:09 | Gaia Collab. et al. (2021) |
| Sp. Type | A2V | Lund et al. (2017) |
| Cutri et al. (2003) | ||
| Mass | Lund et al. (2017) | |
| Radius | Talens et al. (2018) | |
| Teff | K | Lund et al. (2017) |
| Lund et al. (2017) | ||
| Talens et al. (2018) | ||
| Lund et al. (2017) | ||
| Talens et al. (2018) | ||
| KELT-20 b | ||
| Period [day] | ExoFOP (2019) | |
| [JD] | ExoFOP (2019) | |
| AU | Talens et al. (2018) | |
| Talens et al. (2018) | ||
| Yan et al. (2022) | ||
| Mass | Lund et al. (2017) | |
| Radius | Talens et al. (2018) | |
| K | Talens et al. (2018) | |
| C/O | This work | |
| This work | ||
| This work | ||
| This work | ||
| This work |
Ultra-hot Jupiters (UHJs), hot Jupiters with equilibrium temperatures in excess of 2000 K, are an ideal exoplanet population for atmospheric characterization studies. The extreme conditions of these planets and complicated dynamical history suggested by the close-in, misaligned orbits of many UHJs (Naoz et al., 2011; Rice et al., 2022) makes these planets compelling targets for efforts to improve our observational understanding of atmospheric circulation and planet formation.
However, molecular abundance estimation for UHJs is complicated by the impacts of thermal dissociation, vertical mixing, cold trapping, and photochemistry. While CO only dissociates at very high temperatures and low pressures, typical UHJ conditions are expected to dissociate H2O at pressures deeper than mbar under chemical equilibrium. If abundances are vertically fixed in a retrieval, the only parameter which can reduce the strength of H2O features to match the effects of dissociation is the H2O abundance itself. As a result, retrievals which assume fixed abundances with altitude will be biased towards high-C/O, high-metallicity compositions (e.g. Brogi et al., 2023; Ramkumar et al., 2023).
While assuming chemical equilibrium abundance profiles can resolve this issue (Brogi et al., 2023; Ramkumar et al., 2023), local chemical equilibrium based on an assumed profile is a potentially restrictive assumption. Internal heating and the resulting vertical mixing can lead to severe depletion of species expected from models which use only the local temperature to calculate equilibrium abundances (Sing et al., 2024; Welbanks et al., 2024). Cold trapping has similarly been found to cause significant depletion of condensable species on planets with strong day/night temperature contrasts, which is not reproducible with 1D local chemical equilibrium models (Pelletier et al., 2023; Hoeijmakers et al., 2024). As a result of these effects, local chemical equilibrium retrievals may be pushed to inaccurate abundances in order to minimize the impact of species present under the local chemical equilibrium assumption but absent in the real atmosphere. Free retrievals can adjust to the presence or absence of species based on these effects without biasing the abundances of other species.
UHJs around A-type stars are also exposed to extreme UV fluxes, which may drive photochemical processes in the upper atmosphere which will not be captured by a thermochemical equilibrium model. Photochemically produced species have been detected in JWST observations of hot/warm Jupiters (Tsai et al., 2023; Dyrek et al., 2024), providing an observational example of the limits of an equilibrium assumption. While there are publicly available tools to estimate abundances which include photochemistry effects (Tsai et al., 2021), these tools are too slow to use for retrievals, and the reaction networks used in these models need to be observationally verified. This creates a need for free retrieval frameworks which can account for vertically-varying molecular abundances.
UHJs also provide an opportunity to directly test Global Circulation Model (GCM) predictions in extreme conditions, provided the planetary ephemeris and spectrograph line-spread function (LSF) are sufficiently well characterized to robustly measure velocity offsets and line broadening. Under UHJ conditions, GCMs predict supersonic day-to-night winds up to 10 (Wardenier et al., 2021; Komacek et al., 2022; Beltz et al., 2022). While medium/low resolution spectroscopy cannot measure these supersonic wind speeds directly, high-resolution observations have been able to provide some wind measurements consistent with these models (e.g. Pai Asnodkar et al., 2022; Gandhi et al., 2023). For tidally locked planets such as UHJs, constraining the rotational velocity in emission can provide an independent measurement of the equatorial jet speed to complement velocity shift measurements from high-resolution spectroscopy obtained during transit (Lesjak et al., 2023; Finnerty et al., 2024; Bazinet et al., 2024). Interpreting shifts measured during transit as wind speeds has been difficult due to the potential for chemical differences between leading and trailing limbs (Wardenier et al., 2021; Savel et al., 2022). Combining measurements of jet velocities from multiple observing geometries is therefore critical to understanding atmospheric circulation for hot Jupiters and provides a unique observational test of GCMs in an extreme regime (Pino et al., 2022; van Sluijs et al., 2023).
We observed KELT-20 b (also known as MASCARA-2 b) as part of our ongoing Keck/KPIC hot Jupiter survey (Finnerty et al., 2023a, b, 2024, 2025). Properties of the system are summarized in Table 1. First discovered in 2017 (Lund et al., 2017), KELT-20 b is in many ways a typical UHJ, with an equilibrium temperature of 2260 K, an inflated radius ( Talens et al., 2018), and a rapidly rotating ( Talens et al., 2018) early-type host star. However, compared with other UHJs, KELT-20 b has a longer orbital period of 3.5 days, compared with the day periods of e.g. WASP-33 b, KELT-9 b, MASCARA 1b, and TOI-1518 b. Spin-orbit misalignment measurements using the Rossiter-McLaughlin Effect have also found that the orbital plane KELT-20 b is well-aligned with the host star’s rotation (Talens et al., 2018), in contrast with the other UHJs listed previously (Collier Cameron et al., 2010; Gaudi et al., 2017; Talens et al., 2017; Cabot et al., 2021). This suggests KELT-20 b could have formed and/or migrated via a different mechanism than other UHJs, perhaps without the late high-eccentricity migration that is believed to be necessary to produce retrograde UHJs such as WASP-33 b and KELT-9 b (Naoz et al., 2011).
KELT-20 b has been extensively studied at optical wavelengths in both emission and transmission (see Johnson et al., 2023; Petz et al., 2024, and references therein), revealing a variety of transition metal species but no evidence for TiO, VO, or CaH in the optical. In the infrared, strong H2O and CO emission features were reported from low-resolution HST and Spitzer spectroscopy (Fu et al., 2022). Subsequently, Kasper et al. (2023) reported the results of a joint retrieval of these data and MAROON-X optical emission data which suggested a super-solar metallicity and C/O ratio. In this paper, we present retrievals based on Keck/KPIC -band emission observations (2.1–2.48m), providing the first high-spectral-resolution detections of CO and H2O in KELT-20 b and a constraint on the atmospheric C/O ratio from these gases.
We discuss the KPIC observations of KELT-20 b, data reduction procedure, and retrieval setup in Section 2. Retrieval results are presented in Section 3. We discuss these results and the implications for the formation history and atmospheric dynamics of KELT-20 b in Section 4, and summarize our results in Section 5.
2 Observations, Data Reduction, and Retrieval
2.1 Observations
The KELT-20 system was observed with Keck II/KPIC phase II (McLean et al., 1998; Martin et al., 2018; López et al., 2020; Delorme et al., 2021; Echeverri et al., 2022; Jovanovic et al., 2025) on UT 30 July 2023 from 5:31 to 12:06 UTC, totaling just over 6.5 hours. The observations began shortly after the end of the KELT-20 b secondary eclipse, and covered a phase range of 0.539–0.617. During this time, the nominal star-frame planet velocity went from to . The exposure time was 300 seconds per frame, which kept the velocity shift within a single exposure to , substantially smaller than the resolution of NIRSPEC (López et al., 2020), in order to minimize smearing of the planet signal within a single exposure. Conditions and instrument performance were typical for KPIC phase II, with a top-of-atmosphere throughput of 3-4% throughout the observing sequence. The reduced/extracted spectra from each exposure had a signal-to-noise ratio (SNR) of approximately 120-140 per pixel in the orders used for retrieval.
KELT-20 b was observed using only a single KPIC science fiber, rather than nodding between fibers as in Finnerty et al. (2023a, 2024). This reduced overheads associated with switching fibers and allowed all observations to be taken using the highest-throughput fiber to maximize total signal-to-noise. This approach also simplified handling of the KPIC line-spread function (LSF), which is slightly different for each fiber. KPIC has minimal background in the -band, which is sufficiently removed using dark frames taken before/after observing to not impact retrievals.
2.2 Data Reduction
A late-type star (HIP 95771, M0.5IIIb) was observed to provide wavelength calibration using the KPIC Data Reduction Pipeline (DRP)111https://github.com/kpicteam/kpic_pipeline/. As with previous KPIC -band observations, three orders (37–39, 1.94–2.09m) are severely impacted by telluric CO2 and are omitted from the analysis. While previous KPIC observations struggled with wavelength calibration in orders 35 and 36 due to an absence of strong stellar or telluric lines, in this case the wavelength calibrator was observed at a median airmass of 1.32, leading to somewhat deeper telluric lines and a wavelength solution which appears to be reliable in all orders. We therefore include orders 31–36 in the analysis. The improved calibration in the bluer orders may be a result of iterative improvements in the KPIC wavelength calibration from using previous wavelength solutions as the starting point for optimizing a new wavelength solution.
The KPIC DRP was used to produce background and bad pixel frames for the 300s exposure time. Ten background frames were obtained in both the afternoon prior to observing and the morning after observing, enabling a high-quality background subtraction even without nodding between the KPIC fibers.
The flux extraction differed significantly from the default KPIC DRP in order to accurately handle the non-Gaussian and variable KPIC LSF. As part of the trace finding step, we also fit the trace profile in the spatial (detector ) direction using a Gaussian-Hermite model, similar to the approach described by Holtzman et al. (2018). This model multiplies a Gaussian profile of variable width by the Hermite polynomials of order , with the amplitude of each polynomial as a free parameter. This model allow fitting of both non-Gaussian wings and asymmetries in the line profile. The raw fit parameter values are then smoothed by a 13-pixel Gaussian kernel to reduce noise and ensure variation in the LSF matches the spatial scales for such variation found in López et al. (2020).
This spatial profile is then used to compute weights for optimal extraction (Horne, 1986) and extract 1D spectra. To estimate the KPIC LSF, we multiply the overall width parameter by a factor of 1.14 in order to match a known asymmetry induced by the NIRSPEC optics (Finnerty et al., 2022). These scaled profiles are then convolved with the forward-model of the planet atmosphere during the retrieval to replicate the instrumental broadening of NIRSPEC.
2.3 Atmospheric Retrieval
Our atmospheric retrieval framework has previously been described in Finnerty et al. (2023a, 2024, 2025). We provide a brief summary here, with an emphasis on new features. The full list of parameters and priors is included in Table 2. We use a PHOENIX (Husser et al., 2013) model for KELT-20 A with K, , and solar metallicity, roughly matching the stellar parameters reported in Lund et al. (2017). The stellar model is rotationally broadened using the wavelength-dependent technique described in Carvalho & Johns-Krull (2023) to 114 (Talens et al., 2018).
We use petitRADTRANS3 (Mollière et al., 2019, 2020; Nasedkin et al., 2024) to compute model planet spectra. The mass of KELT-20 b is poorly constrained, with Lund et al. (2017) placing a upper limit of , which motivates our inclusion of as a free parameer in the atmospheric retrieval. As in our previous works, we use 80 log-uniform spaced pressure layers from to bar. Following Finnerty et al. (2024), we use the pressure-temperature () profile model from Guillot (2010). While the intrinsic temperature parameter has been fixed in other high-resolution studies (e.g. Gibson et al., 2022; Ramkumar et al., 2023), we include it as a free parameter in our retrievals. determines the lower-atmosphere behavior of the profile, below the thermal inversion and the bulk of the emission contribution function, but we find that its inclusion is important to breaking degeneracies between abundances and dissociation pressures.
For molecular abundances, we use a free-retrieval approach which allows for variations in vertical abundance profiles for certain species. In addition to the abundance, our model can optionally fit a dissociation pressure and a formation pressure. At pressures lower than the dissociation pressure, the abundance decays as a power law, . Similarly, at pressures greater than the formation pressure, the abundance decays as . Each of these parameters is optional, and different parameterizations can be used for different species, including freely fitting the power law index. The default power law index of 4 was an arbitrary choice made to roughly match the profiles seen in easyCHEM (Mollière et al., 2017; Lei & Mollière, 2024) results for a nominal KELT-20 b profile.
Based on chemical equilibrium models, we allow CO to dissociate only at low pressures, extending below the top-of-atmosphere cutoff pressure to allow for the no-dissociation scenario. For H2O, we expect dissociation to occur near the thermal inversion, so we fit for the dissociation pressure. We expect OH to be produced around the same pressure as H2O dissociation, so we fit for the OH formation pressure, and we expect OH will itself be dissociated at high altitudes, so we also fit for the OH dissociation pressure. C2H2, if present, is expected to dissociate at intermediate pressures, so we fit for the dissociation pressure. We do not fit the power-law index for any species, after initial tests found this parameter was unconstrained in retrievals.
We also fit for the overall hydrogen mass fraction and the H2 dissociation pressure. As these species have only weak spectral features in the region probed, our sensitivity to these parameters is primarily indirect via collisionally-induced-absorption (CIA) opacity and the impact on the mean molecular weight. The remaining mass of the atmosphere is assumed to be helium.
The opacity tables used for H2O, OH, 12CO, and 13CO were previously described in Finnerty et al. (2023a). For H2O we used the (Polyansky et al., 2018) partition function and HITEMP 2010 linelist (Rothman et al., 2010). For both CO isotopologues we used the HITEMP 2019 lists (Gordon et al., 2022) and the Li et al. (2015) partition function. For OH we used the partition function from Yousefi et al. (2018) and HITEMP 2020 linelist (Gordon et al., 2022). Opacities were generated via ExoCross (Yurchenko et al., 2018) following instructions in the petitRADTRANS documentation. For C2H2, we converted the aCeTeY (Chubb et al., 2020) opacity table available from DACE (Grimm et al., 2021) to the petitRADTRANS format. As clouds are not expected under dayside UHJ conditions, we do not include any cloud species, but retain the scattering mode in petitRADTRANS. See Finnerty et al. (2023a) for a more detailed discussion of this choice in UHJs. A test retrieval including a grey cloud deck preferred a cloud-top pressure greater than the base of the emission contribution function, indicating a preference for a clear atmosphere. H- is similarly not included, following Finnerty et al. (2023a), who found that H- introduces a uniform reduction in the line strengths for small bandpass observations. In this scenario, the impact of H- becomes degenerate with changes in the scale factor and profile. This is not the case for analyses covering a large bandpass, such as joint optical+IR retrievals, which will likely need to include and constrain H- explicitly.
Our retrieval pipeline uses principal component analysis (PCA) to remove time-varying instrumental fringing and telluric effects which would otherwise dominate over the planet signal, as previously described in Finnerty et al. (2024). The number of principal components to drop is difficult to choose in a robustly motivated way (Cheverall et al., 2023). We therefore ran retrievals omitting 4, 6, 8 and 12 PCs in order to assess the impact of this choice on the retrieval results.
HRCCS retrievals also use an overall scaling parameter applied to the planet spectrum Brogi & Line (2019). While Finnerty et al. (2023a, 2024) used a linear scale factor, for this work we follow Finnerty et al. (2025) and switch to a truncated log-normal scale factor with a mean of 0 (corresponding to a multiplication of the planet spectrum) and standard deviation of 0.1. This distribution is truncated at 7.5 standard deviations from the mean for numeric stability. This is more in line with other analyses, for which a logarithmic prior for the scale factor (e.g. Line et al., 2021) is common. Using a normal prior, rather than uniform, may help to break the temperature/scale factor degeneracy discussed in Brogi et al. (2023); Finnerty et al. (2024).
The nested sampling for the retrieval was performed using MultiNEST (Feroz & Hobson, 2008; Feroz et al., 2009; Buchner, 2014; Feroz et al., 2019) with 800 live points and a stopping criteria. We continue to use the Brogi & Line (2019) function as in Finnerty et al. (2023a, 2024). Compared with previous retrievals using dynesty, MultiNest retreivals run faster, although the wider wavelength coverage and strict convergence used in this analysis still requires approximately one week of computing time with 16 Intel E5-2670 CPU cores.
3 Results
| Name | Symbol | Prior | Retrieved Max-L | Retrieved Median |
|---|---|---|---|---|
| log infrared opacity [] | Uniform(-4, 0) | -2.8 | ||
| log infrared/optical opacity | Uniform(0, 3) | 1.5 | ||
| Intrinsic Temperature [K] | Uniform(500,1500) | 600.0 | ||
| Equilibrium temperature [K] | Uniform(1500, 5000) | 1580 | ||
| Surface gravity [] | Uniform(2,4.5) | 3.6 | ||
| [] | Uniform(157,197) | 177.6 | ||
| offset [] | Uniform(-20, 20) | -0.2 | ||
| Rotational velocity [] | Uniform(0, 15) | 7.1 | ||
| log H2O mass-mixing ratio | log H2O | Uniform(-12, -0.3) | -1.2 | |
| log CO mass-mixing ratio | log CO | Uniform(-12, -0.3) | -2.9 | |
| log OH mass-mixing ratio | log OH | Uniform(-12, -0.5) | -2.3 | |
| log C2H2 mass-mixing ratio | log C2H2 | Uniform(-12, -1) | -4.0 | |
| log Fe mass-mixing ratio | log Fe | Uniform(-12, -1) | -2.1 | |
| CO dissociation pressure | Uniform(-7, -2) | -4.8 | ||
| H2O dissociation pressure | Uniform(-6, 2) | -0.5 | ||
| OH dissociation pressure | Uniform(-6, 2) | -5.3 | ||
| C2H2 dissociation pressure | Uniform(-6, 2) | -0.5 | ||
| OH formation pressure | Uniform(-6, 2) | -2.2 | ||
| log | Uniform(-6, -0.5) | -1.9 | ||
| log H mass-mixing ratio | Uniform(-0.4, -0.05) | -0.1 | ||
| H2 dissociation pressure | Uniform(-6, 2) | 1.7 | ||
| Scale factor | scale | TruncLogNormal(0, 0.1, 7.5) | 0.08 | |
| Derived Parameters | ||||
| Carbon/oxygen ratio | C/O | - | 0.01 | |
| Carbon abundance | [C/H] | - | -0.4 | |
| Oxygen abundance | [O/H] | - | 1.3 | |
| Volatile abundance | [(C+O)/H] | - | 1.1 |
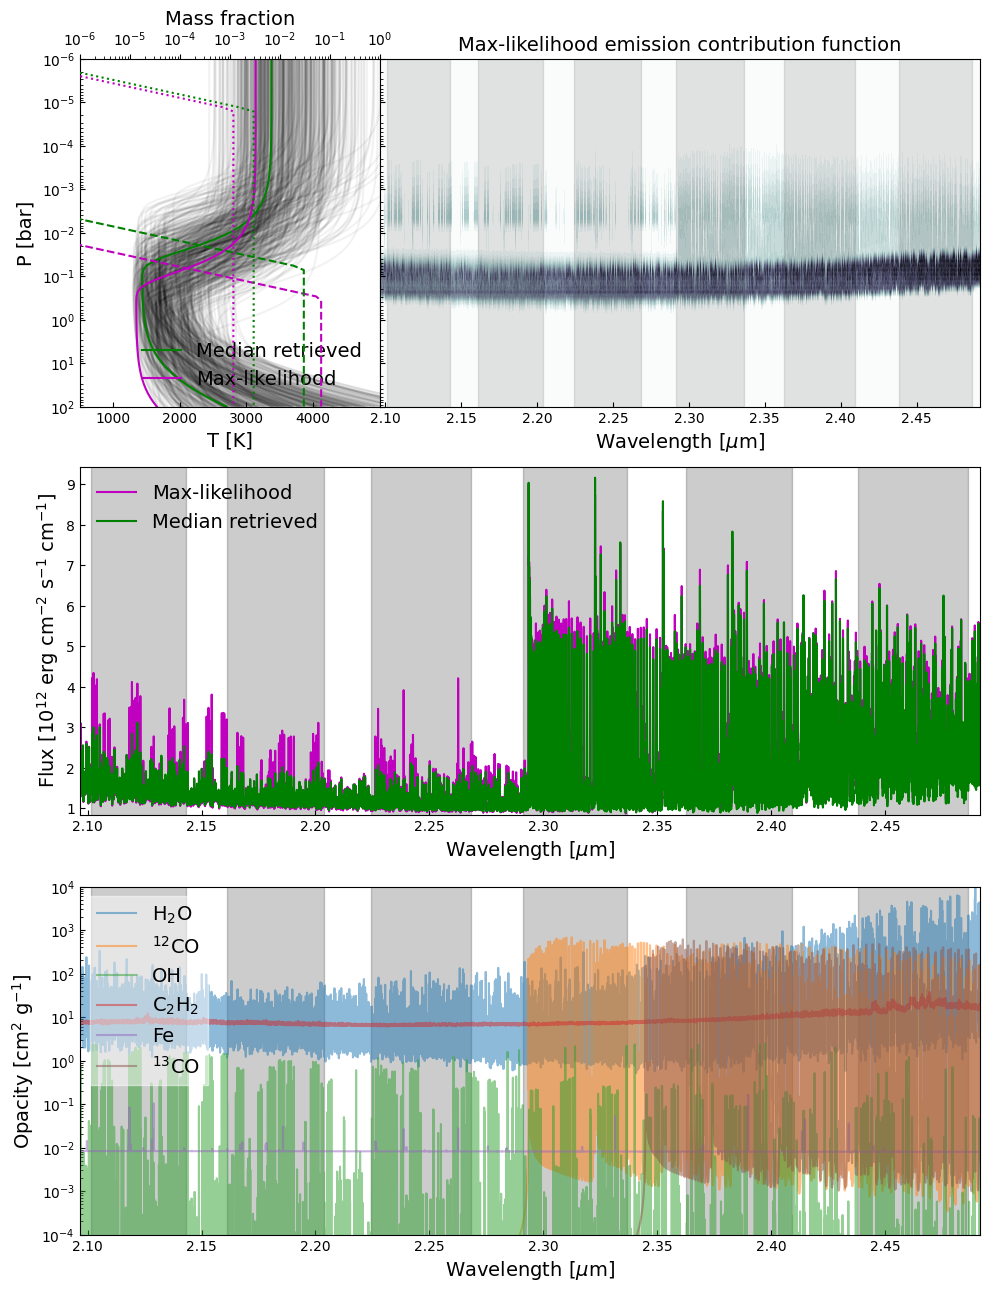
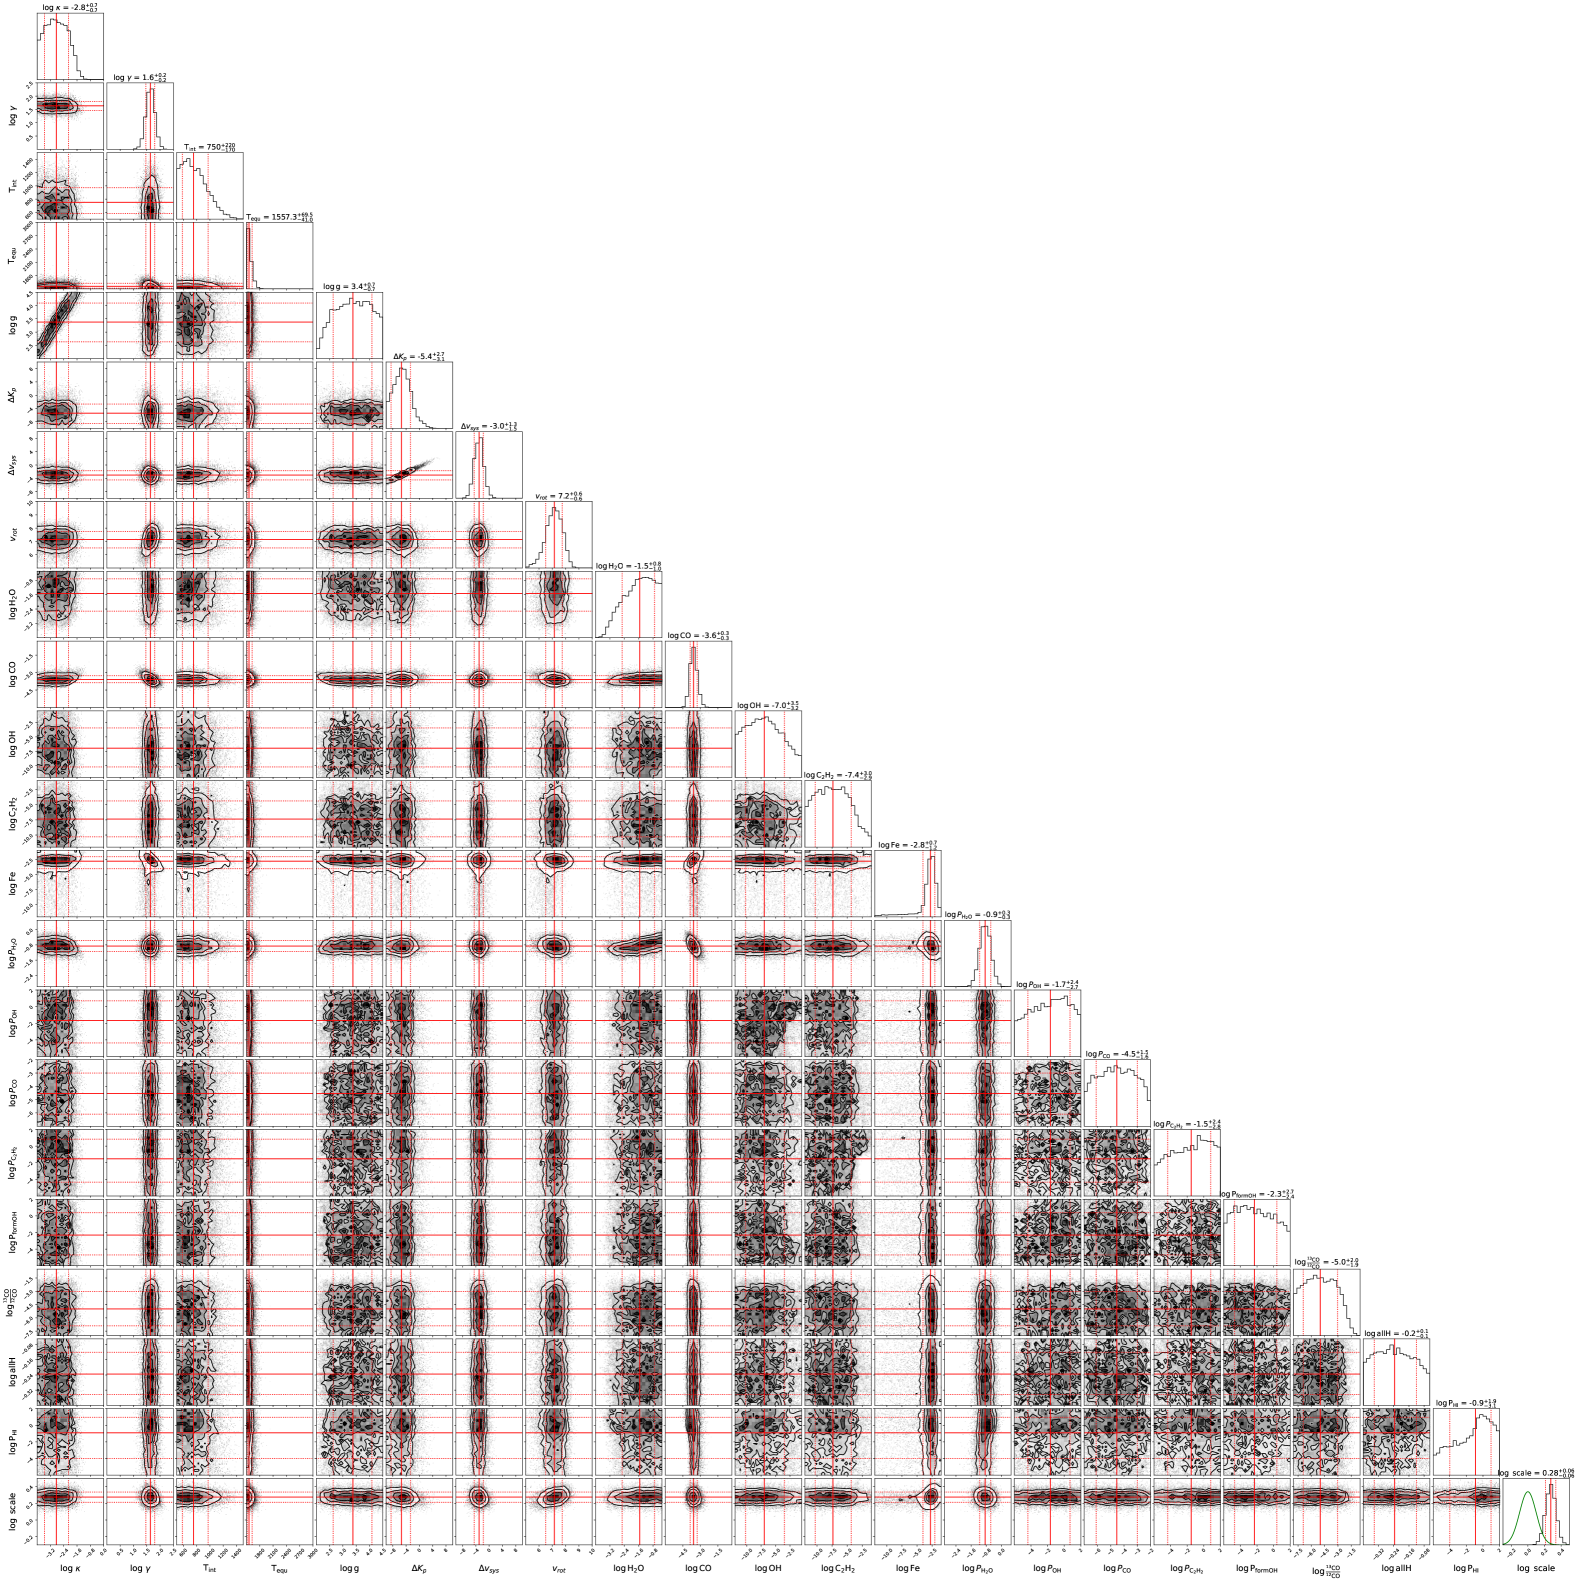
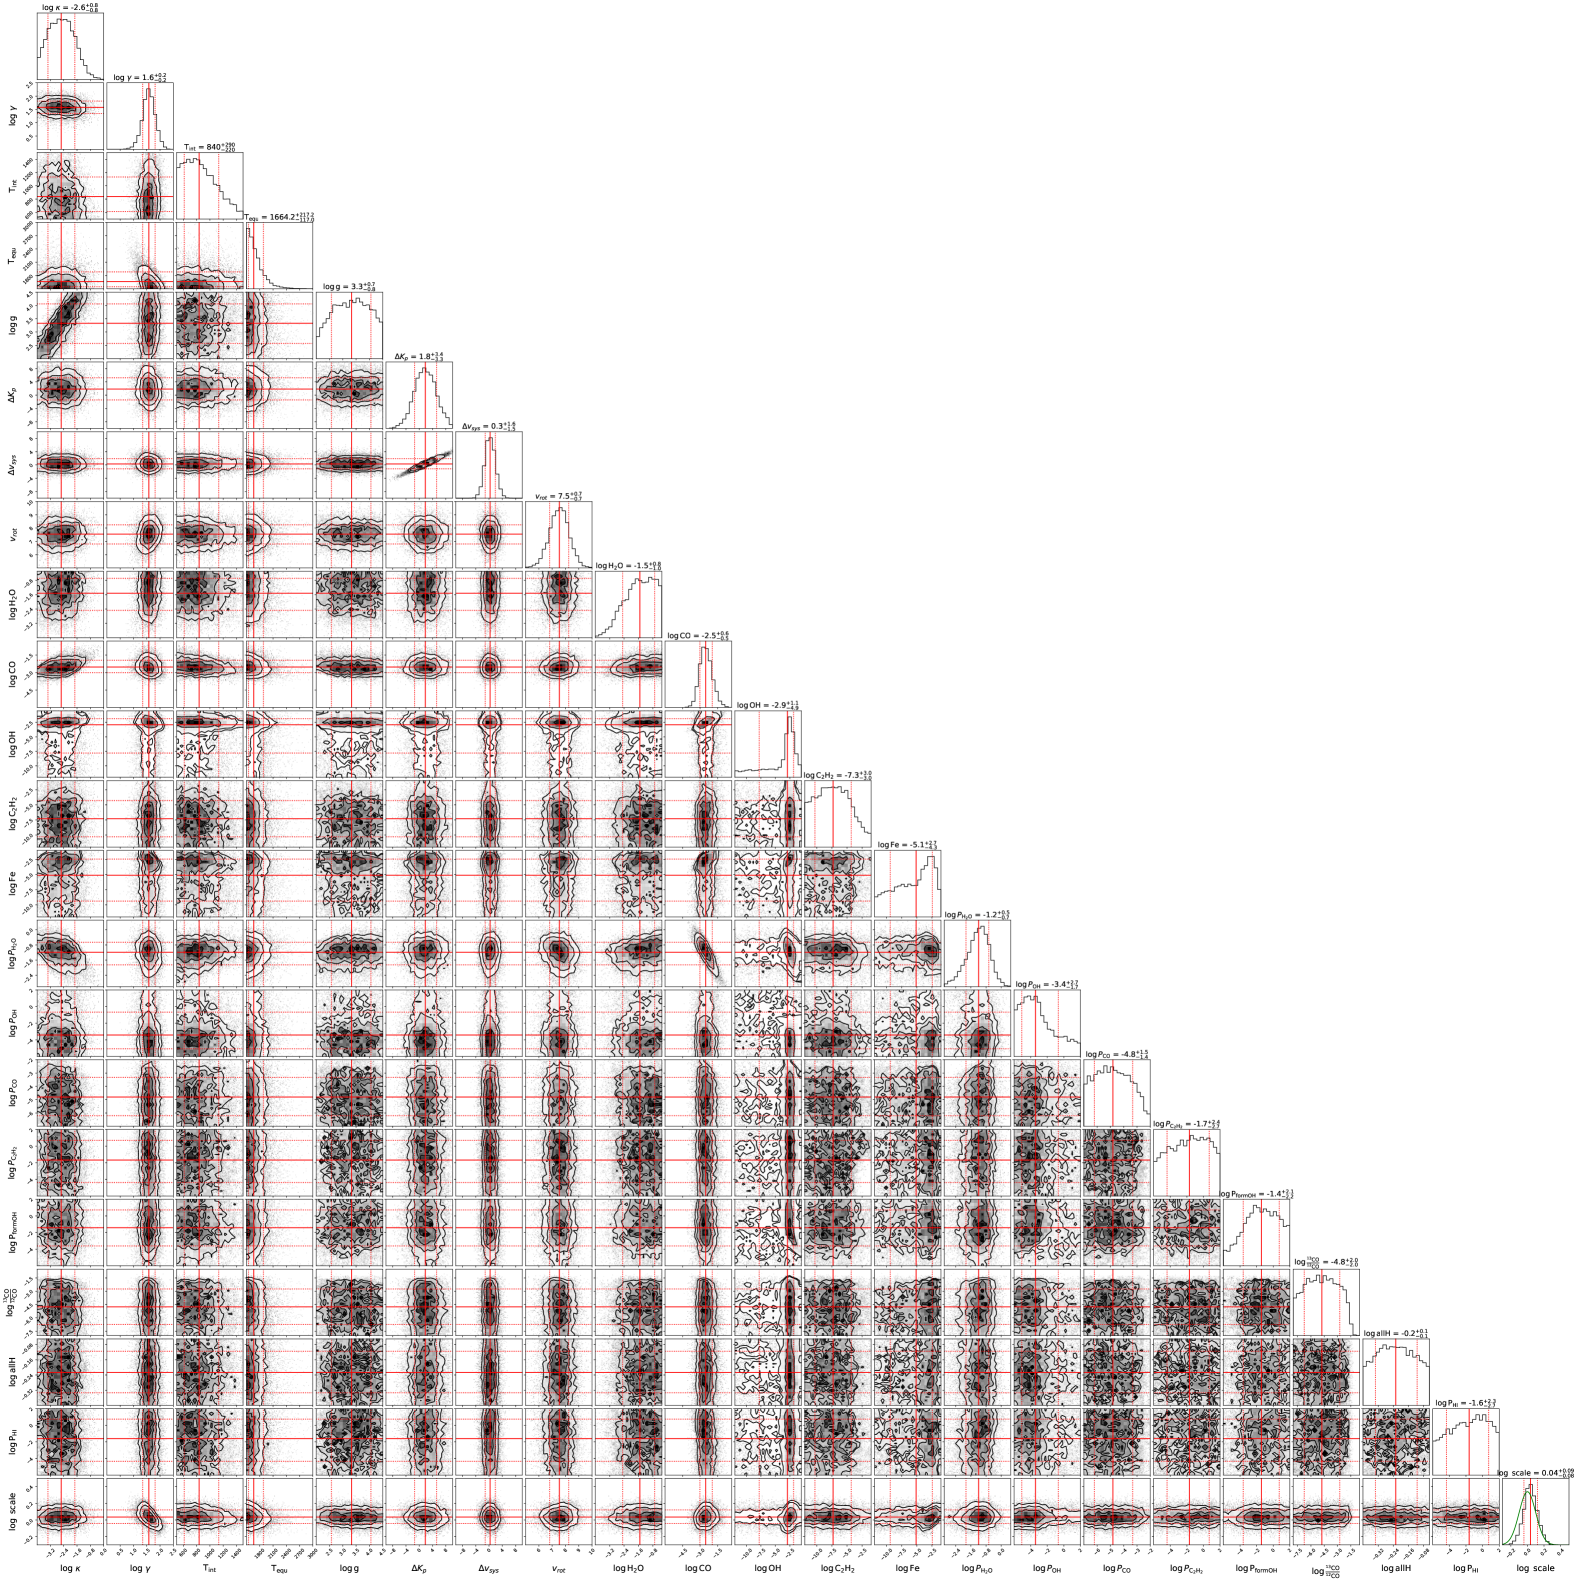
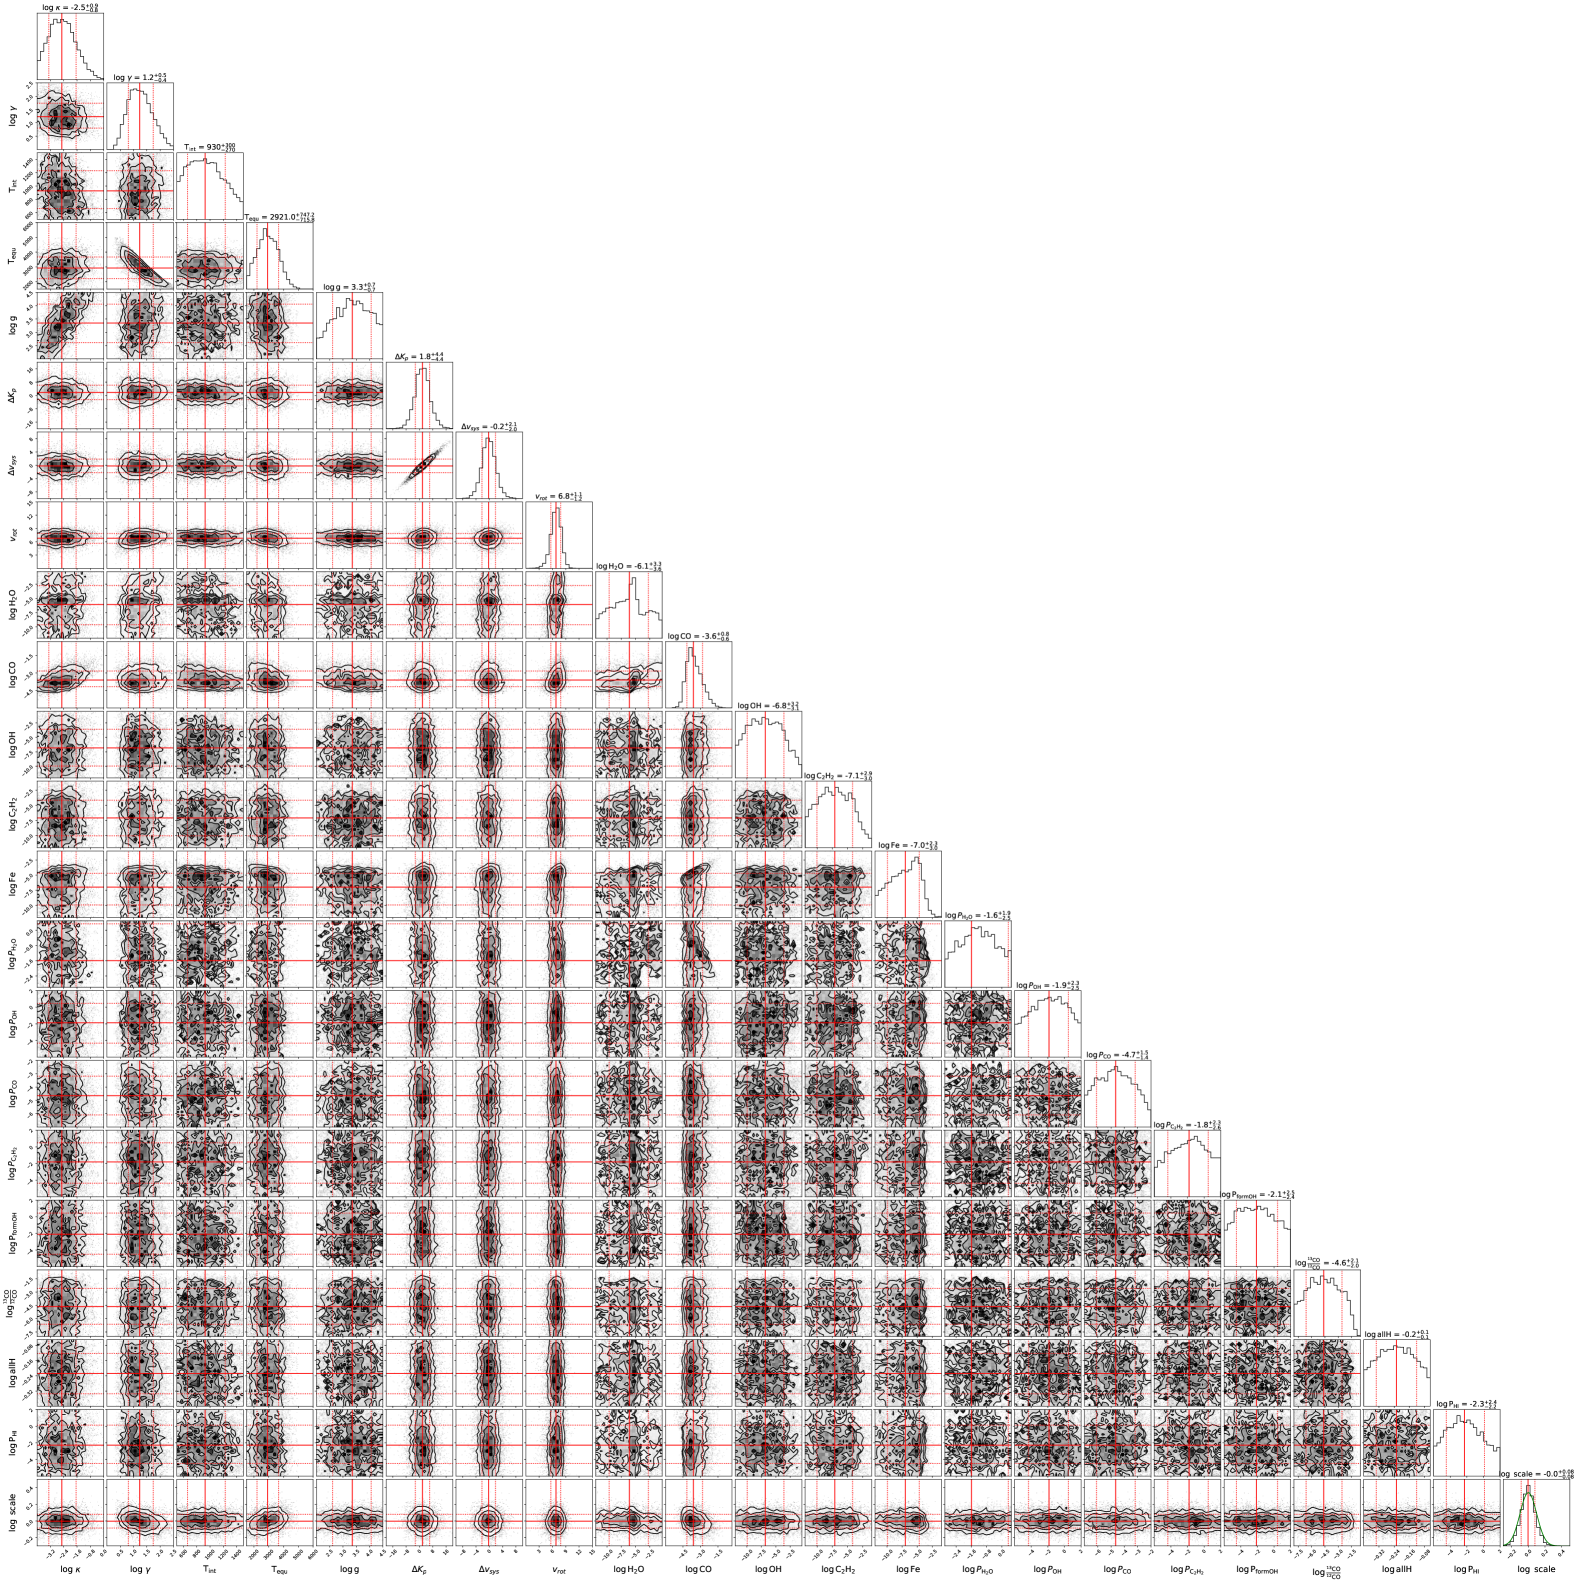
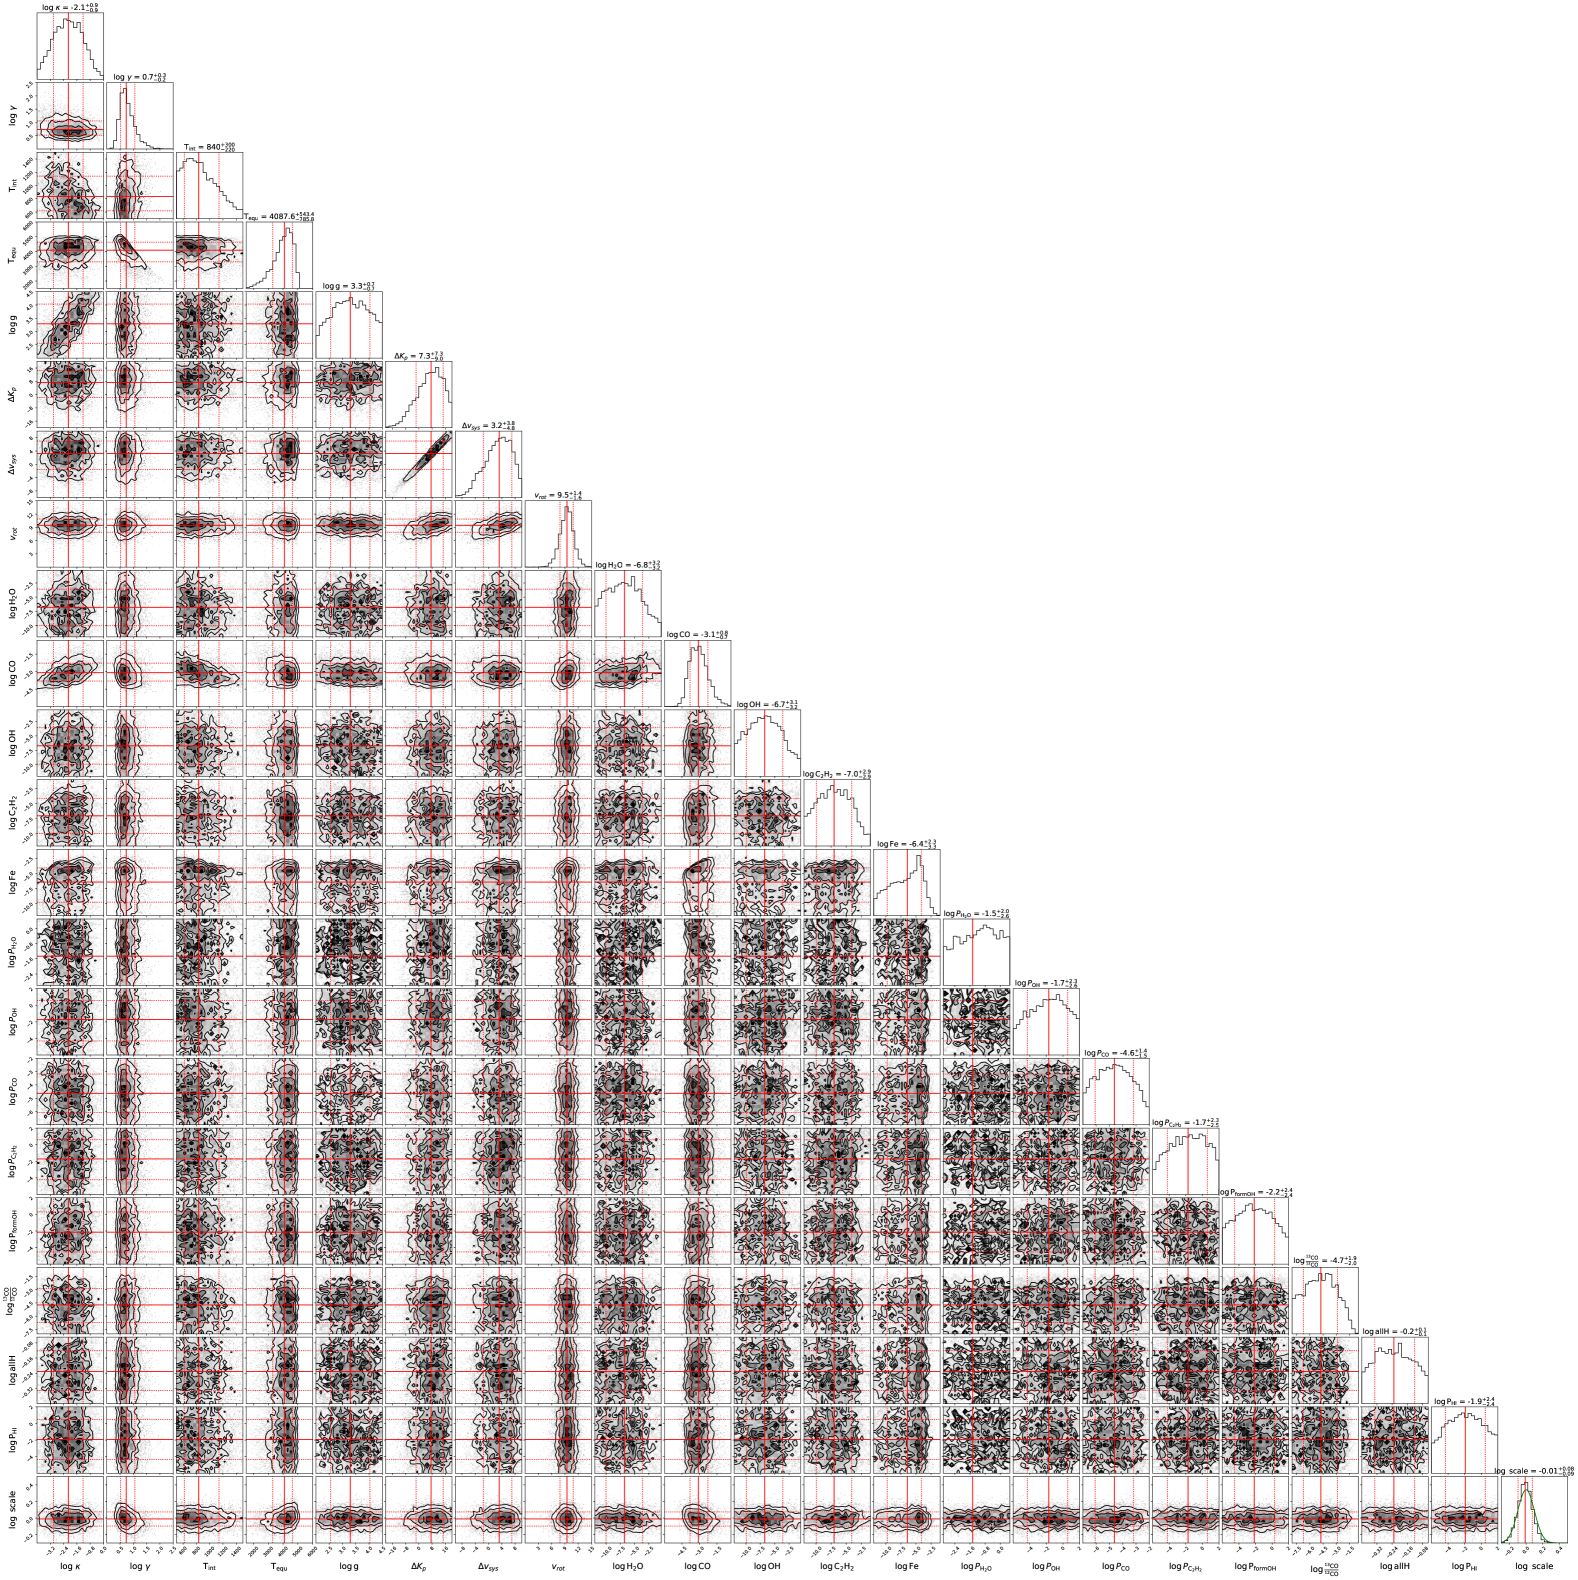
Results from the 6-component retrieval are presented in Table 2 and Figure 1. Parameters marked with a had poorly constrained posteriors, for these parametes 95% confidence limits are provided if available. plots for each species are presented in Figure 3. Full corner plots for all four retrievals are included in Appendix A.
3.1 Velocity and winds
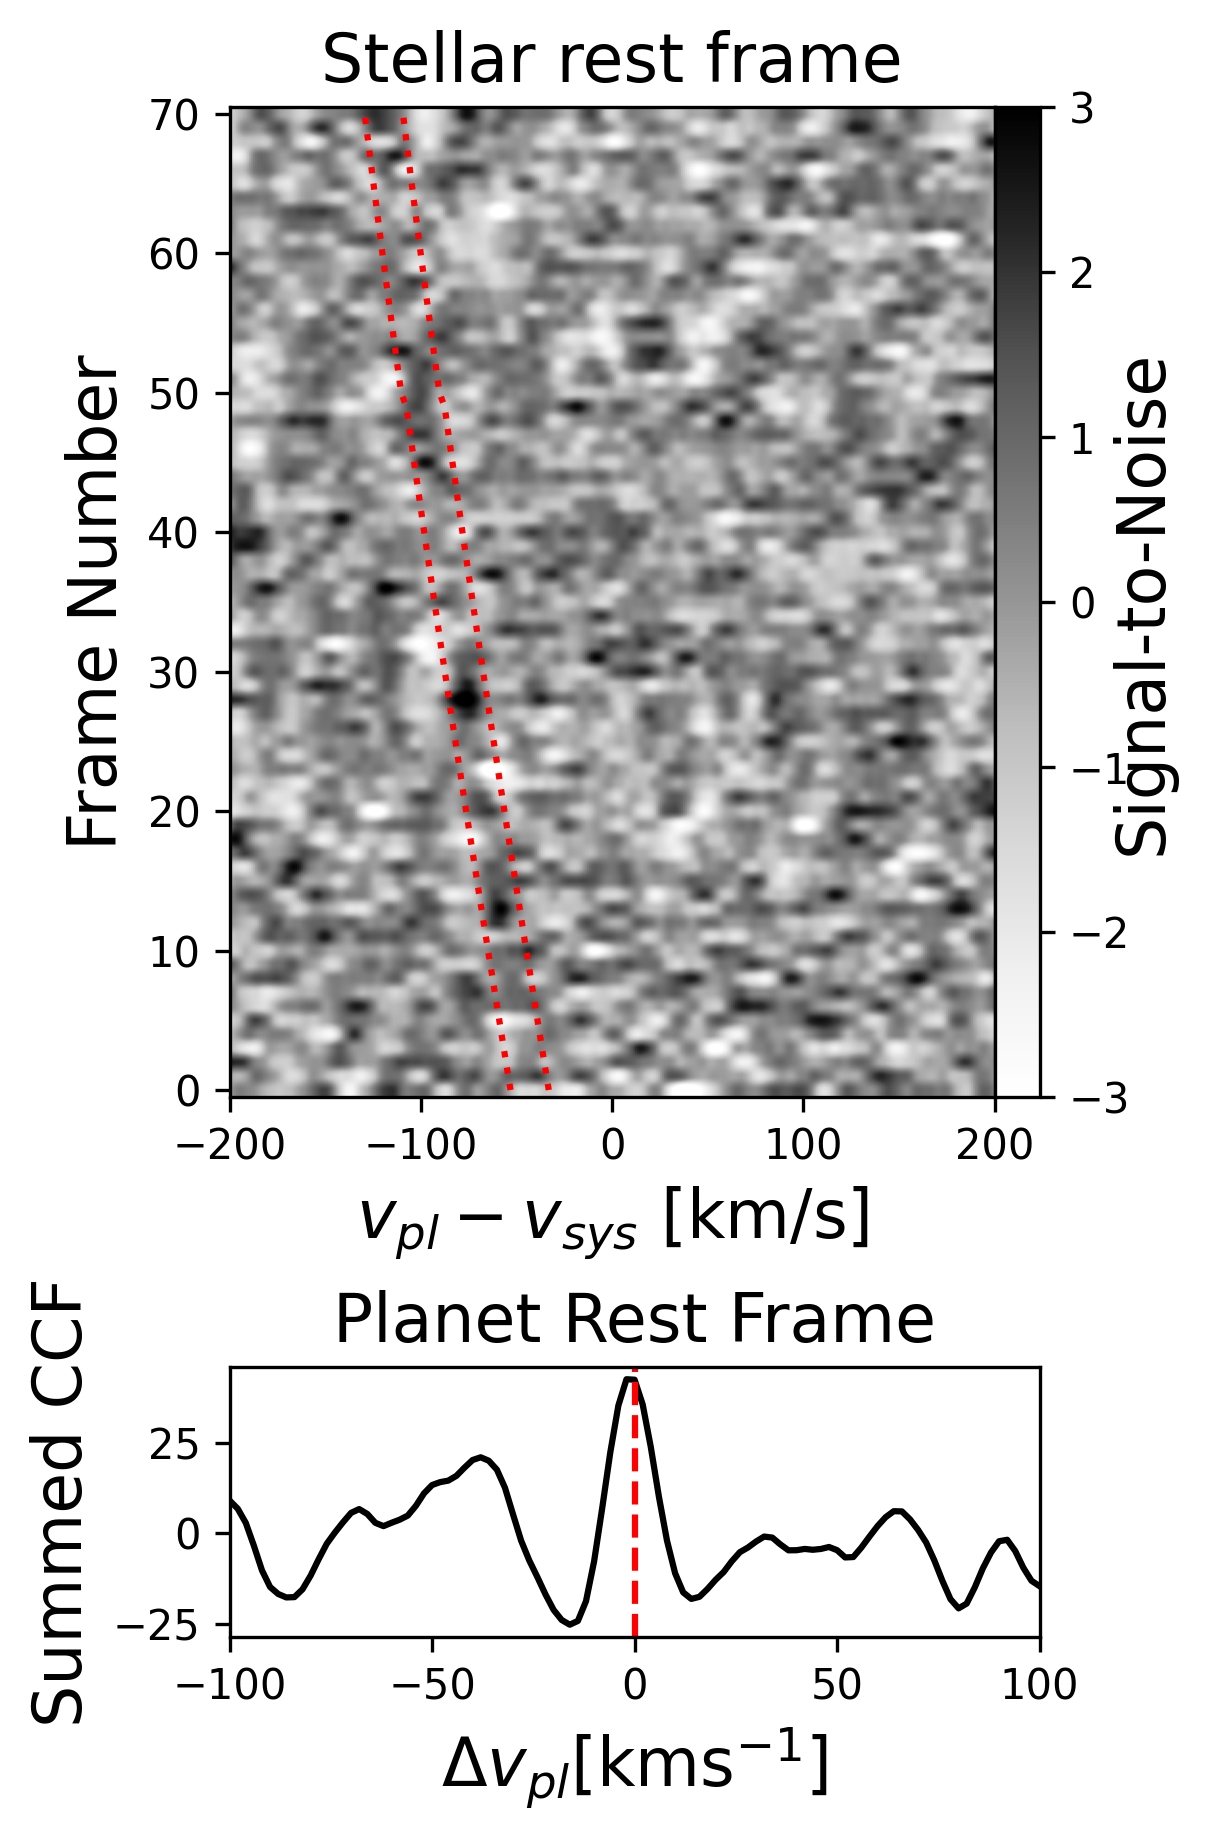
The , , and parameters are all well-constrained in the retrievals. Both and are consistent with the nominal values in Table 1 within , and are strongly covariant due to observations being obtained only post-eclipse. Figure 2 shows the cross-correlation as a function of frame number and planet velocity, as well as the cross-correlation function summed in the planet rest frame. The planetary signal is weakly apparent in the 2D plot, but very clear after coadding in the planet rest frame. The planet signal does not appear to be significantly offset from the nominal parameters, consistent with the results of the retrieval analysis.
is well-constrained to , compared with an expected rotational velocity of 2.7 assuming tidal locking. This value is physically plausible for a tidally-locked UHJ with a super-rotating equatorial jet (e.g. Komacek et al., 2022) and is consistent with recent dayside wind measurements from other UHJs (Lesjak et al., 2025). This suggests that the LSF fitting procedure described in Section 2 can provide meaningful constraints even for slowly rotating ( ) planets, rather than being restricted to the young, rapidly-rotating population probed by direct imaging targets. However, we note that we assumed a fixed factor of 1.14 when converting from the spatial to the spectral LSF widths, potentially resulting in a systematic error if this value is incorrect. We also note that the NIRSPEC velocity resolution is itself . The retrieved value for corresponds to a broadening of the intrinsic LSF, assuming the kernel widths add in quadrature. Given the systematic uncertainty associated with the spatial/spectral correction, we caution that this apparent constraint may not correspond to the actual rotational velocity of KELT-20 b.
3.2 Pressure-temperature profile
The top row of Figure 1 shows the retrieved profile and maximum-likelihood emission contribution function. The emission contribution function indicates our observations are sensitive to emission arising between 50 mbar and 100 . This is consistent with our limite ability to constrain the intrinsic temperature parameter ( of the Guillot (2010) profile, which mostly impacts the profile at pressures greater than 1 bar.
The retrieved runs to the lower end of the prior range. Tests with a wider prior found this is remains the case even if the prior is extended to 800 K, but that increases in the multiplicative scale factor applied to the planet model keep the final star/planet flux ratio in the forward model approximately constant. This indicates that the use of a log-normal scale factor prior and tight temperature prior is not sufficient to break the scale factor/temperature degeneracy for small-bandpass high-resolution observations discussed in Finnerty et al. (2024). Resolving this degeneracy appears to require a significantly wider bandpass than our observations cover (such as provided by Gemini/IGRINS, e.g. Line et al., 2021), over which the planetary SED shows significant curvature. This leads to a non-linear variation in the planet/star flux ratio as a function of wavelength which cannot be fit by changes to the scale factor, instead pushing the retrieval to a profile with the correct continuum shape and absolute temperature.
For the presented retrievals, we chose a relatively tight prior bound that leads to a scale factor of approximately 1. We discuss the degeneracies in the absolute abundances in more detail in Section 4
As our observations are not flux-calibrated, we are actually fitting for the flux of the planet relative to the host star flux () using a fixed model of the stellar spectrum. This means that errors in the wavelength-dependent stellar spectrum can potentially bias the retrieved absolute planet temperature and/or scale factor. While we neglected the impacts of stellar oblateness or gravity darkening in our stellar model, the reported value for KELT-20 A (Talens et al., 2018) suggests these effects may be significant. This may lead to a bias in the retrieved temperature and/or continuum level in order to correctly match the observed with an inaccurate .
We also note that our observations were taken post-eclipse. Thus, the observed planetary disk is increasingly dominated by the morning limb over the course of our data. This phase coverage may also impact the retrieved temperature and apparent flux of the planet, as the morning/pre-dawn longitudes are expected to be substantially cooler than the dayside average.
3.3 Chemical composition
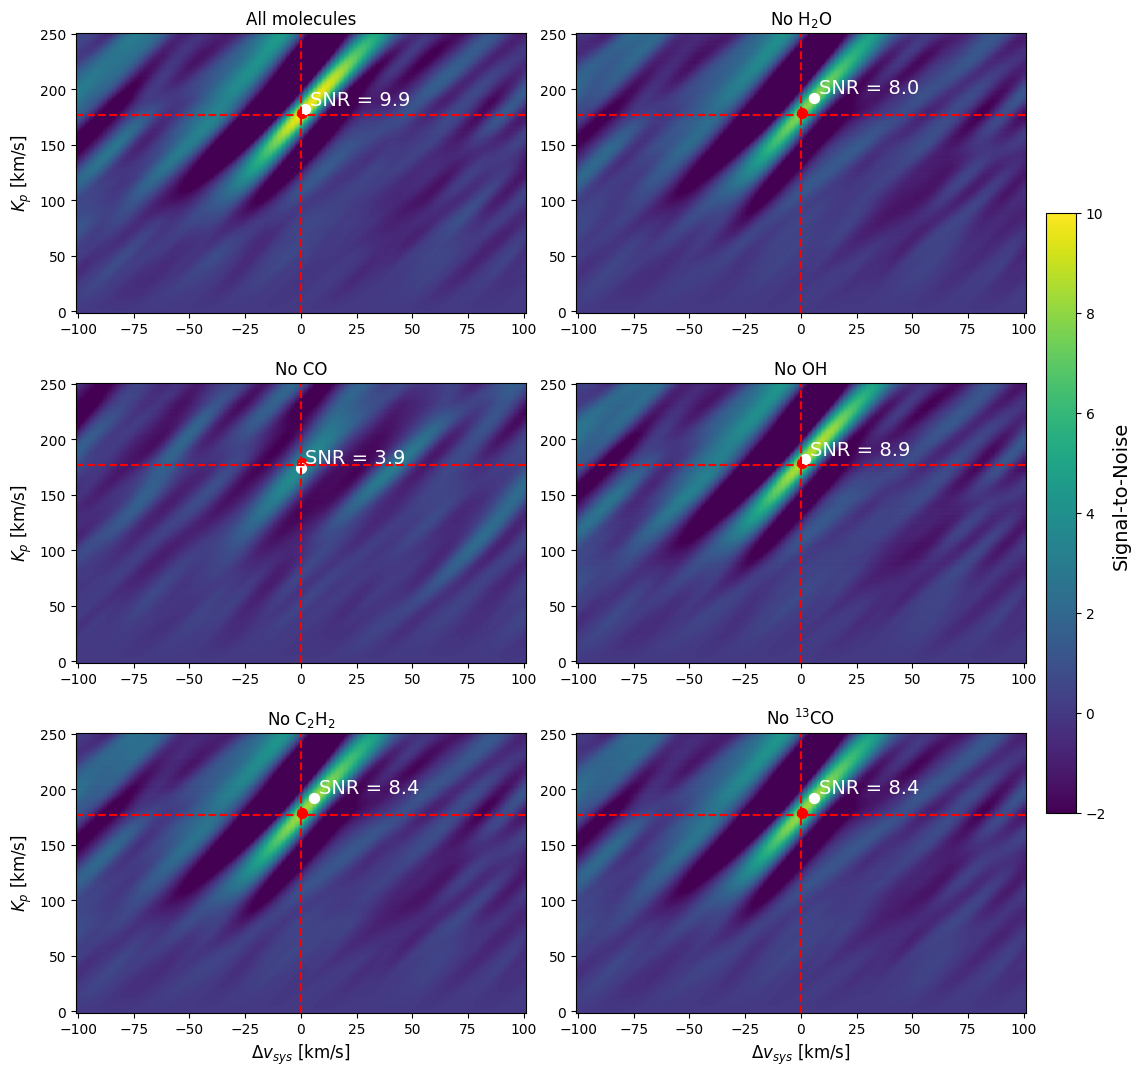
Our retrievals successfully constrain the CO abundance, and place a lower limit on the H2O abundance. The remaining species in the retrieval are unconstrained, although the OH and Fe posteriors show weak peaks and large C2H2 abundances are weakly disfavored. This is consistent with expectations based on the -band opacities (see Figure 1, bottom panel), which are dominated by CO and H2O features, as well as with previous infrared observations of UHJs (e.g. Finnerty et al., 2023a). The plots for each molecule using the maximum-likelihood model are shown in Figure 3. The contribution of each molecule towards the total detection strength is consistent with the expectation that species which are better-constrained by the retrievals are more significantly detected in the plot.
We also obtain a bounded constraint on the H2O dissociation pressure, bar. We discuss this constraint and its comparison to chemical equilibrium models in Section 4. Key here is that the retrieved H2O dissociation pressure shows a significant degeneracy with that of the CO abundance, with lower dissociation pressure corresponding to higher CO abundances. In previous HRCCS studies, molecular abundances are often correlated, as the loss of continuum information during data processing makes HRCCS retrievals more sensitive to line ratios than absolute line strengths (e.g. Finnerty et al., 2023a, 2024). In this case, the H2O feature strength appears to be set primarily by the dissociation pressure, rather than the H2O abundance, and so the degeneracy is between the CO abundance and H2O dissociation pressure rather than the abundances themselves.
3.3.1 Significance of other species
H2O dissociation is expected to produce significant quantities of OH at pressures where H2O is being dissociated. The retrieved posteriors do not provide bounded constraints on the OH abundance or the OH dissociation/formation pressures, leading to an unconstrained vertical mixing profile shown in Figure 5. Figure 1 demonstrates the comparatively low OH opacity in the -band relative to other species, which is likely the reason for the poor constraints. The insignificance of OH to the detection is further demonstrated by Figure 3, which shows that omitting OH from the maximum-likelihood model has only a marginal impact on the detection strength in the space.
The retrieved posterior weakly disfavors high C2H2 abundance, consistent with the weakness of high-temperature C2H2 spectral features in the -band. C2H2 was included in the retrievals because it can be present in significant, potentially detectable quantities for C/O ratios greater than 1, but our retrievals strongly disfavor this scenario (see Section 4). Similarly with OH, omitting C2H2 entirely from the maximum-likelihood planet model has only a minimal impact on the overall detection strength.
3.4 CO Isotopologue Ratio
Finally, the retrieved posterior places an upper limit on the CO isotopologue ratio, at 95% confidence. This is only slightly below the solar-system value of 89, and stands in contrast with previous results from KPIC observations of hot Jupiters suggesting significant 13CO enrichment (Finnerty et al., 2023a, 2024).
3.5 Number of principal components
We ran retrievals omitting 4, 6, 8 and 12 principal components in order to assess the impact of the number of dropped principal components on the retrieved posteriors. The full corner plots for each retrieval are included in Appendix A. Based on inspection of the corner plots and fringing periodograms, we adopt the 6 component case as our fiducial retrieval. The 4 component retrieval provides an unexpectedly tight constraint on the Fe abundance, and strongly prefers low values of , which are counteracted with a larger scale factor. The 8 and 12 component cases yield marginalized posteriors which are mostly compatible with the 6 component case, but significantly wider. In particular, the 8 and 12 component cases prefer higher temperatures, do not constrain the the H2O abundance or dissociation pressure, and give worse constraints on and . This suggests that in the 8 and 12 component cases the PCA is distorting/removing portions of the underlying planet spectrum, leading to worse constraints.
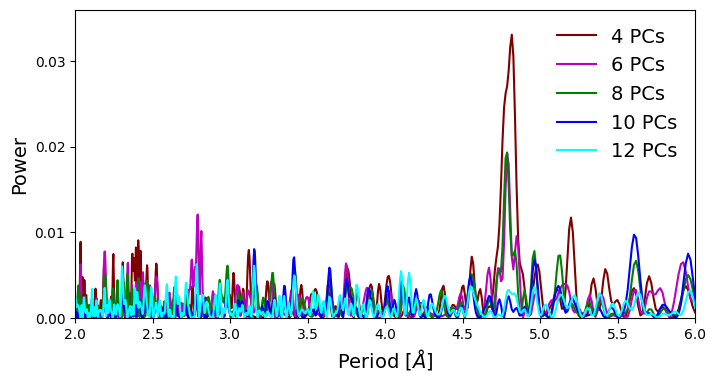
To better assess the impact of the PCA, we visually inspected the post-PCA spectral time series. This revealed clear evidence of residual fringing which has not been removed by omitting only 4 principal components, particularly at the beginning and end of the observation. To confirm this, we computed the Lomb-Scargle periodogram of the cleaned time series for order 31 after omitting 4, 6, 8, 10, and 12 principal components, shown in Figure 4. A clear peak is seen at a period of 4.8, likely corresponding to the KPIC dichroic fringing effect described in (Finnerty et al., 2022). This peak is substantially stronger when omitting only 4 components than in the 6 and 8 component cases, suggesting that the 4 component retrieval may be impacted by unremoved fringing. The fringe feature disappears from the periodogram when omitting 10 or more components, but comparing the 6 and 8 component retrievals suggests that the PCA is already beginning to significantly degrade the planet spectrum in the 8 component case. As a result, we choose the 6 component case as our fiducial retrieval for Table 2 and subsequent discussion.
4 Discussion
4.1 Atmospheric circulation
Our median retrieved values for and are compatible with the orbital ephemeris and assumed velocity parameters listed in Table 1. This suggests that the detected planetary emission is not dominated by one limb of the planet, which would lead to a net blueshift if the morning limb dominated or a redshift if the evening limb were dominating the total flux as a result of the planet’s rotation.
While the retrieved velocity parameters are consistent with the ExoFOP (2019) ephemeris, using the values from Talens et al. (2018) instead results in a blueshift. Alternatively, using period/transit time values from Lund et al. (2017); Patel & Espinoza (2022); Ivshina & Winn (2022), or Kokori et al. (2023) change the nominal planet velocities by . In some cases, propagating the reported uncertainties on the period and transit time is insufficient to explain this difference.
This discrepancy speaks to the importance of accurate knowledge of the planetary ephemeris for interpreting offsets in the diagram as a result of atmospheric circulation pattern. Inaccuracies as small as 10 minutes in the mid-transit time can lead to 10 offsets in the planet velocity in some systems (Pai Asnodkar et al., 2022), comparable to the fastest winds expected on UHJs. While transmission observations can use ingress/egress to very precisely constrain the ephemeris at the observed epoch, emission observations must rely on a preexisting ephemeris with its associated uncertainties. As a result, we suggest any attempts to interpret velocity offsets in emission observations proceed cautiously.
In the case of KELT-20 b, additional difficulties in interpreting velocity offsets arise from uncertainty in the systemic velocity of the rapidly-rotating A-type primary. Talens et al. (2018) reports a value of , while Lund et al. (2017) gives a value of . Johnson et al. (2023) report a value of , and Stangret et al. (2024) report a value of . This uncertainty is comparable to the expected wind velocities for UHJs, precluding robust measurement of wind speeds even from transmission observations (Stangret et al., 2024).
Rotational broadening of planetary lines is not expected to be sensitive to ephemeris or stellar velocity errors, providing an alternative probe of global circulation patterns for emission observations when the instrumental LSF is well-characterized, as is the case for KPIC. If the observed spectrum is dominated by the morning or evening limb of the planet, the rotation will lead to a net redshift or blueshift of the planetary atmosphere, respectively. Similarly, a strongly longitudinally-dependent wind pattern may lead to a net red/blueshift. In contrast, a symmetric eastward flowing equatorial jet would not lead to a net shift in the observed planet spectrum, but may instead appear to increase the rotational velocity of the planet beyond the expected value based on tidal locking.
Assuming a tidal locking and the parameters listed in Table 1, the expected rotational velocity of KELT-20 b is 2.7 . The retrieved value of could be explained by a 5 eastward-flowing equatorial jet dominating the observed emission and appearing to increase the rotational velocity of the planet. This is consistent with wind speeds previously reported for KELT-20 b (Casasayas-Barris et al., 2019; Nugroho et al., 2020; Stangret et al., 2020; Petz et al., 2024), and with model predictions for UHJs (e.g. Komacek et al., 2022; Beltz et al., 2022).
The retrieved rotational broadening is comparable to the instrumental resolution of NIRSPEC, increasing the line widths by only compared to the intrinsic instrumental LSF. While the large number of planet lines and the well-characterized LSF is reason to believe we can measure line broadening to the level, systematic uncertainties in the spatial/spectral profile conversion (Finnerty et al., 2022) suggest the retrieved should be taken with caution. Unambiguous measurement of may require higher spectral resolution, which will be available with Keck/HISPEC (Mawet et al., 2019).
4.2 Molecular Dissociation
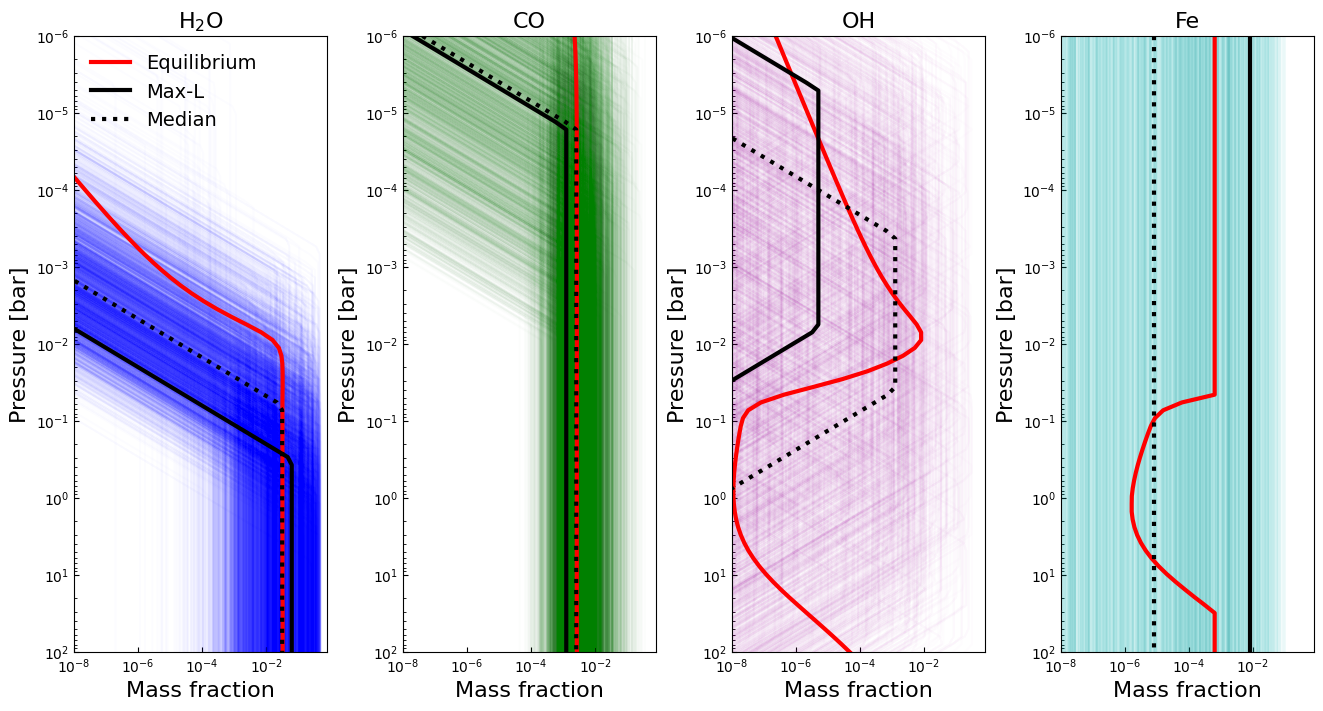
We plot the median and maximum-likelihood vertical abundance profiles compared with chemical equilibrium predictions from easyCHEM (Mollière et al., 2017; Lei & Mollière, 2024) in Figure 5. For the equilibrium prediction, we use the median profile parameters. The C/O ratio and metallicity of the equilibrium model were then adjusted by eye to roughly match the median abundance profiles, which we discuss further in the next subsection. We find a reasonable agreement between the retrieved abundance profiles and the chemical equilibrium predictions for C/O and [Fe/H] = . We discus the discrepancy between this value and our retrieved [(C+O)/H] in the following subsection.
The H2O abundance profile from the chemical equilibrium model dissociates moderately higher in the atmosphere than the abundance profile preferred by the retrieval, but is within the range of the posterior. This concurrence suggests that chemical equilibrium is a good assumption when considering only CO and H2O for KELT-20 b and assuming equilibrium may help break the previously-discussed temperature/scale factor degeneracy while reducing the number of free parameters in the retrieval. At the same time, this agreement demonstrates that free retrievals can account for vertically varying abundances with only 1-2 additional free parameters per molecule, while also retaining a flexibility for possible photochemistry.
Consistent with the non-detection of OH in Figure 3, the OH abundance profile is unconstrained. The poor OH constraint is due to the relatively low opacity of OH in the -band and is consistent with previous KPIC -band observations of WASP-33 b (Finnerty et al., 2023a). OH has been detected in -band observations of UHJs (Nugroho et al., 2021; Landman et al., 2021; Brogi et al., 2023; Weiner Mansfield et al., 2024) due to the higher line opacity in that band. Combining -band observations which constrain the abundance profiles for OH and H2O with -band observations constraining the ratio of H2O features to CO features may provide much better constraints on the bulk C/O ratio in the presence of H2O dissociation than is possible from -band observations alone. Such observations will be possible with Keck/HISPEC, which will provide high-resolution fiber-fed spectroscopy covering the full 1-2.5 m range in a single shot (Mawet et al., 2019).
4.3 Interactions between P-T and mixing profiles
While experimenting with different parameterizations of the and dissociation profiles, we encountered complicated degeneracies in the resulting posteriors and unusual behavior in the retrieved profiles. These complications all arise from the presence of two terms impacting the radiative transfer at each level of the model atmosphere, rather than one. Beginning from Kerckoff’s Law of radiative transfer, we have:
| (1) |
Where is the specific intensity, is the number density of an absorbing species at altitude , is the absorption cross section of the species, and is the Planck function evaluated at the temperature of altitude . In the case of abundances fixed with altitude, the change in intensity is set only by the change in with height, resulting in an emission contribution function which tracks the profile. However, in the case of vertically-varying abundances, can change even with an isothermal profile as a result of changes in . Depending on the specifics on the and mixing profiles, this can lead to emission contributions functions with multiple layers and/or gaps which may or may not correspond to regions of curvature in the profile.
An example of this can be seen in the upper right panel of Figure 1 showing the retrieved maximum-likelihood emission contribution function. In the bluest three orders, the emission contribution function drops off rapidly when H2O dissociation begins, only to increase again at lower pressures as the model includes increasing quantities of OH. This increase occurs even as the curvature of the profile rapidly decreases in this pressure range.
A more straightforward effect is introduced by fixing the intrinsic temperature parameter , which leads to a multimodality between the H2O abundance and dissociation pressure. Retrievals with returned posteriors with either a low H2O abundance and dissociation at or a high H2O abundance and dissociation at . The planet spectra in each mode had similar H2O feature strength, leading our free retrieval approach to not significantly prefer one mode over the other. Including as a free parameter with a lower prior bound high enough to prevent an isothermal lower atmosphere appears to break this degeneracy in favor of the high-abundance, deep-dissociation mode. Future HRCCS analyses including molecular dissociation should take take care to assess the precise impact of their parametrization on the final posterior.
As a consistency check, we also ran retrievals using a physics-free spline-based parametrization as described by Pelletier et al. (2021). The resulting profile reached a minimum of K between 1 and 0.1 bar, but the abundance/dissociation parameters were consistent with the presented values. This suggests that changes in the parametrization/limits are not strongly impacting the retrieved abundances. Using the spline-based approach significantly increases the number of free parameters in the fit, leading to longer runtimes. We also find the spline profile is prone to non-physical oscillations in the upper/lower atmosphere where the emission contribution function is negligible, even for aggressive values of the smoothing prior. We therefore prefer the Guillot (2010) approach for this work, but note that analyses covering a wider bandpass will be more favorable to spline-based approaches.
4.4 C/O and metallicity
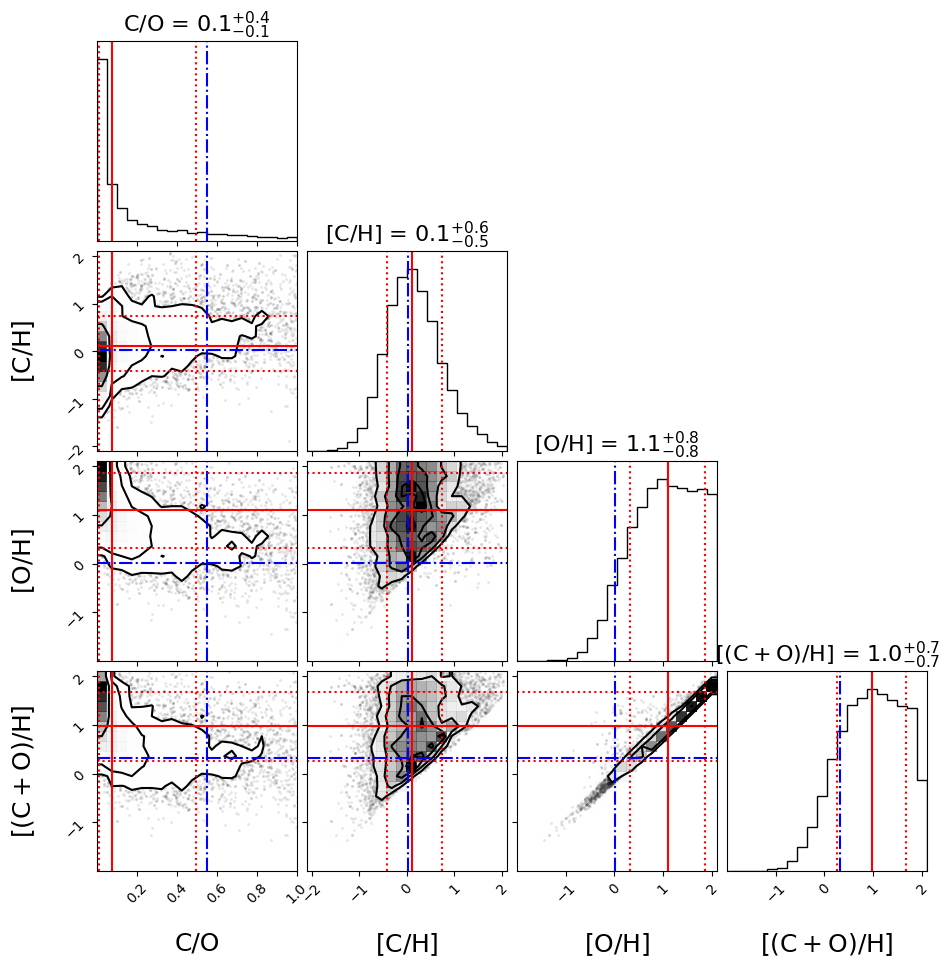
The corner plot for the retrieved C/O, [C/H], [O/H], and [(C+O)/H] values are shown in Figure 6, and the median values and confidence intervals are listed in Table 2. These posteriors were constructed from the retrieved abundances of CO, H2O, and C2H2 in order to estimate the deep atmosphere C/O ratio below any molecular dissociation, and do not account for contributions from any other species. OH is specifically omitted because it is expected to be present only in the upper atmosphere above H2O dissociation, and including both H2O and OH would therefore double count that oxygen when determining the bulk abundances.
As petitRADTRANS uses mass fractions for molecular abundances, we have thus far reported results as mass fractions. However, the C/O, O/H, and C/H values are generally reported as number fractions/volume mixing ratios. The mass fraction can be converted to the volume mixing ratio as follows:
| (2) |
Where is the volume mixing ratio of species X, is the mass fraction of species X, is the molar mass of species X, and is the mean molecular weight. The dependence on the mean molecular weight cancels when computing abundance ratios. For logarithmic mass fractions and a fixed mean molecular weight of 2.3 g/mol, , and
The median and % confidence intervals are ( at 95% confidence), , ( at 95% confidence), and ( at 95% confidence). As we retrieve only a lower limit for the H2O abundance, the oxygen abundance is similarly a lower limit, as is the total volatile abundance. Solar values for [O/H] and [(C+O)/H] from Palme et al. (2014) are disfavored at , with the maximum-likelihood parameters corresponding to a solar enrichment in oxygen. The C/O ratio posterior has a sharp cutoff at due to the preference for little/no C2H2 in the atmosphere, which leaves CO as the only carbon species in the atmosphere.
The C/O and abundance values we report are based only on the molecular species included in our retrievals, and therefore may not be an accurate estimate for the atmosphere as a whole. To address this, we compare the retrieved abundances to equilibrium chemistry models from easyCHEM (Mollière et al., 2017; Lei & Mollière, 2024), shown in Figure 5. These models scale the atomic abundances of all species except oxygen according to a single metallicity parameter, while the oxygen abundance is determined by a separate parameter setting the C/O ratio. Figure 5 compares the retrieved mixing profiles to an easyCHEM model with C/O = 0.05, [Fe/H] = –0.3, which agrees well with the lower-atmosphere abundances. While this C/O ratio is comparable to those in our retrievals, the metallicity is substantially lower than the solar volatile abundance we retrieve. The retrieved volatile enrichment is due entirely to the high retrieved oxygen abundance, which in the equilibrium models is determined by the C/O ratio once the metalicity parameter is tuned to match the carbon abundance. As a result, the equilibrium [Fe/H] parameter is not necessarily measuring the bulk metallicity in the event of a refractory/volatile ratio differing from solar.
At first glance, the low-C/O ratio composition appears to be inconsistent with the previously reported solar or slightly supersolar C/O and atmospheric metallicity for KELT-20 b from Kasper et al. (2023), who combined Spitzer, HST, and MAROON-X observations to perform a joint high/low spectral resolution retrieval. However, we note that there is a strong degeneracy in our retrievals between the CO abundance and the H2O dissociation pressure, and that our retrievals prefer H2O dissociation occurring deeper in the atmosphere than expected based on chemical equilibrium. Dissociation closer to the equilibrium expectation corresponds to an enhancement in the CO abundance, leading to a solar or slightly super-solar metallicity and increasing the C/O ratio to approximately the solar value, which is at the edge of the retrieved confidence interval for the C/O ratio.
Observations with broader wavelength coverage could reduce uncertainty in the atmospheric metallicity by observing multiple bands from the same species, which would break the degeneracy between H2O and CO abundances seen when retrieving from -band data alone. Broader wavelength coverage would also allow the detection of additional species, including refractory elements, which would constrain the atmospheric refractory/volatile ratio, which is potentially an important tracer of the planet formation process (Lothringer et al., 2021; Chachan et al., 2023), as well as provide a non-volatile probe of the atmospheric metallicity. Refractory/volatile ratio constraints have recently been demonstrated using IGRINS +-band data (Smith et al., 2024) and also using a combination of -band and optical observations (Pelletier et al., 2025). Future joint retrievals combining KPIC and optical observations will provide similar constraints. Such a joint retrieval is outside the scope of the present work.
Previous studies of UHJs have found that free retrievals with fixed abundances prefer high-metallicity, high-C/O ratio atmospheres, but that using equilibrium models to account for molecular dissociation results in less metal-rich atmospheres with a C/O ratio closer to solar/stellar values (e.g. Brogi et al., 2023; Ramkumar et al., 2023). This bias in free retrievals occurs because when ignoring dissociation, the only way to reduce the strength of H2O features relative to CO is to reduce the H2O abundance and/or increase the CO abundance, increasing the C/O ratio. In this case, we may be seeing the reverse phenomenon, where dissociation below the chemical equilibrium level is driving a higher H2O abundance, lower CO abundance, and low C/O ratio.
Enforcing chemical equilibrium accounts for dissociation, but the equilibrium assumption for hot gas giants is in tension with results from JWST transmission spectroscopy preferring significant spectral features from photochemically produced species (Tsai et al., 2023; Dyrek et al., 2024). Our retrieval of the H2O dissociation pressure for KELT-20 b indicates that free retrievals can account for dissociation without making an equilibrium assumption, providing an approach that can avoid biases from fixed vertical abundances while maintaining the flexibility to explore novel photochemical processes.
4.5 Formation history
While many ultra-hot Jupiters have significant misalignments between the planet’s orbital plane and the spin axis of the host star (e.g. Collier Cameron et al., 2010; Gaudi et al., 2017; Talens et al., 2017; Cabot et al., 2021), KELT-20 b is extremely well-aligned with its host star’s rotation (Talens et al., 2018; Singh et al., 2024). Furthermore, KELT-20A lies above the Kraft break (Kraft, 1967), in a regime where close-in giant planets are preferentially misaligned (Winn et al., 2010) and tidal realignment is likely insignificant over the lifetime of the system (Albrecht et al., 2012). This suggests KELT-20 b could possibly have formed without high-eccentricity migration, which is necessary to produce the extremely inclined/retrograde orbits seen in other UHJs (Naoz et al., 2011). Differences in the formation history of KELT-20 b compared to other UHJs could lead to an anomalous composition compared to the population as a whole.
The low-C/O, solar-to-supersolar metallicity preferred by our retrievals is consistent with general predictions from core-accretion models that these parameters are inversely correlated in exoplanet atmospheres (Espinoza et al., 2017; Madhusudhan et al., 2017; Cridland et al., 2019), and specifically with models for formation beyond the CO snow line followed by Type II migration (Khorshid et al., 2022). However, our retrievals are ambiguous as to the bulk metallicity of KELT-20 b, as we do not constrain the abundances of any refractory species. Our retrieved composition could be explained by substantial oxygen enrichment with an otherwise low metallicity, or by a carbon-poor but otherwise metal-enriched atmosphere. Further ambiguity arises from the deeper retrieved H2O dissociation pressure compared with chemical equilibrium models, which may lead to an over-estimation of the H2O abundance and corresponding under-estimation of the C/O ratio. Solar or moderately super-solar atmospheric metallicity is consistent with equilibrium retrievals of other UHJs, which have preferred solar C/O ratios for both aligned (Brogi et al., 2023) and misaligned (Ramkumar et al., 2023) systems.
In the absence of isotopologue constraints, measurements from other portions of the optical/infrared spectrum to constrain the refractory/volatile ratio could distinguish between different formation scenarios (Lothringer et al., 2021; Chachan et al., 2023). In the case of KELT-20 b, the extensive existing optical data (e.g. Johnson et al., 2023; Petz et al., 2024) may allow joint high-resolution optical/infrared retrievals and constraints on the refractory/volatile ratio without the need for additional observations.
5 Summary and Conclusions
We performed atmospheric retrievals on high-resolution post-eclipse -band observations of the ultra-hot Jupiter KELT-20 b/MASCARA-2b. Using a free-retrieval framework including molecular dissociation, we constrain the abundance of CO and place a lower limit on the abundance of H2O, finding the atmosphere of KELT-20 b is consistent with an oxygen-rich ( at 95% confidence) composition. The retrieved H2O dissociation pressure and molecular abundances are roughly consistent with predictions from equilibrium chemistry models having C/O 0.05 and metallicity solar, but the lack of refractory species detections limits our ability to constrain the bulk metallicity. We also constrain the rotational broadening of KELT-20 b to . This is larger than the value expected from tidally locked rotation, and is consistent with a supersonic day-to-night wind. Such a wind is consistent with results from other UHJs and with predictions from GCMs, but the relatively low spectral resolution of KPIC results in a significant systematic uncertainty in the retrieved rotational velocity.
Appendix A Corner Plots
Figures 7, 8, 9, and 10 present the full corner plots from the retrievals omitting 4, 6, 8, and 12 principal components respectively. The units, priors, and retrieved quantity are listed in Table 2. In cases where parameters are well-constrained, the plotting limits have been adjusted to focus on the posterior rather than spanning the full prior. The truncated normal prior for the scale factor is overplotted in green. All other parameters used a normal prior covering the full range listed in Table 2.
References
- Albrecht et al. (2012) Albrecht, S., Winn, J. N., Johnson, J. A., et al. 2012, ApJ, 757, 18, doi: 10.1088/0004-637X/757/1/18
- Astropy Collaboration et al. (2013) Astropy Collaboration, Robitaille, T. P., Tollerud, E. J., et al. 2013, A&A, 558, A33, doi: 10.1051/0004-6361/201322068
- Astropy Collaboration et al. (2018) Astropy Collaboration, Price-Whelan, A. M., Sipőcz, B. M., et al. 2018, AJ, 156, 123, doi: 10.3847/1538-3881/aabc4f
- Bazinet et al. (2024) Bazinet, L., Pelletier, S., Benneke, B., Salinas, R., & Mace, G. N. 2024, AJ, 167, 206, doi: 10.3847/1538-3881/ad3071
- Beltz et al. (2022) Beltz, H., Rauscher, E., M. -R Kempton, E., et al. 2022, arXiv e-prints, arXiv:2204.12996. https://arxiv.org/abs/2204.12996
- Brogi & Line (2019) Brogi, M., & Line, M. R. 2019, AJ, 157, 114, doi: 10.3847/1538-3881/aaffd3
- Brogi et al. (2023) Brogi, M., Emeka-Okafor, V., Line, M. R., et al. 2023, AJ, 165, 91, doi: 10.3847/1538-3881/acaf5c
- Buchner (2014) Buchner, J. 2014, arXiv e-prints, arXiv:1407.5459. https://arxiv.org/abs/1407.5459
- Cabot et al. (2021) Cabot, S. H. C., Bello-Arufe, A., Mendonça, J. M., et al. 2021, AJ, 162, 218, doi: 10.3847/1538-3881/ac1ba3
- Carvalho & Johns-Krull (2023) Carvalho, A., & Johns-Krull, C. M. 2023, Research Notes of the American Astronomical Society, 7, 91, doi: 10.3847/2515-5172/acd37e
- Casasayas-Barris et al. (2019) Casasayas-Barris, N., Pallé, E., Yan, F., et al. 2019, A&A, 628, A9, doi: 10.1051/0004-6361/201935623
- Chachan et al. (2023) Chachan, Y., Knutson, H. A., Lothringer, J., & Blake, G. A. 2023, ApJ, 943, 112, doi: 10.3847/1538-4357/aca614
- Cheverall et al. (2023) Cheverall, C. J., Madhusudhan, N., & Holmberg, M. 2023, MNRAS, 522, 661, doi: 10.1093/mnras/stad648
- Chubb et al. (2020) Chubb, K. L., Tennyson, J., & Yurchenko, S. N. 2020, MNRAS, 493, 1531, doi: 10.1093/mnras/staa229
- Collier Cameron et al. (2010) Collier Cameron, A., Guenther, E., Smalley, B., et al. 2010, MNRAS, 407, 507, doi: 10.1111/j.1365-2966.2010.16922.x
- Cridland et al. (2019) Cridland, A. J., van Dishoeck, E. F., Alessi, M., & Pudritz, R. E. 2019, A&A, 632, A63, doi: 10.1051/0004-6361/201936105
- Cutri et al. (2003) Cutri, R. M., Skrutskie, M. F., van Dyk, S., et al. 2003, VizieR Online Data Catalog, II/246
- Delorme et al. (2021) Delorme, J.-R., Jovanovic, N., Echeverri, D., et al. 2021, Journal of Astronomical Telescopes, Instruments, and Systems, 7, 035006, doi: 10.1117/1.JATIS.7.3.035006
- Dyrek et al. (2024) Dyrek, A., Min, M., Decin, L., et al. 2024, Nature, 625, 51, doi: 10.1038/s41586-023-06849-0
- Echeverri et al. (2022) Echeverri, D., Jovanovic, N., Delorme, J.-R., et al. 2022, in Ground-based and Airborne Instrumentation for Astronomy IX, ed. C. J. Evans, J. J. Bryant, & K. Motohara, Vol. 12184, International Society for Optics and Photonics (SPIE), 121841W, doi: 10.1117/12.2630518
- Espinoza et al. (2017) Espinoza, N., Fortney, J. J., Miguel, Y., Thorngren, D., & Murray-Clay, R. 2017, ApJ, 838, L9, doi: 10.3847/2041-8213/aa65ca
- ExoFOP (2019) ExoFOP. 2019, Exoplanet Follow-up Observing Program - TESS, IPAC, doi: 10.26134/EXOFOP3
- Feroz & Hobson (2008) Feroz, F., & Hobson, M. P. 2008, MNRAS, 384, 449, doi: 10.1111/j.1365-2966.2007.12353.x
- Feroz et al. (2009) Feroz, F., Hobson, M. P., & Bridges, M. 2009, MNRAS, 398, 1601, doi: 10.1111/j.1365-2966.2009.14548.x
- Feroz et al. (2019) Feroz, F., Hobson, M. P., Cameron, E., & Pettitt, A. N. 2019, The Open Journal of Astrophysics, 2, 10, doi: 10.21105/astro.1306.2144
- Finnerty et al. (2022) Finnerty, L., Schofield, T., Delorme, J.-R., et al. 2022, in Ground-based and Airborne Instrumentation for Astronomy IX, ed. C. J. Evans, J. J. Bryant, & K. Motohara, Vol. 12184, International Society for Optics and Photonics (SPIE), 121844Y, doi: 10.1117/12.2630276
- Finnerty et al. (2023a) Finnerty, L., Schofield, T., Sappey, B., et al. 2023a, AJ, 166, 31, doi: 10.3847/1538-3881/acda91
- Finnerty et al. (2023b) Finnerty, L., Horstman, K., Ruffio, J.-B., et al. 2023b, in Society of Photo-Optical Instrumentation Engineers (SPIE) Conference Series, Vol. 12680, Society of Photo-Optical Instrumentation Engineers (SPIE) Conference Series, 1268006, doi: 10.1117/12.2677777
- Finnerty et al. (2024) Finnerty, L., Xuan, J. W., Xin, Y., et al. 2024, AJ, 167, 43, doi: 10.3847/1538-3881/ad1180
- Finnerty et al. (2025) Finnerty, L., Xin, Y., Xuan, J. W., et al. 2025, The Astronomical Journal, 169, 94, doi: 10.3847/1538-3881/ada1d9
- Foreman-Mackey (2016) Foreman-Mackey, D. 2016, The Journal of Open Source Software, 1, 24, doi: 10.21105/joss.00024
- Fu et al. (2022) Fu, G., Sing, D. K., Lothringer, J. D., et al. 2022, ApJ, 925, L3, doi: 10.3847/2041-8213/ac4968
- Gaia Collab. et al. (2021) Gaia Collab., Brown, A. G. A., Vallenari, A., et al. 2021, A&A, 649, A1, doi: 10.1051/0004-6361/202039657
- Gandhi et al. (2023) Gandhi, S., Kesseli, A., Zhang, Y., et al. 2023, AJ, 165, 242, doi: 10.3847/1538-3881/accd65
- Gaudi et al. (2017) Gaudi, B. S., Stassun, K. G., Collins, K. A., et al. 2017, Nature, 546, 514, doi: 10.1038/nature22392
- Gibson et al. (2022) Gibson, N. P., Nugroho, S. K., Lothringer, J., Maguire, C., & Sing, D. K. 2022, MNRAS, 512, 4618, doi: 10.1093/mnras/stac091
- Gordon et al. (2022) Gordon, I. E., Rothman, L. S., Hargreaves, R. J., et al. 2022, J. Quant. Spec. Radiat. Transf., 277, 107949, doi: 10.1016/j.jqsrt.2021.107949
- Grimm et al. (2021) Grimm, S. L., Malik, M., Kitzmann, D., et al. 2021, ApJS, 253, 30, doi: 10.3847/1538-4365/abd773
- Guillot (2010) Guillot, T. 2010, A&A, 520, A27, doi: 10.1051/0004-6361/200913396
- Harris et al. (2020) Harris, C. R., Millman, K. J., van der Walt, S. J., et al. 2020, Nature, 585, 357, doi: 10.1038/s41586-020-2649-2
- Hoeijmakers et al. (2024) Hoeijmakers, H. J., Kitzmann, D., Morris, B. M., et al. 2024, A&A, 685, A139, doi: 10.1051/0004-6361/202244968
- Holtzman et al. (2018) Holtzman, J. A., Hasselquist, S., Shetrone, M., et al. 2018, AJ, 156, 125, doi: 10.3847/1538-3881/aad4f9
- Horne (1986) Horne, K. 1986, PASP, 98, 609, doi: 10.1086/131801
- Hunter (2007) Hunter, J. D. 2007, Computing in Science & Engineering, 9, 90, doi: 10.1109/MCSE.2007.55
- Husser et al. (2013) Husser, T. O., Wende-von Berg, S., Dreizler, S., et al. 2013, A&A, 553, A6, doi: 10.1051/0004-6361/201219058
- Ivshina & Winn (2022) Ivshina, E. S., & Winn, J. N. 2022, ApJS, 259, 62, doi: 10.3847/1538-4365/ac545b
- Johnson et al. (2023) Johnson, M. C., Wang, J., Asnodkar, A. P., et al. 2023, AJ, 165, 157, doi: 10.3847/1538-3881/acb7e2
- Jovanovic et al. (2025) Jovanovic, N., Echeverri, D., Delorme, J.-R., et al. 2025, arXiv e-prints, arXiv:2502.01863, doi: 10.48550/arXiv.2502.01863
- Kasper et al. (2023) Kasper, D., Bean, J. L., Line, M. R., et al. 2023, AJ, 165, 7, doi: 10.3847/1538-3881/ac9f40
- Khorshid et al. (2022) Khorshid, N., Min, M., Désert, J. M., Woitke, P., & Dominik, C. 2022, A&A, 667, A147, doi: 10.1051/0004-6361/202141455
- Kokori et al. (2023) Kokori, A., Tsiaras, A., Edwards, B., et al. 2023, ApJS, 265, 4, doi: 10.3847/1538-4365/ac9da4
- Komacek et al. (2022) Komacek, T. D., Tan, X., Gao, P., & Lee, E. K. H. 2022, arXiv e-prints, arXiv:2205.07834. https://arxiv.org/abs/2205.07834
- Kraft (1967) Kraft, R. P. 1967, ApJ, 150, 551, doi: 10.1086/149359
- Landman et al. (2021) Landman, R., Sánchez-López, A., Mollière, P., et al. 2021, A&A, 656, A119, doi: 10.1051/0004-6361/202141696
- Lei & Mollière (2024) Lei, E., & Mollière, P. 2024, arXiv e-prints, arXiv:2410.21364, doi: 10.48550/arXiv.2410.21364
- Lesjak et al. (2023) Lesjak, F., Nortmann, L., Yan, F., et al. 2023, A&A, 678, A23, doi: 10.1051/0004-6361/202347151
- Lesjak et al. (2025) Lesjak, F., Nortmann, L., Cont, D., et al. 2025, A&A, 693, A72, doi: 10.1051/0004-6361/202451391
- Li et al. (2015) Li, G., Gordon, I. E., Rothman, L. S., et al. 2015, ApJS, 216, 15, doi: 10.1088/0067-0049/216/1/15
- Line et al. (2021) Line, M. R., Brogi, M., Bean, J. L., et al. 2021, Nature, 598, 580, doi: 10.1038/s41586-021-03912-6
- López et al. (2020) López, R. A., Hoffman, E. B., Doppmann, G., et al. 2020, in Society of Photo-Optical Instrumentation Engineers (SPIE) Conference Series, Vol. 11447, Society of Photo-Optical Instrumentation Engineers (SPIE) Conference Series, 114476B, doi: 10.1117/12.2563075
- Lothringer et al. (2021) Lothringer, J. D., Rustamkulov, Z., Sing, D. K., et al. 2021, ApJ, 914, 12, doi: 10.3847/1538-4357/abf8a9
- Lund et al. (2017) Lund, M. B., Rodriguez, J. E., Zhou, G., et al. 2017, AJ, 154, 194, doi: 10.3847/1538-3881/aa8f95
- Madhusudhan et al. (2017) Madhusudhan, N., Bitsch, B., Johansen, A., & Eriksson, L. 2017, MNRAS, 469, 4102, doi: 10.1093/mnras/stx1139
- Martin et al. (2018) Martin, E. C., Fitzgerald, M. P., McLean, I. S., et al. 2018, in Society of Photo-Optical Instrumentation Engineers (SPIE) Conference Series, Vol. 10702, Ground-based and Airborne Instrumentation for Astronomy VII, ed. C. J. Evans, L. Simard, & H. Takami, 107020A, doi: 10.1117/12.2312266
- Mawet et al. (2019) Mawet, D., Fitzgerald, M., Konopacky, Q., et al. 2019, doi: 10.48550/ARXIV.1908.03623
- McLean et al. (1998) McLean, I. S., Becklin, E. E., Bendiksen, O., et al. 1998, in Society of Photo-Optical Instrumentation Engineers (SPIE) Conference Series, Vol. 3354, Infrared Astronomical Instrumentation, ed. A. M. Fowler, 566–578, doi: 10.1117/12.317283
- Mollière et al. (2017) Mollière, P., van Boekel, R., Bouwman, J., et al. 2017, A&A, 600, A10, doi: 10.1051/0004-6361/201629800
- Mollière et al. (2019) Mollière, P., Wardenier, J. P., van Boekel, R., et al. 2019, A&A, 627, A67, doi: 10.1051/0004-6361/201935470
- Mollière et al. (2020) Mollière, P., Stolker, T., Lacour, S., et al. 2020, A&A, 640, A131, doi: 10.1051/0004-6361/202038325
- Naoz et al. (2011) Naoz, S., Farr, W. M., Lithwick, Y., Rasio, F. A., & Teyssandier, J. 2011, Nature, 473, 187, doi: 10.1038/nature10076
- Nasedkin et al. (2024) Nasedkin, E., Mollière, P., & Blain, D. 2024, Journal of Open Source Software, 9, 5875, doi: 10.21105/joss.05875
- Nugroho et al. (2020) Nugroho, S. K., Gibson, N. P., de Mooij, E. J. W., et al. 2020, MNRAS, 496, 504, doi: 10.1093/mnras/staa1459
- Nugroho et al. (2021) Nugroho, S. K., Kawahara, H., Gibson, N. P., et al. 2021, ApJ, 910, L9, doi: 10.3847/2041-8213/abec71
- Pai Asnodkar et al. (2022) Pai Asnodkar, A., Wang, J., Eastman, J. D., et al. 2022, AJ, 163, 155, doi: 10.3847/1538-3881/ac51d2
- Palme et al. (2014) Palme, H., Lodders, K., & Jones, A. 2014, in Planets, Asteriods, Comets and The Solar System, ed. A. M. Davis, Vol. 2, 15–36
- Patel & Espinoza (2022) Patel, J. A., & Espinoza, N. 2022, AJ, 163, 228, doi: 10.3847/1538-3881/ac5f55
- Pelletier et al. (2021) Pelletier, S., Benneke, B., Darveau-Bernier, A., et al. 2021, AJ, 162, 73, doi: 10.3847/1538-3881/ac0428
- Pelletier et al. (2023) Pelletier, S., Benneke, B., Ali-Dib, M., et al. 2023, Nature, 619, 491, doi: 10.1038/s41586-023-06134-0
- Pelletier et al. (2025) Pelletier, S., Benneke, B., Chachan, Y., et al. 2025, AJ, 169, 10, doi: 10.3847/1538-3881/ad8b28
- Petz et al. (2024) Petz, S., Johnson, M. C., Asnodkar, A. P., et al. 2024, MNRAS, 527, 7079, doi: 10.1093/mnras/stad3481
- Pino et al. (2022) Pino, L., Brogi, M., Désert, J. M., et al. 2022, A&A, 668, A176, doi: 10.1051/0004-6361/202244593
- Polyansky et al. (2018) Polyansky, O. L., Kyuberis, A. A., Zobov, N. F., et al. 2018, MNRAS, 480, 2597, doi: 10.1093/mnras/sty1877
- Ramkumar et al. (2023) Ramkumar, S., Gibson, N. P., Nugroho, S. K., Maguire, C., & Fortune, M. 2023, MNRAS, 525, 2985, doi: 10.1093/mnras/stad2476
- Rice et al. (2022) Rice, M., Wang, S., & Laughlin, G. 2022, ApJ, 926, L17, doi: 10.3847/2041-8213/ac502d
- Rothman et al. (2010) Rothman, L. S., Gordon, I. E., Barber, R. J., et al. 2010, J. Quant. Spec. Radiat. Transf., 111, 2139, doi: 10.1016/j.jqsrt.2010.05.001
- Savel et al. (2022) Savel, A. B., Kempton, E. M. R., Malik, M., et al. 2022, ApJ, 926, 85, doi: 10.3847/1538-4357/ac423f
- Sing et al. (2024) Sing, D. K., Rustamkulov, Z., Thorngren, D. P., et al. 2024, Nature, 630, 831, doi: 10.1038/s41586-024-07395-z
- Singh et al. (2024) Singh, V., Scandariato, G., Smith, A. M. S., et al. 2024, A&A, 683, A1, doi: 10.1051/0004-6361/202347533
- Smith et al. (2024) Smith, P. C. B., Sanchez, J. A., Line, M. R., et al. 2024, AJ, 168, 293, doi: 10.3847/1538-3881/ad8574
- Speagle (2020) Speagle, J. S. 2020, MNRAS, 493, 3132, doi: 10.1093/mnras/staa278
- Stangret et al. (2020) Stangret, M., Casasayas-Barris, N., Pallé, E., et al. 2020, A&A, 638, A26, doi: 10.1051/0004-6361/202037541
- Stangret et al. (2024) Stangret, M., Fossati, L., D’Arpa, M. C., et al. 2024, A&A, 692, A76, doi: 10.1051/0004-6361/202451277
- Talens et al. (2017) Talens, G. J. J., Albrecht, S., Spronck, J. F. P., et al. 2017, A&A, 606, A73, doi: 10.1051/0004-6361/201731282
- Talens et al. (2018) Talens, G. J. J., Justesen, A. B., Albrecht, S., et al. 2018, A&A, 612, A57, doi: 10.1051/0004-6361/201731512
- Tsai et al. (2021) Tsai, S.-M., Malik, M., Kitzmann, D., et al. 2021, ApJ, 923, 264, doi: 10.3847/1538-4357/ac29bc
- Tsai et al. (2023) Tsai, S.-M., Lee, E. K. H., Powell, D., et al. 2023, Nature, 617, 483, doi: 10.1038/s41586-023-05902-2
- van Sluijs et al. (2023) van Sluijs, L., Birkby, J. L., Lothringer, J., et al. 2023, MNRAS, 522, 2145, doi: 10.1093/mnras/stad1103
- Virtanen et al. (2020) Virtanen, P., Gommers, R., Oliphant, T. E., et al. 2020, Nature Methods, 17, 261, doi: 10.1038/s41592-019-0686-2
- Wardenier et al. (2021) Wardenier, J. P., Parmentier, V., Lee, E. K. H., Line, M. R., & Gharib-Nezhad, E. 2021, MNRAS, 506, 1258, doi: 10.1093/mnras/stab1797
- Weiner Mansfield et al. (2024) Weiner Mansfield, M., Line, M. R., Wardenier, J. P., et al. 2024, AJ, 168, 14, doi: 10.3847/1538-3881/ad4a5f
- Welbanks et al. (2024) Welbanks, L., Bell, T. J., Beatty, T. G., et al. 2024, Nature, 630, 836, doi: 10.1038/s41586-024-07514-w
- Winn et al. (2010) Winn, J. N., Fabrycky, D., Albrecht, S., & Johnson, J. A. 2010, ApJ, 718, L145, doi: 10.1088/2041-8205/718/2/L145
- Yan et al. (2022) Yan, F., Pallé, E., Reiners, A., et al. 2022, A&A, 661, L6, doi: 10.1051/0004-6361/202243503
- Yousefi et al. (2018) Yousefi, M., Bernath, P. F., Hodges, J., & Masseron, T. 2018, Journal of Quantitative Spectroscopy and Radiative Transfer, 217, 416, doi: https://doi.org/10.1016/j.jqsrt.2018.06.016
- Yurchenko et al. (2018) Yurchenko, S. N., Al-Refaie, A. F., & Tennyson, J. 2018, A&A, 614, A131, doi: 10.1051/0004-6361/201732531