Rapid prediction of organisation in engineered corneal, glial and fibroblast tissues using machine learning and biophysical models
Abstract
We present a machine learning approach for predicting the organisation of corneal, glial and fibroblast cells in 3D cultures used for tissue engineering. Our machine-learning-based method uses a powerful generative adversarial network architecture called pix2pix, which we train using results from biophysical contractile network dipole orientation (CONDOR) simulations. In the following, we refer to the machine learning method as the RAPTOR (RApid Prediction of Tissue ORganisation) approach. A training data set containing a range of CONDOR simulations is created, covering a range of underlying model parameters. Validation of the trained neural network is carried out by comparing predictions with cultured glial, corneal, and fibroblast tissues, with good agreements for both CONDOR and RAPTOR approaches. An approach is developed to determine CONDOR model parameters for specific tissues using a fit to tissue properties. RAPTOR outputs a variety of tissue properties, including cell densities of cell alignments and tension. Since it is fast, it could be valuable for the design of tethered moulds for tissue growth.
I Introduction
Cultured tissues are complex and expensive to design, and tools to help this design process would be valuable. While cells self-organise in a bottom-up process, design of moulds and scaffolds for tissue growth is easiest from a top-down perspective. The costs associated with growing tissues for experimental mould design can be significant, and individual tissues may fail during the growth process further increasing expenditure. Tools to carry out simulations and make predictions are important to assist with this design process.
The self-organisation of cells is key to tissue function. Highly-aligned myocytes form into muscles [1, 2]. The cells and matrix of corneal cells organise to create its optical and mechanical properties [3]. Highly aligned fibroblasts are key to the healing process [4]. Recently, cultured tissues have been developed that emulate the function and structure of naturally occurring tissues in humans and other animals, with applications including regenerative medicine [5], cultivated meats [6] and assays for pharmacological testing [7, 8]. Improved control over cell organisation in cultivated tissues could lead to benefits for e.g. engineered tendon, skeletal muscle, nerve tissue and dentine [9]. For pharmaceutical testing, cultured tissues with cell organisations that closely replicate naturally occurring tissues are needed, as this can affect gene expression [10]. For cultivated meat, cell function is less important, however the overall structure of myocytes, adipocytes and matrix in the tissue has important implications for taste and texture [6].
The contractile network dipole orientation (CONDOR) method is a useful tool for the design of scaffolds for tissue growth [11, 12, 13]. For scoping out designs, it offers a cheaper and faster alternative to lab work as it is self-analysing rather than needing extensive microscopy, and can be run as a massively parallel process with scaffolds and moulds designed automatically [12, 13]. The size and shape of cultivated tissues depends on the application. For nerve, long thin cylinders are needed, whereas for skin or cornea a square or round sheet might be preferred. The target structure of the tissue may also vary. For example, cultured tissues for neural engineering may need to maximise total alignment (i.e. minimise the volume of any unaligned area) and have even and consistent alignment throughout the material. Other aspects of the tissue may also need optimising. For example, when tissues are grown in moulds, residual tension might be problematic if the tissue needs to be removed from the mould. Furthermore, there may be other practical issues providing constraints on mould designs, such as the material used to make the mould and the mould manufacture technique, both of which can limit its possible dimensions. Also moulds need to be sterile or easily sterilised and suitable for immersion in media in an incubator. All these tissue properties and constraints can be explored within CONDOR simulations.
Machine learning techniques based on CONDOR can speed up the prediction of self-organisation in tissues, opening the possibility of real-time design. As proof of concept, an implementation of the pix2pix generative adversarial network architecture [14] was trained using a single cell-matrix interaction parameter consistent with 3D cultures of glial cells [12]. Given an input image representing the shape of a tethered mould, the resulting CONDOR-ML approach makes very rapid predictions of cell organisation in cultured glial tissues [12]. A limitation of CONDOR-ML is that it has fixed interaction and ECM parameters, however, these can vary for other tissue and 3D culture types.
The purpose of this paper is to introduce and validate machine learning tools for the rapid prediction of tissue orientation (RAPTOR) for a variety of 3D tissue cultures. RAPTOR extends CONDOR-ML by including the possibility to change the underlying CONDOR parameters (i.e. to simulate tissues with a range of cell and matrix types). As part of a mould design process, the method could be useful to find ways to grow highly aligned tissues, to minimise tissue tension and also determine suitable matrix properties. Comparison is made with archived data for cultured tissue made from glial cells, tenocytes, myoblasts, corneal stromal cells and dermal fibroblasts. In this paper, we will focus on tissues grown in tethered cell-laden hydrogels, one of several strategies for culturing tissues [5].
II Methods
II.1 Contractile Network Dipole Orientation Model
The minimum energy state of the contractile network dipole orientation (CONDOR) model, determined using simulated annealing, was used to find the self-organisation cells in tissues [11]. It is scale independent, with all results given in terms of dimensionless quantities. The model comprises cells interacting through a contractile network of bonds,
| (1) |
where the total energy of the system of cells and force dipoles is , is the displacement between cells and . The modification to the equilibrium bond length by active forces leads to cell-matrix interaction,
| (2) |
where the strength of the cell-matrix interaction is provided by the dimensionless number, . The dimensionless spring constant, , is varied. The orientations of cells and bonds are represented by unitary vectors and respectively. The nearest-neighbour spring constant, , sets the energy scale. and , are the next-next-nearest and next-next-next-nearest neighbour spring constants, respectively. Initially, cells are arranged on a face centre cubic (FCC) lattice. Tension in the bond is given by . Simulation predictions are invariant with regard to choice of .
The lowest energy configuration of Eq. 1 was determined with simulated annealing. The orientation of cells and their positions were changed on each of iterations (total cell number is ). Changes were accepted according to the Metropolis condition, with the anneal temperature (which is not the actual temperature of the cells) reduced by a factor from an initial anneal temperature of . For the mould sizes selected, this schedule leads to well optimised cell and matrix organisations. Each cell that moves outside the mould is subject to a large penalty. It takes approximately 24-36 core hours to run the CONDOR simulations for a mould with cells. Other uses of CONDOR can be found in Ref. [11, 12, 13].
II.2 Training Data
Training data sets were generated by automatically constructing random mould designs and tether layouts that are then used as inputs to CONDOR simulations, as described in Ref. [12]. In this work, model parameters varying in the training data set are , and . (All simulations used to generate training data in Ref. [12] were run with fixed and ). By allowing these parameters to vary within the training data, they can be used to modulate predictions produced by the final trained model, thus allowing predictions for arbitrary choices of parameter values.
Values for all three parameters are assigned within the mould generation process for each simulation input. Values for were generated from a uniform random deviate with fixed range . Both and were jointly generated from a 2D uniform distribution with and , with an additional bound of . An additional set of 500 simulations (approximately 1/8th of the total) was created using instances where was set to either or , in order to improve the representation of cases at the edges of the parameter space.
CONDOR simulations were made to simulate growth of cultured tissues in the randomly created moulds for a set of randomly selected parameter values. A total of of unique simulations were run in parallel on a multi-core machine and were divided into two disjoint sets to be used for training and evaluation of the machine learning model. Of these, were set aside to use as test data, while the remaining were used in training and validation.
Augmentations were applied to the training and validation set. These consisted of combinations of multiple transformations applied to both mould shapes and simulation results, including mirroring in both the and axes and rotations in increments of degrees. Any duplicate moulds arising due to underlying mould symmetries were removed. The total number of training and validation examples including augmentations was .
II.3 Machine Learning
The RAPTOR machine learning approach developed here is adapted from the pix2pix conditional generative adversarial network (CGAN), which we implemented using the TensorFlow framework, in a similar way to the CONDOR-ML approach in Ref. [12]. The key extension to previous work is the inclusion of the model parameters and as inputs to the machine learning approach. This allows for the prediction of properties associated with a broader range of cultivated tissue types.
The pix2pix model learns a mapping between input and output images. For our implementation 256256 pixel images were used for input and output. The input consisted of 5 channels representing both the mould design and the simulation parameters. The output comprised 8 channels predicting the properties of both matrix and cells. The pixel size was set to .
The five input layers are as follows: Two input layers describe the mould design, representing the layout of the mould depression (the initial shape of the cellular hydrogel) and the tether placement respectively. Both layers are arrays of boolean values representing the presence or absence of the depression or tethers respectively. Boolean values in the depression layer relating to tether locations are set to false. Three additional input layers correspond to the parameters used in the simulation; , and . They are input into the model as 256256 arrays with a single repeated value of the parameter for compatibility with the pix2pix architecture.
The eight output layers of the model correspond to the properties of the cultured tissue predicted by the simulation: the cell density (), orientation vector products (, , , , and ), and average strain in adjacent bonds (, where is the average tension in adjacent bonds).
Results from CONDOR simulations consist of a set of cell positions, orientations and ECM bond tensions. We transform this data into a set of continuous 2D distributions to be plotted as 256256 pixel images for training the machine learning model. The value for a cell property in each pixel () is calculated using a weighted sum from all nearby cells via,
| (3) |
where is the value an individual cell property, and is the corresponding weight. As in Ref. [12]. Upper case letters denote continuous field properties and lower case letters discreet cell properties. We use to calculate the density field. Weights are calculated using a multivariate Gaussian density function centred on a cell position and integrated over the pixel area,
| (4) |
where and are the cell coordinates from the CONDOR simulation, and are the central coordinates of the pixel; these are all in units of . sets the width of the Gaussian; we set to ensure the resulting image is smooth but not lacking structure. All property fields in the training data are uniformly scaled to range from to .
All continuous fields are inherently proportional to the density field. To ensure that the sum over pixels of the output fields agrees with averages over cell properties they are normalised via:
| (5) |
where is the total number of pixels and is the total number of cells.
III Results
III.1 Predictive capability of RAPTOR
The predictive capacity of the trained RAPTOR model is initially tested against the test data set of CONDOR simulations that was set aside from the training data (Sec. II.2).
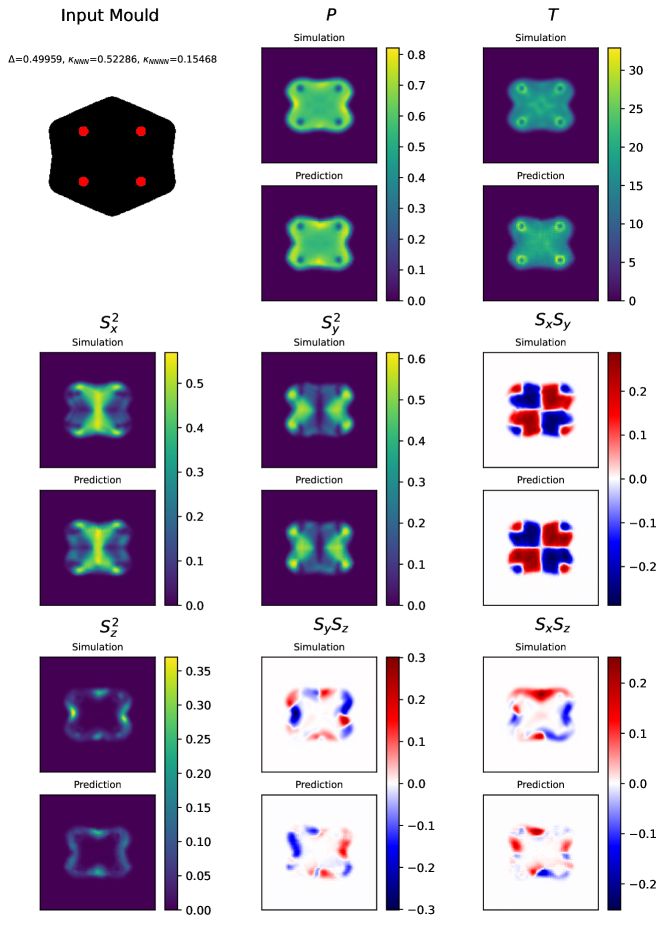
A representative visual comparison shown in Fig. 1 demonstrates good agreement between CONDOR simulation results and RAPTOR predictions for an example mould in the test set. For this case the mould has double mirror symmetry and intermediate valued simulation parameters. Most of the output fields show very good agreement, including density , tension (strain) , and alignment product fields , and . The density field shows accurate prediction of the shape of the cultured tissue. The strain (tension) has approximately the correct range and structure, although some of the finer structure is missing. Predictions of are accurate and the correct positions for sign changes are predicted. and predictions are very accurate, and the model has additionally learned that these fields are approximate inverses of each other. The fields depending on (which are less important since cells are mostly directed within the -plane), , and , show good magnitude, but the locations of the sign changes are shifted.
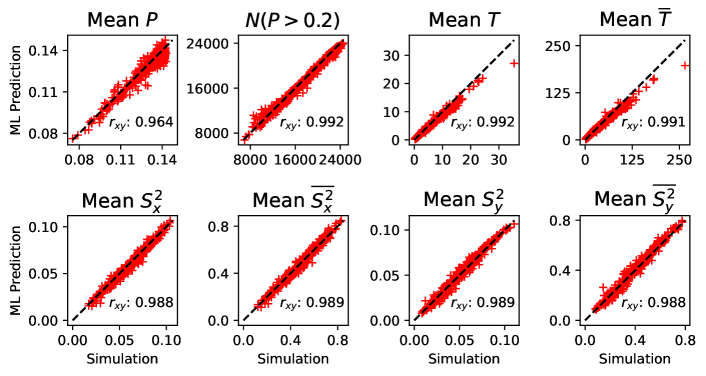
Comparisons between the mean values of tissue properties for RAPTOR and CONDOR predictions show good agreement across the entire test data set. Figure 2 shows comparisons of mean density , total tissue area (represented by the number of pixels with density less than , ), and the mean values for tension , and as well as their density normalised equivalents (, and ). Perfect agreement is indicated by the dashed diagonal line.
The scatter graphs show very good agreement, with points situated close to the line of perfect agreement and high Pearson correlation coefficient () values. A single outlier can be seen in the comparisons for tension (both and ) in which the machine learning model under-predicts an otherwise large value mean tension value. This corresponds to a culture simulated with a very high .
III.2 Model parameters and predictive capability
The aim of this section is to compare CONDOR and RAPTOR results across the parameter space of , and . Two standard mould designs were used for this analysis: a rectangular test mould design with a 1:2 height to width ratio with tethers placed in the four corners of the mould, and an I-shaped mould with a broad tethering bar without an analogue in the training data set.
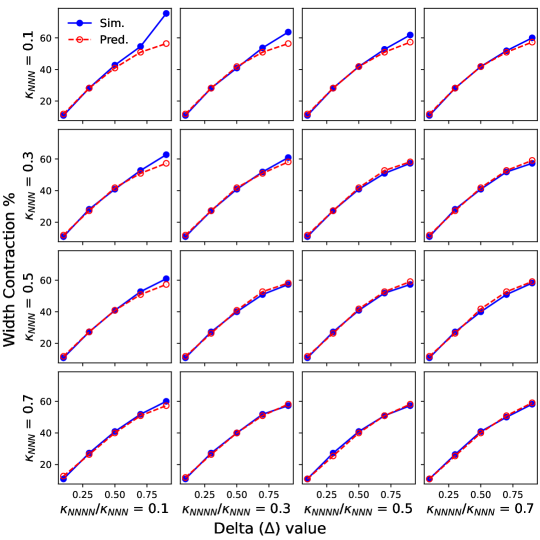
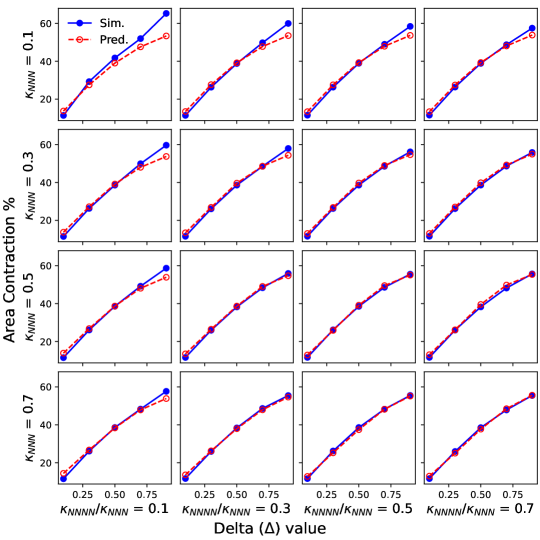
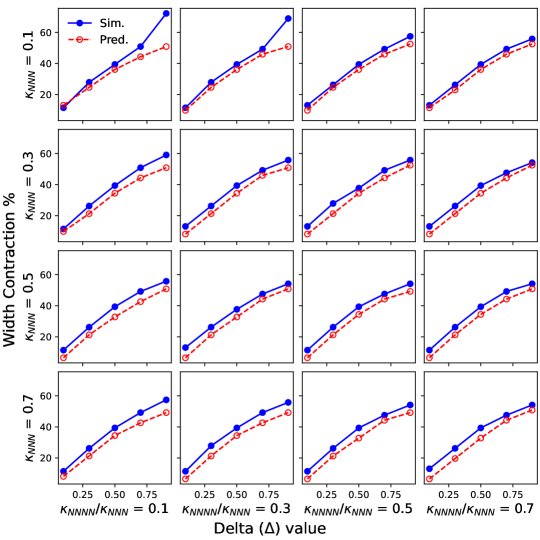
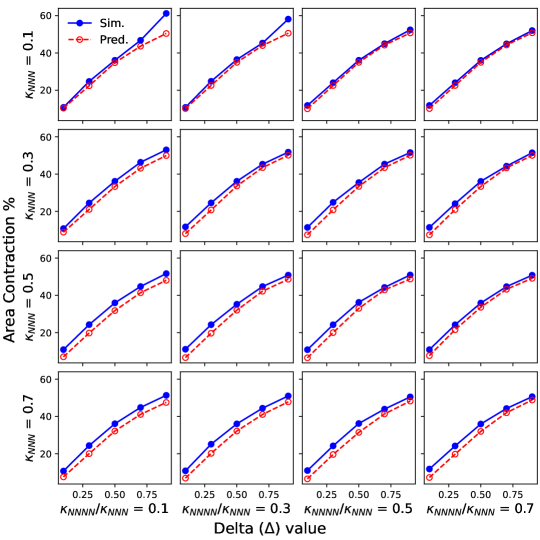
Figure 3 shows contractions obtained from CONDOR simulations and RAPTOR predictions for the rectangle mould design for various and values. CONDOR analysis for glial tissue grown within this type of mould can be found in Ref. [11]. The upper panels show the width contraction (the percentage decrease of the predicted tissue width as compared to the width of the mould) as a function of . The lower panels show the percentage area contraction.
Overall there is close agreement between both width and area contraction predicted by CONDOR and RAPTOR. The contraction differs primarily for cases with low , low and high , with the largest difference seen for , and .
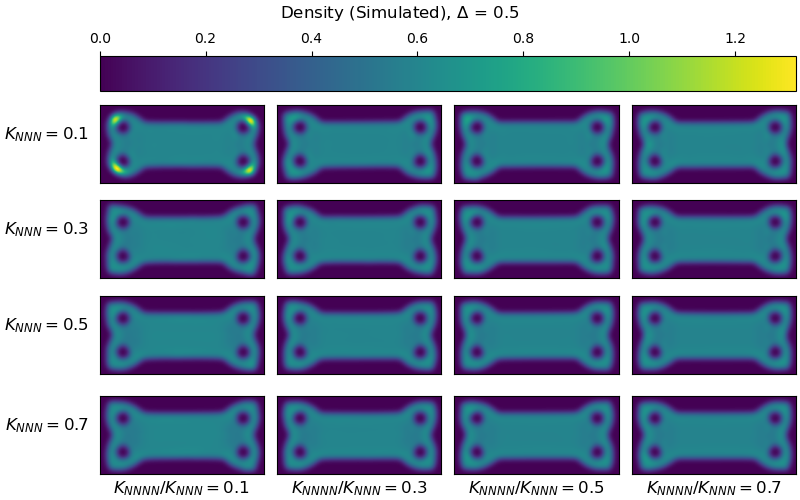
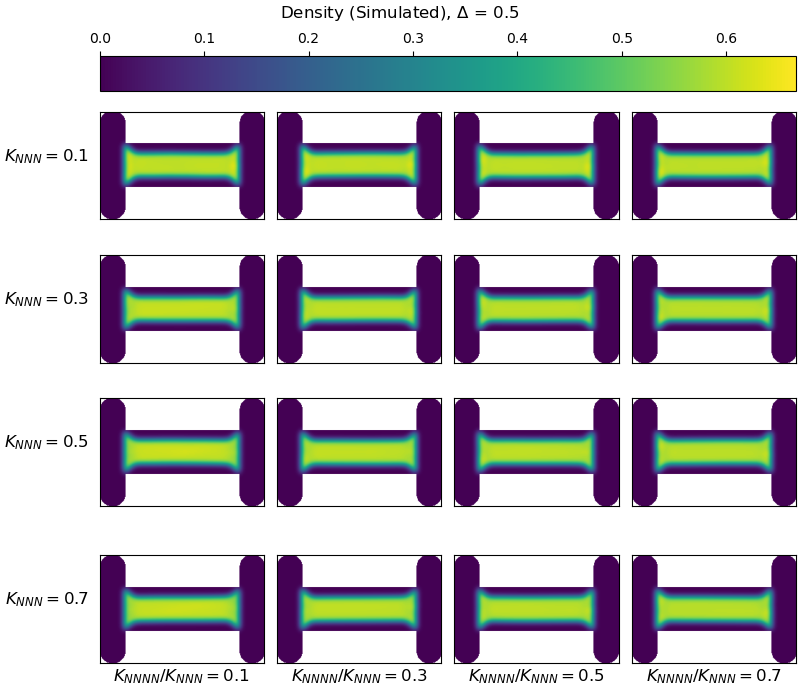
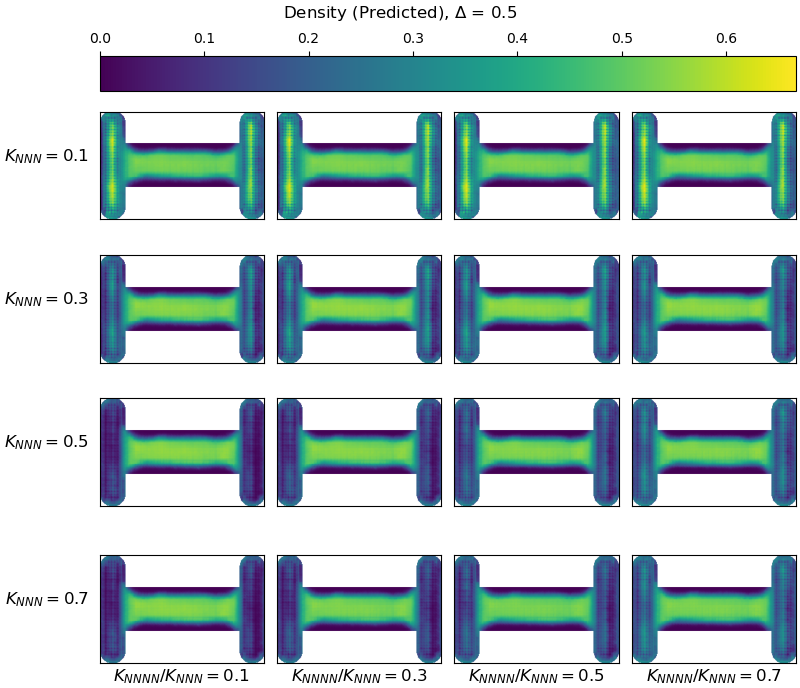
Agreement is very good in visual comparisons of tissue shapes predicted for small to medium sized values across the parameter space of . As an example, Fig. 4 shows visual comparison for the 4 pin rectangular design with . The top panels show CONDOR simulations and the bottom panels RAPTOR predictions. RAPTOR predicts a slightly lower density than CONDOR on the outside edge the tethering pillars for and . Agreement is otherwise excellent.
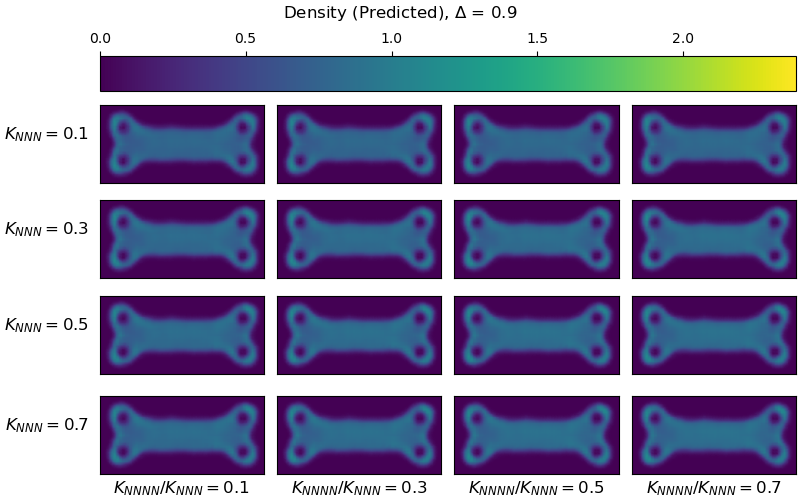
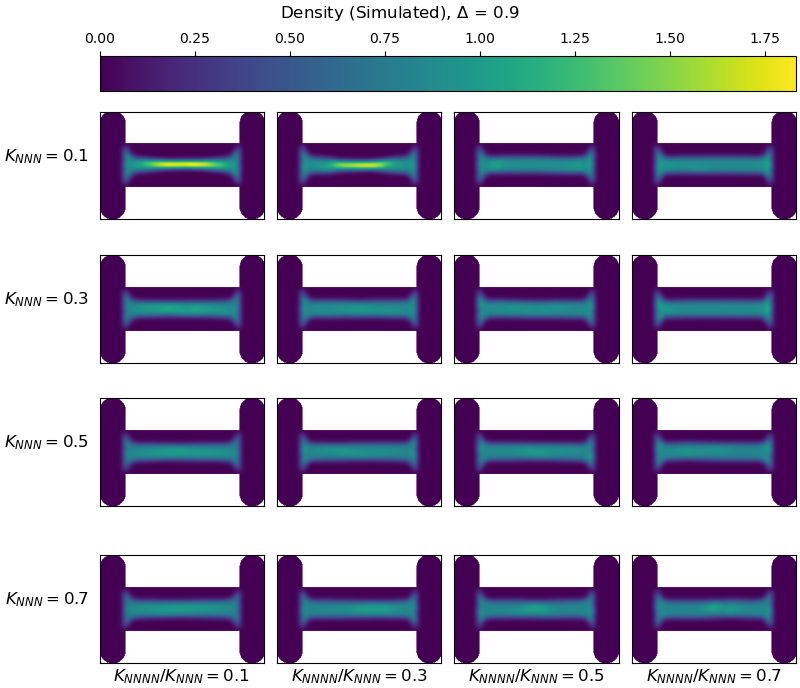
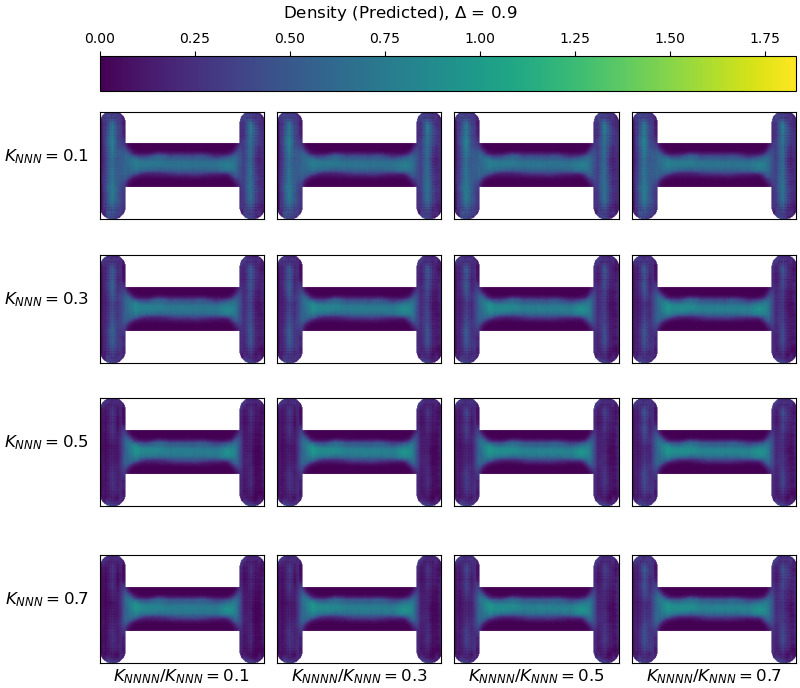
The origin of the differences between CONDOR and RAPTOR at the highest contractions can be established from direct comparison of tissue shapes for shown in Fig. 5. For and , there is an increased curvature and corresponding increase in tissue density close to the centre of the mould as the cell induced contraction overcomes the stiffness of the bonds. Away from high , and low , agreement is very good between both simulated and predicted results across the whole parameter space.


III.2.1 Predictive capability for structures with no analogue in the training data
The I-shaped mould examined in this section contains a large continuous tethering bar, which is used to show how RAPTOR handles unexpected tethering arrangements. The training data set contains random arrangements of many small circular tethers, so the case of a long continuous tethering bar has no analogue within the training data set. Figure 6 shows comparisons between contractions from CONDOR simulations and RAPTOR predictions for an I-shaped mould with similar dimensions to those used to grow both glial (Ref. [16]) and corneal tissue cultures (Ref. [17]) which differs in this case by having a long bar rather than six narrow tethering points. The width contraction is underestimated by RAPTOR, with differences becoming worse for large and small . Similar area contractions are predicted by both RAPTOR and CONDOR except for the specific case with and small .
Figures 7 and 8 show density comparisons between CONDOR and RAPTOR predictions for various , with and respectively. Although spurious cell density can be seen within the long tethers (especially for and ), the tissue shape within the depression matches the CONDOR simulations well across most of the parameter space. Again, it can be seen that within CONDOR simulations the cell induced contraction overcomes the bond stiffness for large and small , and this is not well reproduced by the RAPTOR predictions probably due in part to the limited number of cases with this feature in the training data set. Given that there are no cases of extended tethering bars in the training data set (all cases involved circular tethers) it can be seen that the machine learning algorithm is also capable of extrapolation.
In summary, the model has successfully learned the most general CONDOR properties, but was unable to learn behaviour in the small region of the parameter space where the contraction overcomes bond stiffness. For both mould types discussed in this section, most predictions from the machine learning algorithm are in good agreement with CONDOR regardless of , and values.
III.3 Validation against experimentally cultured tissues and rapid determination of model parameters
The primary purpose of this section is to validate the RAPTOR and CONDOR methods against experimental results for a variety of artificial tissue types grown in various tethered mould designs. The central width contraction and total area contraction were obtained for several experimental cases. We either (1) used images of the contracted 3D cultures for each mould to calculate (a) the ratio of tissue to mould width, and / or (b) the ratio of tissue to mould area or (2) used values reported in the literature. These ratios were then determined from both CONDOR simulations and RAPTOR predictions for direct comparison with the experiments.
The secondary purpose is to show how the speed of the machine learning algorithm can be leveraged to determine CONDOR model parameters using a fitting process. The RAPTOR method was used in a non-linear least squares fit to determine the values of and that most closely match the tissue area and width of the experiments.
Determination of parameter space values by non-linear least squares fitting was made possible by the speed of the RAPTOR algorithm. During the fit, the residual sum of squares (RSS) is minimised:
| (6) |
where and are the relative area and width calculated from results of the predicted model operated on the selected mould shape, and and are the corresponding relative area and width measured from the experimental results. CONDOR simulations are then carried out with these parameters. This provides additional validation for CONDOR and RAPTOR. Each RAPTOR prediction takes a fraction of a second, whereas CONDOR simulations currently take around 1.5 days per CPU core. While many CONDOR simulations can be made in parallel for a grid search, finding parameter values using gradient descent to minimise the RSS is difficult for such long-running simulations, so there is advantage in using RAPTOR for rapid determination of tissue parameters.
The parameters obtained using this fitting process are summarised in Table 1, with a detailed description in Sec. III.3.1 (glial tissue), Sec. III.3.2 (fibroblast tissue), and Sec. III.3.3 (corneal tissue). As previously established, CONDOR model parameters vary with cell type, as well as cell density and other factors such as passage, and thus may vary between experiments using the same types of hydrogels [11].
| Tissue and mould | Outline | Experimental | RAPTOR | CONDOR | |||||||||
|---|---|---|---|---|---|---|---|---|---|---|---|---|---|
| Glial (G1) | 0.81404 | 0.79720 | 0.841 | 0.783 | 0.2252 | 0.6657 | 0.39183 | 0.854 | 0.8 | As RAPTOR | |||
| Glial (G2) | 0.86349 | 0.87428 | 0.868 | 0.842 | 0.1536 | 0.6871 | 0.38945 | 0.87 | 0.86 | ” | |||
| Glial (G3) | 0.74998 | 0.75938 | 0.766 | 0.752 | 0.2892 | 0.624 | 0.3568 | 0.769 | 0.761 | ” | |||
| Fibroblast [18] | 0.69303 | 0.47224 | 0.661 | 0.456 | 0.6578 | 0.4438 | 0.25261 | 0.588 | 0.519 | ” | |||
| Corneal [17] | - | 0.35 | 0.543 | 0.459 | 0.8298 | 0.6465 | 0.06678 | 0.735 | 0.525 | ” | |||
III.3.1 Glial cultures
In this section, comparisons are made with cultured glial tissue (glial cell populated hydrogels in tethered moulds). Glial cells play an important role in the nervous system, and direct the growth and support of neurons. Nerve repair guides are an application of highly aligned glial tissue [19, 20]. We have validated against lab grown glial tissue for several tethered moulds. The work in this section also augments previous validation of CONDOR against glial tissues grown in tethered moulds [11].
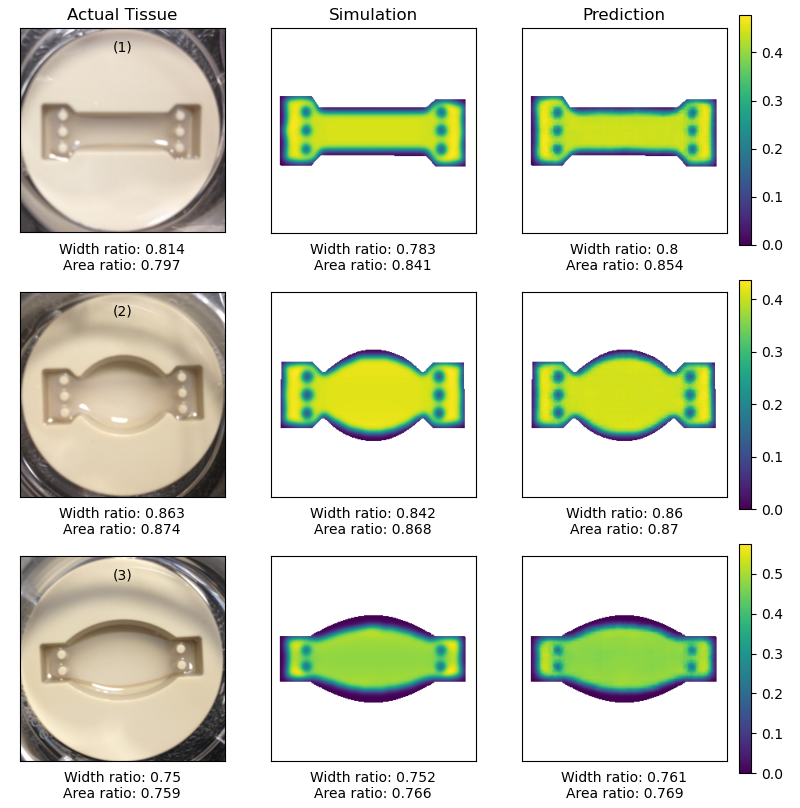
Comparisons of laboratory grown tissue, CONDOR simulation and RAPTOR prediction are shown for 3D glial cultures in three different moulds in Fig. 9. There is very good visual agreement between the different results in all cases. Good agreement is also found for the width and area ratios determined from RAPTOR and CONDOR and those of the experimentally cultured tissue.
All cases shown in Fig. 9 show glial tissue grown under similar conditions. Thus, it would be expected that they possess similar contractile properties and CONDOR parameters. Moderate variation is found in the parameters determined from the fitting process for the three moulds, which is largest for . The mean (indicated with a bar) and standard deviation (indicated with ) of the parameters are , , , , , and to 4 significant figures respectively. Some of the variation may arise since the parameter fit is only made for width and area, rather than the overall shape of the tissue.
Overall, the process is useful for determining model parameters for CONDOR and RAPTOR methods for further simulation and design of tethered moulds. Excellent agreement is found between experiment, biophysical simulation and machine learning predictions for the shape of the 3D glial cultures considered here.
III.3.2 Fibroblast cultures
The results from RAPTOR for fibroblasts were compared to relative tissue widths and areas derived from images in Ref. [18]. Fibroblasts synthesise collagen and play in important role in tissue healing and repair. Fibroblast tissue is relatively contractile, an important feature related to its role in wound closure.
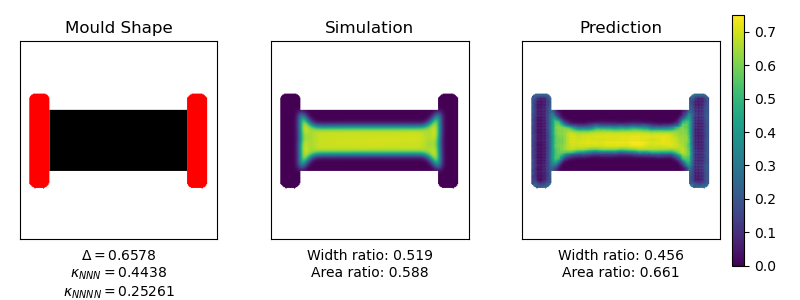
Using image data from [18], we estimated a relative contracted central width and area (recorded in Table 1) that were subsequently input into our parameter optimisation. The resulting (summarised in Table 1) parameter values are , and . The matrix parameters are responsible for subtle variations in the tissue shape. Both values are much higher than those for glial tissues indicating larger contractile forces for fibroblast cultures.
Figure 10 shows the comparison between the CONDOR simulation and the RAPTOR prediction for the indicated mould shape for the optimised parameters. Visual agreement is very good, though we note a small difference between CONDOR and RAPTOR regarding area and width ratios. Summaries of the relative width, area and model parameters can be seen in Tab. 1. Again, the RAPTOR fitting process has determined suitable CONDOR / RAPTOR model parameters for further biophysical design and simulation.
III.3.3 Corneal cultures
We use the values provided in Ref. [17] to compare RAPTOR predictions with experimental results for engineered tissue containing corneal stromal cells. Corneal tissue is an important part of the eye, and high alignment of cells and particularly matrix is important for the optical properties of the cornea. Ref. [17] does not provide a high resolution image of the final contracted tissue from which we can make a direct visual comparison, but does provide a value for width contraction. We note that the same mould was used for glial tissue growth in Ref. [16].
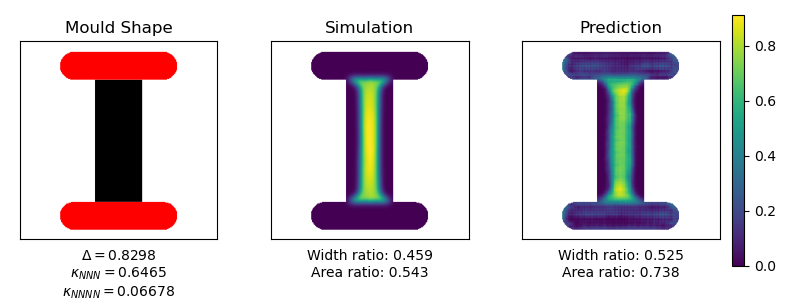
We use the width value from Ref. [17] in our parameter fit to obtain values of , , and . Note that the area was not measured in Ref. [17] and is not used in the residual sum of squares during the non-linear least squared fit. The corneal tissue shape from Ref. [17] is consistent with a much higher and smaller than the glial tissue discussed in Section III.3.1. The fit parameter is similar to that for the glial tissue.
Figure 11 shows the comparison between the results of the CONDOR simulation and RAPTOR prediction. The optimised parameter values are in line with what we expect for corneal tissue, particularly the high value of . Comparison between the CONDOR simulation and RAPTOR prediction, shows a small difference between overall density and the central width predicted by each method, with the machine learning model predicting slightly less contraction across the centre of the tissue. This likely arises from challenges of making RAPTOR predictions for high and small values discussed in Section III.2. Nonetheless, the approach is useful for determining CONDOR and RAPTOR parameters suitable for simulating and designing moulds for 3D corneal stromal cell culture.
III.3.4 Tenocyte and myoblast cultures
This section concludes with a very brief discussion of tissue cultures of tenocytes and myoblasts. Representative examples of artificial tendon and muscle tissues grown in tethered moulds can be found in Refs. [21] and [22]. Both types of tissue are highly contractile. The maximum is returned from the parameter search in both cases. However, spring constant values ( and ) returned from the search are within the region of parameter space where RAPTOR predictions do not match CONDOR or experimental measurements well (as discussed earlier). Discussion of the use of CONDOR to model these two cell types is reserved for a subsequent publication.
IV Summary and conclusions
In summary, we have presented a machine learning approach for rapid prediction of tissue organisation based on the pix2pix model for a variety of different cell types, and validated the approach for various cultured tissues. The key difference between this and previous work [12] is that CONDOR model parameters can be varied in the new RAPTOR approach. Different cell types and their densities within 3D cultured tissues are associated with different model parameters, so this feature of RAPTOR is essential to make predictions for a range of cell types, cell densities, ECM types or the effects of other factors such as enzymes applied to cultured tissue. We found excellent agreement between RAPTOR and CONDOR predictions and glial, fibroblast and corneal tissue grown in the laboratory.
Moreover, we established that RAPTOR can be used to make rapid determination of the CONDOR and RAPTOR model parameters to represent particular cultured tissue types. A non-linear least squares approach using RAPTOR was developed to establish model parameters by matching the areas and widths of RAPTOR predictions to tissues cultured in the laboratory using tethered moulds. These parameters could then be suitable to guide computational design of moulds and tethers using CONDOR or RAPTOR.
Grid searches show that RAPTOR and CONDOR predictions agree across a large part of the model parameter space. However, the parameter space grids calculated for both CONDOR and RAPTOR also show that for cases with both low and high , RAPTOR was not able to precisely represent the highly contracted cultured tissues predicted by CONDOR. We believe that lower representation of cases with strong contraction in the training data set cause the lower contractions predicted by RAPTOR. A machine learning model might be trained using a data set specialised to this small region of parameter space to make more accurate predictions for those cases.
The speed of the RAPTOR method makes a near real-time design process possible. It also makes automated design through computational intelligence techniques such as evolutionary strategies a possibility. Exploration of this potential will form part of a future paper.
Acknowledgements.
We acknowledge support from the STFC Impact Accelerator Account 2022-2023.References
- Grosberg et al. [2011] A. Grosberg, P.-L. Kuo, C.-L. Guo, N. Geisse, M.-A. Bray, W. Adams, S. Sheehy, and K. Parker, Self-organization of muscle cell structure and function, PLoS Comput Biol 7, e1001088 (2011).
- Shimizu et al. [2009] K. Shimizu, H. Fujita, and E. Nagamori, Alignment of skeletal muscle myoblasts and myotubes using linear micropatterned surfaces ground with abrasives, Biotechnol Bioeng. 103, 631 (2009).
- Gouveia et al. [2017] R. M. Gouveia, E. Koudouna, J. Jester, F. Figueiredo, and C. J. Connon, Template curvature influences cell alignment to create improved human corneal tissue equivalents, Advanced Biosystems 1, 1700135 (2017).
- Werner et al. [2007] S. Werner, T. Krieg, and H. Smola, Keratinocyte-fibroblast interactions in wound healing, J Invest Dermatol. 127, 998 (2007).
- Bajaj et al. [2014] P. Bajaj, R. M. Schweller, A. Khademhosseini, J. L. West, and R. Bashir, 3D biofabrication strategies for tissue engineering and regenerative medicine, Annu. Rev. Biomed. Eng. 16, 247 (2014).
- Ben-Arye and Levenberg [2019] T. Ben-Arye and S. Levenberg, Tissue engineering for clean meat production, Front. Sustain. Food Syst. 3, 00046 (2019).
- Weinhart et al. [2019] M. Weinhart, A. Hocke, S. Hippenstiel, J. Kurreck, and S. Hedtrich, 3D organ models - revolution in pharmacological research?, Pharmacol. Res. 139, 446 (2019).
- Jensen et al. [2018] G. Jensen, C. Morrill, and Y. Huang, 3D tissue engineering, an emerging technique for pharmaceutical research, Acta Pharm. Sin. B. 8, 756 (2018).
- Lu et al. [2021] K. Lu, Y. Qian, J. Gong, Z. Zhu, J. Yin, L. Ma, M. Yu, and H. Wang, Biofabrication of aligned structures that guide cell orientationand applications in tissue engineering, Bio-Design and Manufacturing 4, 258 (2021).
- Jensen and Teng [2020] C. Jensen and Y. Teng, Is it time to start transitioning from 2D to 3D cell culture?, Frontiers in Molecular Biosciences 7 (2020).
- Hague et al. [2020] J. P. Hague, P. W. Mieczkowski, C. O’Rourke, A. J. Loughlin, and J. B. Phillips, Microscopic biophysical model of self-organization in tissue due to feedback between cell- and macroscopic-scale forces, Phys. Rev. Res. 2, 043217 (2020).
- Andrews et al. [2023] A. Andrews, H.Dickinson, and J. Hague, Rapid prediction of lab-grown tissue properties using deep learning, Physical Biology 20, 066005 (2023).
- J.P.Hague et al. [2023] J.P.Hague, A. Andrews, and H.Dickinson, High-throughput design of cultured tissue moulds using a biophysical model: optimising cell alignment, Physical Biology 20, 066006 (2023).
- Isola et al. [2017] P. Isola, J.-Y. Zhu, T. Zhou, and A. A. Efros, Image-to-image translation with conditional adversarial networks, in 2017 IEEE Conference on Computer Vision and Pattern Recognition, CVPR 2017, Honolulu, HI, USA, July 21-26, 2017 (IEEE Computer Society, 2017) pp. 5967–5976.
- O’Rourke et al. [2015] C. O’Rourke, R. A. Drake, G. W. Cameron, J. A. Loughlin, and J. B. Phillips, Optimising contraction and alignment of cellular collagen hydrogels to achieve reliable and consistent engineered anisotropic tissue., J. Biomater. Appl. 30, 599 (2015).
- East et al. [2010] E. East, D. B. De Oliviera, J. P. Golding, and J. B. Phillips, Alignment of astrocytes increases neuronal growth in three-dimensional collagen gels and is maintained following plastic compression to form a spinal cord repair conduit, Tissue Eng. Part A 16, 3173 (2010).
- Mukhey et al. [2018] D. Mukhey, J. Phillips, J. Daniels, and A. Kureshi, Controlling human corneal stromal stem cell contraction to mediate rapid cell and matrix organization of real architecture for 3-dimensional tissue equivalents, Acta Biomater. 67, 229 (2018).
- Kostyuk and Brown [2004] O. Kostyuk and R. A. Brown, Novel spectroscopic technique for in situ monitoring of collagen fibril alignment in gels, Biophysical Journal 87, 648 (2004).
- Georgiou et al. [2013] M. Georgiou, S. C. Bunting, H. A. Davies, A. J. Loughlin, J. P. Golding, and J. B. Phillips, Engineered neural tissue for peripheral nerve repair, Biomater. 34, 7335 (2013).
- Phillips [2021] J. Phillips, ‘EngNT’ – engineering live neural tissue for nerve replacement, Emerg. Top. Life. Sci. 5, 699 (2021).
- Garvin et al. [2003] J. Garvin, J. Qi, M. Maloney, and A. J. Banes, Novel system for engineering bioartificial tendons and application of mechanical load, Tissue Eng. Part A 9, 967 (2003).
- Capel et al. [2019] A. J. Capel, R. P. Rimington, J. W. Fleming, D. J. Player, L. A. Baker, M. C. Turner, J. M. Jones, N. R. W. Martin, R. A. Ferguson, V. C. Mudera, and M. P. Lewis, Scalable 3D printed molds for human tissue engineered skeletal muscle, Front. Bioeng. Biotechnol. 7, 00020 (2019).