1]Department of Chemical & Biological Engineering, University of Colorado Boulder, Boulder, CO, USA 80309 2]Department of Civil and Environmental Engineering, Technion - Israel Institute of Technology, Haifa, Israel 3]Civil, Environmental, and Architectural Engineering, University of Colorado Boulder, Boulder, CO, USA 80309 1]Department of Chemical & Biological Engineering, University of Colorado Boulder, Boulder, CO, USA 80309
Molecular details and free energy barriers of ion de-coordination at elevated salinity and pressure
Abstract
Ion dehydration has been shown to strongly influence separation performance in membrane systems and ion transport in nanoscale channels. It is especially important for membrane-based brine treatment, which is limited by high pressures and concentrations. However, the molecular details and drivers of ion dehydration in membranes are not well understood, in particular under relevant conditions for membrane operation. In this study, we estimated the dehydration free energies for a range of different ions at high pressure and salinity relevant to brine treatment using molecular simulation. In order to more clearly interpret these results, we developed a procedure to unambiguously estimate these free energies as a function of discrete-valued coordination number. We also proposed alternatives to the coordination number as geometrical constraints for traversing nanoscale constrictions, such as the maximum cross-sectional area of the complexed ion, and calculated the free energy of dehydration as a function of these constraints. We show that high operating pressures do not significantly change cation hydration shell stability nor the shell size, while high ionic concentrations lower the free energy barrier to reduce the cation coordination number. High concentration introduces many ion pairing events, which contribute to the lower barrier. We find that anion dehydration free energies are largely unaffected by these conditions, only showing a small increase in free energy at high pressure. We propose strategies to improve ion-ion selectivity by leveraging the effects of elevated pressure and salinity on ion dehydration.
1 Introduction
Efficient and cost-effective brine management is crucial to enable inland desalination and prevent the harmful discharge of saline industrial wastewater. 1, 2, 3. These brine solutions are common waste streams in seawater desalination, oil and gas production, and industrial manufacturing 1. Recently, reverse osmosis (RO) and nanofiltration (NF) membranes have shown promise as energy-efficient brine treatment processes when operated at high pressure 4, 1. However, a better understanding of ion transport within membranes is necessary to fully unlock the potential of membrane-based brine treatment 3, 5, 6. Overall trends in ion rejection have shown the importance of many mechanisms, such as steric exclusion, Donnan exclusion, and dielectric exclusion 7, 8, 9. However, these mechanisms do not fully explain trends in ions of similar size and valency.
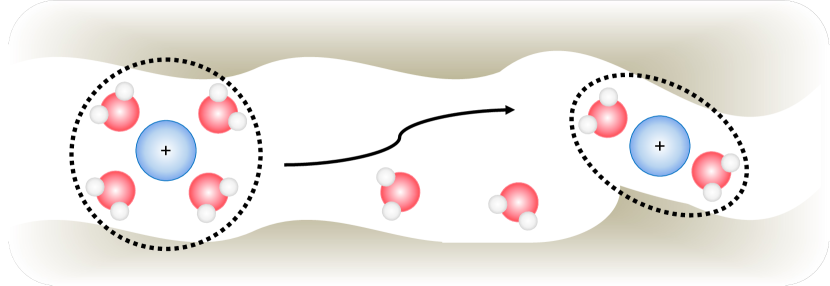
Recent work has proposed that ion dehydration can help describe observed trends in ion rejection 3, 10, 11, 12, 13, 14. These claims largely stem from observed correlations between experimental hydration free energies and trends in ion rejection and energy barriers to permeation, and they have been supported by molecular simulation studies reporting decreased coordination numbers as ions move through nanoscale channels, such as those in RO and NF membranes. Studies of materials such as nanoporous graphene 15, 16, carbon nanotubes (CNTs) 17, 18, metal-organic frameworks (MOFs) 12, 19, 20, and graphite sheets 21, 22 have all related changes in ion coordination number with transport properties of these ions. Additionally, recent work using in situ time-of-flight secondary ion mass spectrometry (ToF-SIMS) has shown that ions experience a decrease in coordination number as they move through polymer membranes 12, 23, 10. Figure 1 conceptualizes how ion dehydration contributes to ion transport in membrane nanoscale channels. The ion must change its coordination shell to traverse the membrane.
Although ion dehydration has been implicated in membrane performance for different ions 12, 24, 10, the molecular details of the process are not well understood. Without a clear understanding of how ion dehydration is affected by salinity, pressure, bare ion size, and ion valency, the effects of these variables on the transport cannot be fully understood. Brine treatment membranes are operated at high pressure and salinity, and these conditions have been shown to influence membrane performance. Brine wastewater has a high concentration of salts, which requires higher applied pressures to overcome increased osmotic pressures, typically 100 bar 1. Consistently operating at these high pressures has been shown to decrease water permeability, which decreases the water-salt selectivity 1, 25. At high salinity, salt permeability increases disproportionally, also decreasing the water-salt selectivity 26. In this study, we performed a thorough investigation of ion dehydration free energies under relevant conditions for membrane transport and for a range of different ions using molecular simulations.
Molecular simulations provide a route to directly study the nanoscale details of ion dehydration. Previous studies of zeolites, graphene, and carbon nanotubes have shown the importance of dehydration in ion transport through nanochannels 15, 17, 12, 19. Additional work has described the change in hydration shell structure under nanoscale confinement, similar to the environments within RO or NF membranes 21, 22. Previous studies have used enhanced sampling techniques to detail the free energy landscape of ion coordination and the free energy barriers to stripping a water molecule from ion coordination 27, 28, 18, 29. However, to our knowledge, a comprehensive study of ion dehydration at typical operating conditions for membrane transport, specifically at higher pressures and higher concentrations, does not exist in the literature.
Within a membrane, the physical mechanism of an ion moving through a confined pore or channel most likely involves stripping water molecules from the coordination shell, replacing the stripped water molecules with membrane groups or counterions, and rearranging the coordination shell to allow for additional ion movement, as illustrated in Figure 1. As a result, this process is composed of many free energy barriers. Generally, it is implicitly assumed that the free energy to strip waters from the hydration shell is closely related to the total free energy for this process. The interactions involving less polar membrane groups would be similar to, but weaker than, the interactions with more polar bulk water. If all the ion-ion and ion-membrane interactions are proportional to ion hydration itself, then to a rough approximation, the total free energy barrier to move along the membrane would be proportional to the ion hydration free energy. In other words, ions with large free energies of dehydration will have concomitantly large barriers to moving through a size-restricted membrane. Under this approximation, we can study how the barriers to ion transport change as a function of species, pressure, and salinity by studying the free energy of dehydration in bulk solution.
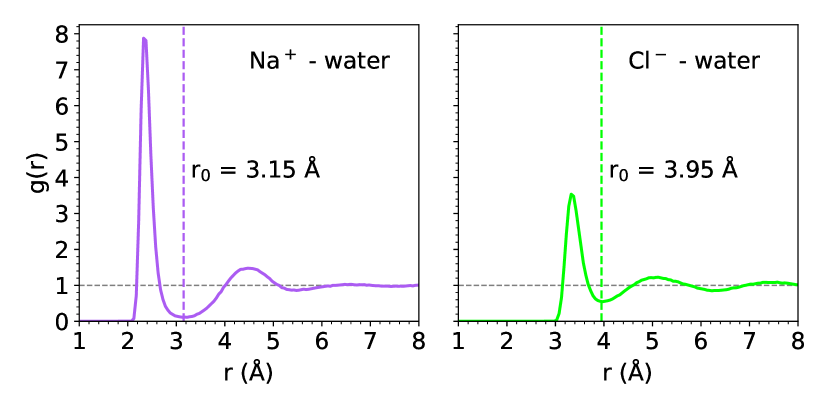
The most common definition of dehydration is the process by which an ion is stripped of its tightly coordinated water molecules, or its first hydration shell 30, 15, 8. However, this definition does not account for other species in solution that may surround the ion, such as counterions. The total number of molecules moving with the ion, regardless of species, must be low enough that an ion can move through molecularly narrow channels or bottlenecks in the membrane. If there is ion pairing among transporting ions, a change in the number of tightly coordinated water molecules may not significantly change the size of the coordination shell. Therefore, we define de-coordination, rather than dehydration, as the mechanism by which an ion changes its total coordination number, and we calculate the de-coordination free energy as the free energy difference between discrete coordination numbers. In this paper, the coordination number is the number of molecules, both water and ions of any type, within the hydration shell at a snapshot in time, rather than the number of water molecules within this radius. When averaged over time, this definition of the coordination number is equivalent to the integrated area under the radial distribution function (RDF) between the ion and all other molecules in solution up to the hydration shell radius, a quantity that can be measured by x-ray or neutron scattering 31, 32, 33. The RDF provides a description of the particle density radially from a reference and is commonly used to examine local molecular environments. We adopt the typical definition of the hydration shell radius as the distance that marks the change from the first shell of coordinating waters to the second shell, which is determined by the first minimum in the ion-water RDF. We calculate the ion-water RDF by Equation 1 for distances between the ions and oxygen atoms in the water molecules in the simulations 34, with examples of the determination of the hydration shell radius for Na+ and Cl- shown in Figure 2.
| (1) |
where is the RDF between group and , is the number of particles in group , is the volume of the system, and is the vector coordinates of particle . By considering all species within this hydration shell cutoff, we calculate the free energy to change the transporting volume for a given ion. The coordination shell thus includes the ion, coordinating waters, and coordinating counterions. We detail some other possible definitions of the de-coordination free energy in the Supporting Information Section All-molecule coordination number better represents the true size of the coordination shell.
In this study, we thus focus on the free energy of de-coordination in solution, and we discuss its implications for ion movement within RO and NF membranes. We examine how free energy changes as a function of the coordination number, since the hydrated radius formed by coordinated water molecules is the typical measure of ion size. In the process, we develop an approach to calculate the free energy associated with ion de-coordination as a function of the discrete coordination number states. Specifically, we determine trends in de-coordination free energies at elevated pressure and salinity. We look at these trends for ions relevant for high salinity brine treatment – monovalent cations, divalent cations, and monovalent anions. We propose physical explanations for these trends, using evidence from the coordination shell structure and ion pairing events.
We also investigate alternative ways to describe the complex geometrical constraints imposed by extreme confinement within polymer membranes, beyond simple spherical hydration shells. In Figure 1, we visualize one potential geometric distortion as the hydration shell (black dotted line) must go from a spherical shell to an ovular shell upon dehydration. In particular, we also examine the free energy as a function of the largest cross-sectional area along the principal axis of the shell, as one can argue this is a better description of the size of a hydrated ion traversing constrictions in the membrane. We quantify this cross-sectional area and analyze how this cross-section is distorted when ions de-coordinate. Because non-polarizable water models are not as physically accurate with ion water interactions, we also estimate the sensitivity of our conclusions to choices of ion and water parameters. Finally, we discuss how our results deepen our understanding of ion transport in polymer membranes.
2 Methods
2.1 Unbiased molecular dynamics simulations
We ran molecular dynamics (MD) simulations for each pressure, concentration, and salt configuration to prepare initial configurations and parameters for umbrella sampling simulations. We packed water and ions into a box with Packmol 36 at the appropriate ratio for the desired concentration. We then performed energy minimization, equilibration, and production MD simulations in Gromacs 2023.1 without any added bias 37, 38. We used steepest descent energy minimization. Equilibration consisted of 50 ps in the canonical ensemble (NVT) at 300 K followed by 1 ns in the isobaric-isothermal ensemble (NPT) at 300 K and the desired pressure. Then we ran a production simulation in NPT for 20 ns at 300 K and the desired pressure. Input files for all simulations are provided at Github https://github.com/schwinns/solvation_shells/tree/main/inputs.
We tested different water models and ion force field parameters in order to understand the robustness of our results. The water models we tested are TIP3P, TIP3P-FB, OPC3, TIP4P-EW, TIP4P-FB, OPC, and GOPAL. These choices include a range of three- and four-point water models that have been used for studies of electrolyte solutions and nanoscale confinement effects. TIP3P is a fast and common water model, albeit with known issues 39. TIP3P-FB is a reparameterized version of TIP3P that corrects some issues using the ForceBalance approach 40. OPC3 is another three-point water model that has been optimized to better reproduce the properties of bulk water 41. TIP4P-EW is a reparameterized version of the commonly used four-point water model TIP4P to correct issues that arise from Ewald summation of long-range electrostatics 42. TIP4P-FB is a reparameterized version of TIP4P using the ForceBalance approach 40. OPC is an optimized four-point water model 43. Finally, GOPAL is a four-point water model parameterized to get more accurate water properties over a wide range of both temperature and pressure 44. Since non-polarizable water models are less physically accurate than well-parameterized polarizable water models when used in electrolyte solutions, we performed a thorough study of non-polarizable models and discuss the sensitivity of our results to the choice of water model (Section Well-optimized force field parameters yield qualitatively similar free energies), with the expectation that findings that are independent of water model are more likely to be true physical results. When possible, we used ion parameters optimized for the given water models, except for the newly developed GOPAL model. Li et al. optimized parameters for TIP3P and TIP4P-EW in 2015 45. Li et al. optimized parameters for divalent ions with OPC3, OPC, TIP3P-FB, and TIP4P-FB in 2020 46, and Sengupta et al. optimized parameters for monovalent ions with these water models in 2021 35. For GOPAL, we used the ion parameters optimized for OPC as the water model most closely resembles OPC.
2.2 Umbrella sampling in ion coordination number
We performed umbrella sampling simulations to calculate free energy surfaces (FES) in the ion coordination number and the ion de-coordination free energies. We used Gromacs 2023.1 patched with PLUMED 2.10.0-dev to run these biased simulations 47. We applied a harmonic restraint to the coordination number of a single ion. To use the ion coordination number as the collective variable requires a switching function to make the discrete coordination number a continuous, differentiable function of system coordinates at each time step. We used the switching function from Brancato & Barone (Eq. 2) since it has been shown to work well for the ion coordination number collective variable, and it has only one tunable parameter, 28.
| (2) |
is the number of all other molecules in the system, is the distance between the biased ion and molecule , and is the spherical hydration shell cutoff inside which the coordination number is desired. We implemented this function using a modified version of the Q function in PLUMED 2 (Eq. 3).
| (3) |
To conform to the switching function from Brancato & Barone, we set and , and we subtracted the output from the number of molecules . We determined the hydration shell cutoff from ion-water RDFs calculated from the unbiased MD simulations. We used the MDAnalysis Toolkit 34, 48 SolvationAnalysis 49 with a scipy.find_peaks wrapper to locate the first minimum in the ion-water RDF. This algorithm uses peak properties and simple comparisons of neighboring values to determine the locations of local minima. It was robust enough to give consistent hydration shell cutoffs for all conditions. Figure 2 shows the ion-water RDF and the hydration shell radius determined for Na+ and Cl-. Notably, the RDF for chlorine shows significant water density near the cutoff, unlike Na+ where the radial water density is near zero at the minimum.
We tuned the switching function parameter by running short (10 ns) umbrella sampling simulations with the continuous coordination number bias, constructing the free energy surfaces from these biased simulations, and qualitatively comparing them. We expected that tuned parameters should give a smooth free energy surface as a function of coordination number and show a minimum-energy coordination number similar to the coordination number determined in the unbiased MD simulations. We visually balanced these two aspects of the free energy surface in order to determine the value of the switching function parameter.
Importantly, for the final de-coordination free energies, we only calculated the free energies for the discrete coordination number states, rather than the continuous coordination numbers calculated by the switching function. The continuous coordination number is strongly dependent on the choice of the switching function parameter. Molecules near the cutoff can contribute partial coordination numbers, which artificially inflate the sampling of these configurations. We provide examples of this behavior in the Supporting Information Section Sensitivity to switching function. However, by calculating the free energies of the discrete coordination number states by reweighting the umbrella simulations generated with the continuous coordination number function, we largely eliminated the dependence of the free energy on the switching function parameter as shown in Supporting Information Section Sensitivity to switching function. Therefore, the switching function only needs to be tuned enough so that the discrete coordination number configurations of interest are sufficiently sampled.
We ran short (100 ps) umbrella simulations starting from the final frame of our unbiased MD simulations, incrementally spanning the collective variable space of interest. We used these short simulations to generate initial configurations in order to avoid the large forces introduced when biasing the final frame of the unbiased MD to the umbrella centers. We ran these short umbrella simulations with the umbrella sampling parameters discussed below.
To calculate the free energies as a function of coordination number, we ran each umbrella simulation, initialized as described above, for 100 ns in NPT at 300 K and the desired pressure. The 100 ns simulations ensured there was sufficient sampling even for highly unfavorable regions of coordination number space. All simulations were run with v-rescale temperature coupling (tau_t = 1 ps) and Parrinello-Rahman pressure coupling (tau_p = 10 ps). We applied harmonic restraints at umbrella centers spanning the relevant coordination number space for each ion. The force constants for the individual harmonic restraints were chosen to ensure sufficient overlap between neighboring umbrellas. Most configurations of concentration, pressure, and ion used 16 evenly-spaced umbrella centers with equal force constants; however, specific umbrella centers, force constants, and switching function parameters are included in the Supporting Information Section Umbrella simulation configurations. In general, we looked at regions of the coordination number space with barriers less than 100 kJ/mol, since we expect mechanisms with higher free energy barriers to be much less relevant for RO and NF membrane separations 50, 30. We note that the actual barriers to membrane transport are lower, since interactions with a membrane would partially compensate for ion dehydration.
We estimated the free energy as a function of the coordination number from the biased simulations using the Multistate Bennett Acceptance Ratio (MBAR) implemented in pymbar 51. We calculated the discrete coordination number as the number of molecules within the hydration shell radius at each time step. We reweighted the configurations in the continuous coordination number to the discrete coordination number distribution. We then calculated the free energy for each discrete coordination number state () as given in Equation 4, which corresponds to the free energy to go from the minimum-energy coordination number to coordination number CN.
| (4) |
In Equation 4, is the Boltzmann constant, is temperature, is the number of umbrella simulations, and is the number of samples in umbrella . The weights calculated from the biased simulations are summed for each coordination number CN, where is the discrete coordination number for configuration . We calculated the weights for sample in umbrella simulation using Equation 5 with the bias applied to the continuous coordination number.
| (5) |
is the reduced free energy for applying umbrella simulation , estimated from the bias via MBAR 51. is the reduced potential () of the umbrella biasing potential for configuration . are the atomic coordinates for sample . We estimated the uncertainty in the free energies of the discrete coordination number states with 50 bootstrapped sets of samples from the umbrella simulations.
Therefore, the de-coordination free energies are the sequential differences from the minimum-energy coordination number to lower coordination numbers. Our methodology reweighting simulations biased in a continuous variable to discrete distributions is a novel and nontrivial procedure with applications for other discrete collective variables, such as hydrogen bonds or contacts in proteins. Example calculations where we reweight configurations from the umbrella simulation to the discrete coordination number states are available on Github at https://github.com/schwinns/solvation_shells.
2.3 Analysis of hydration shell structure
We quantified the non-spherical structure of the hydration shell by looking at the cross-sectional areas of convex hulls formed by molecules in the hydration shell. These dimensions are the least restrictive dimensions if the hydration shell were to move through a constriction in a membrane. For each frame, we created a convex hull from the van der Waals volume of atoms within the hydration shell. We then determined the principal axis of each polyhedron and calculated the largest cross-sectional area along the principal axis. We calculated the convex hull using scipy.spatial.ConvexHull, a Python interface for the Qhull library. We used sklearn.decomposition.PCA from scikit-learn to perform the principal component analysis on the convex hull vertices. More detailed information on how we calculated the shell limiting area is included in Supporting Information Section Details on the calculation of cross-sectional area of the shell with example code at https://github.com/schwinns/solvation_shells/tree/main/examples/unbiased_MD/run_polyhedron.py.
With these cross-sectional areas calculated for each configuration, we estimated the free energy to change the cross-sectional area. We calculated the free energy surface in the cross-sectional area using the same umbrella sampling simulations biased in the continuous coordination number. Rather than reweighting to a discrete distribution as in the case of the coordination number free energies, we reweighted the configurations in the continuous coordination number to the (continuous) cross-sectional area distribution.
3 Results
3.1 Elevated operating pressures do not significantly affect ion de-coordination
We first examined how the ion de-coordination free energy changes at high pressure in order to understand whether changes in the hydration shell contribute to the decreased water-salt selectivity observed during brine treatment 1, 12. We tested two pressure conditions near the extremes of membrane operating pressures, specifically 1 bar and 150 bar. We considered system pressure, rather than a pressure gradient. Under the solution-diffusion framework, there is no pressure gradient within the membrane, and under a pore flow framework, the pressure gradient over the time and length scales for the shell of a single ion is likely negligible. The total pressure gradient during membrane operation would be over 10s-100s of nanometers, and assuming a linear pressure gradient over this length scale results in a maximum of 15 bar/nm, or 12 bar/coordination shell. Therefore, we do not analyze anisotropic effects of pressure, only the stability of the coordination shell.
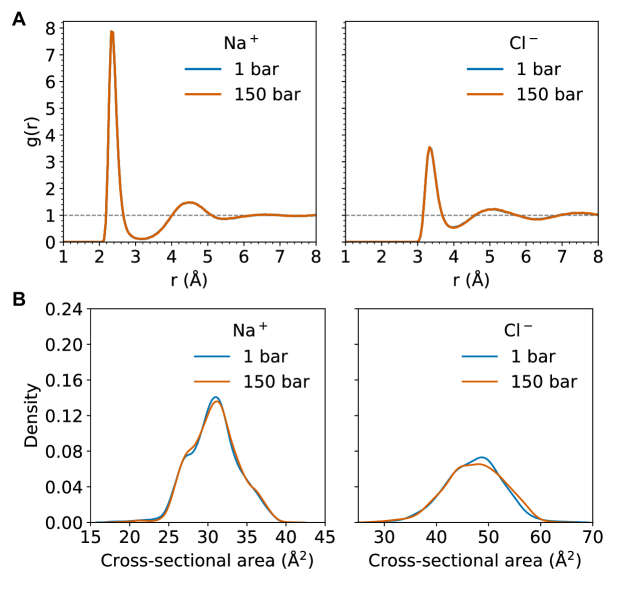
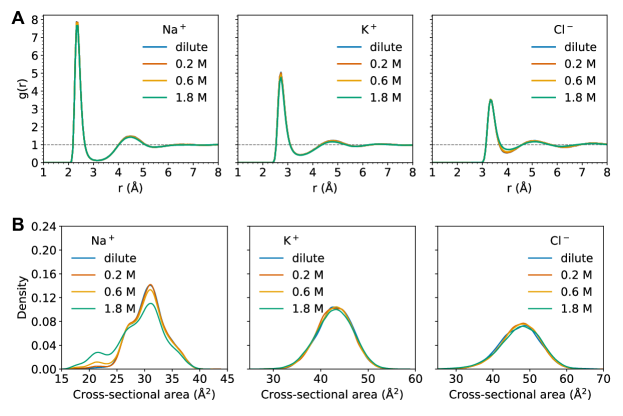
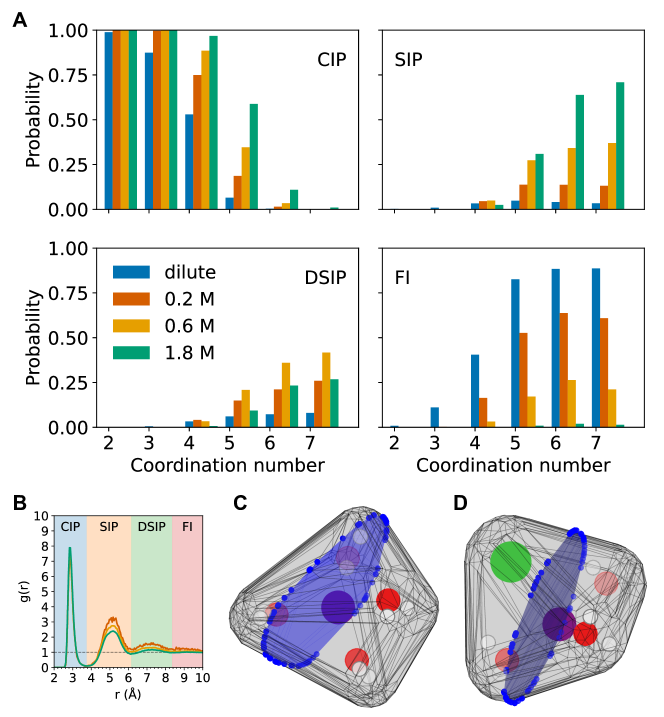
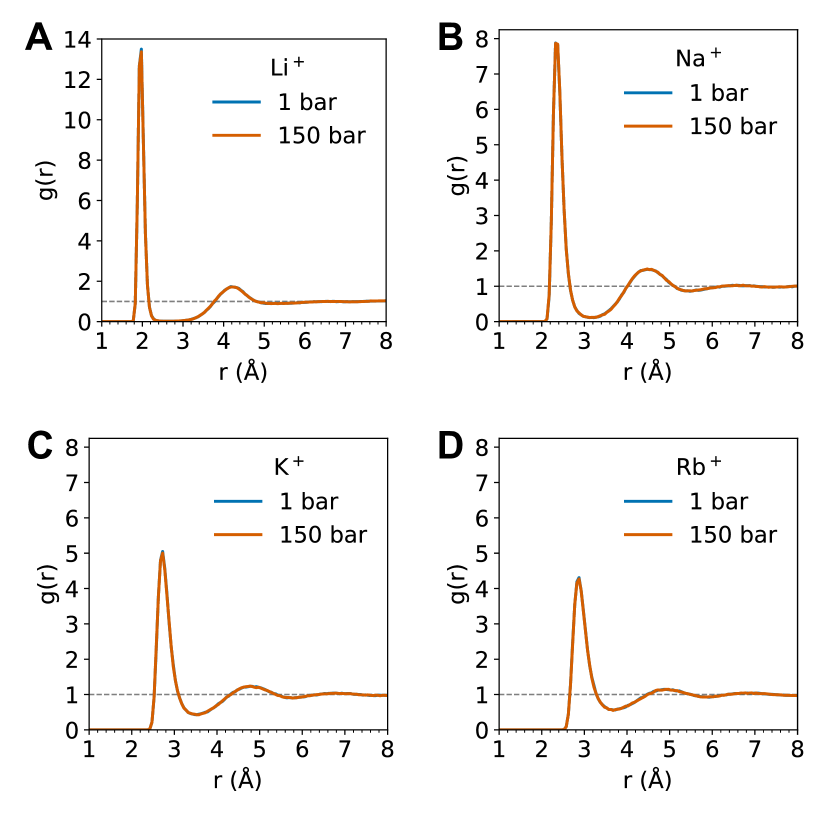
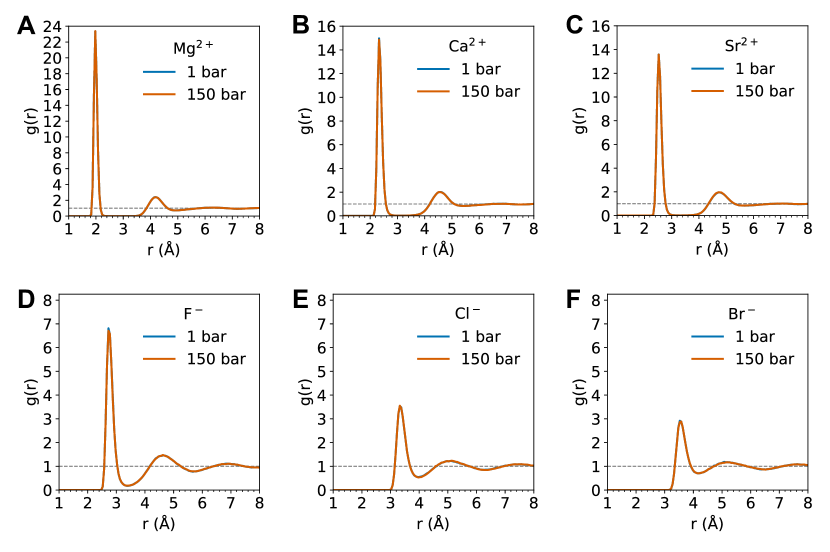
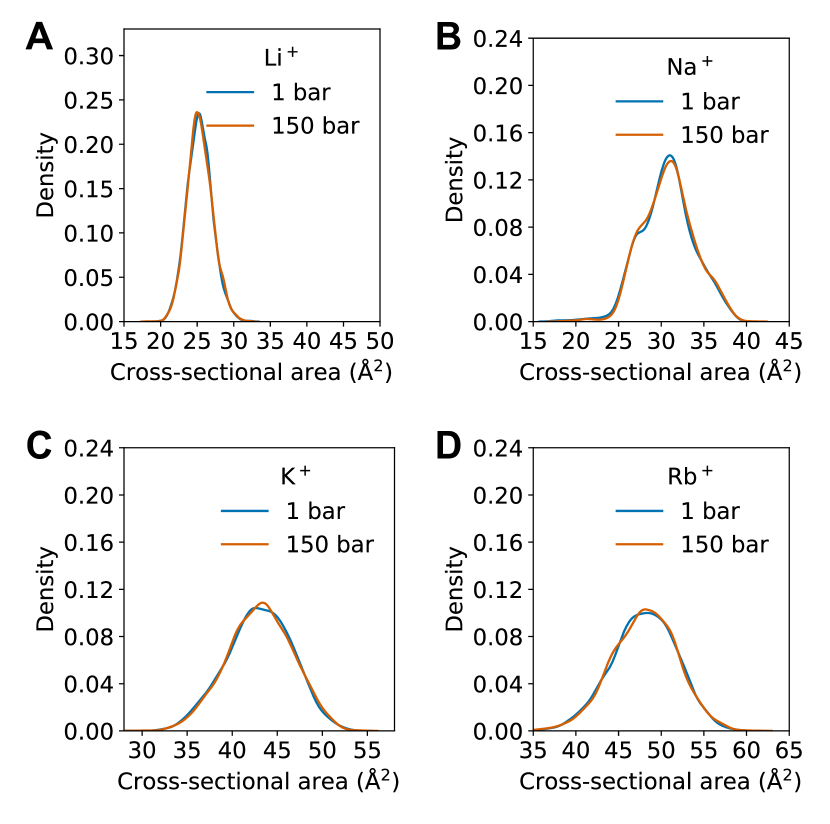
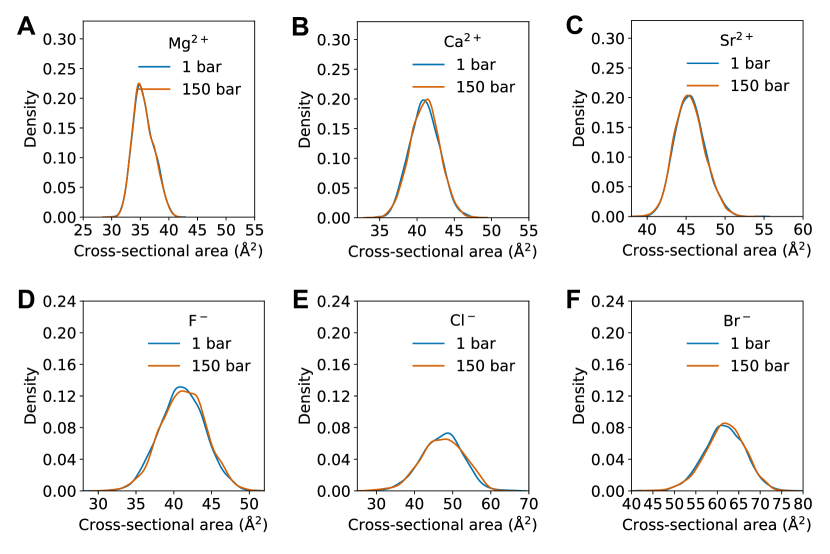
We find that high pressure does not noticeably change the coordination shell structure in solution; although, we observed some small differences for anions as noted below. We quantified the size and shape of the coordination shells of all ions in unbiased MD simulations at both 1 bar and 150 bar. The radial structure does not change for either cations or anions, which is expected for pressures in this range since aqueous solutions have low compressibility 52, 53. However, significant changes in RDFs have been reported at very high pressures 54. Figure 3A shows the ion-water RDFs for sodium and chlorine ions at infinite dilution, and the high pressure RDF is indistinguishable from the low pressure condition. The ion-water peak and the hydration shell radius remain unchanged. Similarly, the distributions of largest cross-sectional areas along the principal axis of the coordination shell are mostly independent of pressure. For anions, the increased pressure slightly increases the spread of the distribution, which could indicate some small stabilization of the coordination shell. We show results for Na+ and Cl- for clarity, since the trends for these ions are representative of the cations and anions we examined. We explicitly acknowledge some small but notable exceptions with complete data presented in the Supporting Information. RDFs, limiting area distributions, and free energies of coordination number states for all ions as a function of pressure are in Supporting Information Section RDFs, limiting area distributions, and de-coordination free energies for all ions as a function of pressure.
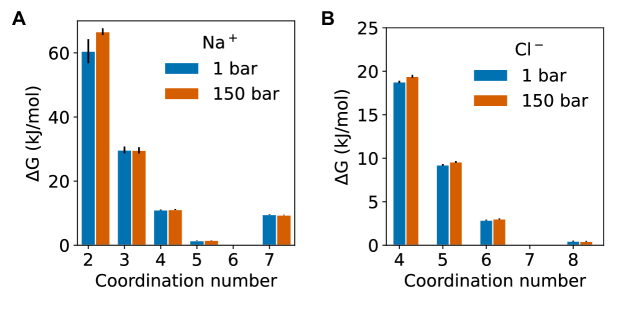
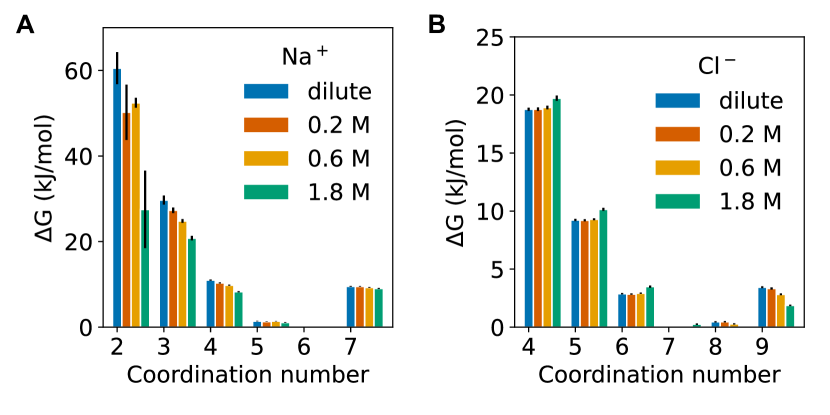
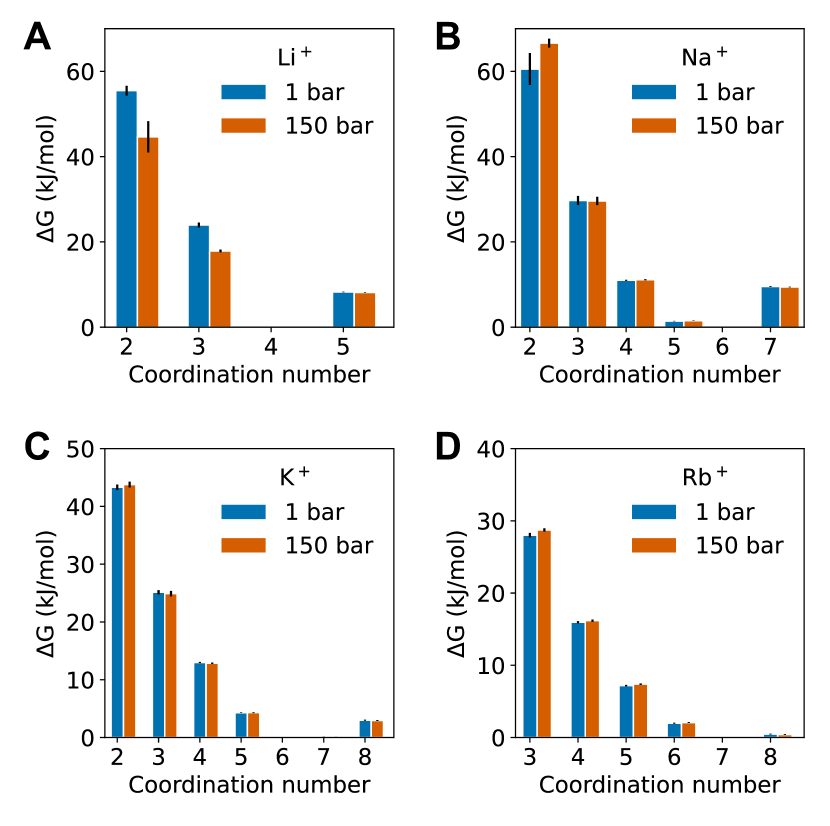
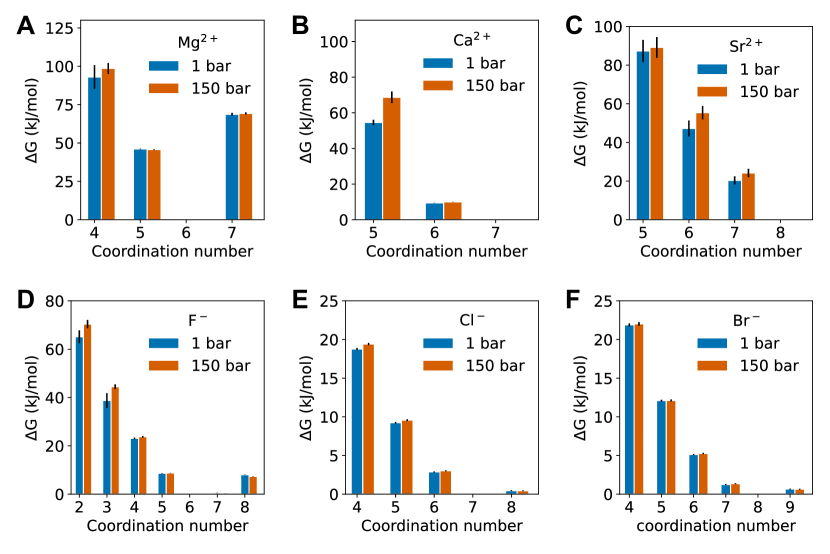
High pressure does not change the de-coordination free energies for cations, but it causes a small increase in the de-coordination free energies for anions. Notable exceptions are Li+, Ca2+, and Sr2+. The free energy to reach coordination number states below the minimum-energy coordination number are statistically indistinguishable for Na+ as shown in Figure 4A. The smaller, more tightly coordinated Li+ is less stable at high pressure by about 6 kJ/mol per de-coordinated molecule. The large divalent cations Ca2+ and Sr2+ are slightly more stable at high pressure, especially at low coordination number. All anions tested are also slightly more stable at higher pressure, as shown for Cl- in Figure 4B. Larger ionic radii appear to correlate with a higher de-coordination free energy at elevated pressure.
3.2 High salinity decreases cation de-coordination free energies
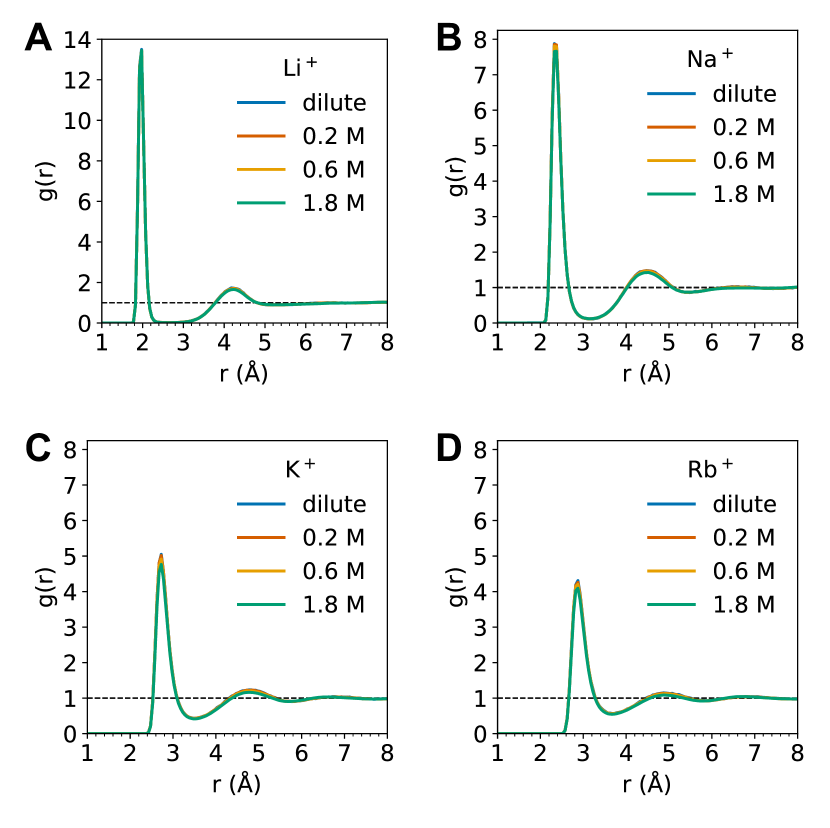
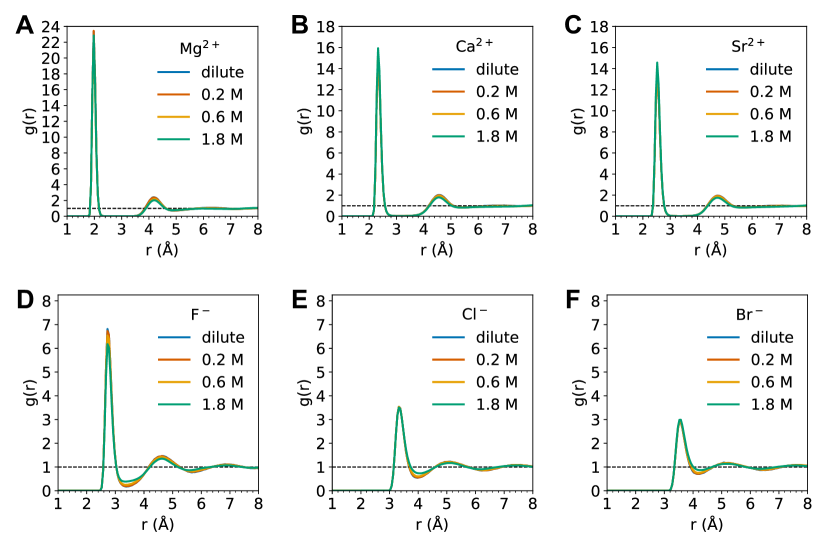
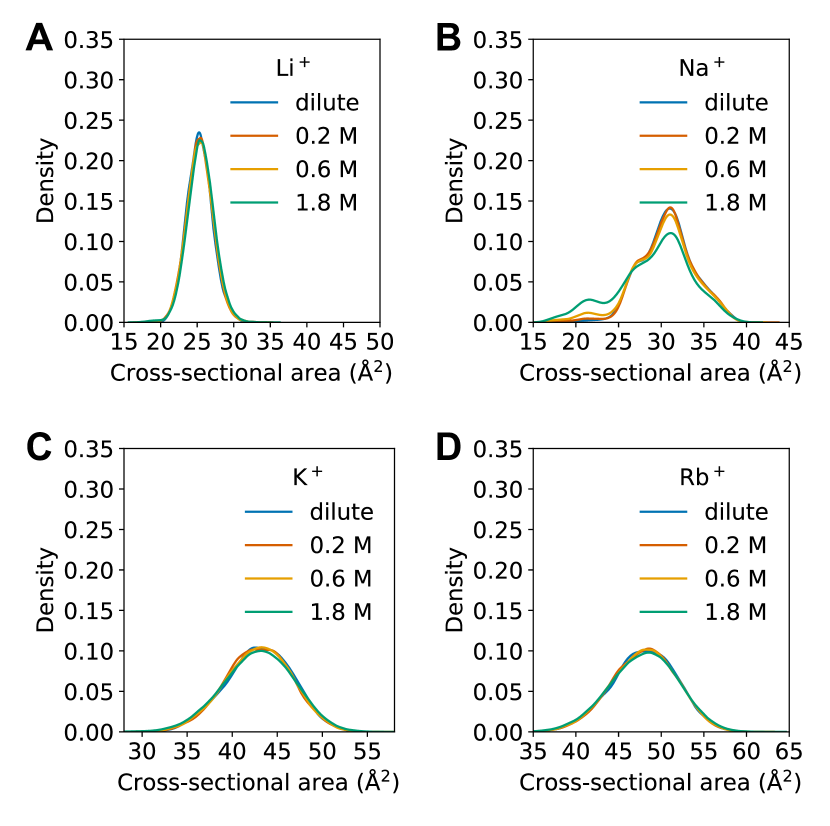
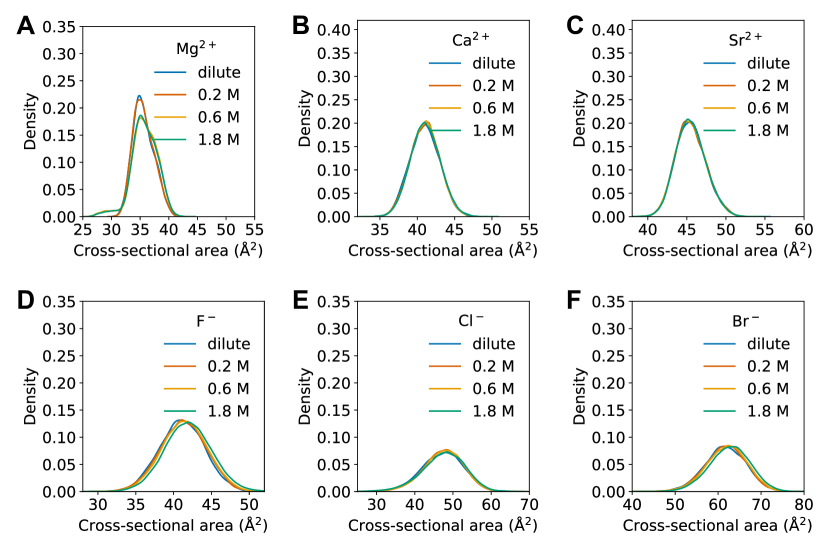
High salinity slightly reduces the size of the cation coordination shell but does not change the size of the anion coordination shell. The first ion-oxygen peak in the RDF (Figure 5A) decreases in magnitude for most cations, which corresponds to more low coordination number configurations. For Ca2+ and Sr2+, the magnitude of the first peak increases at high concentration as shown in Supporting Information Figure S15B and C. However, the hydration shell cutoff remains the same at increased concentration for all cations. With the exceptions of Na+ and Mg2+, the distribution of restrictive cross-sectional areas does not change with elevated salinity as shown for K+ in Figure 5B. However, for Na+ and Mg2+, the increased frequency of low coordination number states causes a significant peak at low cross-sectional area. For anions, the density of molecules near the hydration shell radius increases but does not change where the shell cutoff occurs. The limiting area of the coordination shell— the maximum cross-sectional area along the principal axis—does not change with the increased density near the cutoff, indicating that the molecules near the cutoff are not as important for reducing the size of the coordination shell as the tightly coordinated molecules. Figure 5B shows the distribution of the cross-sectional areas at increasing salinity, and for Cl-, the distributions are unchanged.
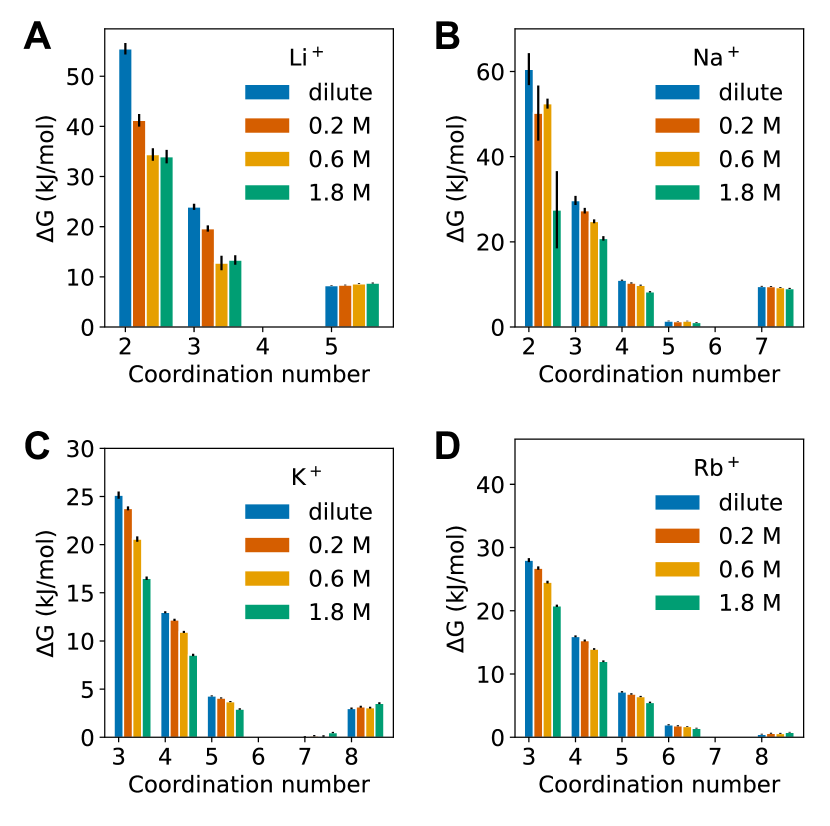
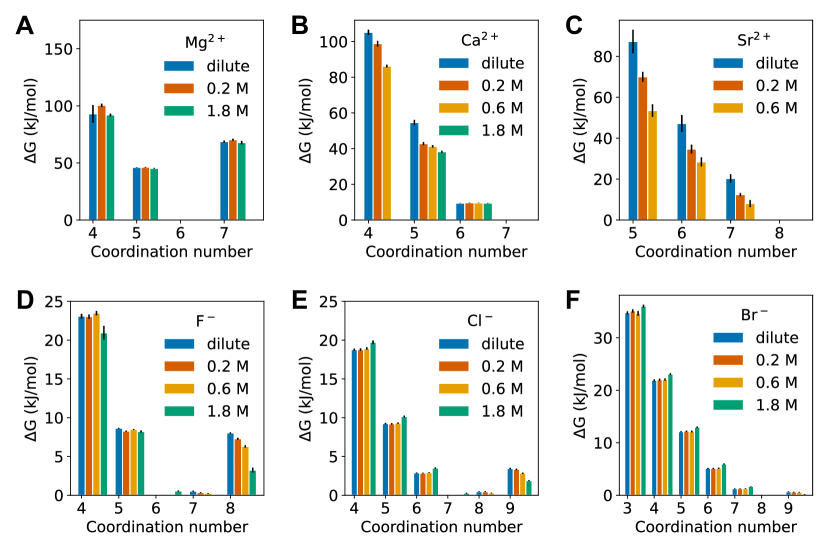
High concentrations decrease cation de-coordination free energies but have little effect on the anion de-coordination free energies. The free energies associated with low coordination number states for cations are substantially lower at high salinity as shown in Figure 6A for Na+, which indicates that cations more readily de-coordinate when there are many ions nearby. This conclusion is consistent with the results from unbiased MD at high concentration showing more frequent low coordination number configurations. The free energy calculations expand the implications from unbiased MD to physically-relevant scenarios for membranes where multiple de-coordinations must occur. We do not observe this trend for Mg2+. The de-coordination energies for Mg2+ do not show significant differences with increasing salinity, likely due to its strong electrostatic interactions and small ionic size. Concentration dependence results, including RDFs, limiting area distributions, and free energies, for Mg2+ and all other ions tested are in Supporting Information Section RDFs, limiting area distributions, and de-coordination free energies for all ions as a function of concentration. For anions, the only difference in de-coordination free energies with increasing concentration occurs at the highest concentration tested. At 1.8 M, the minimum-energy coordination number increases. In Figure 6B, the minimum-energy coordination number for Cl- increases from 7 to 8, suggesting that, on average, nearby ions force one more molecule into the shell. The additional de-coordination thus requires more energy to reach low coordination number states.
3.3 Elevated pressure and salinity improves ion-ion selectivity between some ions
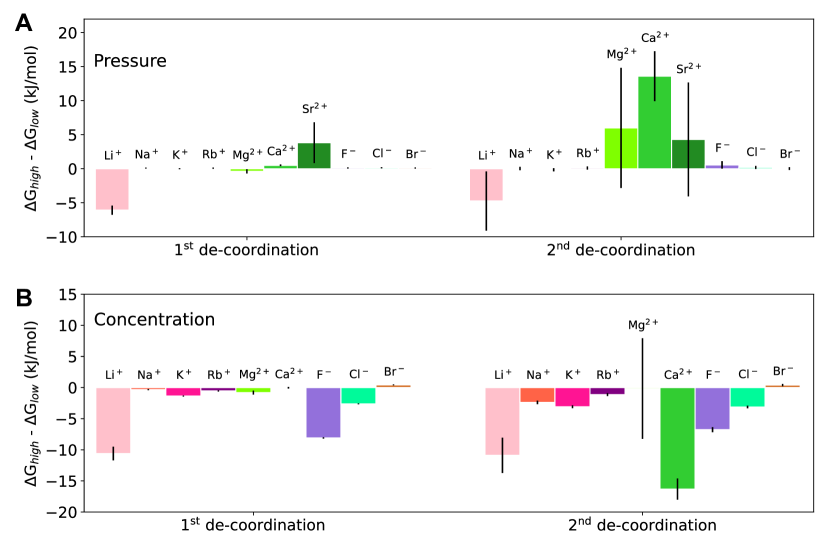
Partial de-coordination free energies follow the same ion size and valency trends seen in experimental hydration free energies; larger bare ions are easier to de-coordinate and higher valency ions are more strongly coordinated 35, 46, 56, 57. However, we find deviations from these patterns for the first two de-coordinations. For example, trends in hydration free energies predict that divalent ions are approximately 4x more strongly coordinated than similarly sized monovalent ions, but the first and second de-coordinations are only approximately 2x more strongly coordinated.
We compare the trends in ion de-coordination free energies observed at low pressure and low salinity to those calculated for high pressure and high salinity. Our results in Figure 7 suggest that high pressure and salinity could improve ion-ion selectivity for some ions, if de-coordination can be leveraged as the governing mechanism. Figure 7A shows the difference in the de-coordination free energy between low and high pressure for all ions tested. At high pressure, the first and second de-coordination free energies only change significantly for Li+, Ca2+, and Sr2+. Therefore, increasing pressure could improve ion-ion selectivity between these ions and those that are unchanged at high pressure. For example, the free energy for Li+ to de-coordinate twice decreases by 21.5 kJ/mol, while the free energy for Mg2+ to de-coordinate twice changes negligibly. As a result, high pressure would increase the de-coordination-controlled Li+/Mg2+ selectivity. Figure 7B shows the difference in the de-coordination free energy between low and high salinity for all ions tested. At high concentration, the first two de-coordination free energies decrease by more than 5 kJ/mol for Li+, F-, and Ca2+. Therefore, selectivity towards these ions could be higher at elevated salinity, since they will more easily de-coordinate and thus more easily traverse membrane constrictions.
3.4 The free energy to change the restrictive cross-sectional area is not dependent on concentration
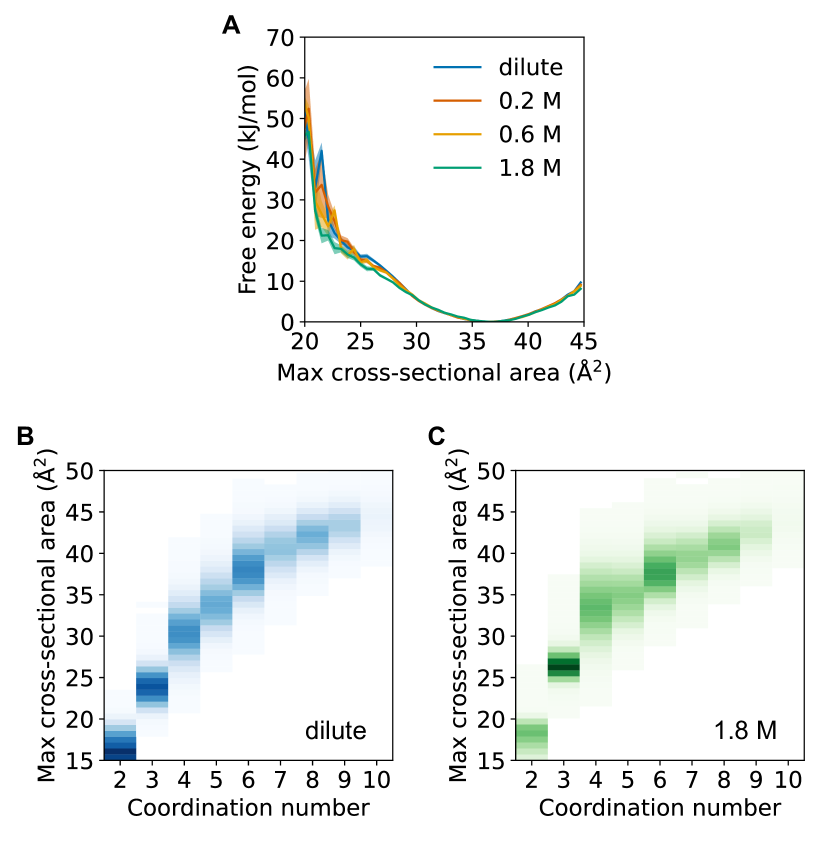
We quantified the restrictive, limiting dimension to transport as the maximum cross-sectional area along the principal axis of the occupied shell volume. We characterized how this critical size changes as an ion de-coordinates at a range of pressures and concentrations. To more specifically calculate the free energy penalty, we estimated the free energy surface as a function of the (continuous) cross-sectional area of the shell. Similarly to the free energies of the discrete coordination number states, we reweighted the configurations in the continuous coordination number to the cross-sectional area distribution. Figure 8A shows the free energy surface in the maximum cross-sectional area for Na+ at increasing salinity. For moderate reduction in hydrated size, decreasing the coordination number is easier than decreasing the cross-sectional area. For example, for Na+ at 1 bar and infinite dilution, the free energy to reduce the coordination number by 1/3 (i.e. from 6 to 4) is 11.0 0.1 kJ/mol (Figure 6A), and the free energy to reduce the cross-sectional area by 1/3 (i.e. from 36 Å2 to 24 Å2) is 18.3 0.9 kJ/mol (Figure 8A). However, the free energy to reduce the cross-sectional area to the average area for coordination number 4 (i.e. from 36 Å2 to 30 Å2) is 5.3 0.1 kJ/mol. Reducing the coordination number by 1/3 is not equivalent to reducing the cross-sectional area by 1/3; rather it is easier than reducing the cross-sectional area by 1/3.
Notably, the free energy to change cross-sectional area does not change significantly at increased concentration, despite the strong affect of salinity on the free energies of coordination number states. Therefore, the free energy penalty to reach low coordination number is largely due to other aspects of the mechanism rather than reducing the limiting area. However, reducing the cross-sectional area to the lowest sampled region (20 Å2) is easier at high concentration as seen in Figure 8A.
In Figure 8B and C, we show the correlation between the coordination number and the maximum cross-sectional area along the principal axis of the shell. The low coordination number configurations do not show as much variance and have lower cross-sectional areas at low concentration than at high concentration. However, many configurations with low cross-sectional area do not have low coordination number, both at infinite dilution and at 1.8 M.
3.5 Well-optimized force field parameters yield qualitatively similar free energies
We examined how choice of non-polarizable water model and ion parameters affected the de-coordination free energies as a test of the robustness of the trends we observed. Figures and further discussion are included in Supporting Information Section Dependence on force field parameters. We calculated the free energies for Na+ at infinite dilution and 1 bar for the seven water models presented in the Methods. We also tested two sets of ion parameters with OPC3 water – Li & Merz 2015 45 optimized for TIP3P and Sengupta et al. 2021 35 optimized for OPC3.
We find that trends in the de-coordination free energies are consistent across water models (Figure S6B). Notably, the water model that differs most significantly - GOPAL - does not have optimized ion parameters. TIP3P is slightly more strongly coordinated than the other three-point water models. The first and second de-coordination free energies are 1.6 kJ/mol and 1.0 kJ/mol higher for TIP3P than OPC3. Four-point water models are systematically more strongly coordinated than three-point water models. The first and second de-coordination free energies are 2.9 kJ/mol and 1.8 kJ/mol higher for OPC than OPC3.
The de-coordination free energies are statistically indistinguishable between ion parameters as shown in Figure S7B. Both the Li & Merz 2015 and the Sengupta et al. 2021 parameter sets were optimized to reproduce experimental hydration free energies with three-point water models. Therefore, it is unsurprising that the ion parameters perform similarly for our calculations. The overall lack of dependence on force field parameters suggests that the behavior we observe is physical, i.e. not an artifact of parameterization. We acknowledge that the exact numerical values of the barriers we present may not be as accurate as higher levels of theory, but we conclude that the magnitudes and trends are representative of ions in solution.
4 Discussion
4.1 Geometric description of the ion de-coordination process
We redefined the process of reducing the effective size of hydrated ions as de-coordination. De-coordination corresponds to removing any coordinated molecule from the coordination shell. This definition helps clarify the perspective on how ions move through membrane constrictions. When considering such motion, we must consider multi-species, non-spherical complexes rather than spherical shells of tightly coordinated water molecules, especially in the high salinity environments necessary for brine treatment.
To further quantify the important geometric considerations of nonspherical molecular clusters, we calculated the maximum cross-sectional area along the principal axis of the occupied shell volume. This alternative measure of hydrated ion size captures asymmetry and potentially can capture low energy configurations introduced during de-coordination and not described by coordination number.
In Figure 6, we showed that the free energy to de-coordinate significantly decreases at high concentration for cations, while it does not change for anions. However, the significant decrease in free energy at high concentration does not hold for cross-sectional area, as shown in Figure 8. Therefore, the lower barrier to de-coordinate at high salinity may not necessarily correspond to a lower barrier to move through a constriction in the membrane. Comparing hydration free energies, or even de-coordination free energies, may not fully capture the important barriers associated with the ion de-coordination mechanism. The penalty to reduce the hydrated ion size often involves de-coordination but may only require changing the restrictive cross-sectional area, which our results suggest is a smaller barrier than the barrier associated with de-coordination.
4.2 Physical explanations for observed trends
Our results indicate that high salinity reduces the penalty to de-coordination of cations in solution. To further elucidate the reasons for this reduction in free energy upon de-coordination, we quantify ion-ion interactions with increasing concentration. We classify each configuration as a contact ion pair (CIP), solvent-separated ion pair (SIP), doubly solvent-separated ion pair (DSIP), or free ion (FI), according to the nomenclature presented by Rinne et al. 58. We define these ion pairing events by the distance to the nearest oppositely charged ion. We used the minima in the ion-ion RDF to determine the distance cutoffs as shown in Figure 9B. Ion-ion distances less than the first minimum are CIPs, between the first and second minima are SIPs, between the second and third minima are DSIPs, and beyond the third minima are FIs.
We observe significant ion pairing at high concentrations, and we hypothesize that it is these ion pairing events that primarily contribute to the decreased de-coordination free energies calculated from the umbrella sampling simulations. Figure 9A shows the distribution of ion pairing events for the discrete coordination number states for Na+ at increasing concentration. At low coordination number, Na+ is most likely in a contact ion pair with Cl- for all concentrations. However, high concentration changes the most likely states at intermediate to high coordination number. Increasing salinity causes the most probable ion pairing state to switch from FI to SIP for coordination number 6, the minimum-energy coordination number for Na+. For a single de-coordination (i.e. coordination number 5 for Na+), the most probable ion pairing state switches from FI at infinite dilution to CIP at 1.8 M. At high concentration, therefore, the presence of nearby ions decreases the penalty to de-coordinate by directly filling the coordination shell with counterions rather than water molecules.
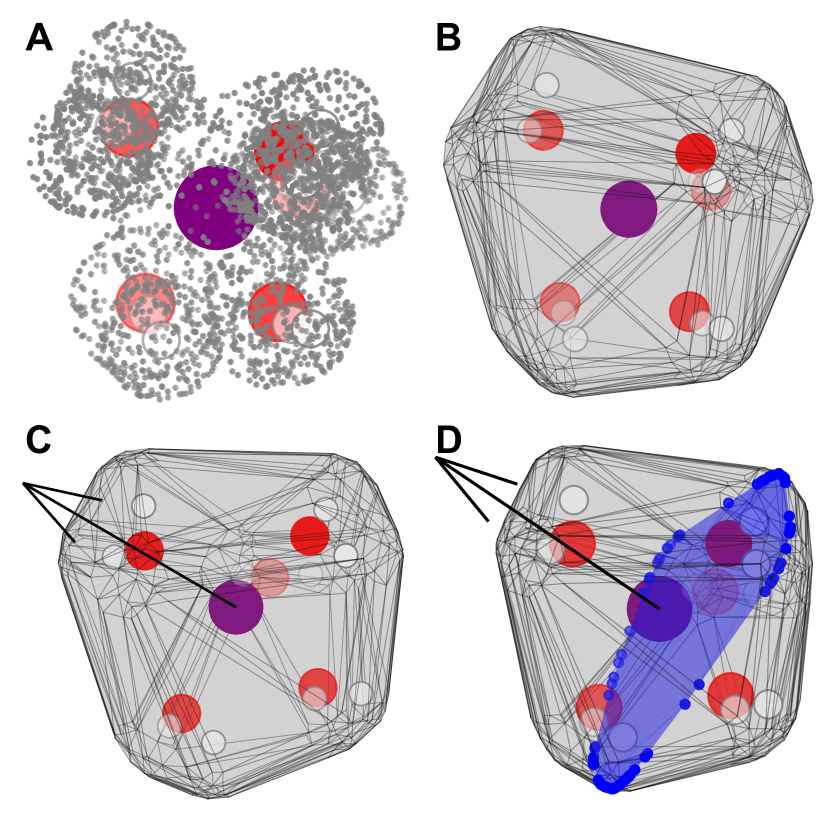
We show representative coordination shells with their polyhedrons for Na+ at infinite dilution (Figure 9C) and 1.8 M (Figure 9D). Each visualization has coordination number 4, but the high concentration shell is in a CIP. For the low concentration shell, the volume of the polyhedron formed by atoms in the shell is 143.7 Å3, and the limiting area is 25.93 Å+. For the high concentration shell, the volume is 136.7 Å3, and the limiting area is 27.25 Å2. The free energy to achieve the high concentration shell is lower than the low concentration shell. The CIP compensates for the lower coordination number and decreases the unoccupied volume in the shell. However, the low concentration shell would have a slightly smaller steric penalty to move through a membrane constriction due to its lower limiting area. Therefore, the decreased de-coordination penalty induced at high salinity would be partially compensated by a higher steric penalty.
4.3 Implications for membrane transport
We showed that high operating pressures do not significantly change the de-coordination free energies nor the shell size. While we did see a trend in the anion de-coordination free energies, the differences are on the 0.1-1 kJ/mol scale, which is small compared to the trends observed for ion size and concentration, or even thermal fluctuations. Additionally, other mechanisms likely show more dominant effects at high pressure. For example, it is more likely that high pressure will influence the de-coordination mechanism via membrane compaction 59, 60, rather than through the stability of the coordination shell. Voids in the membrane would shrink, and thus ions would need to achieve even smaller coordination numbers to traverse constrictions. We do not apply a pressure gradient in our simulations but, these effects are small in comparison to the total de-coordination energy.
Ion de-coordination can be exploited to improve selectivity of ions of similar size and valency, as different ions show significantly different barriers. In particular, if membranes can be designed to leverage near complete de-coordination, the free energy differences are large enough to significantly affect ion-ion selectivity. Notably, even the first and second de-coordinations differ enough to achieve some level of selective separation. Additionally, for specific ions, elevated pressure and salinity can exaggerate the differences in de-coordination free energies, potentially improving their selectivity.
Ion-ion selectivity from de-coordination that is present at lower pressures will be maintained, or even enhanced, at elevated pressure. If membrane compaction decreases the size of constrictions in the polymer, ions will be forced into lower coordination number states, where differences in ion de-coordination free energies are more pronounced. These larger free energy differences would further improve de-coordination-driven selectivity.
At high salinity, it is easier to reduce the coordination number for cations than at low salinity (Figure 6A). This trend is consistent with experimental reports of increased salt permeability at high salinity, which would correspond to lower barriers for salt transport through the membrane 1, 25, 26. Anion hydration shells are typically larger than cation hydration shells. Therefore, anions will more frequently need to de-coordinate during membrane transport than cations. As a result, it is more likely that controlling de-coordination through precise changes in pore sizes would improve anion-anion selectivity rather than cation-cation selectivity.
However, the decreasing ion de-coordination free energy is only significant if there is increased salinity in the local environment. While this will be true in solution or near the solution-membrane interface, it is not clear if there is increased salinity inside the voids of a membrane that is likely less polar than water, even if the external salinity is high. Therefore, ion de-coordination is more relevant for NF membranes with relatively large voids than for RO membranes.
5 Conclusions
We defined the all-molecule, or total, coordination number in order to probe the barrier to reducing the total transporting volume of a hydrated ion. We examined this free energy of de-coordination throughout this paper. We developed a procedure to calculate this barrier in solution with umbrella sampling simulations. We estimated free energies in a discrete collective variable (coordination number) from enhanced sampling simulations biased in a continuous collective variable (coordination number using a switching function). While the continuous coordination number allows for intermediate states between physical states, it introduces ambiguity in the interpretation of the free energies. Molecules near the cutoff contribute partial values to the coordination number. We presented a procedure to reweight to the discrete coordination numbers which is independent of the continuous surrogate for coordination number, as long as that surrogate sufficiently samples the relevant discrete coordination numbers. By reweighting to the discrete distribution, the free energies are more clearly the barriers to transition from the minimum-energy coordination number to lower coordination number states.
As we discussed earlier in this study, the barriers we report here are higher than those experienced by ions in the membrane due to compensating effects caused by coordination with membrane groups. However, trends at relevant conditions and relative free energies can provide insight into the nanoscale mechanisms governing membrane transport. For example, well-established trends like Na+-K+ selectivity and anion rejection are consistent with the trends presented here.
Our results suggest that changes in membrane performance at elevated pressure are not due to changes in ion de-coordination but rather changes in polymer structure from compaction or some other mechanism. We show that high concentration reduces the de-coordination barrier for cations. Cations show significant ion pairing events at high concentration, which contributes to the destabilization of the coordination shell. Nearby ions enable easier de-coordination. However, this trend does not hold for the free energy to reduce the restrictive cross-sectional area of the coordination shell. That penalty does not change significantly with increasing salinity. Our work provides a deeper, molecular-level understanding of ion dehydration and how it relates to ion transport in polymer membranes. The trends we observe stand as a useful reference for determining the molecular mechanisms involved in experimental studies of ion transport in novel brine treatment membranes.
Author Contributions
N.S.S., R.E., A.P.S, and M.R.S. conceptualized the project. N.S.S. carried out all simulations and data collection. N.S.S., R.E., A.P.S., and M.R.S. analyzed the results. N.S.S. wrote the original draft. N.S.S., R.E., A.P.S., and M.R.S. revised the manuscript. M.R.S. supervised the project and obtained the resources.
Supporting Information
Supporting information includes an analytical discussion on the definitions of coordination number, analysis of sensitivity of the de-coordination free energy to parameterization of the continuous switching function, analysis of dependence of the de-coordination free energy on the force field parameters, supplementary figures showing the de-coordination free energies and coordination shell structure as a function of pressure, supplementary figures showing the de-coordination free energies and coordination shell structure as a function of concentration, details on the calculation of the cross-sectional area of the shell, full details of the umbrella sampling configurations (PDF).
Acknowledgements
This material is based upon work supported by the National Science Foundation under Grant No. CBET-2136835 and the United States-Israel Binational Science Foundation (BSF), Jerusalem, Israel (grant No. 2021615). This work used Bridges-2 at Pittsburgh Supercomputing Center through allocation chm230020p from the Advanced Cyberinfrastructure Coordination Ecosystem: Services & Support (ACCESS) program, which is supported by National Science Foundation grants #2138259, #2138286, #2138307, #2137603, and #2138296.
References
- Davenport et al. 2018 Davenport, D. M.; Deshmukh, A.; Werber, J. R.; Elimelech, M. High-Pressure Reverse Osmosis for Energy-Efficient Hypersaline Brine Desalination: Current Status, Design Considerations, and Research Needs. Environ. Sci. Technol. Lett. 2018, 5, 467–475
- Werber et al. 2016 Werber, J. R.; Osuji, C. O.; Elimelech, M. Materials for next-generation desalination and water purification membranes. Nat Rev Mater 2016, 1, 16018
- Zhou et al. 2020 Zhou, X.; Wang, Z.; Epsztein, R.; Zhan, C.; Li, W.; Fortner, J. D.; Pham, T. A.; Kim, J.-H.; Elimelech, M. Intrapore energy barriers govern ion transport and selectivity of desalination membranes. Sci. Adv. 2020, 6, eabd9045
- Wang et al. 2020 Wang, Z.; Deshmukh, A.; Du, Y.; Elimelech, M. Minimal and zero liquid discharge with reverse osmosis using low-salt-rejection membranes. Water Research 2020, 170, 115317
- Epsztein et al. 2020 Epsztein, R.; DuChanois, R. M.; Ritt, C. L.; Noy, A.; Elimelech, M. Towards single-species selectivity of membranes with subnanometre pores. Nat. Nanotechnol. 2020, 15, 426–436
- Faucher et al. 2019 Faucher, S.; Aluru, N.; Bazant, M. Z.; Blankschtein, D.; Brozena, A. H.; Cumings, J.; Pedro De Souza, J.; Elimelech, M.; Epsztein, R.; Fourkas, J. T. et al. Critical Knowledge Gaps in Mass Transport through Single-Digit Nanopores: A Review and Perspective. J. Phys. Chem. C 2019, 123, 21309–21326
- Saavedra et al. 2024 Saavedra, A.; Valdés, H.; Velásquez, J.; Hernández, S. Comparative Analysis of Donnan Steric Partitioning Pore Model and Dielectric Exclusion Applied to the Fractionation of Aqueous Saline Solutions through Nanofiltration. ChemEngineering 2024, 8, 39
- Freger 2023 Freger, V. Dielectric exclusion, an éminence grise. Advances in Colloid and Interface Science 2023, 319, 102972
- Sun et al. 2024 Sun, F.; Li, K.; Li, N.; Yin, J.; Xue, Y.; Gu, Y.; Qi, L.; Li, M.; Yao, Y.; Zhang, X. Exploring mass transfer mechanisms in reverse osmosis membranes: A comparative study of SDM and DSPM-DE models. Desalination 2024, 586, 117833
- Lu et al. 2023 Lu, C.; Hu, C.; Chen, Z.; Wang, P.; Feng, F.; He, G.; Wang, F.; Zhang, Y.; Liu, J. Z.; Zhang, X. et al. Dehydration-enhanced ion-pore interactions dominate anion transport and selectivity in nanochannels. Sci. Adv. 2023, 9, eadf8412
- Pavluchkov et al. 2022 Pavluchkov, V.; Shefer, I.; Peer-Haim, O.; Blotevogel, J.; Epsztein, R. Indications of ion dehydration in diffusion-only and pressure-driven nanofiltration. Journal of Membrane Science 2022, 648, 120358
- Chen et al. 2023 Chen, Z.; Hu, C.; Lu, C.; Sun, J.; Zhang, Y.; Wang, F.; Qu, J. Steric Hindrance-Induced Dehydration Promotes Cation Selectivity in Trans-Subnanochannel Transport. ACS Nano 2023, 17, 12629–12640
- Zhang et al. 2023 Zhang, J.; Lin, Y.; Zhang, Y.; Wu, B.; Cao, X.; Shi, Z.; Xu, Z.; Ying, J.; Jin, Y.; She, Q. et al. The role of ion‐membrane interactions in fast and selective mono/multivalent ion separation with hierarchical nanochannels. AIChE Journal 2023, 69, e18232
- Meng et al. 2024 Meng, Q.-W.; Zhu, X.; Xian, W.; Wang, S.; Zhang, Z.; Zheng, L.; Dai, Z.; Yin, H.; Ma, S.; Sun, Q. Enhancing ion selectivity by tuning solvation abilities of covalent-organic-framework membranes. Proc. Natl. Acad. Sci. U.S.A. 2024, 121, e2316716121
- Sahu et al. 2017 Sahu, S.; Di Ventra, M.; Zwolak, M. Dehydration as a Universal Mechanism for Ion Selectivity in Graphene and Other Atomically Thin Pores. Nano Lett. 2017, 17, 4719–4724
- Sahu and Ali 2023 Sahu, P.; Ali, S. M. Dehydration induced selective ion trapping by topology constrained atomically thin graphene-crown membranes. Mol. Syst. Des. Eng. 2023, 8, 1540–1558
- Richards et al. 2012 Richards, L. A.; Schäfer, A. I.; Richards, B. S.; Corry, B. The Importance of Dehydration in Determining Ion Transport in Narrow Pores. Small 2012, 8, 1701–1709
- Song and Corry 2009 Song, C.; Corry, B. Intrinsic Ion Selectivity of Narrow Hydrophobic Pores. J. Phys. Chem. B 2009, 113, 7642–7649
- Xie et al. 2024 Xie, Y.; Huang, C.-Q.; Zhou, K.; Liu, Y. Unveiling the transport of water and ions in the nanocage of zeolitic imidazolate frameworks by molecular dynamics. Applied Surface Science 2024, 652, 159311
- Xu et al. 2024 Xu, T.; Wu, B.; Li, W.; Li, Y.; Zhu, Y.; Sheng, F.; Li, Q.; Ge, L.; Li, X.; Wang, H. et al. Perfect confinement of crown ethers in MOF membrane for complete dehydration and fast transport of monovalent ions. Sci. Adv. 2024, 10, eadn0944
- Malani et al. 2010 Malani, A.; Murad, S.; Ayappa, K. Hydration of ions under confinement. Molecular Simulation 2010, 36, 579–589
- Malani et al. 2006 Malani, A.; Ayappa, K.; Murad, S. Effect of confinement on the hydration and solubility of NaCl in water. Chemical Physics Letters 2006, 431, 88–93
- Lu et al. 2021 Lu, C.; Hu, C.; Ritt, C. L.; Hua, X.; Sun, J.; Xia, H.; Liu, Y.; Li, D.-W.; Ma, B.; Elimelech, M. et al. In Situ Characterization of Dehydration during Ion Transport in Polymeric Nanochannels. J. Am. Chem. Soc. 2021, 143, 14242–14252
- Epsztein et al. 2019 Epsztein, R.; Shaulsky, E.; Qin, M.; Elimelech, M. Activation behavior for ion permeation in ion-exchange membranes: Role of ion dehydration in selective transport. Journal of Membrane Science 2019, 580, 316–326
- Pataroque et al. 2024 Pataroque, K.; Wu, J.; He, J.; Fan, H.; Mahajan, S.; Guo, K.; Le, J.; Au, K.; Wang, L.; Li, Y. et al. Salt partitioning and transport in polyamide reverse osmosis membranes at ultrahigh pressures. Journal of Membrane Science Letters 2024, 4, 100079
- Chen et al. 2020 Chen, X.; Boo, C.; Yip, N. Y. Transport and structural properties of osmotic membranes in high-salinity desalination using cascading osmotically mediated reverse osmosis. Desalination 2020, 479, 114335
- Roy et al. 2016 Roy, S.; Baer, M. D.; Mundy, C. J.; Schenter, G. K. Reaction Rate Theory in Coordination Number Space: An Application to Ion Solvation. J. Phys. Chem. C 2016, 120, 7597–7605
- Brancato and Barone 2011 Brancato, G.; Barone, V. Free Energy Landscapes of Ion Coordination in Aqueous Solution. J. Phys. Chem. B 2011, 115, 12875–12878
- Annapureddy and Dang 2014 Annapureddy, H. V. R.; Dang, L. X. Understanding the Rates and Molecular Mechanism of Water-Exchange around Aqueous Ions Using Molecular Simulations. J. Phys. Chem. B 2014, 118, 8917–8927
- Richards et al. 2013 Richards, L. A.; Richards, B. S.; Corry, B.; Schäfer, A. I. Experimental Energy Barriers to Anions Transporting through Nanofiltration Membranes. Environ. Sci. Technol. 2013, 47, 1968–1976
- Kameda et al. 2018 Kameda, Y.; Maeda, S.; Amo, Y.; Usuki, T.; Ikeda, K.; Otomo, T. Neutron Diffraction Study on the Structure of Hydrated Li in Dilute Aqueous Solutions. J. Phys. Chem. B 2018, 122, 1695–1701
- Dang et al. 2006 Dang, L. X.; Schenter, G. K.; Glezakou, V.-A.; Fulton, J. L. Molecular Simulation Analysis and X-ray Absorption Measurement of Ca , K and Cl Ions in Solution. J. Phys. Chem. B 2006, 110, 23644–23654
- Varma and Rempe 2006 Varma, S.; Rempe, S. B. Coordination numbers of alkali metal ions in aqueous solutions. Biophysical Chemistry 2006, 124, 192–199
- Gowers et al. 2016 Gowers, R.; Linke, M.; Barnoud, J.; Reddy, T.; Melo, M.; Seyler, S.; Domański, J.; Dotson, D.; Buchoux, S.; Kenney, I. et al. MDAnalysis: A Python Package for the Rapid Analysis of Molecular Dynamics Simulations. Austin, Texas, 2016; pp 98–105
- Sengupta et al. 2021 Sengupta, A.; Li, Z.; Song, L. F.; Li, P.; Merz, K. M. Parameterization of Monovalent Ions for the OPC3, OPC, TIP3P-FB, and TIP4P-FB Water Models. J. Chem. Inf. Model. 2021, 61, 869–880
- Martínez et al. 2009 Martínez, L.; Andrade, R.; Birgin, E. G.; Martínez, J. M. PACKMOL: a package for building initial configurations for molecular dynamics simulations. Journal of computational chemistry 2009, 30, 2157–2164, Publisher: Wiley Online Library
- Páll et al. 2015 Páll, S.; Abraham, M. J.; Kutzner, C.; Hess, B.; Lindahl, E. In Solving Software Challenges for Exascale; Markidis, S., Laure, E., Eds.; Springer International Publishing: Cham, 2015; Vol. 8759; pp 3–27, Series Title: Lecture Notes in Computer Science
- Abraham et al. 2015 Abraham, M. J.; Murtola, T.; Schulz, R.; Páll, S.; Smith, J. C.; Hess, B.; Lindahl, E. GROMACS: High performance molecular simulations through multi-level parallelism from laptops to supercomputers. SoftwareX 2015, 1-2, 19–25
- Jorgensen et al. 1983 Jorgensen, W. L.; Chandrasekhar, J.; Madura, J. D.; Impey, R. W.; Klein, M. L. Comparison of simple potential functions for simulating liquid water. The Journal of Chemical Physics 1983, 79, 926–935
- Wang et al. 2014 Wang, L.-P.; Martinez, T. J.; Pande, V. S. Building Force Fields: An Automatic, Systematic, and Reproducible Approach. J. Phys. Chem. Lett. 2014, 5, 1885–1891
- Izadi and Onufriev 2016 Izadi, S.; Onufriev, A. V. Accuracy limit of rigid 3-point water models. The Journal of Chemical Physics 2016, 145, 074501
- Horn et al. 2004 Horn, H. W.; Swope, W. C.; Pitera, J. W.; Madura, J. D.; Dick, T. J.; Hura, G. L.; Head-Gordon, T. Development of an improved four-site water model for biomolecular simulations: TIP4P-Ew. The Journal of Chemical Physics 2004, 120, 9665–9678
- Izadi et al. 2014 Izadi, S.; Anandakrishnan, R.; Onufriev, A. V. Building Water Models: A Different Approach. J. Phys. Chem. Lett. 2014, 5, 3863–3871
- Paliwal and Shirts 2023 Paliwal, H.; Shirts, M. A water model with improved thermodynamic properties over a large pressure and temperature range optimized using multistate reweighting and configuration space mapping. 2023; https://chemrxiv.org/engage/chemrxiv/article-details/653d871bc573f893f1586395
- Li et al. 2015 Li, P.; Song, L. F.; Merz, K. M. Systematic Parameterization of Monovalent Ions Employing the Nonbonded Model. J. Chem. Theory Comput. 2015, 11, 1645–1657
- Li et al. 2020 Li, Z.; Song, L. F.; Li, P.; Merz, K. M. Systematic Parametrization of Divalent Metal Ions for the OPC3, OPC, TIP3P-FB, and TIP4P-FB Water Models. J. Chem. Theory Comput. 2020, 16, 4429–4442
- The PLUMED consortium 2019 The PLUMED consortium Promoting transparency and reproducibility in enhanced molecular simulations. Nat Methods 2019, 16, 670–673
- Michaud‐Agrawal et al. 2011 Michaud‐Agrawal, N.; Denning, E. J.; Woolf, T. B.; Beckstein, O. MDAnalysis: A toolkit for the analysis of molecular dynamics simulations. J Comput Chem 2011, 32, 2319–2327
- Cohen et al. 2023 Cohen, O. A.; Macdermott-Opeskin, H.; Lee, L.; Hou, T.; Fong, K. D.; Kingsbury, R.; Wang, J.; Persson, K. A. SolvationAnalysis: A Python toolkit for understandingliquid solvation structure in classical molecular dynamicssimulations. JOSS 2023, 8, 5183
- Shefer et al. 2022 Shefer, I.; Lopez, K.; Straub, A. P.; Epsztein, R. Applying Transition-State Theory to Explore Transport and Selectivity in Salt-Rejecting Membranes: A Critical Review. Environ. Sci. Technol. 2022, 56, 7467–7483
- Shirts and Chodera 2008 Shirts, M. R.; Chodera, J. D. Statistically optimal analysis of samples from multiple equilibrium states. The Journal of Chemical Physics 2008, 129, 124105
- Zhang et al. 2022 Zhang, C.; Yue, S.; Panagiotopoulos, A. Z.; Klein, M. L.; Wu, X. Dissolving salt is not equivalent to applying a pressure on water. Nat Commun 2022, 13, 822
- Skinner et al. 2016 Skinner, L. B.; Galib, M.; Fulton, J. L.; Mundy, C. J.; Parise, J. B.; Pham, V.-T.; Schenter, G. K.; Benmore, C. J. The structure of liquid water up to 360 MPa from x-ray diffraction measurements using a high Q-range and from molecular simulation. The Journal of Chemical Physics 2016, 144, 134504
- Tonti and Floris 2021 Tonti, L.; Floris, F. M. How increasing pressure affects the ion hydration structure and shell properties at ambient temperature. Journal of Molecular Liquids 2021, 328, 115341
- Scott 1992 Scott, D. W. Multivariate Density Estimation: Theory, Practice, and Visualization, 1st ed.; Wiley Series in Probability and Statistics; Wiley, 1992
- Schmid et al. 2000 Schmid, R.; Miah, A. M.; Sapunov, V. N. A new table of the thermodynamic quantities of ionic hydration: values and some applications (enthalpy–entropy compensation and Born radii). Phys. Chem. Chem. Phys. 2000, 2, 97–102
- Marcus 1991 Marcus, Y. Thermodynamics of solvation of ions. Part 5.—Gibbs free energy of hydration at 298.15 K. J. Chem. Soc., Faraday Trans. 1991, 87, 2995–2999
- Rinne et al. 2014 Rinne, K. F.; Gekle, S.; Netz, R. R. Dissecting ion-specific dielectric spectra of sodium-halide solutions into solvation water and ionic contributions. The Journal of Chemical Physics 2014, 141, 214502
- Lim et al. 2024 Lim, Y. J.; Nadzri, N.; Lai, G. S.; Wang, R. Demystifying the compaction effects of TFC polyamide membranes in the desalination of hypersaline brine via high-pressure RO. Journal of Membrane Science 2024, 707, 122950
- Fan et al. 2024 Fan, H.; Elimelech, M.; Biesheuvel, P. Theory of expansion and compression of polymeric materials: Implications for membrane solvent flow under compaction. Journal of Membrane Science 2024, 697, 122576
Supporting Information for “Molecular details and free energy barriers of ion de-coordination at elevated salinity and pressure”
S1 All-molecule coordination number better represents the true size of the coordination shell
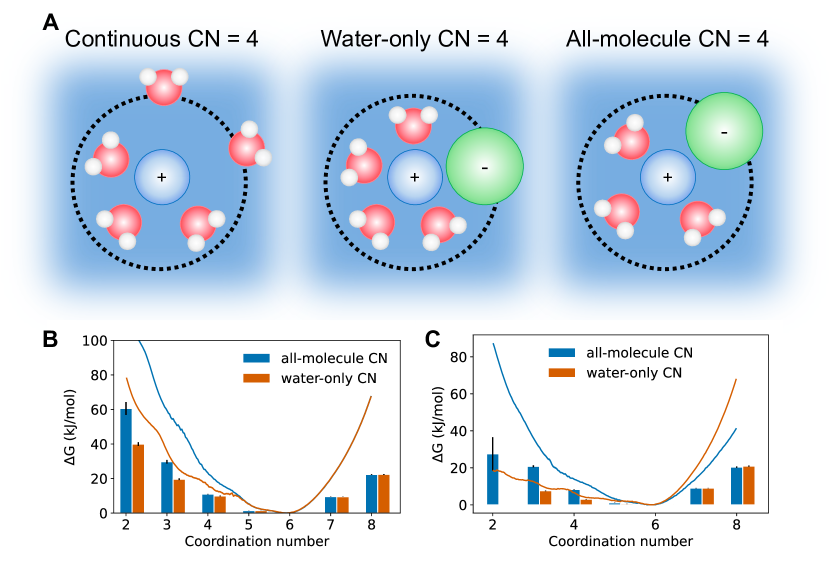
We explored definitions of the coordination number in order to more clearly define the mechanism important for membrane transport and the associated free energy barriers we estimated. We show theoretical coordination shells with coordination number 4 for these definitions in Figure S1. We began with the hydration shell, or only counting coordinating water molecules. When biasing the simulation in the hydration number, counterions can enter the hydration shell to fill the void left by the dehydrated water molecule as shown in the middle panel of Figure S1A. As a result, the free energy to reduce the hydration number is low, especially at high concentration. We then defined the coordination number as the total number of molecules within an ion’s shell, including any type of ion. As a result, reducing the coordination number always corresponded to fewer molecules in the shell. We argue that reducing the number of molecules that must transport with a given ion is more physically relevant than only considering the water molecules. We also illustrate coordination number 4 calculated by the switching function in order to have a continuous collective variable that is a function of the atomic coordinates, which is necessary to apply bias with Plumed. We provide more information on this definition in Supplementary Information Section Sensitivity to switching function. We calculated the continuous free energy surface and the free energies of coordination number states in the same way for both definitions of coordination number, and we provide an example of these calculations on Github at https://github.com/schwinns/solvation_shells/tree/main.
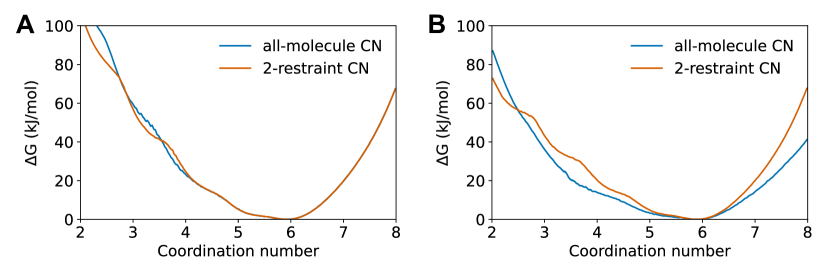
We also calculated the free energy surface using the water-only coordination number with an additional restraint applied to the counterion coordination number, i.e. the number of counterions within the hydration shell radius. The restraint in counterion coordination prevents the simulation from sampling configurations with a counterion in the hydration shell. Figure S2 shows the continuous free energy surface for the all-molecule coordination number definition compared to that calculated with the second restraint at low (A) and high (B) concentration. The free energies are very similar at low concentration, since not many configurations can have counterions in the shell. The free energy calculated with the second restraint is significantly higher at high concentration, since it is more favorable to fill the shell with counterions at low coordination number. To calculate the free energy with the second restraint, we reweight the simulations accounting for both harmonic restraints, but calculate the free energy surface in a single collective variable – the water-only coordination number. We must have sampling overlap between the water-only coordination number umbrellas, but we include only one umbrella in counterion coordination.
S2 Sensitivity to switching function
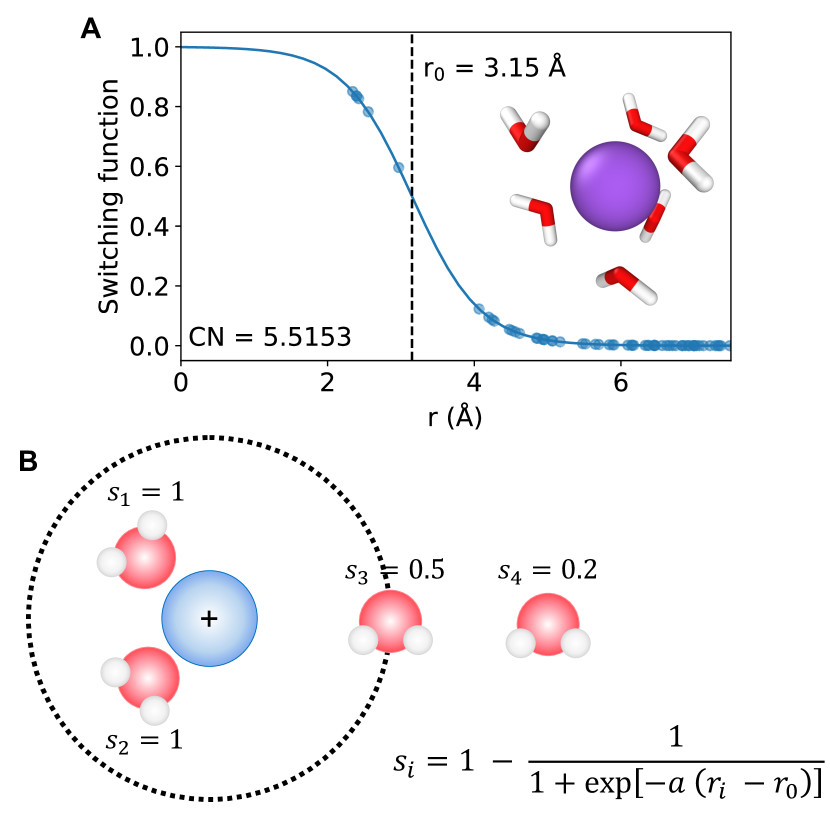
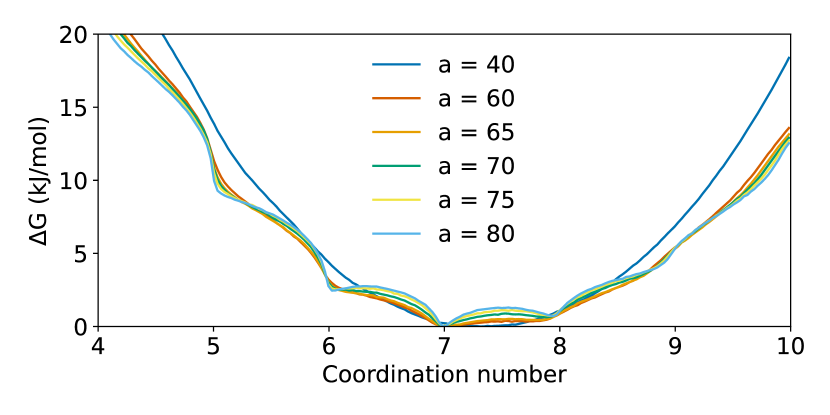
The switching function parameter (equation in Figure S3B) is a nonphysical parameter that controls the steepness of the switching function, and it is necessary for numerical stability when applying bias to the coordination number in Plumed. Plumed requires the collective variable to be a continuous function of the atomic coordinates at a given time step. Since the is not physically-motivated, we tested the sensitivity of the free energy calculations to this parameter. Figure S3A shows the switching function plotted for single frame from the umbrella simulations of Na+. Physically, the coordination number is 6 as shown in the inlaid image, but the switching function calculated coordination number is 5.5153. Each molecule’s contribution to the coordination number is shown as a scatter point, and points near the cutoff only contribute 0.5 as shown in the illustration in Figure S3B. Increasing will make the switching function closer to a discrete counting function, but if it is too steep, it causes numerical instability. High values also result in sharp minima in the free energy surface as shown in Figure S4. On the other hand, decreasing too much moves the free energy minimum farther from the true integer value, which can be seen in the = 40 case on Figure S4.
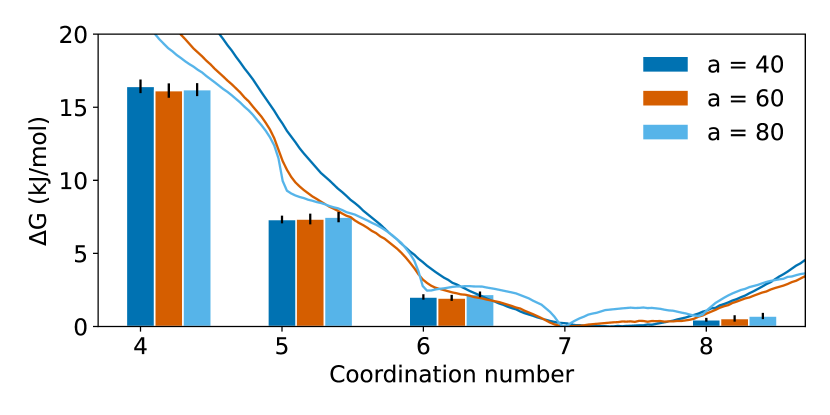
We largely eliminated the dependence on the switching function parameter by reweighting the continuous coordination number configurations to the discrete distribution. Following the procedure described in the main text, we calculated the free energies of the (discrete) coordination number states. These free energies are statistically indistinguishable for all values. Figure S5 shows the free energies of coordination number states for three switching functions for Rb+.
S3 Dependence on force field parameters
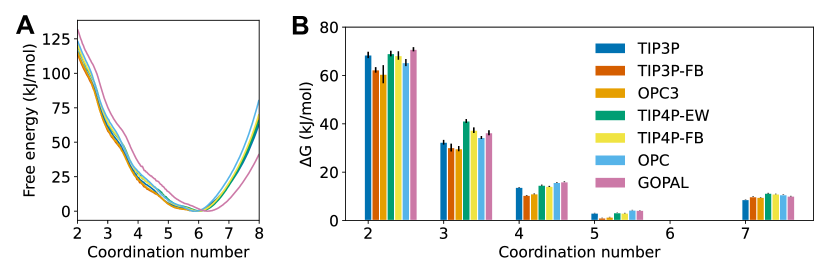
Since non-polarizable water models are less accurate with ions, we examined how seven different non-polarizable water models affected the de-coordination free energies for Na+. We tested a range of three- and four-point water models as described in the main text. Figure S6A shows the free energy surfaces in the continuous coordination number for all water models tested, and Figure S6B shows the free energies of the coordination number states. Both the free energy surfaces and the discrete free energies are qualitatively similar for all water models. We used OPC3 water for all our results. It is consistent with the other water models, and it produces the best pure water properties of the less expensive three-point models.
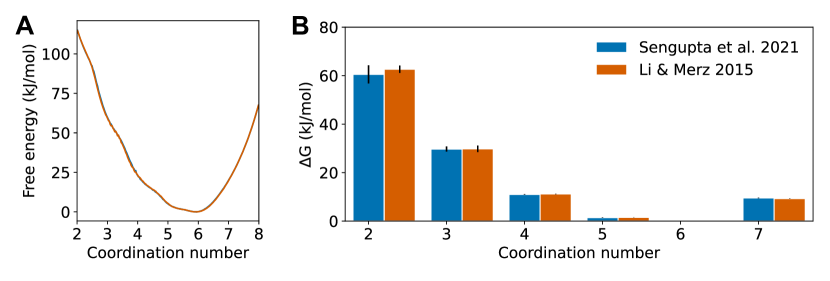
With our chosen water model, we tested how sensitive the de-coordination free energies are to the ion parameters. We calculated the free energies for Na+ in OPC3 water using ion parameters optimized for OPC3 (Sengupta et al. 2021) 35 and those optimized for TIP3P (Li & Merz 2015) 45. Figure S7 depicts the continuous coordination number free energy surfaces (A) and free energies of the discrete coordination number states (B) for the two ion parameter sets.
S4 RDFs, limiting area distributions, and de-coordination free energies for all ions as a function of pressure
S5 RDFs, limiting area distributions, and de-coordination free energies for all ions as a function of concentration
S6 Details on the calculation of cross-sectional area of the shell
-
•
Locate all atoms within hydration shell radius.
-
•
Generate 3D point cloud on the surface of the van der Waals spheres for those molecules (Figure S20A).
-
•
Create polyhedron from point cloud using convex hull (Figure S20B).
-
•
Calculate the principal component of the vertices of the polyhedron (Figure S20C).
-
•
Create polygon from the plane intersecting the polyhedron, perpendicular to the principal component
-
•
Repeat for the entire length of the principal axis
-
•
Save the maximum cross-section along the principal axis (Figure S20D).
S7 Umbrella simulation configurations
Please refer to the attached machine-readable tableS1.csv.