20XX Vol. X No. XX, 000–000
22institutetext: Department of Astronomy, Tsinghua University, Beijing 100084, China; dili@tsinghua.edu.cn
33institutetext: National Astronomical Observatories, Chinese Academy of Sciences, 20A Datun Road, Beijing 100101, China
44institutetext: CSIRO Astronomy Space Science, Australia Telescope National Facility, P.O. Box 76, Epping, NSW 1710, Australia
55institutetext: School of Mathematical and Physical Sciences and MQ Research Centre in Astronomy, Astrophysics, and Astrotechnology, Macquarie University, 2109, NSW, Australia
66institutetext: Department of Physics and Astronomy, Carleton College, Northfield, MN 55057
77institutetext: Department of Physics, Anhui Normal University, Wuhu, Anhui 241002, People’s Republic of China
88institutetext: Institut de Radioastronomie Millimetrique, 300 rue de la Piscine, 38400, Saint-Martin dH́eres, France
99institutetext: Canadian Institute for Theoretical Astrophysics, University of Toronto, 60 St. George Street, Toronto, ON M5S 3H8, Canada
\vs\noReceived 20XX Month Day; accepted 20XX Month Day
First Search for Pulsed CH Maser Emission Stimulated by a Pulsar
Abstract
We present the first search for pulsed CH maser emission potentially stimulated by PSR J16444559, conducted using the ultra-wide-bandwidth low-frequency receiver on Murriyang, CSIRO’s Parkes Radio Telescope. Observations targeted three CH -doublet transitions at 3264, 3335, and 3349 MHz, with a variability timescale of 78 ms. We detected ten CH emission features at 3335 and 3349 MHz, and seven features at 3264 MHz, during both pulsar-ON and pulsar-OFF phases. The observed velocities align with the OH emission and absorption reported by a previous study, suggesting a close spatial association between CH and OH molecules. The derived column densities for CH clouds within the Parkes beam range from to cm-2, indicating that these clouds are likely in diffuse and translucent states. Upper limits for CH column densities within the pulsar beam ranged from to cm-2. Comparison of these column densities suggests that CH clouds may exhibit clumpiness and substructure. No significant stimulated emission feature was detected in the optical depth spectra. Additionally, as part of our search for pulsed stimulated emission, we investigated the potential CH absorption of the pulsar signal and found none, in agreement with astrophysical expectations. The upper limits for the potential maser amplification factors towards PSR J16444559 at 3264, 3335, and 3349 MHz are 1.014, 1.009, and 1.009, respectively. This study demonstrates the feasibility of detecting pulsed CH maser emission in the interstellar medium stimulated by pulsar photons.
1 Introduction
The only reported instance of natural, fast-switching stimulated emission was observed toward PSR J16444559 (also known as B164145) in the hydroxyl radical (OH) 1720 MHz transition (Weisberg et al. 2005). Utilizing gated-mode observations at Murriyang, CSIRO’s Parkes Radio Telescope, the pulsar data were binned every 14 ms to produce pulsar-ON and pulsar-OFF spectra. For the 455 ms period of J16444559, this time resolution corresponds to 1/32 of the full phase. Since the flux change appeared instantaneous at this time interval, Weisberg et al. (2005) claimed such pulsar-stimulated emission to be the shortest fluctuation observed in any interstellar masers.
PSR J16444559 is the only source, out of a sample of 18 pulsars chosen by Weisberg et al. (2005) for OH absorption studies, to exhibit pulsar-stimulated emission; demonstrating the uncommon nature of this phenomenon. The Parkes OH spectra of J16444559 are complex, exhibiting a mix of absorption, emission (stimulated and not), and conjugate relations between OH transitions. The richness of ISM structures and conditions within the telescope beam present both challenges and incentives for further investigation of this intriguing phenomenon. The pulsar-OFF spectrum samples material within the entire telescope beam, while the pulsar-ON spectrum probes a pencil-beam volume through the ISM; thereby providing a natural differential tracer of millisecond time scale variability of spectral lines.
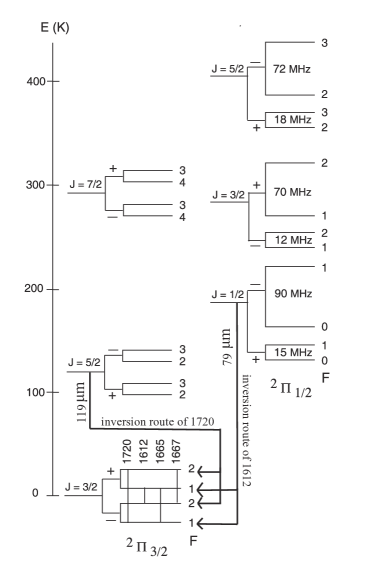
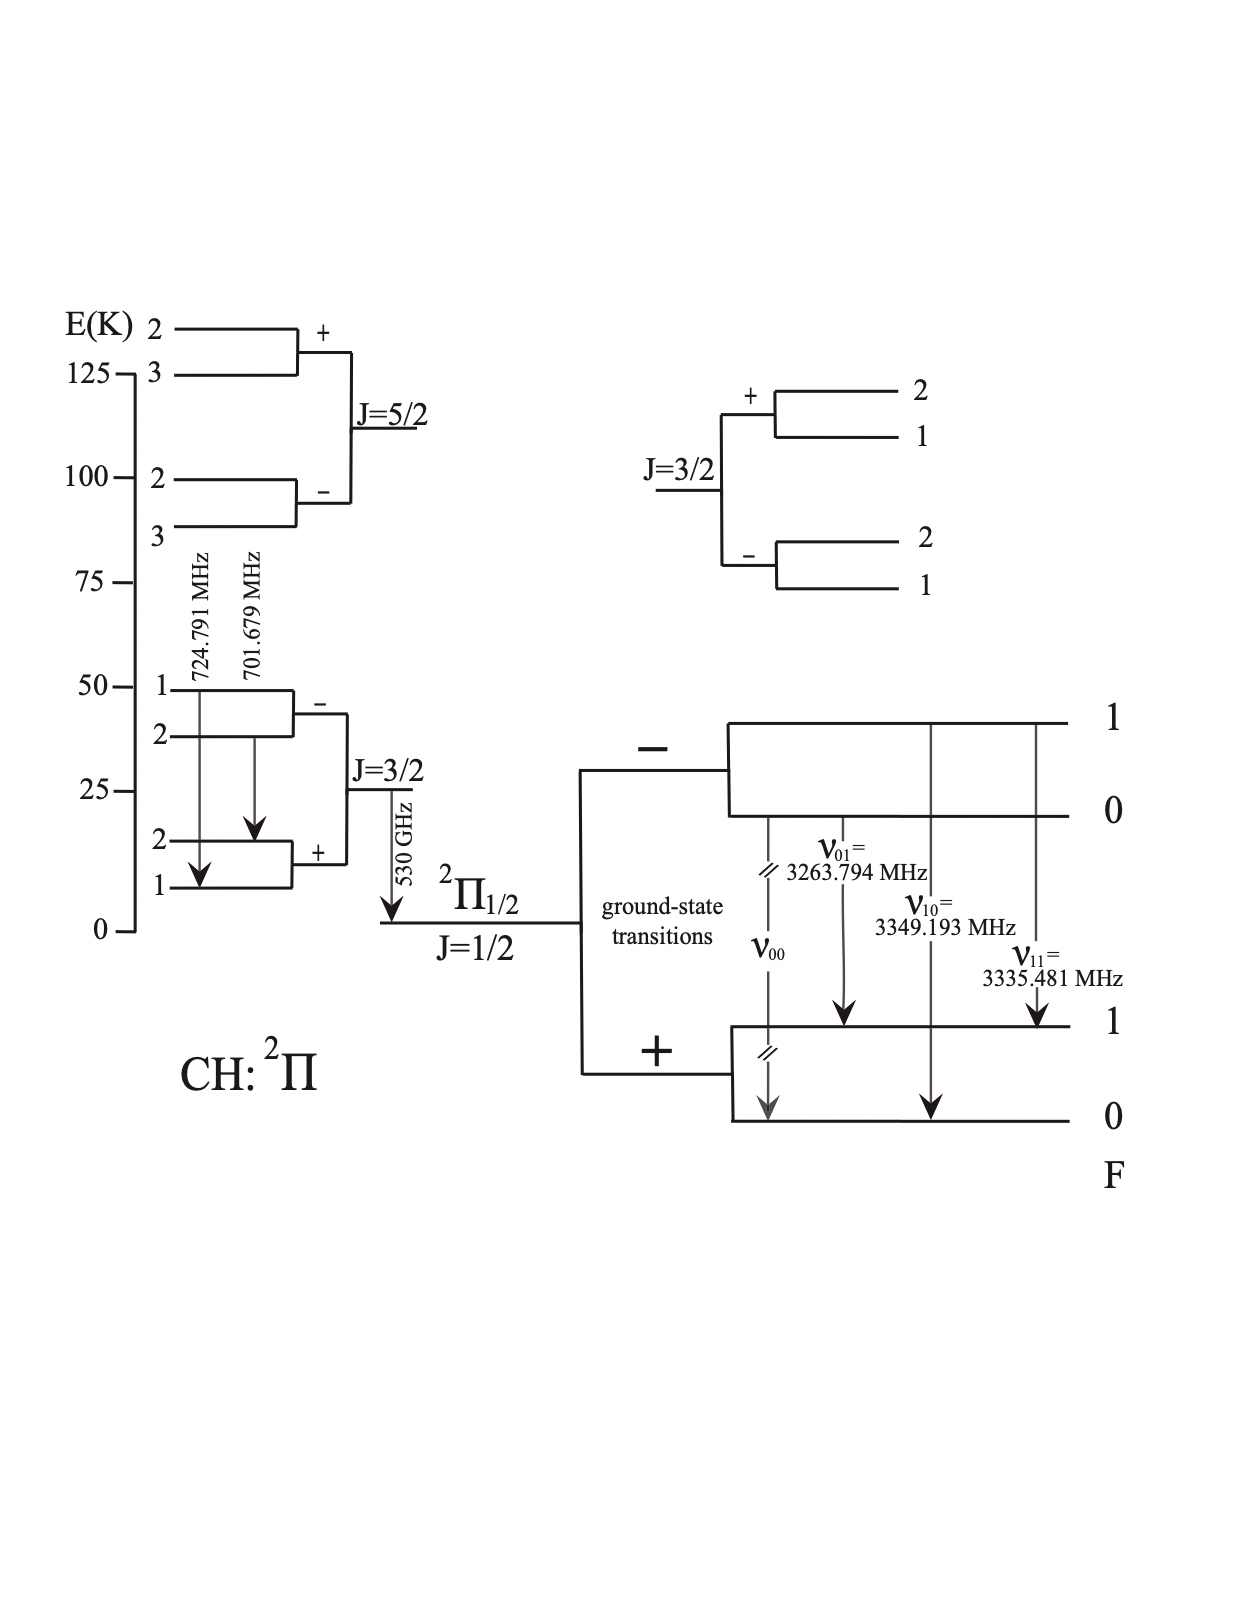
The -doubling transitions of CH around 3.3 GHz are similar in many ways to those of OH in the L-band, as shown in Figure 1. The -doubling energy levels lie in 3.3 GHz bands with modest A-coefficients, while the rotational transitions lie in the submillimeter to far-infrared bands. Such configurations can lead to an excess population in the upper levels of the -doubling transitions, resulting in phenomena like masers (Elitzur 1992). In fact, the ground-state transitions of CH tend to be anomalously excited (Turner 1988; Tang et al. 2021; Jacob et al. 2021; Jacob 2023). While Hi has been studied in absorption towards pulsars for decades (e.g. Weisberg et al. 1979; Clifton et al. 1988; Frail et al. 1994; Johnston et al. 2003; Stanimirović et al. 2010; Liu et al. 2021), OH has only been clearly detected toward three pulsars out of about 30 targets searched (B: Stanimirović et al. 2003; B: Weisberg et al. 2005; B: Minter 2008). Currently, no study has ever tried to search for CH absorption or emission towards pulsars. Astrochemically, both OH and CH are simple hydrides expected to be abundant in regions of intermediate extinction, where molecular hydrogen has formed but there is insufficient shielding for CO to reach stable abundance. Several studies have demonstrated that OH and CH both trace the so-called ”dark molecular gas” (DMG) effectively and correlate well with each other (Xu et al. 2016; Xu & Li 2016; Li et al. 2018; Tang et al. 2021). Therefore, it is natural to expect stimulated amplification of pulsar radiation through both OH and CH transitions along the same sightlines.
Murriyang, CSIRO’s Parkes Radio Telescope, equipped with the ultra-wide-bandwidth low-frequency receiver (UWL), enables simultaneous recording of three CH 3.3 GHz transitions (Hobbs et al. 2020). As Liu et al. (2021) demonstrated the capability of generating pulsar pulse-phase-resolved HI spectra using the UWL, it is straightforward to extend this technique to search for CH maser emission and to then investigate its variability on millisecond timescales towards PSR J16444559. In this work, we present the first search for pulsar absorption and pulsed CH maser emission stimulated by PSRJ16444559, achieving high sensitivity with the Parkes UWL.
2 Observations and Data Reduction
Observations of the hyperfine structure lines between the -doublet of CH in the state towards PSR J16444559 were conducted from February 2022 to April 2023 using the UWL on Murriyang, CSIRO’s Parkes Radio Telescope. The total integration time for each of the three -doubling transitions of CH in the state, at the rest frequencies of 3335.481 (main line ), 3263.794 (lower satellite line ), and 3349.193 MHz (upper satellite line ), is 71 hours. Similar to Liu et al. (2021), the data were recorded in baseband mode across the entire subband 20 with frequency coverage from 3264–3392 MHz, allowing simultaneous detection of the three CH transitions at 3264, 3335, and 3349 MHz. The velocity at the 3264 MHz band edge, relative to the rest frequency of 3263.794 MHz, is km s-1. Considering the projected velocity of the telescope with respect to the local standard of rest (LSR), it is still capable of detecting spectral components with LSR velocities more negative than km s-1. Since the OH absorption and emission observed towards PSRJ1644 are concentrated at velocities below km s-1, we are able to detect these clouds in CH 3263.794 MHz transition at subband 20. A calibrator source (CAL) was injected while pointing 1 degree away from the pulsar position (RA=16h44m49.2s, Dec= \dg59′ 09.7′′) after each hour of integration to perform flux calibration.
The pulsar baseband data were coherently dedispersed and folded synchronously with the pulsar period (455.078 ms) for each 10-second integration using the DSPSR package (van Straten & Bailes 2011). This produced datasets with 128 phase bins and 262144 frequency channels, achieving a frequency resolution of 0.49 kHz (or 0.044 km s-1 velocity resolution) and a time resolution of 78.1 ms. The CAL baseband data were folded in sync with the CAL period (0.09 s) for each 10-second integration, resulting in data cubes with 32 phase bins and a frequency resolution of 0.49 kHz. Flux calibration was performed using the pac command from the PSRCHIVE package (van Straten et al. 2012), applying calibration solutions from the observatory based on observations of flux calibrators 0407658 and 1934638 taken nearest in time to our observations. The final calibrated data are in units of Jy.
The dataset is potentially contaminated by radio frequency interference (RFI). For strong, wide-band RFI, the affected sub-integrations were identified and subsequently removed from the dataset. For narrow-bandwidth, time-variable RFI, channels with values exceeding , where is the standard deviation of each frequency channel over a 10-minute pulsar-off observation, were removed from subsequent integration.
Assuming a source that fills the telescope beam, the brightness temperature can be derived from the flux density observed at a frequency using the Rayleigh-Jeans relation
| (1) |
where is the Boltzmann constant, is the speed of light, and the beam solid angle. Based on the Gaussian main beam width of 0.13 degrees at subband 20 for the Parkes UWL (Hobbs et al. 2020), the theoretical conversion factors for three CH -doubling spectral lines at 3264, 3335, and 3349 MHz are (0.594, 0.569, and 0.564) K / Jy, respectively.
3 Results and discussion
The radiative transfer equations for pulsar-ON and -OFF measurements, after subtraction of terms that are constant across the band, are given by
| (2) | |||
| (3) |
where and denote the CH excitation temperature and pulsar temperature, respectively. The term represents the optical depth profile resulting from CH at any distance within the Parkes beam, while originates from CH within the pencil beam extending only from the pulsar to the observer.111It is implicitly assumed in this formulation that both the continuum background and the CH fill the beam. The background (i.e, beyond the CH) brightness temperature, , consists of contributions from the isotropic CMB (2.73 K) and from that portion of the Galactic continuum emission originating beyond the CH. However, it is not possible to determine observationally how much of the Galactic continuum lies behind the CH emission. Therefore, the lower limit of the background temperature is 2.73 K, while the upper limit includes contributions from both the CMB and the Galactic continuum. We followed the method outlined in Dawson et al. (2022) to estimate an upper limit for the continuum background temperature at the pulsar position by scaling the S-PASS survey data at 2300 MHz (Carretti et al. 2019). can be expressed as
| (4) |
where K is obtained from S-PASS survey data at the source position, and -2.1 is the spectral index at the source position as estimated from the S-PASS map at 2300 MHz and the CHIPASS map at 1395 MHz (Calabretta et al. 2014). The corresponding at 3.3 GHz is 6.0 K.
The baselines for the optical depth spectra were generally flat and were fitted and subsequently subtracted using a second-order polynomial. The pulsar-ON and -OFF spectra were significantly affected by instrumental baselines, making it challenging to unambiguously fit and remove the entire baseline beneath the spectral lines. To address this, the spectra were divided into three separate velocity segments containing the spectral components, and their baselines were each fitted and subtracted using a second-order polynomial, in preparation for Gaussian decomposition, as described in Section 3.1.
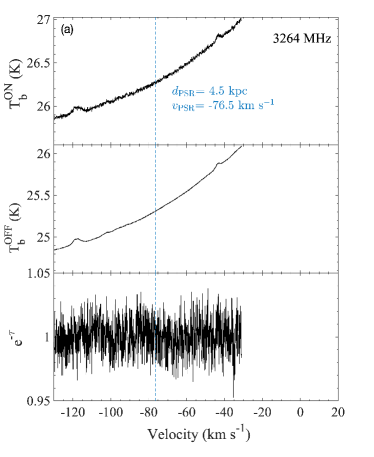
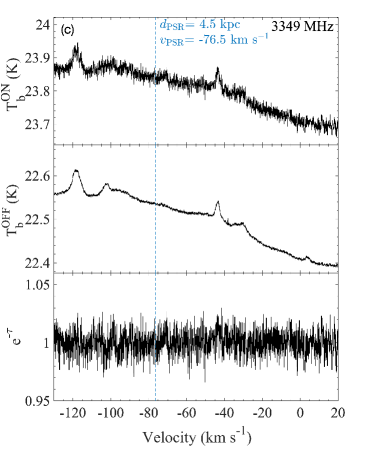
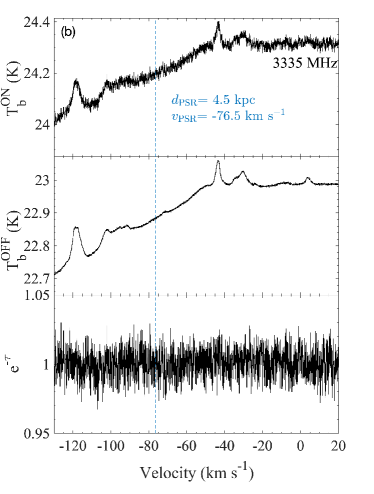
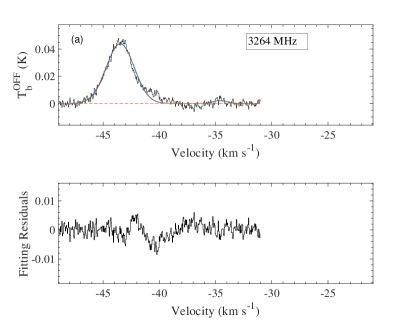
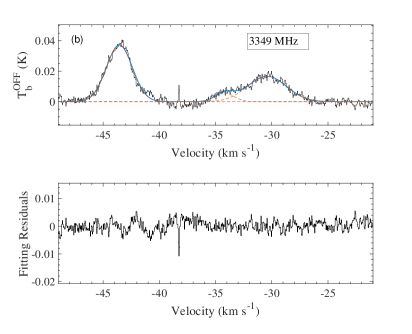
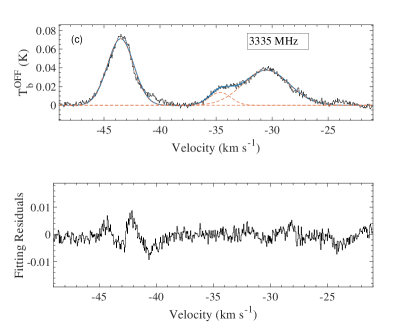
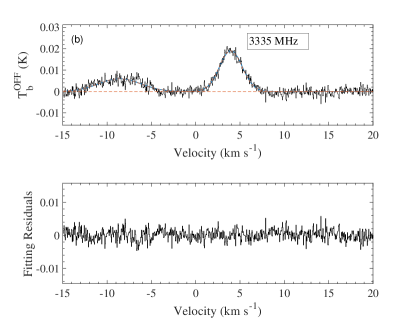
Figure 2 presents the first spectra of the three CH hyperfine transitions observed toward a pulsar (PSR J16444559). The spectra, collected during pulsar-ON and pulsar-OFF phases without baseline removal, are shown along with the corresponding optical depth spectra. Three main CH emission components are observed within the Parkes beam at velocities of , , and 5 km s-1 in both pulsar-ON and pulsar-OFF spectra.
The and km s-1 features align well with the OH absorption and emission detected toward this pulsar during OFF periods by Weisberg et al. (2005). The same LSR velocities of CH and OH spectral lines indicate the same kinematic distances of these two clouds, suggesting a close spatial association between CH and OH molecules. Such a relationship between the two species has been observed extensively from quiescent dark clouds to HII regions (e.g. Rydbeck et al. 1976; Suutarinen et al. 2011; Xu & Li 2016; Tang et al. 2021; Jacob et al. 2022). The OH features at and km s-1 exhibit both emission and absorption, demonstrating departures from local thermodynamic equilibrium (LTE). Given the similar level structure of the CH radical and OH, non-LTE conditions are also expected for CH transitions. The weakest CH component detected at 5 km s-1 was not detected in the four OH doublet transitions in state(1612, 1665, 1667, and 1720 MHz), likely due to the short integration time of 5 hours in Weisberg et al. (2005).
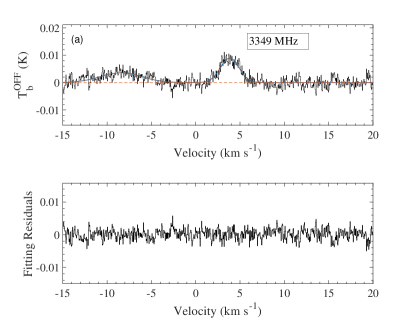
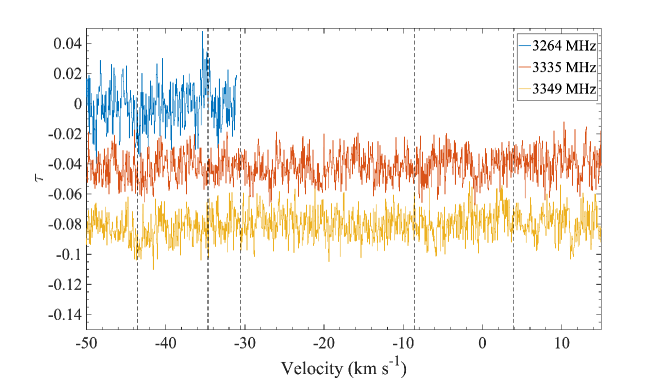
The kinematic distance of PSR J16444559 is 4.5 kpc (Verbiest et al. 2012), corresponding to the velocity with respect to Local Standard of Rest (LSR) of km s-1. Any features with velocities more negative than are more distant than the pulsar, and thus no features are expected in the optical depth spectra for the CH component at km s-1. For the and km s-1 features, which are in front of the pulsar, no significant signal is detected in the optical depth spectrum, .
3.1 Gaussian Decomposition and Column Density Estimation
Although no significant signals were detected in the optical depth spectra, clear emission components are present in both the pulsar-ON and -OFF spectra. These components can still be analyzed to constrain the properties of CH clouds within the entire Parkes beam. Additionally, upper limits can be estimated on the column densities of CH clouds pierced by the pulsar beam.
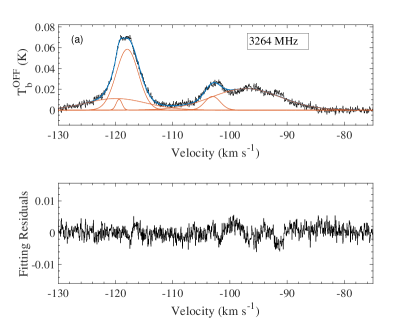
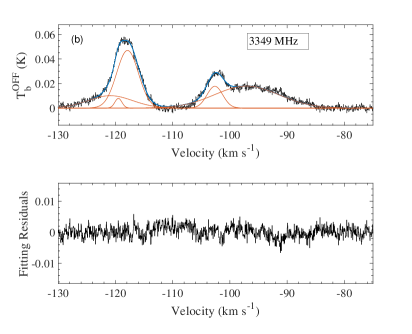
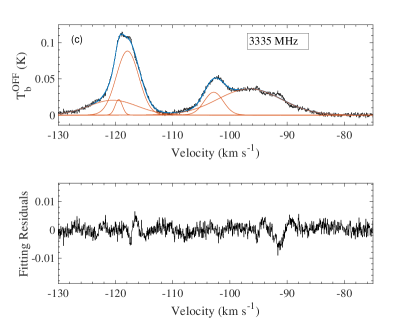
Due to the short duty cycle (1.8%) of PSR J16444559, the pulsar-ON spectra have a significantly higher noise level than the pulsar-OFF spectra. To obtain reliable Gaussian decomposition, we first use the curve fitting tool cftool in Matlab to estimate initial guesses for the Gaussian components from the pulsar-OFF spectra , which can be expressed as
| (5) |
where , , are the amplitude, central velocity, and FWHM of the th Gaussian feature, respectively. The final fitting results were refined using lsqcurvefit with a least-squares approach, allowing amplitudes, central velocities, and line widths to vary within 20% with respect to the initial estimates. The Gaussian fitting results for the three CH transitions at , , and km s-1 are shown in Figure 3 to Figure 5. The derived parameters are listed in Table 1. A total of ten Gaussian components were identified along the line of sight. Due to the frequency cutoff at 3264 MHz in subband 20, spectra at velocities greater than km s-1 can not be recorded for the 3264 MHz transition.
Under the assumption of small optical depth, the column density for the CH 3335 MHz transition detected across the entire Parkes beam in the pulsar-OFF spectra can be calculated using (Genzel et al. 1979):
| (6) |
where and are the peak brightness temperature and FWHM of the fitted Gaussian components, as listed in Table 1. The statistical weights of the levels = 2 for 3264 and 3349 MHz, and = 1 for the 3335 MHz transition line(Rydbeck et al. 1976). Since no significant signal is detected in the pulsar ONOFF spectra, we cannot simultaneously determine and . Tang et al. (2021) directly estimated the excitation temperatures for the CH transitions at 3335, 3264, and 3349 MHz using ON/OFF observations of extragalactic continuum sources. Their Monte Carlo analysis determined that the excitation temperatures for the 3335 MHz main line and the 3264 and 3349 MHz satellite lines are concentrated within the ranges , , and K, respectively. Based on these results, we adopted the average values of , , and K for at the 3264, 3335, and 3349 MHz transitions, respectively. We estimated the lower and upper limits of the CH column densities for the three transitions by incorporating the lower and upper bounds of the background temperature, with K and K. The resulting column densities for all ten CH components at 3335 and 3349 MHz, as well as seven features at 3264 MHz, are listed in Table 2.
The calculated column densities across three CH transitions from different Gaussian components during pulsar-OFF range from to , excluding feature 8 at the 3264 MHz transition due to its extremely low intensity. Previous chemical models have demonstrated a close correlation between CH and , as CH forms primarily through reactions with (Black & Dalgarno 1973; Black et al. 1975). Observationally, the relationship between CH and column densities has been established in various studies (e.g., (Liszt & Lucas 2002; Sheffer et al. 2008; Tang et al. 2021)). We adopted an average CH abundance relative to of from Tang et al. (2021), derived from observations of translucent clouds along various sightlines. Using this abundance, the column densities for the ten clouds within the Parkes beam range from to , suggesting they are likely diffuse and translucent clouds (Draine 2011).
For CH traced by the pulsar pencil beam, we consider only the components located in the foreground of the pulsar. The optical depth spectra of three CH transitions in front of the pulsar are shown in Figure 6. Five emission features are detected in the pulsar-OFF spectra within these velocity ranges, with peak positions marked by dashed lines. However, no clear absorption or emission features are observed in the optical depth spectra. We therefore estimate an upper limit for the CH column density, , by integrating the spectra over the same FWHM velocity range as each Gaussian component obtained from the pulsar-OFF spectra, expressed as
| (7) |
and are listed in Table 1. The corresponding upper limits on the column density are provided in Table 2.
The pulsar beam (0.03”, calculated from pulsar pulse scattering; (Lewandowski et al. 2013)) is much narrower than the FWHM of the Parkes beam at subband 20 (7.8 arcmin; (Hobbs et al. 2020)). Comparing the column density upper limits within the pulsar beam to the column densities observed in the Parkes beam provides insight into the clumpiness and substructure of CH clouds. While the non-detection of signal in the spectra makes it difficult to draw definitive conclusions, in some cases (e.g. Feature No. 6, 7, 9 at 3335 MHz and No. 7 at 3349 MHz as listed in Table 2), the column density upper limits observed within the pulsar beam are significantly lower than the lower limits observed in the Parkes beam. This suggests that much of the CH structures are not pierced by the pulsar pencil beam, indicating that CH clouds may exhibit clumpiness and substructure in certain regions.
3.2 Upper Limits of Potential Pulsed CH Maser Amplification Gain
Weisberg et al. (2005) discovered pulsed OH maser emission at 1720 MHz with a velocity of km s-1, stimulated by the photons from PSR J16444559, with a shortest maser variability time scale of 14 ms. The peak optical depth of the pulsed OH maser line is , indicating an unsaturated state with an amplification gain of = 1.05. Stimulated emission occurs when the relevant level populations are inverted or pumped by some process, with suitable photons available to stimulate the emission from the overpopulated level (Elitzur 1992; Weisberg et al. 2005). In the case of pulsed OH maser emission towards PSR J16444559, the OH transition levels are already inverted in the clouds due to local radiative or collisional processes, while the stimulating photons are generated by the pulsar (Weisberg et al. 2005). The CH radio emission often involves weak maser effects with an energy level structure similar to OH (Elitzur 1992). We thus estimated the upper limits of amplification gain for the potential pulsed CH maser emission by PSR J16444559, using , where is the negative value of the standard deviation of spectra for three transitions. The standard deviations of the spectra, , at the 3264, 3335, and 3349 MHz transitions were calculated over the velocity ranges of [, ] km s-1, [, ] km s-1, and [, ] km s-1, respectively. The calculation follows , where is the optical depth in the th channel, is the averaged optical depth within the velocity range, and is the number of channels in the velocity range. The resulting values of are -0.0137, -0.0091, and -0.0089 for 3264, 3335, and 3349 MHz, respectively. The corresponding upper limits for amplification gain are 1.014, 1.009, and 1.009, for the transitions at 3264, 3335, and 3349 MHz, respectively. In concrete terms, then, for every 1000 photons provided by the pulsar passing through the cloud, no more than [14, 9, 9] additional photons may be stimulated near those frequencies.
| 3264 MHz | 3335 MHz | 3349 MHz | |||||||
| Features | |||||||||
| (No.) | (mK) | (km s-1) | (km s-1) | (mK) | (km s-1) | (km s-1) | (mK) | (km s-1) | (km s-1) |
| 1 | 10.3 0.7 | -119.36 0.03 | 1.2 0.1 | 21.4 0.9 | -119.42 0.02 | 1.5 0.07 | 7.8 0.9 | -119.48 0.05 | 1.46 0.17 |
| 2 | 58.5 0.8 | -117.93 0.02 | 4.55 0.05 | 88.6 1.2 | -117.89 0.02 | 4.61 0.05 | 46.9 1.3 | -117.89 0.04 | 4.48 0.09 |
| 3 | 13.1 0.4 | -103.03 0.04 | 3.12 0.13 | 31.5 0.5 | -102.83 0.02 | 3.92 0.07 | 17.7 0.4 | -102.63 0.03 | 3.24 0.09 |
| 4 | 11 0.6 | -119.9 0.18 | 12.47 0.41 | 20.4 1 | -120.44 0.14 | 9.95 0.18 | 10 0.9 | -120.9 0.35 | 9.14 0.33 |
| 5 | 20.5 0.2 | -97.19 0.1 | 14.22 0.18 | 36.2 0.2 | -96.58 0.07 | 13.02 0.11 | 17.9 0.2 | -97.07 0.09 | 13.24 0.16 |
| 6 | 44 0.4 | -43.5 0.01 | 2.92 0.03 | 71.1 0.5 | -43.53 0.01 | 2.77 0.02 | 37.2 0.4 | -43.58 0.01 | 2.72 0.03 |
| 7 | – | – | – | 37.5 0.4 | -30.55 0.04 | 4.87 0.09 | 16.7 0.3 | -30.44 0.05 | 4.04 0.12 |
| 8 | 2.1 0.7 | -34.63 0.27 | 1.44 0.66 | 13.8 0.6 | -34.64 0.05 | 2.28 0.13 | 5.6 0.5 | -34.2 0.09 | 1.97 0.21 |
| 9 | – | – | – | 19 0.3 | 3.95 0.02 | 3.03 0.05 | 8.9 0.3 | 3.82 0.04 | 2.5 0.1 |
| 10 | – | – | – | 5.9 0.2 | -8.59 0.09 | 5.56 0.22 | 3.6 0.2 | -8.46 0.16 | 5.52 0.37 |
| During Pulsar-OFF | Upper Limits within the Pulsar Beam | |||||
| 3264 MHz | 3335 MHz | 3349 MHz | 3264 MHz | 3335 MHz | 3349 MHz | |
| Features | ||||||
| (No.) | (cm-2) | (cm-2) | (cm-2) | (cm-2) | (cm-2) | (cm-2) |
| 1 | [0.2, 0.3] | [0.3, 0.4] | [0.4, 0.5] | – | – | – |
| 2 | [4.4, 7.2] | [3.4, 5.5] | [6.6, 8.7] | – | – | – |
| 3 | [0.7, 1.1] | [1.0, 1.7] | [1.8, 2.4] | – | – | – |
| 4 | [2.3, 3.7] | [1.7, 2.7] | [2.9, 3.8] | – | – | – |
| 5 | [4.8, 7.9] | [3.9, 6.4] | [7.4, 9.8] | – | – | – |
| 6 | [2.1, 3.5] | [1.6, 2.7] | [3.2, 4.2] | 3.7 | 1.4 | 9.8 |
| 7 | – | [1.5, 2.5] | [2.1, 2.8] | – | 0.6 | 0.3 |
| 8 | [0.05, 0.1] | [0.3, 0.4] | [0.3, 0.5] | 1.8 | 0.7 | 0.8 |
| 9 | – | [0.5, 0.8] | [0.7, 0.9] | – | 0.3 | 4.9 |
| 10 | – | [0.3, 0.4] | [0.6, 0.8] | – | 0.9 | 3.0 |
4 Conclusions
Using the UWL on Murriyang, CSIRO’s Parkes Radio Telescope, we conducted the first search for potential pulsed CH maser emission stimulated by PSR J16444559, with a variability timescale of 78 ms, at 3264, 3335, and 3349 MHz. We detected ten CH emission features at 3335 and 3349 MHz, and seven features at 3264 MHz (limited by the frequency cutoff at the edge of subband 20), during both pulsar-ON and pulsar-OFF phases. The observed velocities of these features are consistent with the OH emission and absorption reported by Weisberg et al. (2005). We estimated the CH column density for clouds within the Parkes beam to range from 0.05 to 9.8 cm-2. Adopting a typical CH abundance relative to , we infer that these clouds are likely in diffuse and translucent states. We derived the upper limits for the CH column density within the pulsar beam, ranging from 0.3 to 9.8 cm-2. A comparison of the column densities within the pulsar beam and the Parkes beam suggests that CH clouds may exhibit clumpiness and substructure in certain regions. No significant maser emission was detected in the optical depth spectra. As a natural byproduct of our search for pulsed stimulated emission, we also searched for absorption of the pulsar signal by CH, and found none, as expected from astrophysical considerations. The upper limits for the maser amplification factors of the three 3.3 GHz CH lines toward PSR J16444559 at 3264, 3335, and 3349 MHz are 1.014, 1.009, and 1.009, respectively.
Acknowledgements.
This work is supported by the National Natural Science Foundation of China (NSFC) program No. 11988101, 12203044, 12473023, by the Leading Innovation and Entrepreneurship Team of Zhejiang Province of China grant No. 2023R01008, by Key R&D Program of Zhejiang grant No. 2024SSYS0012, and by the University Annual Scientific Research Plan of Anhui Province (No. 2023AH030052, No. 2022AH010013), Cultivation Project for FAST Scientific Payoff and Research Achievement of CAMS-CAS. D.X. acknowledges the support of the Natural Sciences and Engineering Research Council of Canada (NSERC), [funding reference number 568580]. D.X. also acknowledges support from the Eric and Wendy Schmidt AI in Science Postdoctoral Fellowship Program, a program of Schmidt Sciences. Murriyang, CSIRO’s Parkes radio telescope, is part of the Australia Telescope National Facility (https://ror.org/05qajvd42) which is funded by the Australian Government for operation as a National Facility managed by CSIRO. We acknowledge the Wiradjuri people as the Traditional Owners of the Observatory site. We express our thanks to Lawrence Toomey, Andrew Jameson, Willem van Straten, James A. Green, and Stacy Mader for help with observations and data processing.References
- Black & Dalgarno (1973) Black, J. H., & Dalgarno, A. 1973, Astrophys. Lett., 15, 79
- Black et al. (1975) Black, J. H., Dalgarno, A., & Oppenheimer, M. 1975, ApJ, 199, 633
- Calabretta et al. (2014) Calabretta, M. R., Staveley-Smith, L., & Barnes, D. G. 2014, PASA, 31, e007
- Carretti et al. (2019) Carretti, E., Haverkorn, M., Staveley-Smith, L., et al. 2019, MNRAS, 489, 2330
- Clifton et al. (1988) Clifton, T. R., Frail, D. A., Kulkarni, S. R., & Weisberg, J. M. 1988, ApJ, 333, 332
- Dawson et al. (2022) Dawson, J. R., Jones, P. A., Purcell, C., et al. 2022, MNRAS, 512, 3345
- Draine (2011) Draine, B. T. 2011, Physics of the Interstellar and Intergalactic Medium
- Elitzur (1992) Elitzur, M. 1992, Astronomical masers, Vol. 170
- Frail et al. (1994) Frail, D. A., Weisberg, J. M., Cordes, J. M., & Mathers, C. 1994, ApJ, 436, 144
- Genzel et al. (1979) Genzel, R., Downes, D., Pauls, T., Wilson, T. L., & Bieging, J. 1979, A&A, 73, 253
- Hobbs et al. (2020) Hobbs, G., Manchester, R. N., Dunning, A., et al. 2020, PASA, 37, e012
- Jacob (2023) Jacob, A. M. 2023, Ap&SS, 368, 76
- Jacob et al. (2021) Jacob, A. M., Menten, K. M., Wiesemeyer, H., & Ortiz-León, G. N. 2021, A&A, 650, A133
- Jacob et al. (2022) Jacob, A. M., Neufeld, D. A., Schilke, P., et al. 2022, ApJ, 930, 141
- Johnston et al. (2003) Johnston, S., Koribalski, B., Wilson, W., & Walker, M. 2003, MNRAS, 341, 941
- Lewandowski et al. (2013) Lewandowski, W., Dembska, M., Kijak, J., & Kowalińska, M. 2013, MNRAS, 434, 69
- Li et al. (2018) Li, D., Tang, N., Nguyen, H., et al. 2018, ApJS, 235, 1
- Liszt & Lucas (2002) Liszt, H., & Lucas, R. 2002, A&A, 391, 693
- Liu et al. (2021) Liu, M., Krčo, M., Li, D., et al. 2021, ApJ, 911, L13
- Minter (2008) Minter, A. H. 2008, ApJ, 677, 373
- Rydbeck et al. (1976) Rydbeck, O. E. H., Kollberg, E., Hjalmarson, A., et al. 1976, ApJS, 31, 333
- Sheffer et al. (2008) Sheffer, Y., Rogers, M., Federman, S. R., et al. 2008, ApJ, 687, 1075
- Stanimirović et al. (2003) Stanimirović, S., Weisberg, J. M., Dickey, J. M., et al. 2003, ApJ, 592, 953
- Stanimirović et al. (2010) Stanimirović, S., Weisberg, J. M., Pei, Z., Tuttle, K., & Green, J. T. 2010, ApJ, 720, 415
- Suutarinen et al. (2011) Suutarinen, A., Geppert, W. D., Harju, J., et al. 2011, A&A, 531, A121
- Tang et al. (2021) Tang, N., Li, D., Luo, G., et al. 2021, ApJS, 257, 47
- Turner (1988) Turner, B. E. 1988, ApJ, 329, 425
- van Straten & Bailes (2011) van Straten, W., & Bailes, M. 2011, PASA, 28, 1
- van Straten et al. (2012) van Straten, W., Demorest, P., & Oslowski, S. 2012, Astronomical Research and Technology, 9, 237
- Verbiest et al. (2012) Verbiest, J. P. W., Weisberg, J. M., Chael, A. A., Lee, K. J., & Lorimer, D. R. 2012, ApJ, 755, 39
- Weisberg et al. (1979) Weisberg, J. M., Boriakoff, V., & Rankin, J. 1979, A&A, 77, 204
- Weisberg et al. (2005) Weisberg, J. M., Johnston, S., Koribalski, B., & Stanimirović, S. 2005, Science, 309, 106
- Xu & Li (2016) Xu, D., & Li, D. 2016, ApJ, 833, 90
- Xu et al. (2016) Xu, D., Li, D., Yue, N., & Goldsmith, P. F. 2016, ApJ, 819, 22