Predicting Quality of Video Gaming Experience Using Global-Scale Telemetry Data and Federated Learning
Abstract.
Frames Per Second (FPS) significantly affects the gaming experience. Providing players with accurate FPS estimates prior to purchase benefits both players and game developers. However, we have a limited understanding of how to predict a game’s FPS performance on a specific device. In this paper, we first conduct a comprehensive analysis of a wide range of factors that may affect game FPS on a global-scale dataset to identify the determinants of FPS. This includes player-side and game-side characteristics, as well as country-level socio-economic statistics. Furthermore, recognizing that accurate FPS predictions require extensive user data, which raises privacy concerns, we propose a federated learning-based model to ensure user privacy. Each player and game is assigned a unique learnable knowledge kernel that gradually extracts latent features for improved accuracy. We also introduce a novel training and prediction scheme that allows these kernels to be dynamically plug-and-play, effectively addressing cold start issues. To train this model with minimal bias, we collected a large telemetry dataset from 224 countries and regions, 100,000 users, and 835 games. Our model achieved a mean Wasserstein distance of 0.469 between predicted and ground truth FPS distributions, outperforming all baseline methods.
1. Introduction
Frames Per Second (FPS) significantly impacts video gaming experiences due to a complex interplay of factors (Claypool et al., 2006; Claypool and Claypool, 2007, 2009; Liu et al., 2023). It particularly influences player performance in competitive games, such as first-person shooters, by affecting reaction speed, distance, and accuracy (Wang et al., 2023). Providing estimated FPS for a game helps customers set realistic expectations for gaming experiences on their devices, while also aiding game companies in reducing negative reviews caused by users’ misunderstandings of hardware limitations (WoL, 2023; Why, 2024).
Currently, mainstream game platforms either provide a list of minimum and recommended configurations for manual checking (Epi, 2024; Ste, 2024a) or offer a binary prediction on whether a game will run well on a device (Xbo, 2024). However, these guidance are either time-consuming for users to verify or lack clear standards for interpretation.
This work aims to provide a novel solution by studying the determinants of FPS and designing an FPS distribution predictor for players based on these findings. We thoroughly explored a range of FPS determinants, including hardware specifications, game characteristics, and socio-economic factors. Research indicates that the 95% FPS floor is crucial for evaluating player satisfaction (Liu et al., 2023), as it more accurately reflects the extent and frequency of lag compared to mean FPS. Our dataset analysis revealed that, at the micro level, factors such as device type, hardware specifications (CPU and GPU parameters), game genres and themes, and game perspectives impact FPS. At the macro level, GDP per capita and the Gini index, representing average wealth and wealth distribution fairness respectively, indirectly affect players’ average FPS performance in a given area (Kashcha et al., 2022; Parshakov and Zavertiaeva, 2018).
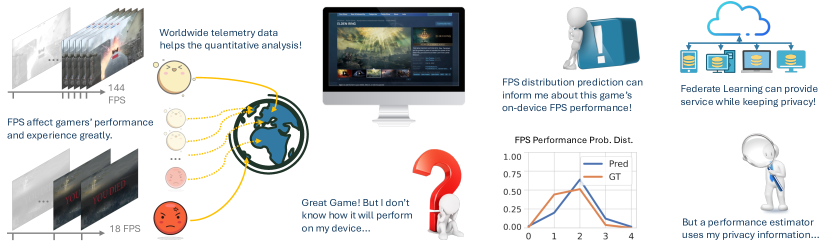
Given these determinants, training a predictive model requires sensitive information that players might be unwilling to share, such as hardware and software specifications and gaming session details. To address this concern, we propose a federated learning-based model that keeps private data on players’ devices while still contributing to the global model.
Relying solely on a limited set of quantifiable features is insufficient for precise predictions, as many factors cannot be fully quantified. For example, dedicated gaming devices with minimal background programs and players who disable ray tracing may achieve higher FPS than others under identical conditions. Likewise, well-optimized games are more likely to reach higher FPS than less mature ones.
To better understand a player without collecting additional features, which could be intrusive, we propose assigning a unique learnable knowledge kernel (LKK) to each player. This knowledge kernel evolves as the player engages in more games, ultimately capturing their characteristics and modeling their behavior. Similarly, a game-specific LKK can also enhance game profiling.
While dedicated LKKs improve prediction accuracy, they require time to effectively profile a player or game. This leads to the ”cold start problem,” where kernels are not immediately applicable (Lika et al., 2014; Silva et al., 2023). To address this issue, we propose a unique training scheme and a dynamic switch mechanism for kernel application, which will be detailed in Section 5.2.
Contributions
-
(1)
We collected a gaming telemetry dataset encompassing 100,000 users from 224 countries and regions. This dataset contains records of 76.4 million game processes, including detailed software and hardware information and accurate real-time FPS performance data for 835 types of video game processes on various devices. It is the largest dataset of its kind globally.
-
(2)
For games included in the telemetry dataset, we gathered 18 types of game characteristics, including genres, themes, and ratings, to model games from multiple perspectives.
-
(3)
This study identifies potential factors affecting FPS and provides a comprehensive analysis of primary determinants on a global-scale dataset. It is the first study of its kind, offering valuable insights for data selection in future models.
-
(4)
We developed a federated learning-based model to predict FPS distributions for games on new devices while addressing privacy concerns. Our model outperforms baseline methods, achieving a mean Wasserstein distance of 0.469 and a Cross Entropy of 1.3871 between predicted and ground truth FPS distributions.
-
(5)
We introduced a novel training scheme that incorporates player- and game-specific learnable knowledge kernels to enhance prediction accuracy. This approach, which dynamically integrates these kernels, mitigates the cold start problem and results in a 7.57% reduction in Wasserstein distance.
2. Related Work
2.1. Game Experience
The experience of playing video games is often seen as a personal connection between the player and the game, influnced by many factors (Calvillo-Gámez et al., 2015; Popper, 2013; McCarthy and Wright, 2004). Researches into game experience have consistently identified several core factors that influence player satisfaction and engagement (Claypool et al., 2006; Claypool and Claypool, 2009; Liu et al., 2023). These factors include game mechanics (Jagoda and McDonald, 2018; Sánchez et al., 2012; Moll et al., 2020), storyline, character design (Soutter and Hitchens, 2016; Hefner et al., 2007; Tompkins and Martins, 2022), soundtrack music (Klimmt et al., 2019; Lipscomb and Zehnder, 2004), control device (McEwan et al., 2012), and technical performance such as frame rate and resolution (Claypool et al., 2006; Claypool and Claypool, 2009; Liu et al., 2023). Although these papers provide some insightful points, their conclusion are either qualitative or based on a small group of players, lacking large data-driven worldwide analysis, and and statistics-based conclusion.

Frame rate is crucial in shaping the Quality of Experience (QoE) for gamers (Claypool et al., 2006; Claypool and Claypool, 2009). Higher FPS generally contributes to smoother gameplay, reducing motion blur and input latency, which is critical for fast-paced games such as first-person shooters. Liu et al. (Liu et al., 2023) quantified the impact of frame rate variation on game player’s quality of experience, noting that while average FPS is a general QoE predictor, it is not the best. The 95% frame rate floor – representing the bottom 5% of frame rates experienced by the player during a gameplay – effectively predicts QoE for both overall and individual games tested. This provides us with a strong conclusion that 95% floor of FPS distribution is a good indicator of QoE, and our following analysis are done based on this conclusion. Recently, some top-tier games have started providing their own benchmark tools to calculate the 95% floor FPS (also referred to as the “Low 5th”) prior to players’ purchase (bla, 2024). They achieve this by asking players to pre-download a small demo-like sample game that encompasses most of the characteristic scenes from the main game. By automatically running this test tool for a period of time, it collects sufficient FPS sample data points and can provide the 95% floor FPS metric. Although the performance test takes a relatively long time to complete, providing this type of benchmarking tool and informative metrics is largely welcomed by players. Fig. 2 illustrates an example of these tools.
Pioneering works have emphasized FPS as a key factor in the gaming experience, but fundamental influencing factors remain unexplored. Our quantitative analysis can help bridge this gap.
2.2. Federated Learning with Distributed Data Sources
Federated Learning (FL) is a transformative approach which enables model training across multiple decentralized devices (Chen et al., 2023; Li et al., 2020; Mammen, 2021; PfeifferKilian et al., 2023; Feng et al., 2020). Unlike traditional centralized training methods, FL allows data to remain on local devices: only client models’ update or gradients are shared and aggregated. This approach not only reduces the risks and costs associated with data transmission but preserves client privacy. To enhance model performance, previous research has employed various techniques, including Federated Averaging (FedAvg) and its extensions (Konečný et al., 2017; Wang et al., 2020; Karimireddy et al., 2020) to aggregate client model weights, and methods that aggregate gradients from clients (Elbir and Coleri, 2020).
Currently, FL has been broadly applied across domains including healthcare (Rieke et al., 2020; Stoffel et al., 2022; C et al., 2022), finance (Mammen, 2021; Chatterjee et al., 2024; Awosika et al., 2024), and IoT (Zhang et al., 2023; IssaWael et al., 2023; Venkatasubramanian et al., 2023), demonstrating its potential to leverage large-scale distributed data sources while adhering to stringent privacy requirements. Inspired by previous works, we aim to leverage federated learning to study player’s video game experience with large-scale telemetry data.
2.3. Game Performance and Configuration Guidance from Platforms
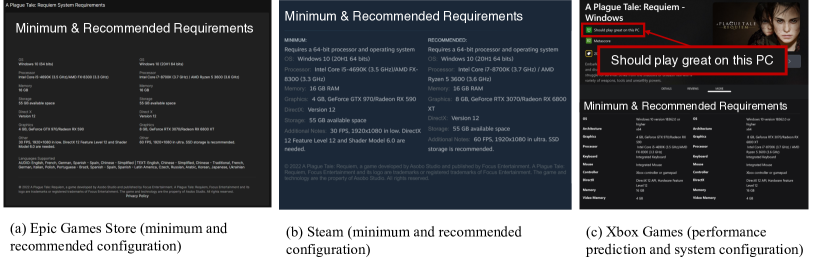
Currently, mainstream gaming platforms like Steam (Ste, 2024a), Epic Games Store (Epi, 2024), and Xbox Games (Xbo, 2024) on PC provide limited performance guidance, mainly listing minimum and recommended hardware configurations. While Epic Games Store (Fig. 3a) and Steam (Fig. 3b) only provide configuration requirements, Xbox Games (Fig. 3c) goes a step further by providing a brief note indicating whether the game “should play great on this PC” or not. But it doesn’t offer more details like estimated average FPS or FPS distribution when playing this game.
However, these platforms still fall short in providing guidance from a frames-per-second (FPS) perspective, which could also consider a player’s specific hardware and software characteristics, gaming history, and the performance of other users with similar setups. Our goal is to propose a more accurate and privacy-conscious solution to address this gap.
3. Data Collection
Telemetry Data. To better understand and predict what determines a player’s FPS while playing a game, we designed a data collector. With user consent, this data collector runs in the background and primarily collects three types of data.
-
(1)
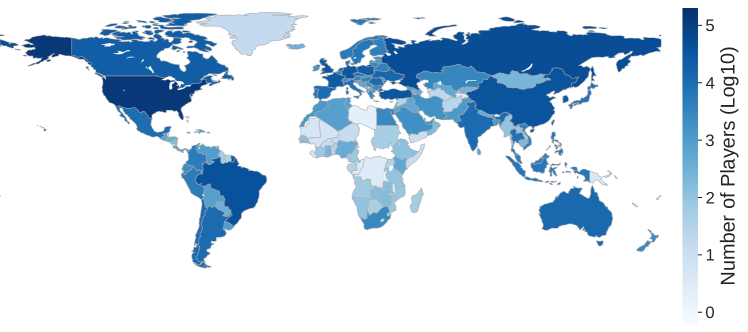
Player-specific data, such as the hardware device and operating system version used by the player, as well as the player’s country or region (see Fig. 4 for player distribution across different regions).
-
(2)
Gameplay session-related data, including the game start time, whether it is in full screen mode, and whether Game Mode is enabled.
-
(3)
FPS ground truth data. Once the game starts, our data collector samples and records the current frame rate every five seconds. Due to the varying lengths of game sessions, to reduce the volume of transmitted and recorded data and to avoid unnecessary precision, the data collector quantifies the FPS values into 42 bins. Each bin represents a 5Hz range, with four exceptions (¡10Hz, 200-300Hz, 300-400Hz, ¿400Hz.) For each game session, it records the number of FPS samples in each bin and the average FPS for the session. Data collector on each device is assigned a unique identifier to tell apart players.
Since we aim to collect only game-related processes’ data and determine whether a Windows process is a game program, we filter processes depending on if it invokes DirectX (Dir, 2024). Microsoft DirectX is a collection of application programming interfaces (APIs) for handling tasks related to multimedia, especially game programming and video, on Microsoft platforms. When a program calls DirectX while in the foreground, it triggers our data collector to generate a new record.
To further collect game-related data and exclude non-game processes, we mapped executable names to games by web scraping SteamDB (Ste, 2024b), a third-party site listing executable names under each game’s configuration page (Gra, 2024). For executables not mapped from the scraped data, we manually annotated their game names through web searches and individual checks (e.g., mapping BlackOps.exe” to Call of Duty: Black Ops”). Additionally, executable names that are too ambiguous to identify specific games (e.g., game.exe”, launcher.exe”) were discarded along with non-game processes.
We found that some users had not played any games, with records triggered by other programs invoking DirectX. We removed these sessions from our dataset. We also excluded game sessions shorter than 5 minutes, as initial welcome pages and game loading times distort the actual FPS distribution. Players who initiated game processes fewer than 18 times were also excluded due to insufficient FPS samples for meaningful probability analysis (Section 5).
Game Characteristics Data. The telemetry data does not reveal game characteristics-related features. However, these features could be crucial confounding factor when it comes to FPS prediction (Claypool et al., 2006). To address this gap, we incorporated broader game context and attributes from external sources. Following the executable-game name mapping process mentioned above, we collected game characteristics data from IGDB (IGD, 2024b), a platform offering extensive information on games across various platforms. We gathered details such as genres, types, perspectives, age ratings, and game rating conditions. A complete list of the selected features and their explanations is provided in the supplementary materials.
For our analysis, games that are not well represented in the telemetry dataset (i.e., has less than 10 records) are excluded from the game characteristics dataset. For some niche games which were either not listed in IGDB or had significant amount of missing features, we filtered them out with careful manual check. Ultimately, we selected 835 games in our game characteristics data for subsequent analysis and model training. Among these, 153 games had at least 25 players in our telemetry dataset.
Country-Level Data. We are also interested in the macro-level factors influencing FPS, the proxy variable of interest representing game experience. After filtering, we found a strong correlation between FPS and the overall level of economic development and income equality of a country or region.
To quantitatively study these relationships, we obtained the 2018 GDP (Gross Domestic Product) per capita data for various countries from the IMF website (IMF, 2024) and downloaded the Gini index of the same year from the World Bank database (Wor, 2024). For countries or regions with missing data for 2018, we used the closest available data. If no data could be found within a decade, the country was excluded from the macro-level analysis.
4. Data Insights
The 95% FPS floor is a key metric to evaluate players’ quality of game experience (Liu et al., 2023). In this section, we provide an in-depth analysis to uncover and explain the factors associated with this metric.
4.1. Micro-Level Influence Factors
Player-side features. We examined the factors influencing the 95% FPS floor, focusing on representative player characteristics like CPU and GPU specifications, operating system, country and region, and device type.
4.1.1. Device type.
Different devices have distinct design philosophies and trade-offs. For example, tablets prioritize portability but often sacrifice performance and cooling, while desktops, though bulkier, can house more powerful components and benefit from a stable power supply due to their larger size. We categorized devices into six types: desktop, notebook, 2-in-1 devices, Intel NUC/STK (Next Unit of Computing/Compute Stick), server/workstation, and tablet. To quantitatively analyze how device types affect the 95% FPS floor, we conducted an one-way ANOVA test (Quirk, 2012) comparing the effects of different device types. The results, presented in Table 1, revealed a statistically significant difference in the 95% FPS floor between at least two groups (), with a medium effect size (). Furthermore, the Tukey’s HSD test (National Institute of Standards and Technology / U.S. Department of Commerce, 2012) for multiple comparisons found significant differences between groups such as desktop and 2-in-1 devices (), and server/workstation and tablet (). However, there was no statistically significant difference in the mean 95% FPS floor between notebook and server/workstation () or 2-in-1 devices and tablets ().
| Feature | DFB | DFW | F | p | |
|---|---|---|---|---|---|
| Device Type | 5 | 153249 | 4003.460 | 0.000 | 0.116 |
| Operating System | 5 | 153370 | 212.757 | 0.000 | 0.007 |
| CPU Family | 8 | 146876 | 2314.744 | 0.000 | 0.112 |
| GPU Level | 4 | 150978 | 13221.208 | 0.000 | 0.259 |
| GPU Category | 3 | 151007 | 11230.100 | 0.000 | 0.182 |
| Country | 198 | 149293 | 40.049 | 0.000 | 0.050 |
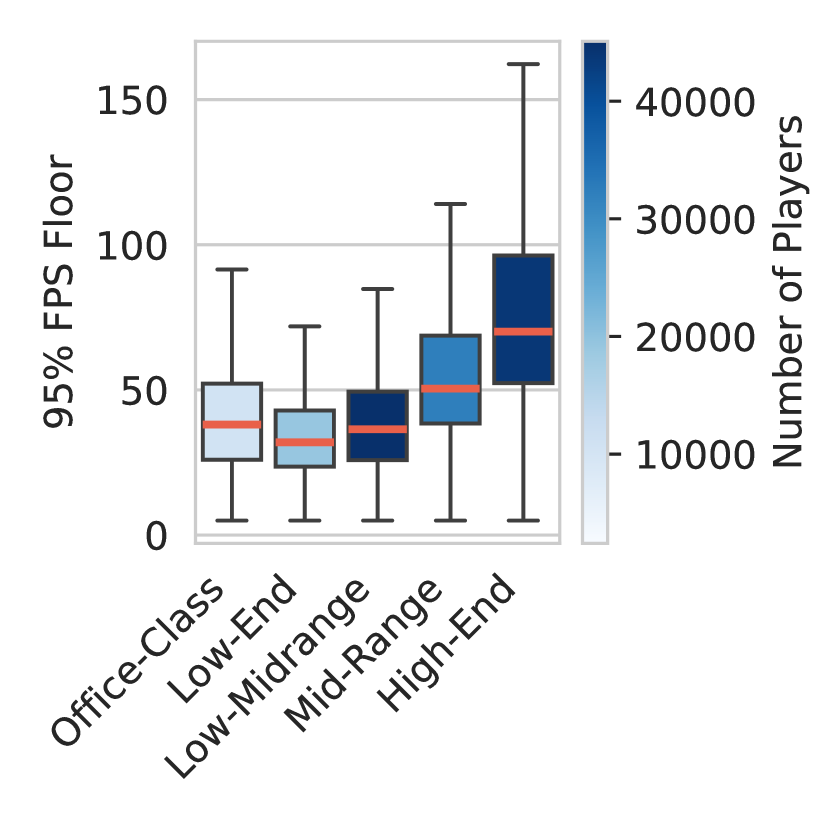
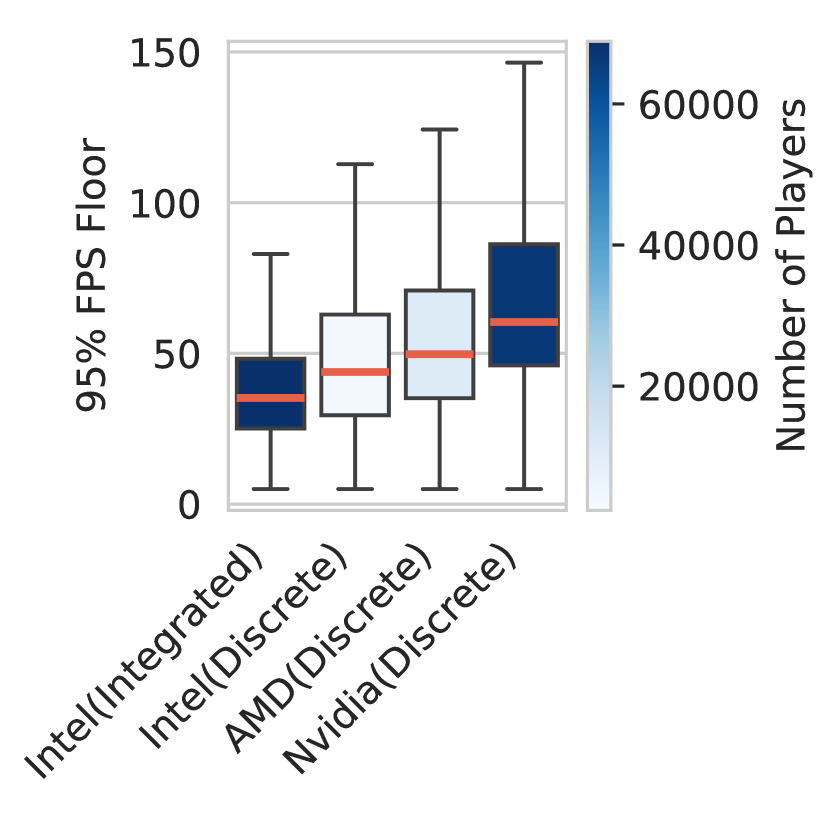
4.1.2. GPU Performance.
Delving into specific hardware configurations, we find that GPU performance is closely related to FPS, as shown in Fig. 5(b). Given that GPU performance is influenced by many parameters, we grouped GPUs with publicly available specifications into five categories: Office-Class, Low-End, Low-Mid-Range, Mid-Range, and High-End. The classification details are available on the GPU ranking website (Hinum, 2024). Records with missing GPU model values or unknown GPU types were excluded. A one-way ANOVA revealed a statistically significant difference in the 95% FPS floor between at least two groups, as shown in Table 1 and Fig. 5(b). FPS distributions also significantly differed between players using discrete Nvidia, AMD, and Intel graphics cards or integrated graphics. These results are further detailed in Table 1, with the corresponding box plot shown in Fig. 5(d). This variation is likely due to differences in game optimization across GPU brands and exclusive technologies like Nvidia’s DLSS (Deep Learning Super Sampling), which can achieve higher frame rates with similar computational power (Watson, 2020).
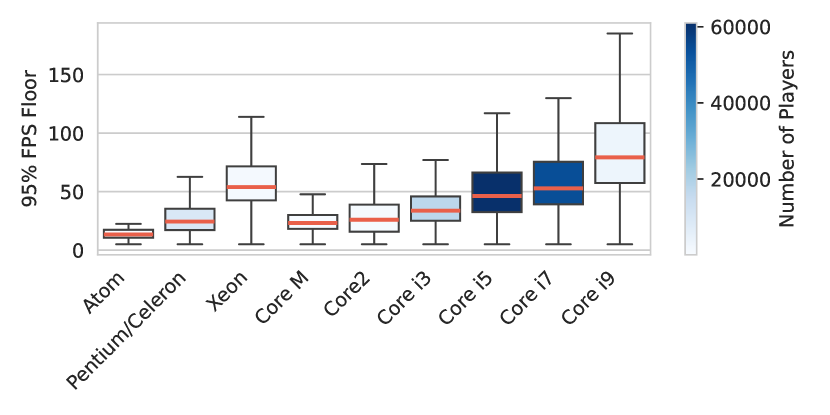
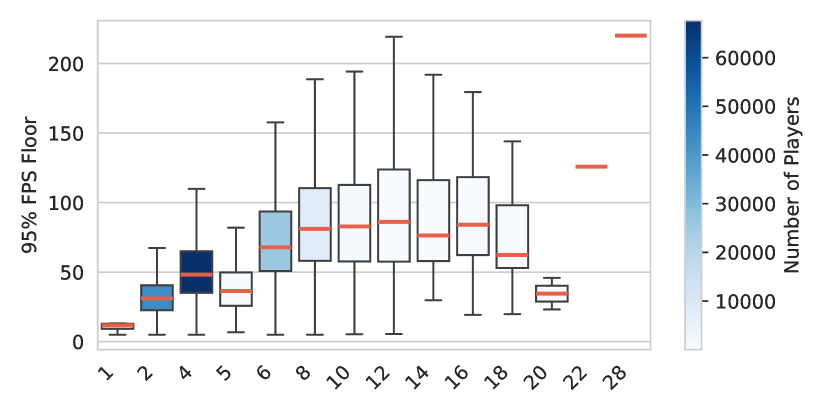
4.1.3. CPU Performance.
Similarly, CPU performance positively affects FPS, with improvements in CPU generation (Fig. 5(a)) and core count (Fig. 5(c)) resulting in a higher 95% FPS floor. One-way ANOVA tests conducted for CPU families show a significant effect, as detailed in Table 1. A multiple linear regression was used to test if CPU process node (unit: nm), CPU core count, RAM size, and screen size significantly predicted the 95% FPS floor. The fitted regression model was:
| (1) |
, where , , , and represent the CPU core count, RAM size (in GB), CPU process node (in nm), and screen size (in inches), respectively. The model explained approximately 33.3% of the variance in the dependent variable, as indicated by an value of 0.333. More details are provided in Table 2. While a larger screen size doesn’t intuitively lead to better FPS, higher investment in peripherals like monitors often reflects a player’s greater demand for overall gaming experience. Such players are likely to invest more in core device components, which may explain this correlation.
| Feature | Coef. | p | Lower | Upper | |
|---|---|---|---|---|---|
| RAM Size (GB) | 0.2843 | 0.000 | 0.333 | 0.262 | 0.307 |
| CPU Process Node | -0.5165 | 0.000 | 0.333 | -0.540 | -0.493 |
| CPU Core Number | 6.8780 | 0.000 | 0.333 | 6.770 | 6.986 |
| Screen Size (inch) | 1.8697 | 0.000 | 0.333 | 1.825 | 1.914 |
4.1.4. Operating System.
In addition to hardware specifications, we also examined the impact of the operating system. The corresponding one-way ANOVA results () showed a statistically significant difference between groups, though the effect size was very small (), suggesting that these differences, while statistically significant, have limited practical importance.
4.1.5. Country and Region.
Finally, we explored the effect of the player’s country or region. As shown in Table 1, there was a significant difference between country groups, with a small effect size (). Country-level impact factors are discussed in detail in Section 4.2.
| Features | DFB | DFW | F | p | |
|---|---|---|---|---|---|
| Themes | 21 | 1822 | 2.120 | 0.002 | 0.024 |
| Genres | 22 | 2232 | 2.346 | 0.000 | 0.023 |
| Player Perspectives | 6 | 903 | 4.412 | 0.000 | 0.028 |
| Game Modes | 5 | 1695 | 1.064 | 0.379 | 0.003 |
| DLCs Availablity | 1 | 833 | 0.213 | 0.644 | 0.000 |
| Age Ratings | 1 | 668 | 0.753 | 0.386 | 0.001 |
| Features | Coef. | p | Lower | Upper | |
|---|---|---|---|---|---|
| Platforms Sup.† | 17.099 | 0.025 | 0.011 | 2.138 | 32.061 |
| Release Year | -6.576 | 0.466 | 0.011 | -24.271 | 11.119 |
| Release Month | -3.924 | 0.181 | 0.011 | -9.675 | 1.826 |
| Lang. Sup.† | -0.754 | 0.884 | 0.011 | -10.903 | 9.394 |
| Rating | 10.212 | 0.256 | 0.011 | -7.428 | 27.852 |
| Rating Count | -5.132 | 0.568 | 0.011 | -22.765 | 12.502 |
Game Characteristics. Beyond hardware settings, the impact of game characteristics cannot be overlooked. We also analyzed categorical and numerical features separately.
4.1.6. Categorical game features.
One-way ANOVA results revealed a significant difference in the 95% FPS floor across different game themes (), though the effect size was small. Similarly, game genres and player perspectives (first/third person, bird’s-eye view, etc.) also showed a small effect on the 95% FPS floor, as indicated by the ANOVA results in Table 3. The table also shows that other game characteristics, such as game modes (single/multiplayer, battle royale, etc.), DLC (Downloadable Content) availability, and age ratings (Either 18+ or not), do not exhibit significant differences between groups. It’s worth noting that one game can have multiple tags for a categorical feature, so the degree of freedom change accordingly.
4.1.7. Numerical game features.
Additionally, a multiple linear regression was performed to assess whether numerical game characteristic features significantly predicted the 95% FPS floor. The results, shown in Table 4, indicate that the estimated coefficient for the number of supported game platforms was 17.099, with a significant p-value of 0.025, suggesting that this feature has a meaningful effect on the 95% FPS floor. However, p-values for game release years and months, game rating, rating count, and supported language count were all greater than 0.05, indicating no statistically significant relationship with the 95% FPS floor. This suggests that these game characteristics do not have a strong or consistent effect on the 95% FPS floor within the context of this dataset.
Compared to player-side features like device parameters, game characteristics have a significantly smaller effect on the 95% FPS floor, as observed from both the F-statistic and results in Table 1 and Table 3. This indicates that hardware specifications have a greater impact on game experience than game characteristics.
4.2. Macro-Level Influence Factors
The previous sections discussed micro-level factors affecting FPS performance. But on a macro level, what broader factors influence the gaming experience?
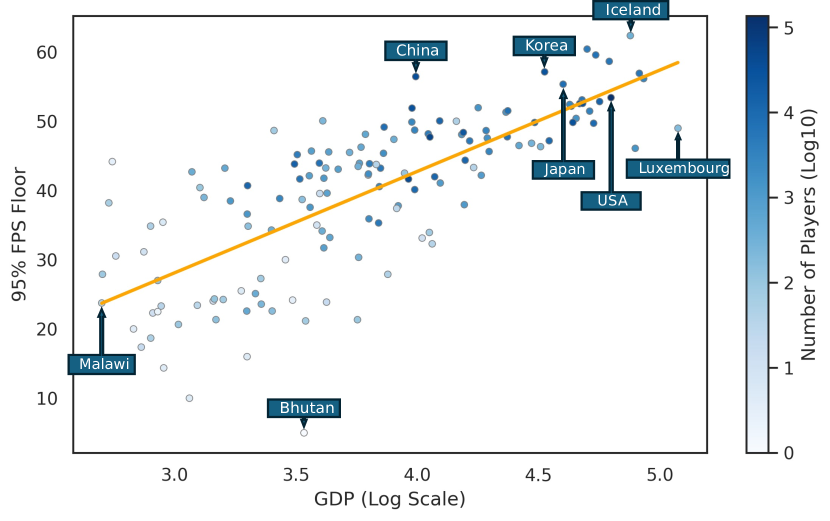
4.2.1. GDP per Capita.
Our analysis reveals a positive correlation between a country’s average gaming experience and its GDP per capita, following a logarithmic relationship (). GDP per capita reflects economic output and living standards. Countries with high GDP per capita, such as Iceland and Switzerland, show the highest FPS performance, while those with low GDP per capita, such as Rwanda and Togo, exhibit the lowest. The scatter plot and fitted line are shown in Fig. 6(a), with some highlighted countries.
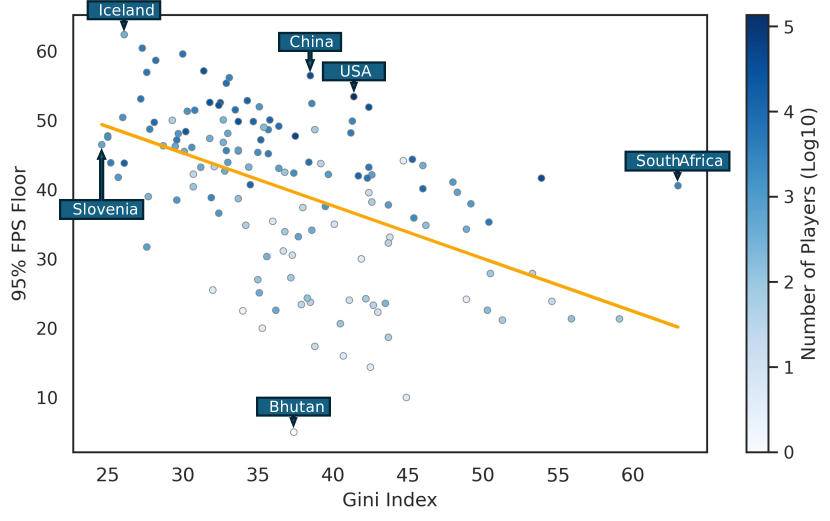
4.2.2. Gini index.
Conversely, the Gini index, which measures income inequality, negatively correlates with gaming experience (). Higher Gini indices, indicating greater inequality, are associated with lower gaming experiences. Countries with low Gini indices, such as Iceland and Denmark, have the best player experiences, while those with high Gini indices, like Namibia and Colombia, exhibit poorer performances. Corresponding figure is shown in Fig. 6(b).
By fitting a line to our data, we derived a simple formula that accurately describes the relationship between a country’s average 95% FPS floor, GDP per capita, and the Gini Index:
| (2) |
, where and represents GDP per capita (in USD) and the Gini Index of the country or region, respectively. When these two factors are considered together, the model yields an R-squared value of 0.625, indicating that approximately 62.5% of the variability in the 95% FPS floor is explained by variations in GDP and Gini Index. The statistical significance of these predictors is confirmed by the resulting p-value ().
In summary, on a micro level, better hardware such as GPUs, CPUs, and RAM, as well as performance-focused devices, contribute to an overall better gaming experience. Game characteristics, including themes, genres, and player perspectives, also play a role. On a macro level, the average wealth of a population and the fairness of income distribution within a country are significant factors influencing the gaming experience.
5. Player-Game Pair FPS Distribution Predictor
Building on top of the statistical relations we found in the previous section, there is a clear correlation between FPS distribution and player and game features. In this section, we aim to develop a predictive model for game experience with telemetry data.
5.1. Data Pre-processing
The collected telemetry and game-centric data includes various data types, such as floating-point, integer, categorical, date-time, boolean, and string. Data preprocessing involved cleaning and transforming raw IGDB data into a structured format, addressing missing values by filling numerical ones with the median and normalizing them, while categorical features were one-hot embedded and missing values were set to 0.5. This preparation ensured a consistent and analyzable dataset for comprehensive analysis and modeling.
Additionally, the basic unit of data used in the subsequent deep learning network is the “player-game pair,” which represents the FPS performance probability distribution for each player when playing each game. For each game played by a player, a record is created, which includes relevant player information and game characteristics. After obtaining the raw telemetry data, we performed a data merge based on player-game pairs. For numerical features, we calculated the average value; for categorical and boolean features, we determined the mode; and for each FPS bin, we summed the values directly.
FPS is an instantaneous value, and it is impossible for a game running on a specific device to maintain a fixed FPS forever. Due to varying game scenes that demand different computational resources, an FPS distribution more accurately profiles a game’s actual performance on a particular device. To establish ground truth, we grouped the collected FPS values into five classes using thresholds of 25Hz, 45Hz, 60Hz, and 145Hz. These thresholds are used to define gameplay smoothness, aligning with common standards to cover diverse game scenarios and increase robustness. However, it is important to note that while these aggregated FPS distributions are treated as ground truth, they are still subject to randomness. If the total FPS sample size for a given player-game pair is insufficient—indicating that the player has not played the game long enough—the resulting FPS distribution may be distorted.
5.2. Methodology
Let’s revisit the problem definition: Given the characteristics of players and games, the goal is to predict the FPS performance of a new player-game pair. Each input data point consists of one-dimensional features, so we use the MLP (Multi-Layer Perceptron) as foundational blocks.
Despite collecting as many quantifiable features as possible within ethical boundaries, each user and game has habits or characteristics that are hard to quantify and need case-by-case consideration. To address this problem, we assign each player and game a unique learnable knowledge kernel (LKK), distributed and trained on each player’s device. This ensures that these kernels accurately reflect their habits and characteristics, enhancing prediction accuracy and providing valuable customization.
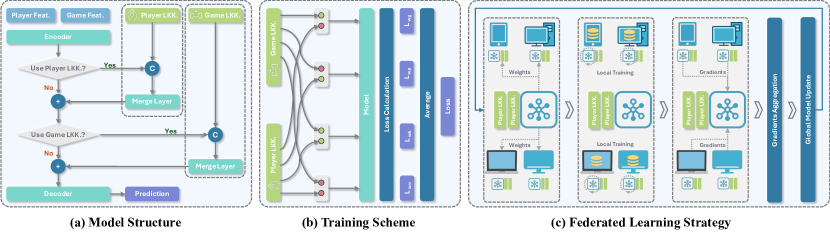
The cold start is also an issue. For newly released games or first-time users, the corresponding LKK isn’t fully trained. To handle this, we propose a flexible approach to apply these kernels. This includes scenarios such as not using kernels, using only player or game-specific LKKs, and using both kernels. During training, we calculate the predicted FPS distribution and corresponding losses for each case separately and average them as the final loss (see Fig. 7b). When applying an kernel, the main feature map is concatenated with the kernel and then fused through a Linear Merge layer with a skip connection. Therefore, the information that kernel brings refines the main feature map.
Denoting the encoder, decoder, merge layers for player and game LKKs as , and input feature maps as , we have:
| (3) | ||||
| (4) | ||||
| (5) | ||||
| (6) |
, where means output under the condition of without LKK, with player LKK, with game LKK, with both LKK. The training loss can be further written as:
| (7) |
, where represents the set consists of the four LKK usage cases mentioned above.
During testing, the conditions for applying LKKs can be preset, such as requiring at least three trained records for a player to enable the player-specific LKK, or ten records for a game to enable the game-specific LKK. When these conditions are met, the corresponding kernels are used in predictions (Fig. 7a). The model’s performance under the four cases is analyzed in Section 6.2.
While this predictor benefits both players and developers, privacy remains a concern. Player-side features such as hardware specifications and geographic information are used as input, and the FPS distribution ground truth for purchased games depends on numerous FPS samples collected during gameplay. These samples can reveal sensitive details such as game session length and frequency.
The collection and transmission of user information to servers pose privacy risks. To mitigate this, we adopted a federated learning approach. Data are stored exclusively on users’ devices, and models are trained locally. After local training, only gradients from client models are sent to the server, where they are aggregated to update the global model once gradients from a sufficient number of players are received. Updated model weights are then distributed to all client models again (see Fig. 7c).
6. Results of the FPS Predictor
| \hlineB2 Method | WD | CE | MAE | KL Div | Top1 Acc | Top2 Acc | Adj Acc | Top1 F1 |
|---|---|---|---|---|---|---|---|---|
| \hlineB1 Softmax Regression | 0.9713 | 1.6059 | 0.2179 | 0.8825 | 0.3774 | 0.6375 | 0.8189 | 0.2553 |
| Decision Tree | 0.5952 | 1.4570 | 0.1560 | 0.6414 | 0.5489 | 0.7983 | 0.9006 | 0.4042 |
| Random Forest | 0.5726 | 1.4510 | 0.1493 | 0.6110 | 0.5884 | 0.8148 | 0.9012 | 0.4102 |
| XGBoost (Chen and Guestrin, 2016) | 0.6000 | 1.4716 | 0.1556 | 0.5377 | 0.5700 | 0.8012 | 0.8966 | 0.3896 |
| \hlineB1 Centralized | 0.4698 | 1.3935 | 0.1302 | 0.5188 | 0.6192 | 0.8511 | 0.9251 | 0.4677 |
| Federated | 0.4690 | 1.3871 | 0.1302 | 0.5369 | 0.6192 | 0.8477 | 0.9221 | 0.4741 |
| \hlineB2 |
6.1. 5-Classes FPS Distribution Prediction
To fully evaluate the performance of our proposed model and training strategy, we compared the results against several baseline methods and between centralized and federated training strategies. The results, shown in Table 5, demonstrate that our model outperforms all baseline methods across all metrics. Importantly, federated training does not degrade performance, as players’ data remains local, and only gradients are shared with the server. These findings confirm that the federated training strategy is effective for this task, and our method is robust.
Our goal is to predict the distribution of FPS bins for a player-game pair. The primary metric we use is the Wasserstein distance, also known as Earth Mover’s Distance (EMD), which is valuable for comparing probability distributions over discrete bins. It quantifies the minimum cost required to transform one distribution into another, based on the amount of probability mass moved and the distance it is moved. This metric is particularly suitable for this task, as it captures the differences between predicted and ground truth distributions while considering the bin structure. Mathematically, the Wasserstein distance of order one is defined as:
| (8) |
, where denotes the set of all joint distributions whose marginals are and , and represents the distance between bins and .
Other commonly used metrics are also adopted to profile performance from various angles. These metrics include those focusing on distribution, such as cross entropy, Kullback–Leibler divergence, and mean absolute error, as well as category-centered metrics for profiling the predicted category with the highest probability, such as Top-1 accuracy and F1 score. Another metric, adjacent accuracy, measures the proportion of cases where the predicted top-1 FPS distribution category is the same as or adjacent to the ground truth category. This is used because the bin categories are not distinct classes, and we want to assess how close the predicted top-1 bins are to the ground truth.
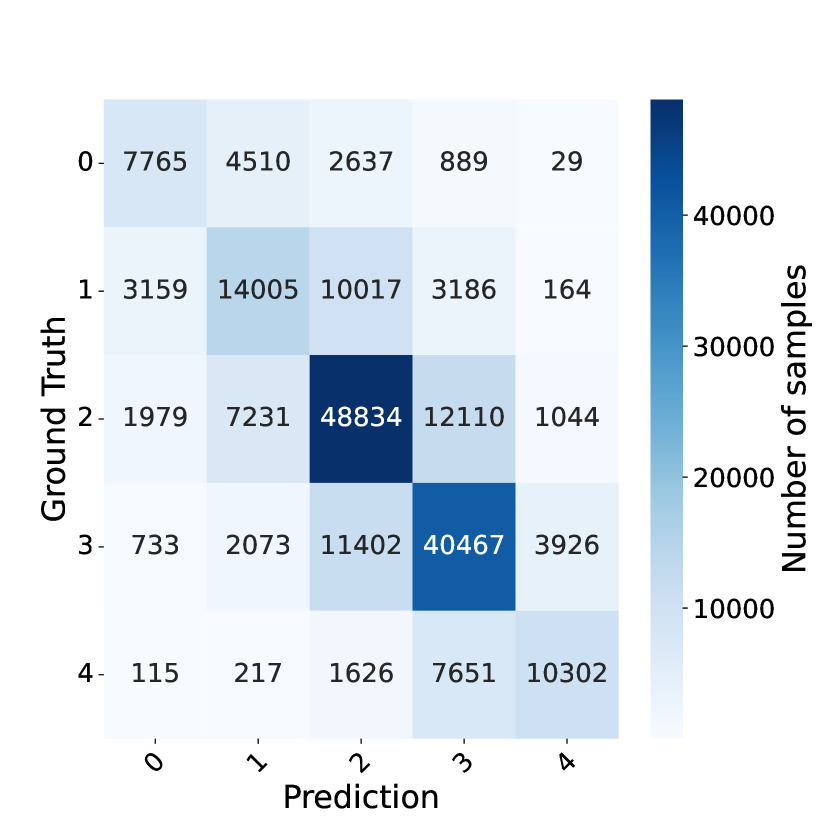
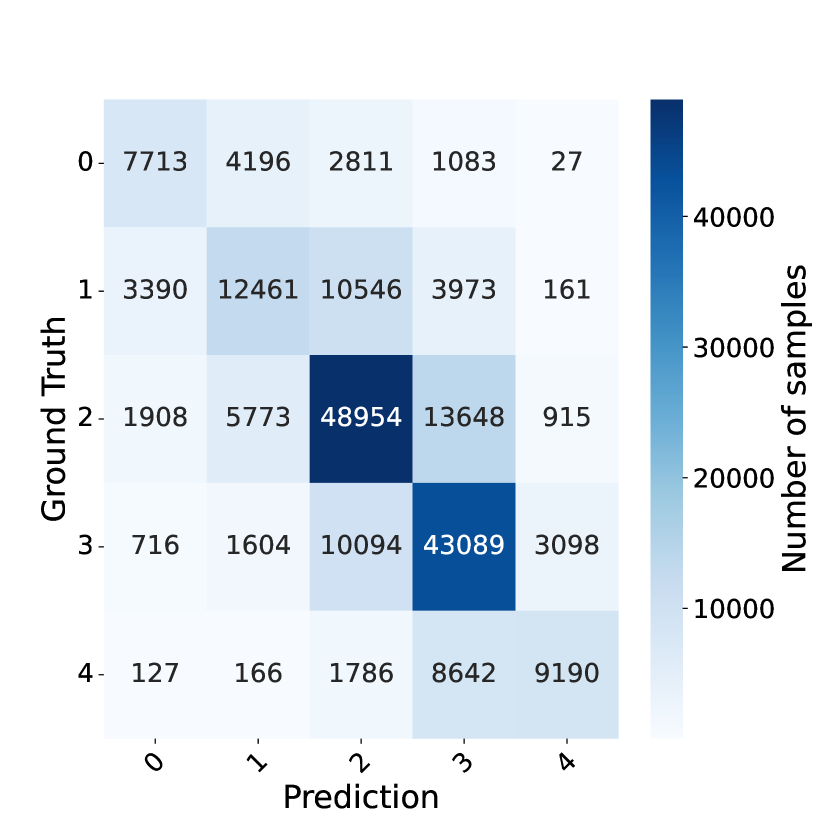
The confusion matrix for the best centralized and federated trained models is shown in Fig. 8(b). The matrix indicates that most predictions are concentrated on or near the diagonal, demonstrating that in most cases, our proposed model’s predictions are either the same as or adjacent to the corresponding ground truth labels. Additionally, a comparison between Fig. 8(b) and Fig. 8(a) shows that the federated training strategy does not significantly impair the model’s performance.
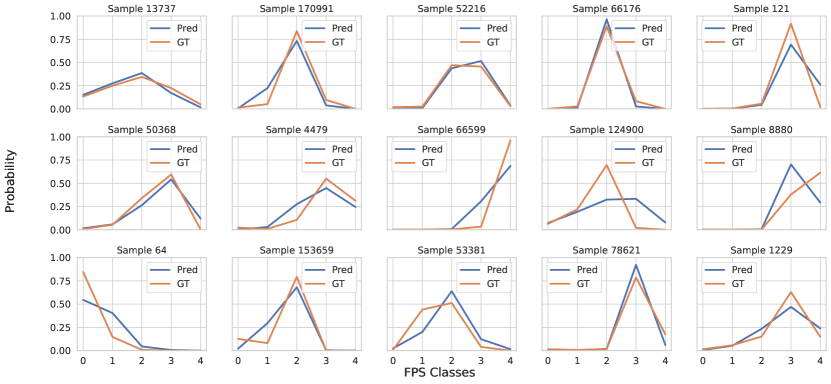
Fig. 9 provides a comparison between predictions and ground truth for some randomly selected validation samples. As shown in the figure, most of the time, the distribution of our predicted FPS performance is very close to the ground truth. Even if there is a slight deviation in the top probability category, the predicted distribution is still highly informative. In practical applications, alongside providing the most likely prediction, this approach can also offer users the predicted original distribution for reference if needed.
6.2. Ablation Study
LKK-related training and cold start strategies are core components of the proposed model. To evaluate the effectiveness of player and game-specific learnable knowledge kernels, we conducted an ablation study. We assessed the performance of the fully trained model on the validation set under four conditions: without any kernel, with only a game-specific learnable knowledge kernel, with only a player-specific learnable knowledge kernel, and with both types of kernels. The results, shown in Table 6, indicate that the best performance across all metrics is achieved when both kernels are used. Performance improves with the use of either kernel type compared to not using any knowledge kernel at all.
| \hlineB2 Kernels | WD | CE | MAE | Acc | F1 |
|---|---|---|---|---|---|
| \hlineB1 w/o | 0.5074 | 1.4275 | 0.1375 | 0.6073 | 0.4337 |
| w/ player | 0.4781 | 1.3916 | 0.1325 | 0.6121 | 0.4696 |
| w/ game | 0.4984 | 1.4225 | 0.1354 | 0.6110 | 0.4387 |
| w/ both | 0.4690 | 1.3871 | 0.1302 | 0.6192 | 0.4741 |
| \hlineB2 |
6.3. Training Details
The dataset was randomly split into 80% training and 20% validation subsets. We trained our neural network using the Adam optimizer (learning rate = 0.001) for 100 epochs, with L1 regularization (weight = ). Built on PyTorch, our model is 1.44 MB without embeddings, requiring 213,504 FLOPs for inference without embeddings and 377,344 FLOPs with embeddings. On an NVIDIA RTX 4090, the average inference time per sample is 0.14 ms with embeddings and 0.07 ms without. On a 13th Gen Intel(R) Core(TM) i9-13900 CPU, inference takes 1.15 ms with embeddings and 0.96 ms without. These results indicate that our model is lightweight and efficient across different hardware configurations.
6.4. Auxillary Full 42-Classes FPS Distribution Prediction
For most players, the 5-class game FPS prediction is sufficient to help them make appropriate game purchase decisions while avoiding overwhelming yet unnecessary information. These five classes correspond to different levels of video game smoothness, providing better explainability. However, for professional players, a more fine-grained FPS distribution can offer better insights into the game’s performance. For example, the concentration of the FPS distribution characterizes the stability of FPS performance, multiple local maxima in the FPS distribution may indicate significant differences in FPS performance across different in-game scenarios, and the proportion of low frame rates reflects the frequency of stuttering and negative gaming experiences. This information can help professionals make more well-informed decisions.
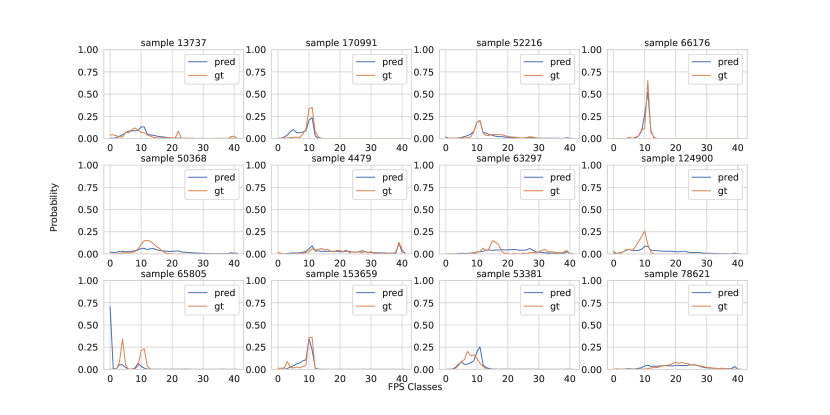
To address this need, we developed a 42-class FPS distribution predictor trained directly on the raw FPS distribution ground truth, without aggregating the outputs into coarser 5-class categories. This model prioritizes capturing the overall trend of the FPS distribution across classes, rather than maximizing accuracy in the top-1 prediction. Evaluation results include a distribution MAE of 0.0213, top-1 accuracy of 0.3473, and adjacent accuracy of 0.4808. These metrics demonstrate high distribution-level fidelity, indicating the robustness and reliability of our approach in capturing subtle variations in FPS trends. A detailed visualization of the 42-class prediction outcomes across sample cases is presented in Fig. 10 (compared with the coarse 5-class results shown in Fig. 9). Together, these visualizations illustrate the model’s capability to effectively capture both coarse and fine-grained trends in the 95% FPS floor distribution, thereby showcasing the strength of our proposed model and training scheme in accurately predicting nuanced distribution patterns.
7. Discussion and Future Work
7.1. Quantified Game Performance Analysis Based on the First Worldwide Gaming Telemetry Dataset
The discussion on game performance has been ongoing since the inception of gaming. As games become more visually realistic and immersive, the computing power required to render them smoothly has increased significantly. The continuous advancement of game engines and gaming technology has driven parallel improvements in gaming hardware, optimizing performance and offering players a captivating audiovisual experience.
In the gaming community, runtime performance is recognized as a critical factor in the overall gaming experience, alongside quality and gameplay. Even with a well-crafted game concept and top-tier production, a laggy or inconsistent performance can render these qualities irrelevant, ultimately damaging a game’s reputation, sales, and even the developer’s credibility.
While game performance is crucial, it is not the only factor affecting smooth gameplay. Network speed and server response times also play a role. However, in single-player and many online gaming scenarios, player-side device performance remains the predominant factor. To minimize performance-related issues, developers have made various efforts: testing games on diverse configurations to determine minimum and recommended specs, offering visual quality options to cater to different hardware capabilities, and releasing demo versions to let players gauge game performance firsthand. Recently, platforms like Xbox have begun utilizing deep learning techniques to predict a binary playability of games on individual devices, enhancing players’ confidence in purchasing. Game console manufacturers also contribute by offering standardized configurations, enabling developers to optimize their games for specific hardware, which has played a significant role in the popularity of consoles worldwide.
However, as previously discussed, game performance is influenced by a myriad of factors. Additionally, certain unquantifiable aspects—such as individual gaming habits, typical system settings, and the variations in optimization strategies across platforms—are challenging to capture on a per-game, per-user basis. Till now, analyzing these numerous influences on game performance holistically has been almost impossible. The industry-standard approach has been largely case-by-case, with developers providing minimum and recommended hardware specifications based on game-specific attributes, while players gauge potential performance based on their hardware and experience. This process is inefficient, inaccurate, and often leads to uncertainty and frustration, which can impact the game’s success.
The root of these challenges lies in the absence of a comprehensive, representative dataset that captures quantifiable factors influencing game performance. Additionally, there has been no approach capable of addressing unquantifiable aspects of performance in a way that satisfies both players and developers. Unlike previous efforts, our work introduces a large-scale dedicated dataset focused on this domain, capturing not only a wide range of user and game-specific characteristics but also providing robust ground-truth FPS distributions throughout complete game sessions. This unique dataset forms a reliable foundation for quantitative analysis and deep learning model training.
Our extensive, globally representative dataset highlights both shared and unique characteristics among players, providing a comprehensive opportunity to analyze game performance from multiple perspectives. Our proposed approach serves as a benchmark for game developers and game platforms, opening the door to greater transparency in game performance and benefiting the gaming community as a whole.
7.2. Inherent Complexity and Entanglement of the Game Performance Prediction Task
Predicting game performance presents a multifaceted challenge that arises from the necessity to integrate diverse data sources and account for numerous interdependent factors.
Data Collection and Pre-processing. Many potential features could impact game performance. However, identifying the most promising ones is essential before beginning data collection. To achieve this, we conducted an extensive search of relevant materials, reviewed players’ first-hand comments, and carried out trial-and-error analyses on smaller data samples. Data cleaning and pre-processing posed additional challenges, as some participants played games infrequently or not at all. Regional and language differences also introduced complications, as system and hardware labels were initially recorded in foreign languages, requiring remapping and filtering. Establishing standards for merging and filtering game records was crucial, as it directly influenced the quality of data used in downstream analysis and deep learning model training. Another major challenge is creating a mapping table to link game process names from various versions to unique official game names. Since there’s no direct way to retrieve the official name of a running game, manually building a comprehensive mapping table is essential.
Integration of Diverse Datasets. Predicting game performance requires the integration of diverse datasets encompassing game-specific attributes, user characteristics, and hardware specifications. Currently, there are no comprehensive datasets that can cover all these aspects. Additionally, the heterogeneous nature of these data sources poses significant challenges in data merging, as there often lacks a common feature or identifier to serve as the bridge for integration. This fragmentation complicates the construction of a unified dataset, thereby hindering the development of accurate predictive models.
Selection of Performance Metrics. Many features influence overall game performance, making the choice of an effective metric to represent it both critical and challenging. Without a highly representative performance metric, accurately quantifying game runtime performance becomes difficult, hindering the development of a predictive model.
Dynamic Nature of FPS. FPS is a dynamic and fluctuating metric, influenced by real-time in-game activities and varying system conditions, which complicates prediction. The main challenge lies in deciding which FPS aspects to forecast—whether instantaneous FPS values, average FPS over specific intervals, or the distributional characteristics of the 95% FPS floor performance. Addressing this requires transforming raw FPS data into a structured format that captures its temporal variability while preserving its value as a performance indicator.
The Cold Start Problem. Another challenge in game performance prediction is the cold start problem, which occurs when the system encounters new users or games with limited historical data. For newly released games or first-time players, the lack of prior records hinders accurate predictions, affecting model generalization and reducing accuracy. Addressing the cold start problem is essential for ensuring that the predictive system remains robust and functional across a diverse and evolving gaming landscape, where new games and players are continually introduced.
Ensuring Data Privacy. Data privacy always presents a significant obstacle in building prediction models involving user data due to the sensitive nature of the information required. Accurate FPS predictions often rely on detailed user-specific data, including hardware specifications, software configurations, and usage behaviors. Collecting and aggregating such data on centralized servers raises substantial privacy concerns, as it can expose users to risks related to data breaches and unauthorized access. Additionally, users may be hesitant to share personal information, leading to incomplete datasets that further complicate predictive accuracy. Balancing the need for comprehensive data with stringent privacy protections is a critical issue, necessitating the development of methodologies that safeguard user information while still enabling effective performance prediction.
7.3. Significance of the FPS Distribution Estimator
This predictor is beneficial to players, game developers, and gaming platforms.
For players: FPS affects players’ gaming performance and quality of experience. If the game cannot achieve the minimum tolerable FPS on a player’s device, they are highly likely to hold a negative opinion of the game or give it up. Having an accurate FPS distribution estimation is essential to help players make wise and informed decisions, decreasing the likelihood of buying unsuitable games.
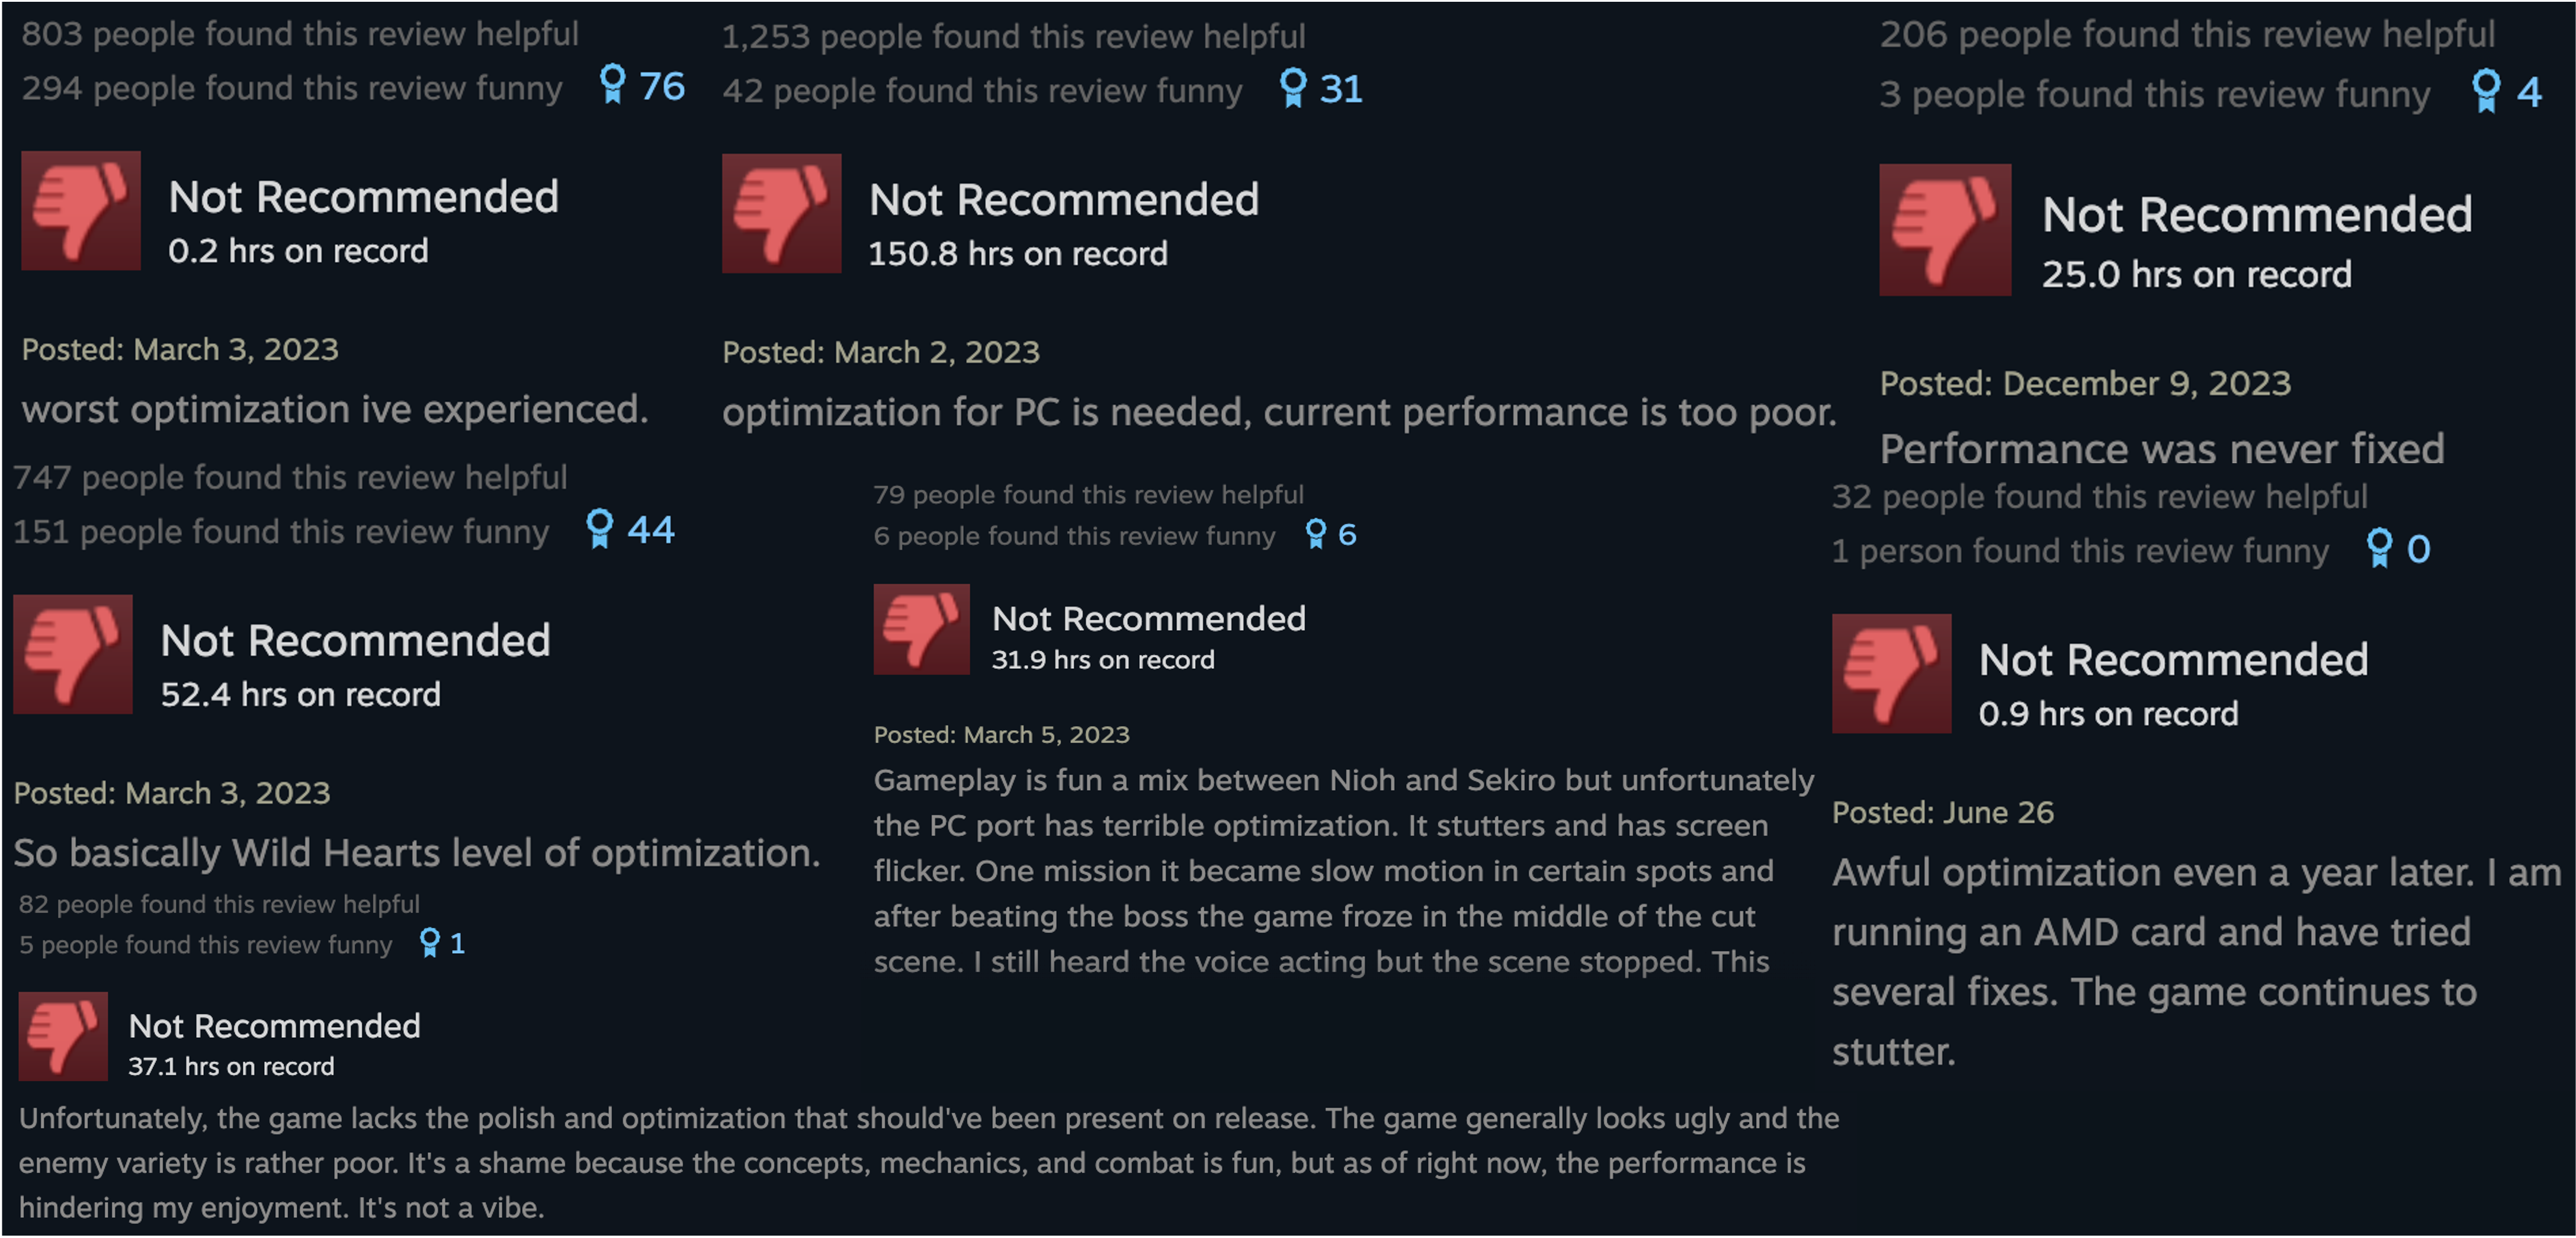
For Game Developers: On platforms like Steam, poor game optimization and low FPS often lead to player dissatisfaction and commercial setbacks, as seen with titles like “Cyberpunk 2077” (cyb, 2024) and “Nobunaga’s Ambition” (Nob, 2024). Some real negative feedbacks caused by poor game performance can be seen in Fig. 11. While enhancing game quality and investing more in optimazation is ideal, letting potential customer’s know about the estimated FPS performance can help with expectation management and mitigate negative reviews and revenue loss.
For Gaming Platforms: Accurate FPS performance predictions can enhance platform service by better aligning game offerings with user hardware and habits. This proactive approach not only boosts customer satisfaction but also supports game developers by refining performance insights and consulting services.
In summary, integrating FPS performance predictors benefits players, developers, and platforms, aiming to improve the gaming experience and industry standards.
8. Ethical Considerations
Our institution’s legal department reviewed the telemetry data collection process to ensure compliance with the California Consumer Privacy Act and European GDPR standards. We included only users who explicitly consented to participate voluntarily and ensured their anonymization throughout the data collection process. We do not collect any identifiable information, such as names, addresses, or genders. Users can withdraw from the project at any time and are not exposed to any harm from this data collection. The data are securely stored in an internal data center, with access restricted to those who sign a confidentiality agreement. Permission for the executable-to-game mapping table was obtained from the SteamDB administrator before web scraping, and data from IGDB were retrieved through its public API (IGD, 2024a) in compliance with its regulations.
This dataset was collected under the guidance of the institution’s confidentiality policy. Due to the extensive coverage and high sensitivity of the involved areas, it cannot be directly made available to the public. For academic or commercial purposes, interested parties may contact the designated company representative for potential access under confidentiality agreements. Following the principle of anonymity, the affiliated institution will only be disclosed once this article is published. The IGDB game-centric dataset and game-to-process name mapping table are available upon request.
9. Conclusion
FPS is a crucial factor in determining the gaming experience. This paper designs a targeted large-scale data collection specifically for this factor, filling a gap in the quantitative analysis of big data. By analyzing software and hardware characteristics and game features from around the world, this paper delves deeply into various aspects affecting FPS from both micro and macro perspectives, providing well-founded analyses. Additionally, to address the issue of not knowing how a game will perform on a player’s machine before purchase, this paper proposes a predictor based on federated learning, which takes into account the unique characteristics of both players and games. The predictor can provide results with various levels of granularity according to user needs, fully considering the cold start problem. This solution offers players more transparent and reliable information, boosting their purchasing confidence and providing insights into solving this type of issue.
References
- (1)
- WoL (2023) 2023. Wo Long Dev Says Sorry about the Crappy PC Version but the Thing Is, You See, There Are Lots of Types of PC | PC Gamer. https://www.pcgamer.com/wo-long-dev-says-sorry-about-the-crappy-pc-version-but-the-thing-is-you-see-there-are-lots-of-types-of-pc/.
- bla (2024) 2024. Black Myth: Wukong on Steam. https://store.steampowered.com/app/2358720/Black_Myth_Wukong/.
- Epi (2024) 2024. Epic Games Store. https://store.epicgames.com/en-US/.
- Gra (2024) 2024. Grand Theft Auto V -Configuration. https://steamdb.info/app/271590/config/.
- cyb (2024) 2024. Home of the Cyberpunk 2077 Universe — Games, Anime & More. https://www.cyberpunk.net/us/en/.
- IGD (2024a) 2024a. IGDB: Video Game Database API. https://www.igdb.com/api.
- IGD (2024b) 2024b. IGDB.Com - Discover, Rate & Track Your Games | Contribute to the Largest Video Games Database. https://www.igdb.com/.
- IMF (2024) 2024. IMF Data. https://www.imf.org/en/Data.
- Nob (2024) 2024. NOBUNAGA’S AMBITION on Steam. https://store.steampowered.com/app/544990/NOBUNAGAS_AMBITION/.
- Ste (2024a) 2024a. Steam Store. https://store.steampowered.com/.
- Ste (2024b) 2024b. SteamDB. https://steamdb.info/.
- Dir (2024) 2024. What is DirectX? - Microsoft Support. https://support.microsoft.com/en-us/topic/how-to-install-the-latest-version-of-directx-d1f5ffa5-dae2-246c-91b1-ee1e973ed8c2.
- Why (2024) 2024. Why Is Cyberpunk 2077 so Horribly Optimised for PC, despite All the Delays and Promises? https://www.quora.com/Why-is-Cyberpunk-2077-so-horribly-optimised-for-PC-despite-all-the-delays-and-promises.
- Wor (2024) 2024. World Bank Open Data. https://data.worldbank.org.
- Xbo (2024) 2024. Xbox Games. https://www.xbox.com/en-US/games.
- Awosika et al. (2024) Tomisin Awosika, Raj Mani Shukla, and Bernardi Pranggono. 2024. Transparency and Privacy: The Role of Explainable AI and Federated Learning in Financial Fraud Detection. IEEE Access 12 (2024), 64551–64560.
- C et al. (2022) NguyenDinh C, PhamQuoc-Viet, PathiranaPubudu N, DingMing, SeneviratneAruna, LinZihuai, DobreOctavia, and HwangWon-Joo. 2022. Federated Learning for Smart Healthcare: A Survey. ACM Computing Surveys (CSUR) (Feb. 2022).
- Calvillo-Gámez et al. (2015) Eduardo H. Calvillo-Gámez, Paul Cairns, and Anna L. Cox. 2015. Assessing the Core Elements of the Gaming Experience. In Game User Experience Evaluation, Regina Bernhaupt (Ed.). Springer International Publishing, Cham, 37–62.
- Chatterjee et al. (2024) Pushpita Chatterjee, Debashis Das, and Danda B. Rawat. 2024. Federated Learning Empowered Recommendation Model for Financial Consumer Services. IEEE Transactions on Consumer Electronics 70, 1 (Feb. 2024), 2508–2516.
- Chen et al. (2023) Daoyuan Chen, Dawei Gao, Yuexiang Xie, Xuchen Pan, Zitao Li, Yaliang Li, Bolin Ding, and Jingren Zhou. 2023. FS-REAL: Towards Real-World Cross-Device Federated Learning. In Proceedings of the 29th ACM SIGKDD Conference on Knowledge Discovery and Data Mining (KDD ’23). Association for Computing Machinery, New York, NY, USA, 3829–3841.
- Chen and Guestrin (2016) Tianqi Chen and Carlos Guestrin. 2016. Xgboost: A scalable tree boosting system. In Proceedings of the 22nd acm sigkdd international conference on knowledge discovery and data mining. 785–794.
- Claypool and Claypool (2007) Kajal T Claypool and Mark Claypool. 2007. On frame rate and player performance in first person shooter games. Multimedia systems 13, 1 (2007), 3–17.
- Claypool and Claypool (2009) Mark Claypool and Kajal Claypool. 2009. Perspectives, Frame Rates and Resolutions: It’s All in the Game. In Proceedings of the 4th International Conference on Foundations of Digital Games (FDG ’09). Association for Computing Machinery, New York, NY, USA, 42–49.
- Claypool et al. (2006) Mark Claypool, Kajal Claypool, and Feissal Damaa. 2006. The effects of frame rate and resolution on users playing first person shooter games. In Multimedia computing and networking 2006, Vol. 6071. SPIE, 607101.
- Elbir and Coleri (2020) Ahmet M. Elbir and Sinem Coleri. 2020. Federated Learning for Hybrid Beamforming in mm-Wave Massive MIMO. IEEE Communications Letters 24, 12 (2020), 2795–2799.
- Feng et al. (2020) Jie Feng, Can Rong, Funing Sun, Diansheng Guo, and Yong Li. 2020. PMF: A Privacy-preserving Human Mobility Prediction Framework via Federated Learning. Proc. ACM Interact. Mob. Wearable Ubiquitous Technol. 4, 1, Article 10 (March 2020), 21 pages. https://doi.org/10.1145/3381006
- Hefner et al. (2007) Dorothée Hefner, Christoph Klimmt, and Peter Vorderer. 2007. Identification with the player character as determinant of video game enjoyment. In International conference on entertainment computing. Springer, 39–48.
- Hinum (2024) Klaus Hinum. 2024. Mobile Graphics Cards - Benchmark List. https://www.notebookcheck.net/Mobile-Graphics-Cards-Benchmark-List.844.0.html.
- IssaWael et al. (2023) IssaWael, MoustafaNour, TurnbullBenjamin, SohrabiNasrin, and TariZahir. 2023. Blockchain-Based Federated Learning for Securing Internet of Things: A Comprehensive Survey. Comput. Surveys (Jan. 2023).
- Jagoda and McDonald (2018) Patrick Jagoda and Peter McDonald. 2018. Game Mechanics, Experience Design, and Affective Play. In The Routledge Companion to Media Studies and Digital Humanities, Jentery Sayers (Ed.). Routledge, New York, 174–182.
- Karimireddy et al. (2020) Sai Praneeth Karimireddy, Satyen Kale, Mehryar Mohri, Sashank Reddi, Sebastian Stich, and Ananda Theertha Suresh. 2020. SCAFFOLD: Stochastic Controlled Averaging for Federated Learning. In Proceedings of the 37th International Conference on Machine Learning. PMLR, 5132–5143.
- Kashcha et al. (2022) Mariia Kashcha, Valerii Yatsenko, and Tamás Gyömörei. 2022. Country performance in e-sport: Social and economic development determinants. Journal of International Studies (2071-8330) 15, 4 (2022).
- Klimmt et al. (2019) Christoph Klimmt, Daniel Possler, Nicolas May, Hendrik Auge, Louisa Wanjek, and Anna-Lena Wolf. 2019. Effects of soundtrack music on the video game experience. Media Psychology 22, 5 (2019), 689–713.
- Konečný et al. (2017) Jakub Konečný, H. Brendan McMahan, Felix X. Yu, Peter Richtárik, Ananda Theertha Suresh, and Dave Bacon. 2017. Federated Learning: Strategies for Improving Communication Efficiency. arXiv:1610.05492 [cs]
- Li et al. (2020) Li Li, Yuxi Fan, Mike Tse, and Kuo-Yi Lin. 2020. A Review of Applications in Federated Learning. Computers & Industrial Engineering 149 (Nov. 2020), 106854.
- Lika et al. (2014) Blerina Lika, Kostas Kolomvatsos, and Stathes Hadjiefthymiades. 2014. Facing the cold start problem in recommender systems. Expert systems with applications 41, 4 (2014), 2065–2073.
- Lipscomb and Zehnder (2004) Scott D Lipscomb and Sean M Zehnder. 2004. Immersion in the virtual environment: The effect of a musical score on the video gaming experience. Journal of Physiological Anthropology and Applied Human Science 23, 6 (2004), 337–343.
- Liu et al. (2023) Shengmei Liu, Atsuo Kuwahara, James J Scovell, and Mark Claypool. 2023. The Effects of Frame Rate Variation on Game Player Quality of Experience. In Proceedings of the 2023 CHI Conference on Human Factors in Computing Systems (CHI ’23). Association for Computing Machinery, New York, NY, USA, 1–10.
- Mammen (2021) Priyanka Mary Mammen. 2021. Federated Learning: Opportunities and Challenges. arXiv:2101.05428 [cs]
- McCarthy and Wright (2004) John McCarthy and Peter Wright. 2004. Technology as experience. interactions 11, 5 (2004), 42–43.
- McEwan et al. (2012) Mitchell McEwan, Daniel Johnson, Peta Wyeth, and Alethea Blackler. 2012. Videogame control device impact on the play experience. In Proceedings of the 8th australasian conference on interactive entertainment: Playing the system. 1–3.
- Moll et al. (2020) Philipp Moll, Veit Frick, Natascha Rauscher, and Mathias Lux. 2020. How players play games: observing the influences of game mechanics. In Proceedings of the 12th acm international workshop on immersive mixed and virtual environment systems. 7–12.
- National Institute of Standards and Technology / U.S. Department of Commerce (2012) National Institute of Standards and Technology / U.S. Department of Commerce. 2012. Tukey’s Method. In NIST/SEMATECH e-Handbook of Statistical Methods. Chapter 4.7.1. https://www.itl.nist.gov/div898/handbook/prc/section4/prc471.htm Accessed: 2024-08-01.
- Parshakov and Zavertiaeva (2018) Petr Parshakov and Marina Zavertiaeva. 2018. Determinants of performance in eSports: A country-level analysis. International Journal of Sport Finance 13, 1 (2018), 34–51.
- PfeifferKilian et al. (2023) PfeifferKilian, RappMartin, KhaliliRamin, and HenkelJörg. 2023. Federated Learning for Computationally Constrained Heterogeneous Devices: A Survey. Comput. Surveys (July 2023).
- Popper (2013) Karl Popper. 2013. Knowledge and the Body-Mind Problem: In Defence of Interaction. Routledge, New York.
- Quirk (2012) Thomas J. Quirk. 2012. One-Way Analysis of Variance (ANOVA). Springer New York, New York, NY, 163–179. https://doi.org/10.1007/978-1-4614-3725-3_8
- Rieke et al. (2020) Nicola Rieke, Jonny Hancox, Wenqi Li, Fausto Milletarì, Holger R. Roth, Shadi Albarqouni, Spyridon Bakas, Mathieu N. Galtier, Bennett A. Landman, Klaus Maier-Hein, Sébastien Ourselin, Micah Sheller, Ronald M. Summers, Andrew Trask, Daguang Xu, Maximilian Baust, and M. Jorge Cardoso. 2020. The Future of Digital Health with Federated Learning. npj Digital Medicine 3, 1 (Sept. 2020), 1–7.
- Sánchez et al. (2012) José Luis González Sánchez, Francisco Luis Gutiérrez Vela, Francisco Montero Simarro, and Natalia Padilla-Zea. 2012. Playability: analysing user experience in video games. Behaviour & Information Technology 31, 10 (2012), 1033–1054.
- Silva et al. (2023) Nicollas Silva, Thiago Silva, Heitor Werneck, Leonardo Rocha, and Adriano Pereira. 2023. User cold-start problem in multi-armed bandits: When the first recommendations guide the user’s experience. ACM Transactions on Recommender Systems 1, 1 (2023), 1–24.
- Soutter and Hitchens (2016) Alistair Raymond Bryce Soutter and Michael Hitchens. 2016. The relationship between character identification and flow state within video games. Computers in human behavior 55 (2016), 1030–1038.
- Stoffel et al. (2022) AntunesRodolfo Stoffel, André da CostaCristiano, KüderleArne, YariImrana Abdullahi, and EskofierBjörn. 2022. Federated Learning for Healthcare: Systematic Review and Architecture Proposal. ACM Transactions on Intelligent Systems and Technology (TIST) (May 2022).
- Tompkins and Martins (2022) Jessica E Tompkins and Nicole Martins. 2022. Masculine pleasures as normalized practices: Character design in the video game industry. Games and Culture 17, 3 (2022), 399–420.
- Venkatasubramanian et al. (2023) Madumitha Venkatasubramanian, Arash Habibi Lashkari, and Saqib Hakak. 2023. IoT Malware Analysis Using Federated Learning: A Comprehensive Survey. IEEE Access 11 (2023), 5004–5018.
- Wang et al. (2020) Hongyi Wang, Mikhail Yurochkin, Yuekai Sun, Dimitris Papailiopoulos, and Yasaman Khazaeni. 2020. Federated Learning with Matched Averaging. arXiv:2002.06440 [cs, stat]
- Wang et al. (2023) Jialin Wang, Rongkai Shi, Wenxuan Zheng, Weijie Xie, Dominic Kao, and Hai-Ning Liang. 2023. Effect of Frame Rate on User Experience, Performance, and Simulator Sickness in Virtual Reality. IEEE Transactions on Visualization and Computer Graphics 29, 5 (2023), 2478–2488.
- Watson (2020) Alexander Watson. 2020. Deep Learning Techniques for Super-Resolution in Video Games. arXiv:2012.09810 [cs, eess]
- Zhang et al. (2023) Xunzheng Zhang, Alex Mavromatis, Antonis Vafeas, Reza Nejabati, and Dimitra Simeonidou. 2023. Federated Feature Selection for Horizontal Federated Learning in IoT Networks. IEEE Internet of Things Journal 10, 11 (June 2023), 10095–10112.