Blue and Green Early-type Galaxies Lack Alignment with Large-scale Filaments, Indicating a Distinct Evolutionary Path from Red Counterparts
Abstract
We investigate the alignment of non-red early-type galaxies (ETGs) with blue or green colors within large-scale filaments and compare this alignment pattern with that of red ETGs. Our analysis reveals a significant alignment of the major axes of red ETGs with the orientations of their host cosmic filaments, consistent with prior research. In contrast, non-red ETGs show no significant alignment signal. This divergence in alignment behavior between non-red and red ETGs implies a distinct evolutionary path for non-red ETGs, suggesting a formation process that may be independent of galaxy mergers or that recent mergers experienced by non-red ETGs may not follow the direction of the filament but rather be more random or even perpendicular to the filament orientation.
footnote
1 Introduction
Early-type galaxies (ETGs), encompassing primarily elliptical and lenticular galaxies, constitute a distinct cosmic population defined by spheroidal morphologies, older stellar populations, and typically low star formation activity. These galaxies are pivotal in exploring the connections between galaxy evolution and the larger cosmic environment. Studying the alignment of ETGs within large-scale structures like galaxy clusters, filaments, and voids provides insight into their formation processes, merger histories, and dynamical evolution (e.g., Hung et al., 2010; Primack, 2024; O’Kane et al., 2024; Merluzzi et al., 2015).
The spatial distribution and orientation of ETGs reveal alignment phenomena that inform our understanding of their assembly history and interactions with the cosmic web. Notably, ETG major axes often show a strong radial alignment within dynamically old, relaxed galaxy clusters and groups, likely due to angular momentum exchanges in repeated encounters within the dense cluster environment and tidal forces from central massive galaxies (Schneider et al., 2013; Rong et al., 2015a, 2019; Plionis et al., 2008; Lee & Choi, 2015; Coutts, 1996; Pereira & Kuhn, 2005; Wang & Kang, 2017, 2018). Conversely, in younger, dynamically evolving clusters, the orientations of ETGs tend to reflect their initial infall along filamentary structures, preserving a memory of their accretion path (Plionis & Basilakos, 2002; Plionis et al., 2003; Rong et al., 2015b; Wesson, 1984; West, 1994; Kang & Wang, 2015). This radial alignment is a known source of bias in weak lensing measurements, where it can mimic the coherent alignments expected from gravitational lensing (Hirata & Seljak, 2004; Troxel & Ishak, 2014).
In large-scale filaments, red ETGs’ major axes often align with filament elongations, likely a result of galaxy mergers within these structures (Rong et al., 2016; Tempel et al., 2013; Tempel & Libeskind, 2013; Tempel et al., 2015; Barsanti et al., 2022; Kraljic et al., 2021; Kitzbichler & Saurer, 2003; Wang et al., 2018). Observations show that redder and brighter ETGs tend to exhibit stronger alignment (Zhang et al., 2013; Tempel et al., 2013), suggesting that alignment studies can robustly constrain galaxy formation scenarios.
Notably, previous alignment studies primarily focused on red, quiescent ETGs. However, the blue and green ETGs, with younger stellar populations and active star formation, challenge conventional classifications and may offer insights into alternative formation pathways. Their alignment with large-scale structures remains unclear. These ETGs, classfied as non-red ETGs (nETGs), in particular, may exhibit distinct formation mechanisms compared to quiescent ETGs (Tojeiro et al., 2013; Deng et al., 2009; Li et al., 2024). Examining the alignment of nETGs within large-scale filaments could clarify the differences between red and non-red ETGs, offering a deeper understanding of galaxy evolution and cosmic structure formation.
This study investigates the alignment of nETGs in large-scale filaments. Section 2 describes the sample selection, Section 3 presents a statistical analysis of nETG alignments relative to host filaments and compares the findings to red ETG alignments, and Section 4 provides a summary and discussion of the results.
2 Sample
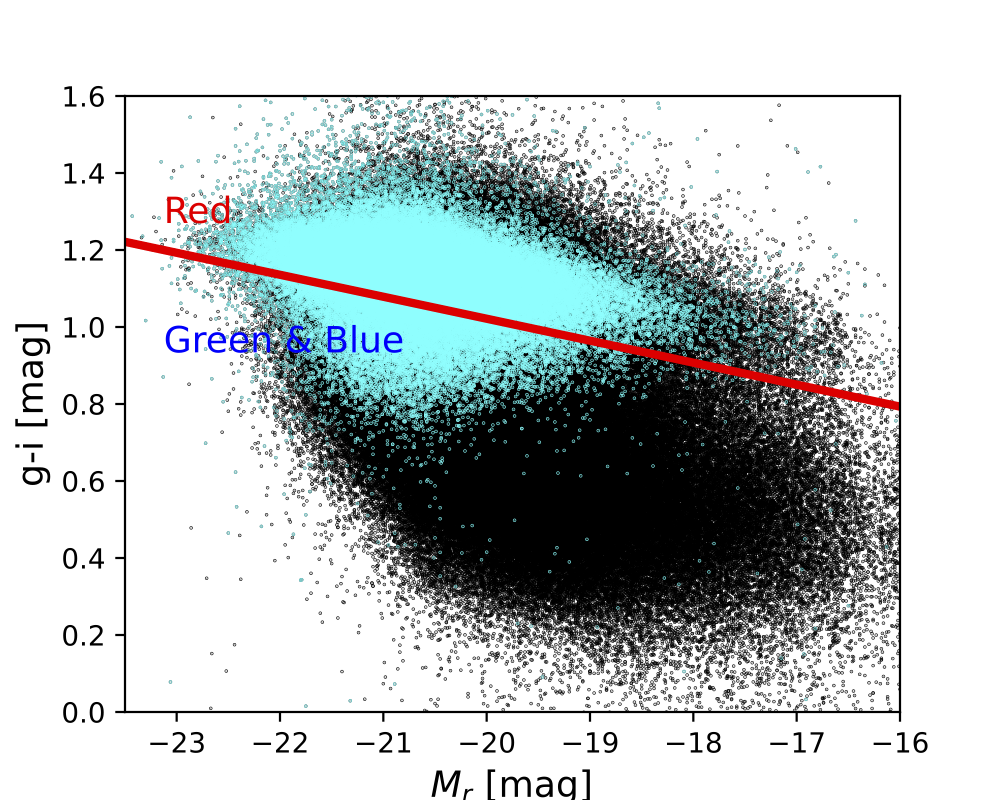
We select nETGs from the spectroscopic galaxy sample compiled by Tempel et al. (2012), based on data from the Sloan Digital Sky Survey (SDSS) (Aihara et al., 2011). This sample is limited to a -band Petrosian magnitude of mag, providing various properties for each galaxy, including position, -band absolute magnitudes, morphology (‘’), group ranking (‘’), and more. From the color-magnitude diagram in Fig. 1, we identify non-red galaxies below the boundary (Papastergis et al., 2013). Red-sequence galaxies are also selected for comparison.
Galaxies classified as ‘’ (as defined in Tempel et al. 2012) are categorized as ETGs, enabling the isolation of both nETGs and red ETGs (rETGs). Stellar masses are estimated from the -band absolute magnitudes and colors using the mass-to-light ratio equation (Bell et al., 2003). Considering the stronger alignment signal in more massive ETGs (Tempel et al., 2013, 2015), only ETGs with are included.
Focusing on the alignment of central ETGs within large-scale filaments, we exclude satellite galaxies and retain those with ‘’. Position angles are determined using the SDSS “photoObj.deVPhi_r” parameter, which is a reliable metric for elliptical galaxies with de Vaucouleurs surface brightness profile (de Vaucouleurs et al., 1948). Galaxies with an axis ratio of “photoObj.deVAB_r” are removed for accuracy.
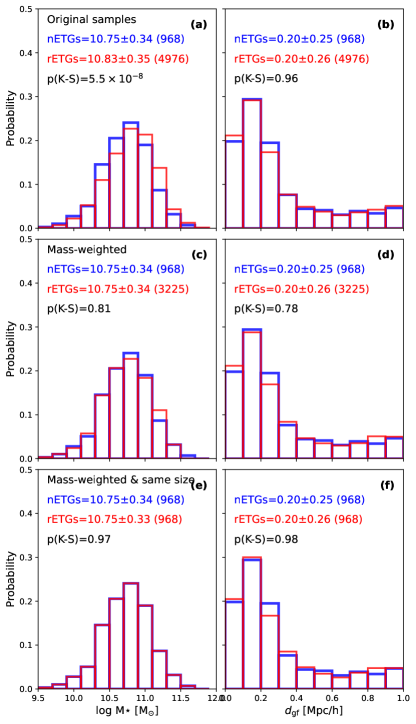
The associated filament of each ETG is identified from the filament catalog by Tempel et al. (2014) based on its three-dimensional distance () to the filament spine. The alignment analysis is limited to ETGs within Mpc, approximately marking a filament boundary (Wang et al., 2024). This final sample consists of 968 nETGs and 4,976 rETGs located in their respective host filaments. Their distributions of and are compared in the upper panels of Fig. 2.
3 Alignment of non-red ETGs
The catalog compiled by Tempel et al. (2014) includes information on filament points and filament spine orientation at each point. In our study, we calculate the angle between the major axis of each ETG and the orientation of the nearest filament spine in the plane of the sky, following the methodology described by Wang et al. (2020). Here, is constrained to the range [0, 90∘]. An alignment signal is considered statistically significant if the distribution of deviates noticeably from uniformity.
Previous research has shown that the galactic stellar mass and the distance to the filament have a significant impact on the strength of the alignment signal of ETGs (Wang et al., 2020; Chen et al., 2019). As shown in the upper panels of Fig. 2, while the distributions of for the rETG and nETG samples are similar, their stellar mass distributions differ. Therefore, it is essential to ensure that the stellar mass distributions of the two samples are comparable to accurately compare their alignment signals. To achieve this, we implement a mass-weighting control method.
Initially, we establish the stellar mass distribution of the nETG sample as the reference. Subsequently, we assign weights to the rETG sample using the equation:
| (1) |
where and represent the fractions of galaxies in the nETG and rETG samples within the -th stellar mass bin, respectively. denotes the weight of the rETG sample in the -th stellar mass bin. We then randomly select galaxies from the rETG sample within the -th stellar mass bin, using
| (2) |
where represents the original number of galaxies in the rETG sample within the -th stellar mass bin. is the maximum value of across different bins. The stellar mass distribution of the rETG sample post weighting is compared with that of the nETG sample in panel c of Fig. 2. The comparable medians and high -values from two-sample Kolmogorov–Smirnov (K-S) tests indicate no significant differences of the stellar masses and between the two samples after weighting method applied. Subsequently, we utilize the weighted rETG sample (with 3,225 member galaxies) and nETG sample to examine the relationship between their major axes’ orientations and filaments’ orientations.
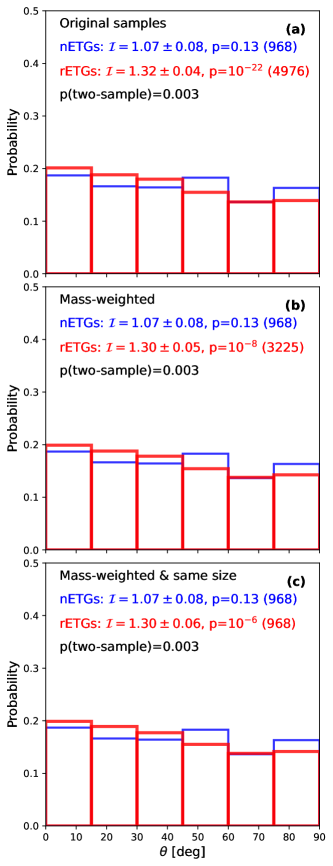
The red histogram in panel b of Fig. 3 depicts the average distribution of of rETGs after mass-weighting, with 100 times repeats. The major axes of rETGs show clear alignment with the parent filaments. To quantify alignment strength, following the method outlined in Rong et al. (2024) and Rong et al. (2019), we define , where and represent the numbers of ETGs with in the ranges [0, 45∘] and [45∘, 90∘], respectively. A uniform distribution yields .
The uncertainty of , , is estimated from the 100 times repeats: for each mass-weighting selection of rETGs, we estimate a . The standard deviation of these values is taken as the uncertainty.
The average distribution of for rETGs after mass-weighting reveals a significant alignment signal with (equivalent to a confidence level of approximately based on ) and a K-S test -value of (compared to a uniform distribution). This alignment finding for rETGs is consistent with previous studies (e.g., Tempel et al., 2013). In contrast, nETGs exhibit negligible alignment (111The uncertainty of nETGs is estimated using bootstrap resampling. From the original sample with members, we randomly select galaxies with replacement, repeating this 100 times to obtain 100 values of , and the standard deviation of these values is taken as the uncertainty.), with a K-S test -value of compared to a uniform distribution, indicating no significant alignment. The K-S test comparison between the rETGs and nETGs yields a small -value (), confirming a statistically significant difference in their alignment distributions. Therefore, the distinct alignment signals of rETGs and nETGs cannot be attributed to the differences in stellar mass or between rETGs and nETGs, as these properties are comparable.
To investigate whether the alignment strength difference between the two samples is influenced by their different sample sizes, we apply the mass-weighting method described earlier and randomly select rETGs by setting , where represents the number of nETGs in the -th stellar mass bin. The distributions of and of nETGs and the selected rETGs are compared in the lower panels of Fig. 2, with large -values indicating no significant differences. However, the alignment distributions of the rETGs and selected nETGs with equal sample sizes still exhibit a notable difference. Only the major axes of the rETGs show a significant alignment with filament spines ( indicating an alignment signal at approximately confidence level; K-S test when compared to a uniform distribution). Hence, the discrepancy in alignment signals between nETGs and rETGs is not due to the variation in sample sizes.
4 Summary and discussion
Using SDSS data, we investigate the alignment of central ETGs with large-scale filaments. We categorize ETGs into red (rETGs) and non-red (nETGs) based on their optical colors. Our statistical analysis confirms a robust alignment of the major axes of red ETGs with filament orientation, consistent with previous studies. In contrast, nETGs exhibit either no alignment or very weak alignment. This suggests that the alignment signal observed in ETGs within large-scale filaments, as reported in prior research (e.g., Tempel et al., 2013), is predominantly driven by red ETGs, while blue ETGs do not contribute significantly to the alignment signal.
We establish that the difference in alignment between rETGs and nETGs is not influenced by disparities in the distributions of stellar masses or distances to filament spines between the two samples, nor by variations in sample sizes. Our results remain consistent regardless of changes in ellipticity or stellar mass thresholds for sample selection. For instance, when selecting ETGs based on criteria such as “photoObj.deVAB_r0.7” or “photoObj.deVAB_r0.6” or or , the alignment patterns remain unchanged.
The absence of alignment in nETGs may indicate a distinct formation pathway. While the alignment of rETGs likely arises from mergers along filament orientations (Tempel & Libeskind, 2013), our findings suggest that nETGs may not predominantly form through mergers. Alternatively, nETGs may arise from processes such as the instability of spiral galaxies (Kormendy, 2013; van den Bosch, 1998), leading to more randomly distributed orientations. Notably, the star formation histories of nETGs and blue spiral galaxies exhibit similarities (Tojeiro et al., 2013).
Moreover, recent galaxy mergers may have significantly altered the original morphology of nETGs. Studies by Maller & Dekel (2002) indicate that the spin vectors and orientations of galaxies are primarily influenced by their most recent merging events. This implies that the latest mergers involving nETGs may not align with the filament spine but instead follow more random directions relative to the spine, potentially even perpendicular to it. For example, gas-rich galaxy pairs accreted by large-scale filaments may merge in a manner that positions them on either side of the filament spine, leading to a connecting line between the merging galaxies that is perpendicular to the spine direction. In contrast, mergers giving rise to rETGs are more likely to occur along the spine direction, potentially after undergoing preprocessing within a galaxy group and possessing lower gas content, resulting in a red, quiescent descendant. Therefore, the absence of alignment in nETGs may be attributed to their formation through recently accreted gas-rich galaxy pairs by large-scale filaments, with the merging systems exhibiting more random angular momentum directions.
References
- Aihara et al. (2011) Aihara, H., Allende Prieto, C., An, D., et al. 2011, ApJS, 193, 29
- Barsanti et al. (2022) Barsanti, S., et al. 2022, MNRAS, 516, 3569
- Bell et al. (2003) Bell, E. F., McIntosh, D. H., Katz, N., Weinberg, M. D. 2003, ApJS, 149, 289
- Chen et al. (2019) Chen, Y.-C., Ho, S., Blazek, J., He, S., Mandelbaum, R., Melchior, P., Singh, S. 2019, MNRAS, 485, 2492
- Coutts (1996) Coutts A., 1996, MNRAS, 278, 87
- de Vaucouleurs et al. (1948) de Vaucouleurs, G. 1948, Ann. d’Ap., 11, 247
- Deng et al. (2009) Deng, X.-F., He, J.-Z., Wu, P., Ding, Y.-P. 2009, ApJ, 699, 948
- Hirata & Seljak (2004) Hirata C. M., Seljak U., 2004, Phys. Rev. D, 70, 063526
- Hung et al. (2010) Hung L.-W., Bañados E., De Propris R., West M. J., 2010, ApJ, 720, 1483
- Kitzbichler & Saurer (2003) Kitzbichler, M. G., Saurer, W. 2003, ApJ, 590, L9
- Kormendy (2013) Kormendy, J. 2013, Secular Evolution of Galaxies, by Jesús Falcón-Barroso, and Johan H. Knapen, Cambridge, UK: Cambridge University Press, 2013, p.1
- Kang & Wang (2015) Kang X., Wang P., 2015, ApJ, 813, 6.
- Kraljic et al. (2021) Kraljic, K., et al. 2021, MNRAS, 504, 4626
- Lee & Choi (2015) Lee, J., Choi, Y.-Y. 2015, ApJ, 799, 212
- Li et al. (2024) Li, F., Wang, E., Zhu, M., et al. 2024, ApJ, 974, 238
- Maller & Dekel (2002) Maller, A. H., & Dekel, A. 2002, MNRAS, 335, 487
- Merluzzi et al. (2015) Merluzzi, P. et al. 2015, MNRAS, 446, 803
- O’Kane et al. (2024) O’Kane, C. J., Kuchner, U., Gray, M. E., Aragón-Salamanca, A. 2024, MNRAS, 534, 1682
- Papastergis et al. (2013) Papastergis, E., Giovanelli, R., Haynes, M. P., Rodríguez-Puebla, A., Jones, M. G. 2013, ApJ, 776, 43
- Pereira & Kuhn (2005) Pereira, M. J., Kuhn, J. R. 2005, ApJ, 627L, 21
- Plionis & Basilakos (2002) Plionis M., Basilakos S., 2002, MNRAS, 329, L47
- Plionis et al. (2008) Pereira, M. J., Bryan, G. L., Gill, S. P. D. 2008, ApJ, 672, 825
- Plionis et al. (2003) Plionis M., Benoist C., Maurogordato S., Ferrari, C., Basilakos, S., 2003, ApJ, 594, 144
- Primack (2024) Primack, J. R. 2024, Annual Review of Nuclear and Particle Science, 74, 173
- Rong et al. (2024) Rong, Y., Shen, J., Hua, Z. 2024, MNRAS, 531L, 9
- Rong et al. (2016) Rong, Y., Liu, Y., Zhang, S.-N. 2016, MNRAS, 455, 2267
- Rong et al. (2019) Rong, Y., Puzia, T. H., et al. 2019, ApJ, 883, 56
- Rong et al. (2015a) Rong, Y., Yi, S.-X., Zhang, S.-N., Tu, H. 2015a, MNRAS, 451, 2536
- Rong et al. (2015b) Rong, Y., Zhang, S.-N., Liao, J.-Y. 2015b, MNRAS, 453, 1577
- Schneider et al. (2013) Schneider, M. D., et al. 2013, MNRAS, 433, 2727
- Tempel et al. (2015) Tempel, E., Guo, Q., Kipper, R., Libeskind, N. I. 2015, MNRAS, 450, 2727
- Tempel & Libeskind (2013) Tempel, E., Libeskind, N. I. 2013, ApJ, 775, L42
- Tempel et al. (2014) Tempel, E., Stoica, R. S., Martínez, V. J., Liivamägi, L. J., Castellan, G., Saar, E., 2014, MNRAS, 438, 3465
- Tempel et al. (2013) Tempel, E., Stoica, R. S., Saar, E. 2013, MNRAS, 428, 1827
- Tempel et al. (2012) Tempel, E., Tago, E., Liivamägi, L. J., 2012, A&A, 540, A106
- Tojeiro et al. (2013) Tojeiro, R., Masters, K. L., Richards, J. 2013, MNRAS, 432, 359
- Troxel & Ishak (2014) Troxel M. A., Ishak M., 2014, preprint arXiv:1047.6990
- van den Bosch (1998) van den Bosch, F. C., 1998, ApJ, 507, 601
- Wang et al. (2020) Wang, P., Libeskind, N. I., Tempel, E., Pawlowski, M. S., Kang, X., Guo, Q. 2020, ApJ, 900, 129
- Wang & Kang (2017) Wang P., Kang X. 2017, MNRAS468, L123
- Wang et al. (2018) Wang P., Guo Q., Kang X., Libeskind N. I., 2018, ApJ, 866, 138.
- Wang & Kang (2018) Wang P., Kang X., 2018, MNRAS, 473, 1562.
- Wang et al. (2024) Wang, W., Wang, P., Guo, H., et al. 2024, MNRAS, 532, 4604
- Wesson (1984) Wesson P. S., 1984, A&A, 138, 253
- West (1994) West M. J., 1994, MNRAS, 268, 79
- Zhang et al. (2013) Zhang, Y., Yang, X., Wang, H., Wang, L., Mo, H. J., van den Bosch, F. C. 2013, ApJ, 779, 160