CardioLab: Laboratory Values Estimation and Monitoring from Electrocardiogram Signals - A Multimodal Deep Learning Approach
Abstract
Background Laboratory values are fundamental to medical diagnosis and management, but acquiring these values can be costly, invasive, and time-consuming. While electrocardiogram (ECG) patterns have been linked to certain laboratory abnormalities, the comprehensive modeling of these relationships remains underexplored.
Methods We utilize MIMIC-IV dataset to develop multimodal deep-learning models to demonstrate the feasibility of estimating (real-time) and monitoring (predict at future intervals) laboratory value abnormalities from ECG waveforms, demographics, biometrics, and vital signs.
Results The models exhibit a strong predictive performance with AUROC scores above 0.70 in a statistically significant manner for 23 laboratory values in the estimation setting and up to 26 values in the monitoring setting. Most notably, the accurately predictable values encompassing abnormalities across diverse physiological categories such as cardiac, renal, hematological, metabolic, immunological and coagulation. To name examples, for estimation NTproBNP (353 pg/mL) with 0.882, whereas for monitoring at 30 minutes Urea nitrogen (6 mg/dL) with 0.851, at 60 minutes creatinine (0.5 mg/dL) with 0.85, and at 120 minutes hemoglobin (17.5 g/dL) with 0.821.
Conclusions This study provides first evidence for the feasibility of using ECG data alongside clinical routine data for the real-time estimation and monitoring of laboratory value abnormalities, which could provide a non-invasive, cost-effective supplement to traditional laboratory testing, with strong implications for enhanced patient monitoring and early intervention. Further validation could facilitate their integration into routine clinical practice.
1 Introduction
Laboratory values play a crucial role in various medical contexts, ranging from diagnosing diseases [1] to guiding therapeutic interventions in routine care [2] and intensive care [3] settings. These values, derived from various bodily fluids or tissues, provide quantitative insights into a patients’ physiological status, aiding clinicians in making informed decisions. Despite their importance, obtaining laboratory values often involves invasive procedures, such as venipuncture or arterial puncture, which can cause discomfort and carry associated risks [4, 5]. Moreover, the process is resource-intensive [6, 7], requiring specialized equipment, skilled personnel, and significant time for sample collection, processing, and analysis. Delays in obtaining results further limit their utility in rapidly evolving clinical scenarios, highlighting the need for alternative or complementary approaches of measurement [8, 9].
An electrocardiogram (ECG) is essential as a first-in-line assessment of a patient’s cardiac state. While the ECG is traditionally associated with the detection of cardiovascular diseases, the advent of deep learning has expanded the diagnostic potential of the ECG towards other domains, such as non-cardiac conditions, reviewed in [10, 11] and demonstrated within a single model in [12], or as in important predictor for patient deterioration [13].
Recent research has explored the relationship between cardiac patterns observed on ECG and abnormal laboratory values, suggesting potential links between systemic health and cardiovascular function, and while advancements in machine learning have enabled ECG to model diverse physiological factors beyond cardiovascular health, the integration of ECG with machine learning towards modeling laboratory values presents new opportunities for learning complex interactions which can enhance clinical decision making [14].
2 Background
Laboratory values and ECG changes Several studies have explored how laboratory values correlate with ECG changes. [15] classified ECG abnormalities due to electrolyte imbalances, distinguishing between reversible changes from ion shifts and structural damage from chronic deficiencies. [16] identified low lymphocyte counts as a prognostic marker for mortality or myocardial infarction in patients with non-diagnostic ECGs. [17] examined the link between ECG abnormalities and urea nitrogen levels in hemodialysis patients, noting prevalent arrhythmias and ST-T changes. [18] found significant ECG abnormalities correlated with lower hemoglobin levels in anemic patients. [19] highlighted a strong correlation between high serum ferritin levels and prolonged QT intervals, indicating potential arrhythmia risks. [20] found prolonged QTc interval on hyperkalemia. Finally, [21] demonstrates that abnormal ECG patterns, interact with biomarkers to influence heart failure risk predictions such as NT-proBNP.
Machine learning and ECG for laboratory values estimation Recent works have focused on predicting laboratory values using ECG data. [22] explored predicting potassium, calcium, sodium, and creatinine from ECG signals using deep learning. [23] developed a model that classifies electrolyte imbalances such as hyperkalemia and hypokalemia. [24] introduced a smartwatch-compatible model for predicting serum potassium levels in end-stage renal disease patients. [25] created a personalized model using single-lead ECG data to predict dysglycemia in critically ill patients. This work stands in the tradition of an earlier conference publication [26], where the authors demonstrated the feasibility of predicting anomalous laboratory values from ECG features and demographics. This work significantly extends this work by replacing ECG features by ECG waveforms leveraging deep learning models and extending the application scenario from estimation to estimation and monitoring.
3 Methods
3.1 Dataset and predictive tasks
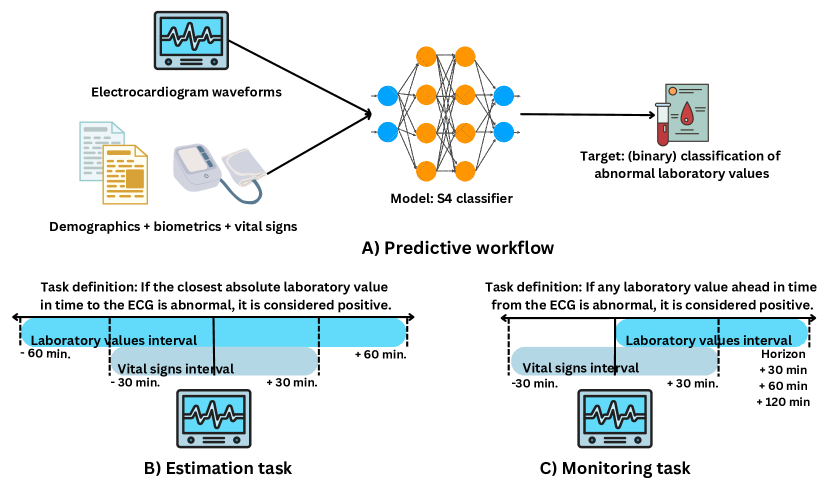
The dataset for this study integrates the publicly available MIMIC-IV [27] and MIMIC-IV-ECG [28] databases, comprising 795,546 samples from 159,608 unique patients, including both inpatient and outpatient records. Each sample features a 12-lead ECG recorded over 10 seconds. Demographic data includes gender, age, and race (Caucasian, African, Asian, Latino, or other). Vital signs, which are practical and cost-effective for non-invasive measurement, include temperature (°F), heart rate (bpm), respiration rate (bpm), oxygen saturation (%), systolic and diastolic blood pressure (mmHg). Biometrics such as BMI (kg/m²), weight (kg), and height (cm) are also included. These features support binary classification tasks to predict abnormalities in laboratory values, defined by median lab-value-specific thresholds (distributed with MIMIC-IV) across the dataset (see Figure 1 A).
The predictive tasks include estimation and monitoring. The estimation task, shown in Figure 1 B, utilizes vital signs from 30 minutes collected before or after the ECG was taken to predict laboratory abnormalities based on the closest value within 60 minutes. The monitoring task, depicted in Figure 1 C, uses the same vital signs to forecast if any abnormality within 30, 60, or 120 minutes in the future. Data splitting follows the MIMIC-IV-ECG-ICD [12] approach, with an 18:1:1 train-validation-test ratio, stratified according to diagnoses. We require at least 10 positive and 10 negative cases per fold, resulting in 137 abnormalities for estimation, and 116, 126, and 135 abnormalities for monitoring at time horizons 30, 60, and 120 minutes, respectively.
3.2 Models, training and performance evaluation
The primary model used is an S4 classifier, consisting of a time series encoder with four bidirectional S4 blocks [29], each with a dimension of 512 and a state size of 8, followed by average pooling as used in prior work[30, 12, 13]. The tabular encoder consist of a linear layer with PReLu activation function aiming to align the size of tabular features with the time series latent representations. Then, we concatenate both latent representations and employ a late fusion strategy with a differentiable outer product [31] and a linear classification head. Missing values in tabular features are median-imputed. We use additional binary variables to track missing input variables in the feature space. We considered all abnormalities with at least 10 positive and 10 negative labels in the validation and test folds respectively.
We optimize a binary crossentropy loss as appropriate for a multi-label classification problem. We exclude contributions from samples for which no target value is available from the computation of the loss, separately for each laboratory value. Models are optimized with the AdamW optimizer using a learning rate and weight decay of 0.001, and trained for 20 epochs with a batch size of 32. To avoid overfitting, we select models based on the highest macro AUROC on the validation set, typically around epoch 15. Following research by [30], we use 2.5-second ECG segments. During testing, predictions are averaged over four non-overlapping 2.5-second segments sampled at 100 Hz. Training takes about 19 hours on an NVIDIA L40 GPU. Statistical uncertainty is assessed using empirical bootstrap with 1000 iterations, providing 95% prediction intervals for macro AUROC and individual AUROCs.
4 Results
4.1 Estimation
| Value | Threshold | Estimation AUROC |
|---|---|---|
| NTproBNP [Ca.] | 353 pg/mL | 0.882 (0.860, 0.902) |
| Urea Nitrogen [Re.] | 6 mg/dL | 0.860 (0.822, 0.890) |
| Hemoglobin [He.] | 17.5 g/dL | 0.844 (0.779, 0.900) |
| Creatinine [Re./Ca.] | 0.5 mg/dL | 0.825 (0.792, 0.857) |
| Ferritin [Me.] | 13 ng/mL | 0.820 (0.716, 0.910) |
| Creatinine [Re./Ca.] | 1.2 mg/dL | 0.797 (0.789, 0.806) |
| Hematocrit [He.] | 51 % | 0.789 (0.731, 0.840) |
| Albumin [Me.] | 3.5 g/dL | 0.786 (0.767, 0.805) |
| Urea Nitrogen [Re.] | 20 mg/dL | 0.781 (0.773, 0.788) |
| RDW-SD [He.] | 46.3 fL | 0.769 (0.753, 0.784) |
| Hemoglobin [He.] | 13.7 g/dL | 0.762 (0.752, 0.771) |
| Anion Gap [Me.] | 20 mEq/L | 0.745 (0.728, 0.761) |
| RDW [He.] | 15.5 % | 0.742 (0.733, 0.753) |
| Bicarbonate [Me.] | 32 mEq/L | 0.739 (0.712, 0.766) |
| Bilirubin, Total [Me.] | 1.5 mg/dL | 0.734 (0.707, 0.761) |
| Hematocrit [He.] | 40 % | 0.734 (0.725, 0.744) |
| INR PT [Co.] | 1.1 ratio | 0.734 (0.723, 0.746) |
| Red Blood Cells [He.] | 4.6 m/uL | 0.732 (0.722, 0.742) |
| PT [Co.] | 12.5 sec | 0.731 (0.720, 0.743) |
| Creatine Kinase [Ca.] | 38 IU/L | 0.730 (0.703, 0.758) |
| MCHC [He.] | 31 g/dL | 0.726 (0.710, 0.741) |
| Calcium, Total [Re.] | 8.4 mg/dL | 0.722 (0.705, 0.738) |
| Lymphocytes [Im.] | 18 % | 0.720 (0.710, 0.731) |
Table 1 contains the performance results for laboratory value estimation. Overall, 23 abnormalities across 19 unique laboratory values achieve AUROC scores above 0.7 in a statistically significant manner. Notably, NTproBNP levels above 353 pg/mL were estimated with an AUROC of 0.882. Urea nitrogen levels below 6 mg/dL were estimated with an AUROC of 0.860. Hemoglobin levels above 17.5 g/dL had an AUROC of 0.844, while Creatinine levels below 0.5 mg/dL with an AUROC of 0.825. Other values such as ferritin, hematocrit, and albumin also demonstrated strong predictive performance.
4.2 Monitoring
| Value | Threshold | 30 min. AUROC | 60 min. AUROC | 120 min. AUROC |
|---|---|---|---|---|
| NTproBNP [Ca.] | 353 pg/mL | 0.870 (0.835, 0.902) | 0.874 (0.847, 0.900) | 0.881 (0.860, 0.902) |
| Urea Nitrogen [Re.] | 6 mg/dL | 0.851 (0.781, 0.905) | 0.850 (0.788, 0.897) | 0.854 (0.810, 0.892) |
| Creatinine [Re./Ca.] | 0.5 mg/dL | 0.815 (0.752, 0.871) | 0.833 (0.787, 0.878) | 0.824 (0.784, 0.857) |
| Hemoglobin [He.] | 17.5 g/dL | 0.786 (0.609, 0.919) | 0.782 (0.676, 0.867) | 0.821 (0.736, 0.894) |
| Iron Binding [Im.] | 260 ug/dL | 0.728 (0.615, 0.837) | 0.803 (0.737, 0.873) | 0.802 (0.745, 0.861) |
| Transferrin [Im.] | 200 mg/dL | 0.728 (0.615, 0.837) | 0.803 (0.737, 0.872) | 0.802 (0.745, 0.861) |
| Creatinine [Re./Ca.] | 1.2 mg/dL | 0.794 (0.781, 0.808) | 0.801 (0.790, 0.812) | 0.804 (0.795, 0.815) |
| Hematocrit [He.] | 51 % | 0.770 (0.690, 0.853) | 0.780 (0.710, 0.851) | 0.797 (0.732, 0.857) |
| Urea Nitrogen [Re.] | 20 mg/dL | 0.786 (0.774, 0.798) | 0.787 (0.777, 0.797) | 0.787 (0.778, 0.796) |
| Albumin [Me.] | 3.5 g/dL | 0.785 (0.756, 0.815) | 0.786 (0.762, 0.810) | 0.784 (0.764, 0.806) |
| RDW-SD [He.] | 46.3 fL | 0.769 (0.745, 0.793) | 0.776 (0.756, 0.794) | 0.769 (0.753, 0.784) |
| Hemoglobin [He.] | 13.7 g/dL | 0.765 (0.751, 0.780) | 0.767 (0.756, 0.779) | 0.771 (0.761, 0.781) |
| eAG [Me.] | 123 mg/dL | 0.728 (0.647, 0.809) | 0.762 (0.704, 0.818) | 0.737 (0.688, 0.783) |
| Abs. Basophils [Im.] | 0.01 K/uL | 0.714 (0.659, 0.772) | 0.754 (0.707, 0.797) | 0.743 (0.702, 0.781) |
| Bicarbonate [Me.] | 32 mEq/L | 0.722 (0.763, 0.681) | 0.741 (0.709, 0.774) | 0.747 (0.719, 0.777) |
| Anion Gap [Me.] | 20 mEq/L | 0.746 (0.721, 0.769) | 0.741 (0.721, 0.762) | 0.742 (0.725, 0.759) |
| RDW [He.] | 15.5 % | 0.735 (0.720, 0.751) | 0.742 (0.730, 0.756) | 0.743 (0.733, 0.754) |
| Creatine Kinase [Ca.] | 38 IU/L | 0.730 (0.692, 0.770) | 0.740 (0.708, 0.775) | 0.733 (0.703, 0.764) |
| Monocytes [Im.] | 11 % | 0.711 (0.676, 0.748) | 0.734 (0.706, 0.760) | 0.738 (0.716, 0.760) |
| Hematocrit [He.] | 40 % | 0.731 (0.718, 0.746) | 0.735 (0.724, 0.748) | 0.739 (0.729, 0.749) |
| MCHC [He.] | 31 g/dL | 0.737 (0.715, 0.759) | 0.735 (0.716, 0.754) | 0.728 (0.711, 0.743) |
| Bilirubin, Total [Me.] | 1.5 mg/dL | 0.712 (0.670, 0.753) | 0.725 (0.688, 0.761) | 0.732 (0.702, 0.761) |
| Red Blood Cells [He.] | 4.6 m/uL | 0.728 (0.713, 0.743) | 0.730 (0.718, 0.744) | 0.734 (0.723, 0.745) |
| Lymphocytes [Im.] | 18 % | 0.735 (0.720, 0.749) | 0.728 (0.716, 0.742) | 0.727 (0.716, 0.739) |
| INR PT [Co.] | 1.1 ratio | 0.719 (0.702, 0.736) | 0.733 (0.719, 0.747) | 0.730 (0.718, 0.743) |
| Calcium, Total [Re.] | 8.4 mg/dL | 0.714 (0.685, 0.741) | 0.727 (0.704, 0.749) | 0.725 (0.708, 0.743) |
| PT [Co.] | 12.5 sec | 0.714 (0.697, 0.732) | 0.727 (0.713, 0.742) | 0.724 (0.712, 0.738) |
Table 2 contains the performance results for laboratory value monitoring. Overall, the number of abnormal conditions and unique laboratory values that achieve an AUROC score above 0.7 in a statistically significant manner are 15 and 13 for the 30-minute horizon, 25 and 22 for the 60-minutes horizon, as well as 26 and 22 for the 120-minute horizon. Notably, NTproBNP levels above 353 pg/mL achieved the highest AUROC of 0.881 at 120 minutes. Urea nitrogen levels below 6 mg/dL had an AUROC of 0.854 at 120 minutes, while urea nitrogen levels above 20 mg/dL reached an AUROC of 0.787 at 120 minutes. Creatinine levels below 0.5 mg/dL performed best with an AUROC of 0.833 at 60 minutes, and creatinine levels above 1.2 mg/dL had an AUROC of 0.804 at 120 minutes. Hemoglobin levels above 17.5 g/dL showed a significant AUROC of 0.821 at 120 minutes. Iron binding and transferrin levels below 260 ug/dL and 200 mg/dL, respectively, both achieved an AUROC of 0.803 at 60 minutes. Hematocrit levels above 51% had an AUROC of 0.797 at 120 minutes. Finally, albumin levels below 3.5 g/dL achieved an AUROC of 0.786 at 60 minutes. Other values such as RDW-SD, eAG, absolute basophils, bicarbonate, anion gap, RDW, creatine kinase, monocytes, MCHC, bilirubin, red blood cells, lymphocytes, INR PT, calcium, and PT also demonstrated strong predictive performance.
4.3 Discussion
Summary This study explores the potential of using ECG data combined with demographic and clinical data to estimate and monitor laboratory value abnormalities. Utilizing the MIMIC-IV dataset, multimodal deep-learning models were developed to predict abnormalities in real time and at future intervals. The models achieved strong performance, with AUROC scores above 0.70 for up to 26 laboratory values across various physiological categories. Key results include accurate predictions for NTproBNP, urea nitrogen, creatinine, and hemoglobin levels. These findings demonstrate the feasibility of non-invasive, cost-effective methods for patient monitoring, enhancing the way for diagnostic tools and early interventions in clinical settings.
Physiological groups and their relationship with ECG Data The ability to predict various laboratory abnormalities from ECG data is clinically significant as it reflects underlying physiological changes. Cardiac markers such as NTproBNP, creatinine, and creatine kinase are directly related to heart stress and injury, with ECG changes providing insight into these conditions. Renal markers like urea nitrogen, creatinine, and calcium can cause cardiac function disturbances due to fluid and electrolyte imbalances, making ECG prediction plausible [32]. Hematological values, including hemoglobin, hematocrit, and RDW, are linked to blood disorders affecting cardiac function, which can be mirrored in ECG changes. Metabolic markers such as bicarbonate and anion gap influence cardiac function through disturbances like acidosis or alkalosis, detectable by ECG. Immunological parameters like iron binding and lymphocytes may indirectly affect cardiac health through systemic inflammation, which can be reflected in ECG patterns [33]. Finally, coagulation markers like INR PT and PT are essential for assessing bleeding and clotting risks, with their abnormalities potentially causing ECG changes due to associated cardiac stress.
Clinical relevance and applications The model’s ability to predict abnormal lab values in the estimation not only for laboratory values commonly associated with cardiac diseases mirrors the ability to infer hints on non-cardiac conditions from the ECG [12]. The monitoring aligns with prior work highlighting the added diagnostic value of ECG waveforms for deterioration task [13]. Nevertheless, the prediction of anomalous lab values represents a prediction task with a well-defined ground truth which makes it a relevant case for algorithmic benchmarking. Clinical implications of predicting laboratory values from ECG data, such as potential benefits in patient monitoring, early diagnosis, treatment personalization, and faster and low-cost diagnoses. As example, predicting electrolyte imbalances (such as potassium and calcium) from ECG data can enable early detection of arrhythmias, allowing timely interventions in emergency or ICU settings. Additionally, predicting NTproBNP levels can aid in the early diagnosis and monitoring of heart failure, especially in remote monitoring or routine check-ups, enabling preventive action. Creatinine predictions from ECG could provide early insights into renal function, aiding in the detection of kidney dysfunction in outpatient or home care settings, preventing further damage through earlier referrals.
Limitations Our approach has several limitations. First, our task definition relies on median threshold values inferred from MIMIC-IV and therefore do not cover dependencies of reference values on patient characteristics such as demographic characteristics. This question will have to be revisited more thoroughly in future studies. For certain scenarios, also the differentiation into anomalously low and anomalously high values might be not finegrained enough and might necessitate to frame the prediction problem as a more finegrained ordinal classification or even as a regression problem. Second, the current setup of the monitoring task does not provide any insights into the time frame where the abnormality occurs. This could be mitigated by predicting future laboratory values at a particular future horizon up some tolerance. Here, we mainly use it to demonstrate the feasibility of providing prognostic insights into laboratory values. Finally, the approach should be tested on diverse cohorts to ensure it generalizes effectively before being deployed in clinical settings.
Future work First, we believe that a natural next step after the demonstration of the general feasibility of predicting and monitoring abnormalities across a broad variety of laboratory values would be to focus on individual laboratory values or groups thereof more closely, incorporating state-of-the-art reference intervals, more adapted/finegrained prediction scenarios and external validation in appropriate cohorts. Second, we envision the use of explainable AI techniques, such as those put forward in [34] or concept-based causal approaches [35], could enhance our understanding on the mechanisms of how lab values impact the ECG.
Author contribution statement JMLA and NS contributed to the conceptualization of the study. JMLA was responsible for data curation, formal analysis, and visualization, as well as writing the original draft. JMLA, and NS conducted the investigation and developed the methodology. NS oversaw the supervision of the project. Validation was carried out by NS. Finally, JMLA, and NS were involved in the review and editing of the manuscript.
Data and code availability Code for dataset preprocessing and experimental replications can be found in our dedicated repository [36].
Hardware and software requirements The experiments were conducted on single NVIDIA L40 GPUs. The environment included Python 3.10.8, PyTorch 1.13.0, and PyTorch Lightning 1.8.0 to perform the computational tasks.
References
- [1] Chernecky CC, Berger BJ. Laboratory tests and diagnostic procedures. Elsevier Health Sciences, 2012.
- [2] Rigby WF, Lampl K, Low JM, Furst DE. Review of routine laboratory monitoring for patients with rheumatoid arthritis receiving biologic or nonbiologic dmards. International journal of rheumatology 2017;2017(1):9614241.
- [3] Ezzie ME, Aberegg SK, O’Brien Jr JM. Laboratory testing in the intensive care unit. Critical care clinics 2007;23(3):435–465.
- [4] Ialongo C, Bernardini S. Phlebotomy, a bridge between laboratory and patient. Biochemia medica 2016;26(1):17–33.
- [5] Buowari OY, et al. Complications of venepuncture. Adv Biosci Biotechnol 2013;4(1):126–128.
- [6] Beliveau L, Buddenhagen D, Moore B, Davenport D, Burton M, Duane T. Decreasing resource utilization without compromising care through minimizing preoperative laboratories. The American Surgeon 2018;84(7):1185–1188.
- [7] Halpern NA, Pastores SM, Greenstein RJ. Critical care medicine in the united states 1985–2000: an analysis of bed numbers, use, and costs. Critical care medicine 2004;32(6):1254–1259.
- [8] Vashist SK. Non-invasive glucose monitoring technology in diabetes management: A review. Analytica chimica acta 2012;750:16–27.
- [9] Shah N, Osea E, Martinez G. Accuracy of noninvasive hemoglobin and invasive point-of-care hemoglobin testing compared with a laboratory analyzer. International journal of laboratory hematology 2014;36(1):56–61.
- [10] Topol EJ. What’s lurking in your electrocardiogram? The Lancet 2021;397(10276):785.
- [11] Siontis KC, Noseworthy PA, Attia ZI, Friedman PA. Artificial intelligence-enhanced electrocardiography in cardiovascular disease management. Nature Reviews Cardiology 2021;18(7):465–478.
- [12] Strodthoff N, Lopez Alcaraz JM, Haverkamp W. Prospects for artificial intelligence-enhanced electrocardiogram as a unified screening tool for cardiac and non-cardiac conditions: an explorative study in emergency care. European Heart Journal Digital Health 2024;ztae039.
- [13] Alcaraz JML, Bouma H, Strodthoff N. Mds-ed: Multimodal decision support in the emergency department – a benchmark dataset for diagnoses and deterioration prediction in emergency medicine. arXiv preprint 240717856 2024;URL https://arxiv.org/abs/2407.17856.
- [14] Hager P, Jungmann F, Holland R, Bhagat K, Hubrecht I, Knauer M, Vielhauer J, Makowski M, Braren R, Kaissis G, et al. Evaluation and mitigation of the limitations of large language models in clinical decision-making. Nature Medicine 2024;1–10.
- [15] Surawicz B. Relationship between electrocardiogram and electrolytes. American heart journal 1967;73(6):814–834.
- [16] Núñez J, Sanchis J, Bodí V, Núñez E, Mainar L, Heatta AM, Husser O, Miñana G, Merlos P, Darmofal H, et al. Relationship between low lymphocyte count and major cardiac events in patients with acute chest pain, a non-diagnostic electrocardiogram and normal troponin levels. Atherosclerosis 2009;206(1):251–257.
- [17] Abe S, Yoshizawa M, Nakanishi N, Yazawa T, Yokota K, Honda M, Sloman G. Electrocardiographic abnormalities in patients receiving hemodialysis. American heart journal 1996;131(6):1137–1144.
- [18] Shashikala G, Shashidhar P, Herur A, Chinagudi S, Patil SS, Ankad RB, Badami SV. Correlation between haemoglobin level and electrocardiographic (ecg) findings in anaemia: a cross-sectional study. Journal of clinical and diagnostic research JCDR 2014;8(4):BC04.
- [19] Laudanski K, Ali H, Himmel A, Godula K, Stettmeier M, Calvocoressi L. The relationship between serum ferritin levels and electrocardiogram characteristics in acutely ill patients. Experimental Clinical Cardiology 2009;14(3):38.
- [20] Davison AS, Devlin L, Panicker JJ. Severe hypokalemia associated with paralysis after a large carbohydrate intake following exercise. Clinical Chemistry 2024;70(4):584–587.
- [21] Tan ES, Chan SP, Liew OW, Chong JP, Leong GK, Yeo DP, Ong HY, Jaufeerally F, Yap J, Sim D, et al. Atrial fibrillation and the prognostic performance of biomarkers in heart failure. Clinical Chemistry 2021;67(1):216–226.
- [22] von Bachmann P, Gedon D, Gustafsson FK, Ribeiro AH, Lampa E, Gustafsson S, Sundström J, Schön TB. Evaluating regression and probabilistic methods for ecg-based electrolyte prediction. Scientific Reports 2024;14(1):15273.
- [23] Kwon Jm, Jung MS, Kim KH, Jo YY, Shin JH, Cho YH, Lee YJ, Ban JH, Jeon KH, Lee SY, et al. Artificial intelligence for detecting electrolyte imbalance using electrocardiography. Annals of Noninvasive Electrocardiology 2021;26(3):e12839.
- [24] Chiu IM, Wu PJ, Zhang H, Hughes JW, Rogers AJ, Jalilian L, Perez M, Lin CHR, Lee CT, Zou J, Ouyang D. Serum potassium monitoring using ai-enabled smart watch electrocardiograms. medRxiv 2024;.
- [25] Chiu IM, Cheng CY, Chang PK, Li CJ, Cheng FJ, Lin CHR. Utilization of personalized machine-learning to screen for dysglycemia from ambulatory ecg, toward noninvasive blood glucose monitoring. Biosensors 2022;13(1):23.
- [26] Alcaraz JML, Strodthoff N. Cardiolab: Laboratory values estimation from electrocardiogram features – an exploratory study. In Computing in Cardiology. 2024; URL https://arxiv.org/abs/2407.18629.
- [27] Johnson A, Bulgarelli L, Pollard T, Horng S, Celi LA, Mark R. Mimic-iv. PhysioNet Available online at httpsphysionet orgcontentmimiciv10accessed August 23 2021 2020;49–55.
- [28] Gow B, Pollard T, Nathanson LA, Johnson A, Moody B, Fernandes C, Greenbaum N, Waks JW, Eslami P, Carbonati T, Chaudhari A, Herbst E, Moukheiber D, Berkowitz S, Mark R, Horng S. Mimic-iv-ecg: Diagnostic electrocardiogram matched subset, 2023.
- [29] Gu A, Goel K, Ré C. Efficiently modeling long sequences with structured state spaces. In International Conference on Learning Representations. 2022; .
- [30] Mehari T, Strodthoff N. Towards quantitative precision for ecg analysis: Leveraging state space models, self-supervision and patient metadata. IEEE Journal of Biomedical and Health Informatics November 2023;27(11):5326–5334. ISSN 2168-2208.
- [31] Zadeh A, Chen M, Poria S, Cambria E, Morency LP. Tensor fusion network for multimodal sentiment analysis. arXiv preprint 170707250 2017;.
- [32] Boudoulas KD, Triposkiadis F, Parissis J, Butler J, Boudoulas H. The cardio-renal interrelationship. Progress in cardiovascular diseases 2017;59(6):636–648.
- [33] Swirski FK, Nahrendorf M. Cardioimmunology: the immune system in cardiac homeostasis and disease. Nature Reviews Immunology 2018;18(12):733–744.
- [34] Wagner P, Mehari T, Haverkamp W, Strodthoff N. Explaining deep learning for ecg analysis: Building blocks for auditing and knowledge discovery. Computers in Biology and Medicine 2024;176:108525.
- [35] Alcaraz JML, Strodthoff N. Causalconceptts: Causal attributions for time series classification using high fidelity diffusion models. arXiv preprint arXiv240515871 2024;.
- [36] AI4HealthUOL Team. AI4HealthUOL/CardioLab. https://github.com/AI4HealthUOL/CardioLab, 2024. [Accessed 01-07-2024].