DeepMedcast: A Deep Learning Method for Generating Intermediate Weather Forecasts among Multiple NWP Models
Abstract
Numerical weather prediction (NWP) centers around the world operate a variety of NWP models, and recent advances in AI-driven NWP models have increased the availability of diverse NWP outputs. While this expansion holds the potential to improve forecast accuracy, it also raises a critical challenge of identifying the most reliable predictions for specific forecast scenarios. Traditional approaches, such as ensemble or weighted averaging, combine multiple NWP outputs but often generate unrealistic atmospheric fields, complicating the production of reliable and consistent forecasts in operational settings.
In this study, we introduce DeepMedcast, a deep learning method that generates intermediate forecast, or "medcast", between two or more NWP outputs. Unlike ensemble averaging, DeepMedcast can provide consistent and explainable medcast without distorting meteorological fields. This paper details the methodology and case studies of DeepMedcast, discussing its advantages and potential contributions to operational forecasting.
Keywords Deep Neural network Intemediate forecast Numerical weather prediction
1 Introduction
In recent decades, numerical weather predictions (NWPs) and their post-processing have played a central role in issuing weather forecasts, warnings, and advisories (WMO, 2013; Vannitsem el al., 2021). NWP centers around the world have developed and are operating a variety of NWP models for accurate weather predictions. For example, the European Centre for Medium-Range Weather Forecasts (ECMWF) operates the Integrated Forecasting System (IFS) and its ensemble prediction system (ECMWF, 2024); the UK Met Office operates the Unified Model and the Met Office Global and Regional Ensemble Prediction System (Brown et al., 2012; Hagelin et al., 2017; Inverarity et al., 2023). The National Centers for Environmental Prediction (NCEP) at the National Oceanic and Atmospheric Administration (NOAA) operates the Global Forecast System (NCEP, 2016), the High-Resolution Rapid Refresh (Dowell et al., 2022), and the Hurricane Weather Research and Forecasting model (Gopalakrishnan et al., 2011). The Japan Meteorological Agency (JMA) operates three deterministic NWP models and two ensemble prediction systems for short-range to weekly forecasts: the Global Spectrum Model (GSM), the Meso-Scale Model (MSM), the Local Forecast Model, the Global Ensemble Prediction System, and the Mesoscale Ensemble Prediction System (JMA, 2024). These models cover different areas with varying resolutions and processes.
In addition to traditional physics-based NWP models, recent advancements in artificial intelligence (AI) have introduced new methods for producing weather predictions. AI-driven NWP models, such as FourCastNet (Pathak et al., 2022; Bonev et al., 2023), GraphCast (Lam et al., 2022), Pangu-Weather (Bi et al., 2022, 2023), FengWu (Chen et al., 2023; Han et al., 2024), Aurora (Bodnar et al., 2024), GenCast (Price et al., 2023), and AIFS (Lang et al., 2024), have demonstrated the ability to enhance both the speed and accuracy of weather predictions by leveraging deep learning techniques to model complex atmospheric systems.
At present, forecasters are able to use multiple NWP models including AI-driven NWP models, which provide a range of possible atmospheric states, allowing them to select the most plausible prediction from available NWPs. However, this raises a critical question: Which prediction is the most plausible? If the models have comparable accuracy, it is impossible to determine in advance which one is the best. One practical and widely used solution is to average the results from multiple NWP models or their post-processed outputs (Vislocky and Fritsch, 1997; JMA, 2018). The National Hurricane Center and the Joint Typhoon Warning Center in the United States use consensus forecasts (e.g., Simon et al. (2018); Cangialosi et al. (2023)), which are weighted averages, extensively for both tropical cyclone (TC) track and intensity predictions. JMA employs consensus forecasting for TC track predictions by averaging multiple NWP outputs to improve forecast accuracy (Nishimura and Fukuda, 2019; JMA, 2022). The UK Met Office operates the IMPROVER system (Roberts el al., 2023), which applies a weighted average of post-processing and nowcasts based on multiple NWP outputs. The National Weather Service (NWS) at NOAA operates the National Blend of Models (NBM), which provides statistically post-processed multi-model ensemble guidance (Hamill et al., 2017). The German Meteorological Service uses MOSMIX and ModelMIX (Primo et al., 2024), which are weighted averages of post-processing based on IFS, their global model, and their regional ensemble model. Additionally, the World Area Forecast Centre, comprising centers in London and Washington, operates harmonized forecasts, including mean, maximum, and minimum forecasts, from both NWP outputs for aviation hazards such as cumulonimbus clouds, turbulence, and in-flight icing (ICAO, 2016).
It is straightforward to average the central position of TCs, extra tropical cyclones, or the location of fronts because averaging does not degrade their clarity. However, averaging atmospheric fields such as pressure or wind speed around these systems is not appropriate. This is because averaging can smooth out or distort these fields, weakening the central pressure or wind speeds around cyclones and fronts, resulting in predictions that are unrealistic, meteorologically inconsistent, and difficult to interpret. Forecasters must then choose between two options: using a single model that is explainable but potentially less accurate or using an averaged prediction that is unexplainable and unrealistic but may be more accurate.
In response to this dilemma, we propose DeepMedcast, a novel approach that uses deep learning to generate intermediate forecast—or "medcast"—between two or more NWP models. Unlike averaging, DeepMedcast can produce atmospheric fields around cyclones and fronts without smoothing out or disturbing their distributions. This capability is crucial in operational forecasts, where accurate and explainable predictions are needed for issuing reliable warnings and advisories. To the best of the authors’ knowledge, no existing method provides plausible intermediate forecasts by combining multiple NWP model outputs.
This paper is structured as follows: Section 2 presents the methodology and data used for DeepMedcast, detailing the deep learning architecture and training process. Section 3 discusses the results of applying DeepMedcast to multiple NWP models with case studies, and Section 4 offers a discussion of the advantages of DeepMedcast and its contributions to operational forecasting. Finally, Section 5 concludes with a summary of the findings and future research directions.
2 Method and data

2.1 The framework of DeepMedcast
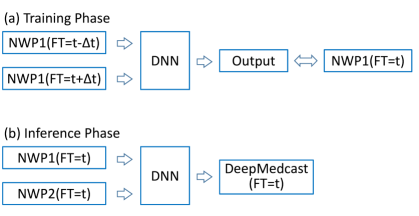
The main idea behind DeepMedcast lies in its original approach to generating intermediate forecasts between two NWP outputs. Figure 1 illustrates the framework of DeepMedcast. During the training phase, instead of using two different NWP outputs intended for creating an intermediate forecast, DeepMedcast utilizes data at two forecast lead times (FT), FT = t - t and FT = t + t, from a single NWP model as input variables for the deep neural network (DNN) (Fig. 1a). The output from the DNN is then compared to the forecast from the same NWP at the intermediate lead time (FT = t) to calculate the loss for the backpropagation process. This approach enables the network to generate intermediate forecasts without blurriness, as the input variables are not inherently affected by forecast errors, and the predictions at FT = t are expected to lie between those at FT = t ± t. During the inference phase, two different NWP outputs at the same forecast lead time are used to generate an intermediate forecast for the projection time (Fig. 1b).
DeepMedcast is primarily designed to generate intermediate forecasts between two NWP models. However, the same DNN model can be applied recursively to generate intermediate forecasts between more than two NWP models. For instance, by taking intermediate forecasts between two pairs of NWP models, DeepMedcast can generate an intermediate result between four NWP models (Fig.2). This recursive approach could be extended further to create intermediate forecasts between 8, 16, or even more NWP models.
2.2 Data used for the study
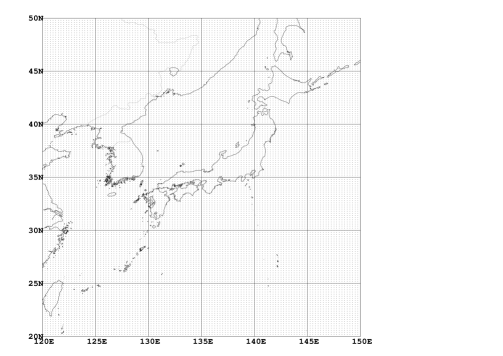
The NWP model used for training is GSM, which is operated by JMA four times a day (at 00, 06, 12, and 18 UTC as initial times). The training period spans nine years, from January 2013 to December 2021, while the validation period covers one year, from January to December 2022. GSM had a horizontal resolution of approximately 20 km until March 2023, after which it was upgraded to about 13 km (JMA, 2024). The GSM data used in this study is stored at JMA, where it is trimmed and interpolated onto a 121 151 grid with a resolution of 0.25 degrees by 0.2 degrees around Japan (Fig. 3). Hereafter, we refer to this as the target grid domain.
The forecast variables include wind components (U, V), temperature (T), and relative humidity (RH) at both the surface and the 700 hPa level, and mean sea-level pressure at the surface (). Each variable is used individually to train separate networks, with each network dedicated to a single variable. That means, each DNN model always takes two input channels (at FT = t - t and FT = t + t) and outputs one channel (at FT = t) for DeepMedcast. Both input channels are utilized by swapping their order, i.e., both FT = t - t and FT = t + t, as well as FT = t + t and FT = t - t, are employed to preserve symmetry. The networks trained with 700 hPa data are employed to generate intermediate forecasts for the upper atmosphere (e.g., 850 hPa, 700 hPa, and 500 hPa) to reduce computational costs. The forecast lead times used in this study are t = 9, 10, 11, 12, 13, and 14 hours, with t = ±3 and ±6 hours, corresponding to t and t in Fig. 1, determined by taking both computational costs and accuracy into account.
For the case studies in Section 3, MSM, IFS, GraphCast, and Pangu-Weather are used along with GSM for inference. MSM is operated by JMA eight times a day (at 00, 03, …, and 21 UTC as initial times) with a 5 km horizontal resolution, providing forecasts up to FT = 78 hours for 00 and 12 UTC initial times and up to FT = 39 hours for other initial times. IFS data, provided by ECMWF for the World Meteorological Organization (WMO) members, has a horizontal resolution of 0.5 degrees and is initialized four times daily at 00, 06, 12, and 18 UTC; however, only data initialized at 00 and 12 UTC is used in this study. Both GraphCast and Pangu-Weather have a horizontal resolution of 0.25 degrees, with data initialized at 00, 06, 12, and 18 UTC, however; we use data initialized at 00 and 12 UTC similar to IFS. These NWP outputs are interpolated to the target grid domain for inference.
2.3 DNN model architecture
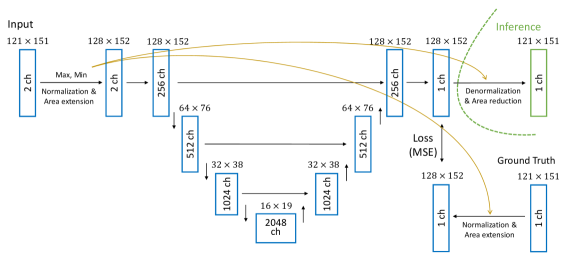
In this study, a U-Net architecture (Ronneberger et al., 2015) is applied as the DNN model. The structure of the network is illustrated in Fig. 4. The encoder part of the U-Net utilizes a convolutional network with kernel size = 3, stride = 1, and padding = 1 for convolution operations. To progressively reduce the image size, MaxPooling layers with kernel size = 2 and stride = 2 are employed. This downsampling process continues until the image size is reduced to 1/8 of the original dimensions, at which point the channel count reaches 2048, starting from an initial 2 channels that are expanded to 256 channels. In each downsampling stage, the image size is halved while the number of channels doubles. In the decoder part, transposed convolutional layers with kernel size = 2 and stride = 2 are applied to upsample the feature maps, restoring the image to its original size while reducing the channel count by half at each stage. By the final stage, the image is returned to its original dimensions with 256 channels, which are then reduced to 1 channel in the output layer. The activation functions used in this network include rectified linear units (ReLU,(Nair and Hinton, 2010) for all layers except the output layer, which uses a sigmoid function to ensure output values are scaled between 0 and 1.
During the training phase, the two input channels and one ground truth channel, each consisting of 121 151 grids, are normalized to a value range of 0 to 1 using the maximum and minimum values across all three channels. Specifically, for T, RH, and , the normalization is applied as:
| (1) |
where is the normalized value, is the input value, and and represent the maximum and minimum values, respectively. For wind components U and V, and are defined as:
and the same normalization is applied.
After normalization, the values are extended to 128 158 grids by copying the last column and row to adjust to the network structure. The output values are compared with the normalized and extended ground truth values using the mean square error (MSE) as the loss function. We employ Adam (Kingma and Ba, 2014) as optimization.
During the inference phase, the input values are normalized to the 0 to 1 range using the maximum and minimum values of the two input channels. The output values are then denormalized using the same maximum and minimum values, and resized back to 121 151 grids by trimming the extended columns and rows, providing predictions at the target grid domain.


3 Results
In this section, we demonstrate the capability of DeepMedcast through four case studies. The forecast data used here is from a period beginning in January 2023, which is independent of the DNN’s training and validation periods. The case studies compare the atmospheric fields generated by DeepMedcast with those obtained via arithmetic mean of the NWP outputs.
3.1 Case 1: Position discrepancy in a typhoon forecast between GSM and MSM
The first case study examines a typhoon forecast where there is a positional discrepancy between GSM and MSM. Figure 5 shows the predictions at FT = 51 hours based on the initial time of 12 UTC on 12 August 2023. This case focuses on Typhoon LAN which was moving northwest over the ocean south of Japan. At FT = 51 hours, GSM predicted the typhoon’s position at 33.3∘N, 137.1∘E, while MSM placed it southwest at 32.7∘N, 135.7∘E. Both models predicted a central pressure of 960 hPa, with the maximum wind speed of 79 kt (1 kt 0.514 m s-1) (GSM) and 68 kt (MSM) (Figs. 5a and 5b).
When the mean sea-level pressure and surface wind components from GSM and MSM were averaged arithmetically, the typhoon’s center split into two, aligning with the predicted positions from each model (Fig. 5c). The central pressure weakened to 974 hPa, and the maximum wind speed reduced to 58 kt, which made the forecast meteorologically unnatural, with the typhoon taking on an elongated structure and weakening wind speeds near the center. This resulted in a forecast that was difficult to explain and potentially misleading.
In contrast, DeepMedcast generated a coherent forecast, placing the typhoon at 33.0∘N, 136.4∘E, halfway between GSM and MSM predictions (Fig. 5d). The typhoon maintained a single, natural, and explainable shape with a central pressure of 960 hPa and the maximum wind speed of 69 kt, representing an intermediate forecast between the two NWP models.
3.2 Case 2: Discrepancy in a front position forecast between GSM and MSM
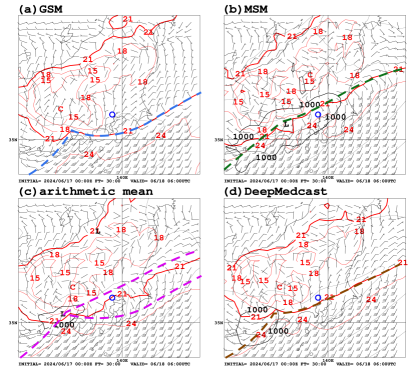
The second case study examines a forecast where there was a positional discrepancy in the predicted location of a front between GSM and MSM. Figure 6 shows the predictions at FT = 30 hours based on the initial time of 00 UTC on 17 June 2024. At the initial time, a stationary front was located south of Japan (not shown), and by FT = 30 hours, the front was predicted to move northward toward Tokyo (indicated by the blue circles in the figure).
GSM predicted the front to the south of Tokyo, indicated by the blue dashed line, with a clear wind direction and speed shear, which corresponds well with the 21∘C isotherm around Tokyo (Fig. 6a). In contrast, MSM placed the front north of Tokyo (green dashed line), also with a clear wind direction and speed shear aligned with the 21∘C isotherm (Fig. 6b), resulting in a positional discrepancy between the two NWP models. Consequently, GSM predicted a northerly to northeasterly wind and cooler temperatures around Tokyo, while MSM predicted southerly to southwesterly winds and warmer temperatures, leading to significant differences in the forecast for Tokyo.
The arithmetic mean of the GSM and MSM predictions (Fig. 6c) results in a split structure for the front, with wind shear corresponding to the locations predicted by GSM and MSM (shown by the purple lines), while the 21∘C isotherm is predicted between the two fronts. This demonstrates that when there is a discrepancy in the predicted front position, simple averaging of the atmospheric fields leads to an unnatural and unexplainable forecast that cannot maintain the original front structure. In contrast, DeepMedcast (Fig. 6d) generates a clear wind direction and speed shear at the intermediate position between the GSM and MSM predictions (indicated by the brown dashed line), which corresponds well with the 21∘C isotherm. DeepMedcast successfully produces an explainable and consistent intermediate forecast while preserving the structure of the original front.
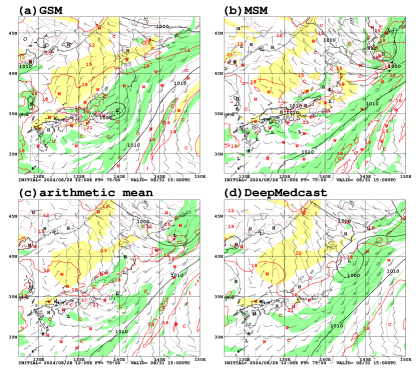
3.3 Case 3: Significant difference in low-pressure system position between GSM and MSM
The third case study highlights a situation where there was a large difference in the predicted position of a low-pressure system between GSM and MSM. Figure 7 shows surface wind and mean sea-level pressure, along with temperature and dew-point depression at 850 hPa, at FT = 75 hours based on the initial time of 12 UTC on 28 August 2024. At the initial time, Typhoon SHANSHAN was located south of Kyushu at 30.6∘N, 130.2∘E, slowly moving northward (not shown). By 15 UTC on 31 August (FT = 75 hours), the system, which had either remained a tropical storm or transitioned into a low-pressure system, was predicted by GSM to be south of the Kanto region at 35.4∘N, 139.8∘E (Fig. 7a), while MSM placed it east of Hokkaido at 42.4∘N, 147.3∘E (Fig. 7b).
This case highlights a large positional difference of about 1000 km between the GSM and MSM predictions. When the arithmetic mean of these is taken (Fig. 7c), it results in two distinct low-pressure systems at the positions predicted by each model, creating an unexplainable forecast. In contrast, DeepMedcast predicted a single low-pressure system located between the two forecasts, at 39.5∘N, 143.0∘E, off the coast of Sanriku (Fig. 7d). Additionally, when examining the moisture area at 850 hPa (dew-point depression < 3∘C), the arithmetic mean shows moist areas surrounding both the GSM and MSM low-pressure systems, with a relatively dry region in between. On the other hand, DeepMedcast represents a moist area around its low-pressure system, consistent with the surface pressure field, providing a consistent and explainable forecast.
3.4 Case 4: Intermediate forecast between four NWP models for typhoon KHANUN
The fourth case study presents an intermediate forecast between four NWP models: GSM, IFS, GraphCast, and Pangu-Weather. Figure 8 shows surface wind and mean sea-level pressure at FT = 108 hours, based on the initial time of 12 UTC on 2 August 2023. At the initial time, Typhoon KHANUN was located west of Okinawa at 26.2∘N, 125.6∘E, slowly moving westward (not shown). By 00 UTC on 7 August (FT = 108 hours), the central position was predicted by the four models to be at 31.4∘N, 131.1∘E (GSM), 28.9∘N, 133.0∘E (IFS), 28.0∘N, 131.2∘E (GraphCast), and 28.8∘N, 130.7∘E (Pangu-Weather). The central pressure and maximum wind speed for each model were as follows: 938 hPa and 68 kt (GSM), 966 hPa and 51 kt (IFS), 977 hPa and 36 kt (GraphCast), and 975 hPa and 39 kt (Pangu-Weather) (Figs. 8a–d).
When the arithmetic mean of the four models is taken, the center splits into two, with a weakened central pressure of 979 hPa and the maximum wind speed of 36 kt (Fig. 8e), both the same or weaker than the predictions of any individual model. In contrast, DeepMedcast predicted a single center at 29.3∘N, 131.4∘E, with the central pressure of 963 hPa and the maximum wind speed of 42 kt (Fig. 8f), representing an intermediate intensity forecast between the four NWP models. The average central pressure of the four NWP models was 964 hPa, closely matching DeepMedcast’s prediction. The average maximum wind speed of the four models was 49 kt, meaning DeepMedcast’s forecast was slightly weaker than the average.
4 Discussion
As demonstrated by the case studies in Section 3, DeepMedcast is capable of generating plausible and explainable intermediate forecast, or medcast. A notable feature of DeepMedcast is that, despite being trained solely on GSM data, it works effectively with other models such as MSM, IFS, GraphCast, and Pangu-Weather. This is significant because most AI or machine learning (ML) methods in meteorology learn the relationship between input and target data, and when the characteristics of the input data change due to NWP model updates, retraining, fine-tuning, and/or online learning are usually required. While this is an unavoidable task for most AI or ML methods in meteorology, it is a time-consuming yet essential task that operational centers have traditionally managed. However, DeepMedcast can generate plausible medcasts without updating the DNN model since it is not designed to correct NWP model biases, which significantly reduces the maintenance costs for operational centers.
Another advantage of DeepMedcast is its flexibility in increasing the amount of training data. As mentioned in Section 2, this study used t = 9–14 and t = ±3, ±6, and in our experience, increasing t and t leads to better forecast representation. One common issue in training DNN models is a lack of sufficient training data (e.g., Deng et al. (2009); LeCun et al. (2015)). However, in the case of DeepMedcast, more training data can easily be generated by increasing t and t or by adding additional NWP models. It is important to note, though, that increasing t and t requires more memory and computational time, which should be considered when expanding the dataset.
A third benefit of DeepMedcast is its ability to provide predictions consistent with TC track forecasts. Currently, at JMA, TC track forecasts take precedence, and the forecasters responsible for general, marine, and aviation forecasts must ensure that their forecasts are consistent with the TC track forecasts. However, up until now, there is no NWP model consistent with the TC track forecasts, forecasters need to adjust the existing NWP outputs in their minds to construct forecast scenarios that align with the TC track forecasts. DeepMedcast has a capability to provide NWP outputs that align with TC track forecasts, which could greatly improve the efficiency and standardization of tasks for operational forecasting.
Additionally, DeepMedcast can provide more accurate forecasts than the input models. By predicting the intermediate state between multiple NWP models, DeepMedcast can reduce random errors inherent in each NWP model, similar to the consensus forecasting used for typhoon tracks and other ensemble post-processing methods like IMPROVER, NBM, and MOSMIX. Numerical weather predictions and their post-processing are the foundation for issuing weather forecasts, warnings, and advisories, therefore NWP centers are continually working to improve forecast accuracy. Recently, AI-driven NWP models have emerged with accuracy that partially surpass traditional physics-based NWP models. While it is expected that more advanced physical and AI-based models will be developed in the future, DeepMedcast can integrate these models as inputs and further enhance forecast accuracy.
Another innovative contribution of DeepMedcast is the introduction of the concept of medcast. In traditional numerical weather prediction, the analysis or forecast at FT = t is used as input to predict the state at FT = t + t, and by repeating this process, predictions for any future time can be generated. In contrast, DeepMedcast uses inputs at FT = t and FT = t + 2t to predict the state at FT = t + t. By repeating this step, DeepMedcast can generate finer intermediate states. Not only can DeepMedcast produce intermediate forecasts between two or more NWP model outputs, but it can also effectively increase the temporal resolution of predictions and analyses. In this sense, medcast can be considered a new form of prediction alongside forecast, nowcast, and hindcast.
5 Summary
In this paper, we introduced DeepMedcast, a novel approach for producing intermediate forecast, or "medcast", between two or more NWP models. DeepMedcast was developed to generate accurate and explainable medcast, bridging the gap between NWP model outputs.
A key advantage of DeepMedcast is its applicability to any NWP outputs without the need for retraining or fine-tuning the DNN. By providing reliable medcasts, DeepMedcast can significantly enhance the efficiency and standardization of operational forecasting tasks, including general, marine, and aviation forecasts.
Furthermore, the introduction of the medcast concept offers a new form of prediction, standing alongside forecast, nowcast, and hindcast. Medcast not only generates intermediate forecasts but also provides a new approach to combining multiple NWP outputs, making it a valuable tool in modern meteorology.
Although DeepMedcast introduces some advancements, further research and development are needed to address several challenges. In this study, U-Net was employed as the DNN architecture; however, advanced methods such as Transformers (Vaswani et al., 2017; Dosovitskiy et al., 2020) and Diffusion models (Song and Ermon, 2019; Ho et al., 2020) may further enhance DeepMedcast’s representational capabilities. As shown in the case study in Section 3.4, the current method tends to slightly underestimate the maximum wind speed near TCs. Enhancing the DNN could help resolve this issue. Additionally, by developing post-processing methods that use DeepMedcast as input, it would be possible to provide even more accurate predictions with consistency. Lastly, this study did not address intermediate precipitation forecasts. Since precipitation is one of the most critical variables in weather forecasting, future work will focus on developing intermediate precipitation forecasts.
Data Availability Statement
The datasets used in this study are available from the following sources: The GSM and MSM data are operationally produced by JMA and can be accessed through the Japan Meteorological Business Support Center (http://www.jmbsc.or.jp/en/index-e.html). The IFS data are accessible to WMO members via the ECMWF website (https://www.ecmwf.int/en/forecasts/datasets/wmo-additional). The GraphCast and Pangu-Weather source code and plugins are available under open-source licenses in the ECMWF GitHub repository (https://github.com/ecmwf-lab/ai-models). Pre-trained models of Pangu-Weather and GraphCast, used without modification to generate forecast data, are specifically accessible at https://github.com/ecmwf-lab/ai-models-panguweather and https://github.com/ecmwf-lab/ai-models-graphcast.
Acknowledgements
We acknowledge ECMWF for providing IFS data available to WMO members through their website (https://www.ecmwf.int/en/forecasts/datasets/wmo-additional). Additionally, we are grateful for the availability of GraphCast and Pangu-Weather and extend our thanks to their respective developers. GraphCast and Pangu-Weather were used without modification to generate forecast data and are accessible via the ECMWF AI GitHub repository (https://github.com/ecmwf-lab/ai-models), supported by ECMWF.
References
- Bi et al. [2022] Bi,K.,L. Xie,H.Zhang, X.Chen, X.Gu, and Q.Tian, 2022: Pangu-Weather: A 3D High-Resolution System for Fast and Accurate Global Weather Forecast. arXiv preprint arXv:2211.02556.
- Bi et al. [2023] Bi, K., L. Xie, H. Zhang, X. Chen, X. Gu, and Q. Tina, 2023: Accurate medium-range global weather forecasting with 3D neural networks. Nature, 619 533–538. doi:10.1038/s41586-023-06185-3.
- Bodnar et al. [2024] Bodnar, C., W. P. Bruinsma, A. Lucic, M. Stanley, J. Brandstetter, P. Garvan, M. Riechert, J. Weyn, H. Dong, A. Vaughan, J. K. Gupta, K. Tambiratnam, A. Archibald, E. Heider, M. Welling, R. E. Turner, P. Perdikaris, 2024: Aurora: A Foundation Model of the Atmosphere. arXiv preprint arXiv:2405.13063.
- Bonev et al. [2023] Bonev, B., T. Kurth, C. Hundt, J. Pathak, M. Baust, K. Kashinath, A. Anandkumar, 2023: Spherical Fourier Neural Operators: Learning Stable Dynamics on the Sphere. arXiv preprint arXiv:2306.03838.
- Brown et al. [2012] Brown, A., S. Milton, M. Cullen, B. M. J. Golding, and A. Shelly, 2012: Unified modeling and prediction of weather and climate: a 25 year journey. Bull. Amer. Meteor. Soc., 93, 1865–1877.
- Cangialosi et al. [2023] Cangialosi, J., B.J. Reinhart, and J. Martinez, 2023: National Hurricane Center verification report, 2023 Hurricane Season. Natinal Hurricane Center, 81pp. [Available at https://www.nhc.noaa.gov/verification/pdfs/Verification_2023.pdf.]
- Chen et al. [2023] Chen, K., T. Han, J. Gong, L. Bai, F. Ling, J. Luo, X. Chen, L. Ma, T. Zhang, R. Su, Y. Ci, B. Li, X. Yang, and W. Ouyang, 2023: FengWu: Pushing the Skillful Global Medium-range Weather Forecast beyond 10 Days Lead. arXiv preprint arXiv:2304.02948.
- Deng et al. [2009] Deng, J., W. Dong, R. Socher, L. Li, K. Li, and L. Fei-Fei, 2009: ImageNet: A large-scale hierarchical image database. IEEE Conference on Computer Vision and Pattern Recognition, 248–255.
- Dosovitskiy et al. [2020] Dosovitskiy, A., L. Beyer, A. Kolesnikov, D. Weissenborn, X. Zhai, T. Unterthiner, M. Dehghani, M. Minderer, G. Heigold, S. Gelly, J. Uszkoreit, and N. Houlsby, 2020: An Image is Worth 16x16 Words: Transformers for Image Recognition at Scale. arXiv preprint arXiv:2010.11929.
- Dowell et al. [2022] Dowell, D. C., C. R. Alexander, E. P. James, S. S. Weygandt, S. G. Benjamin, G. S. Manikin, B. T. Blake, J. M. Brown, J. B. Olson, M. Hu, T. G. Smirnova, T. Ladwig, J. S. Kenyon, R. Ahmadov, D. D. Turner, J. D. Duda, T. I. Alcott, 2022: The High-Resolution Rapid Refresh (HRRR): An hourly updating convection-allowing forecast model. Part I: Motivation and system description. Wea. Forecasting, 37, 1371–1395, doi:10.1175/WAF-D-21-0151.1.
- ECMWF [2024] ECMWF, 2024: IFS Documentation. European Centre for Medium-Range Weather Forecasts. [Available at https://www.ecmwf.int/en/publications/ifs-documentation.]
- Gopalakrishnan et al. [2011] Gopalakrishnan, S. G., F. Marks Jr., X. Zhang, J.-W. Bao, K.-S. Yeh, and R. Atlas, 2011: The experimental HWRF system: A study on the influence of horizontal resolution on the structure and intensity changes in tropical cyclones using an idealized framework. Mon. Wea. Rev., 139, 1762–1784.
- Hagelin et al. [2017] Hagelin, S., J. Son, R. Swinbank, A. McCabe, N. Roberts, and W. Tennant, 2017: The Met Office convective-scale ensemble, MOGREPS-UK. Quart. J. Roy. Meteor. Soc., 143, 2846–2861.
- Hamill et al. [2017] Hamill, T. M., E. Engle, D. Myrick, M. Peroutka, C. Finan, and M. Scheuerer, 2017: The U.S. National Blend of Models for Statistical Postprocessing of Probability of Precipitation and Deterministic Precipitation Amount. Mon. Wea. Rev., 145, 3441–3463.
- Han et al. [2024] Han T., S. Guo, F. Ling, K. Chen, J. Gong, J. Luo, J. Gu, K. Dai, W. Ouyang, L. Bai, 2024: FengWu-GHR: Learning the Kilometer-scale Medium-range Global Weather Forecasting. arXiv preprint arXiv:2402.00059.
- Ho et al. [2020] Ho, J., A. Jain, and P. Abbeel, 2020: Denoising Diffusion Probabilistic Models. arXiv preprint arXiv:2006.11239.
- ICAO [2016] ICAO, 2016: Guidance on the harmonized WAFS grids for Cumulonimbus cloud, icing and turbulence forecasts (version 2.6). International Civil Aviation Organization, 16pp. [Available at https://www.icao.int/airnavigation/METP/MOG%20WAFS%20Reference%20Documents/WAFS_HazardGridUserGuide.pdf.]
- Inverarity et al. [2023] Inverarity, G. W., W. J. Tennant, L. Anton, N. E. Bowler, A. M. Clayton, M. Jardak, A. C. Lorence, F. Rawlins, S. A. Thompson, M. S. Thurlow, D. N. Walters, and M. A. Wlasak, 2023: Met Office MOGREPS-G initialisation using an ensemble of hybrid four-dimensional ensemble variational (En-4DEnVar) data assimilations. Quart. J. Roy. Meteor. Soc., 149, 1138–1164.
- JMA [2018] JMA, 2018: Instruction for guidance. Report of Numerical Prediction Division, 64, 248 pp (in Japanese). [Available at https://www.jma.go.jp/jma/kishou/books/nwpreport/64/No64_all.pdf.]
- JMA [2022] JMA, 2022: Annual Report on the Activities of the RSMC Tokyo - Typhoon Center 2022. Japan Meteorological Agency, 143pp. [Available at https://www.jma.go.jp/jma/jma-eng/jma-center/rsmc-hp-pub-eg/AnnualReport/2022/Text/Text2022.pdf.]
- JMA [2024] JMA, 2024: Outline of the operational numerical weather prediction at the Japan Meteorological Agency. Japan Meteorological Agency, 262pp. [Available at https://www.jma.go.jp/jma/jma-eng/jma-center/nwp/outline-latest-nwp/index.htm.]
- Kingma and Ba [2014] Kingma, D. P., and J. Ba, 2014: Adam: A Method for Stochastic Optimization. arXiv preprint arXiv:1412.6980.
- Lam et al. [2022] Lam, R., A. Sanchez-Gonzalez, M. Willson, P. Wirnsberger, M. Fortunato, F. Alet, S. Ravuri, T. Ewalds, Z. Eaton-Rosen, W. Hu, A. Merose, S. Hoyer, G. Holland, O. Vinyals, J. Stott, A. Pritzel, S. Mohamed and P. Battaglia, 2022: GraphCast: Learning skillful medium-range global weather forecasting. arXiv preprint arXiv:2212.12794.
- Lang et al. [2024] Lang, S., M. Alexe, M. Chantry, J. Dramsch, F. Pinault, B. Raoult, M. C. A. Clare, C. Lessig, M. Maier-Gerber, L. Magnusson, Z. B. Boualléue, A. P. Nemesio, P. D. Dueben, A. Brown, F. Pappenberger, F. Rabier, 2024: AIFS — ECMWF’s data-driven forecasting system. arXiv preprint arXiv:2406.01465.
- LeCun et al. [2015] LeCun, Y., Y. Bengio, and G. Hinton, 2015: Deep learning. Nature, 521, 436–444.
- Nair and Hinton [2010] Nair, V., and G. E. Hinton, 2010: Rectified linear units improve restricted Boltzmann machines. Proceedings of the Twenty-seventh International Conference on Machine Learning (ICML-10), Haifa, Israel, 807–814.
- NCEP [2016] NCEP, 2016: Global Forecast System - Global Spectral Model (GSM) - v13.0.2. [Available at https://vlab.noaa.gov/web/gfs/documentation.]
- Nishimura and Fukuda [2019] Nishimura, S., and J. Fukuda, 2019: Advancement of Tropical Cyclone Track Forecasts. Yohou Gijutsu Kenshu Text, 24, 114–141 (in Japanese). [Available at https://www.jma.go.jp/jma/kishou/books/yohkens/24/all.pdf.]
- Pathak et al. [2022] Pathak, J., S. Subramanian, P. Harrington, S. Raja, A. Chattopadhyay, M. Mardani, T. Kurth, D. Hall, Z. Li, K. Azizzadenesheli, P. Hassanzadeh, K. Kashinath, and A. Anandkumar, 2022: FourCastNet: A Global Data-driven High-resolution Weather Model using Adaptive Fourier Neural Operators. arXiv preprint arXiv:2202.11214.
- Price et al. [2023] Price, I., A. Sanchez-Gonzalez, F. Alet, T. R. Andersson, A. El-Kadi, D. Masters, T. Ewalds, J. Stott, S. Mohamed, P. Battaglia, R. Lam, M. Willson, 2023: GenCast: Diffusion-based ensemble forecasting for medium-range weather. arXiv preprint arXiv:2312.15796.
- Primo et al. [2024] Primo, C., B. Schulz, S. Lerch, and R. Hess, 2024: Comparison of Model Output Statistics and Neural Networks to Postprocess Wind Gusts. arXiv preprint arXiv:2401.11896.
- Roberts el al. [2023] Roberts, N., A. Benjamin, E. Gavin, M. Stephen, R. Fiona, S. Caroline, T. Tomasz, A. Paul, B, Laurence. C. Neil, F. Ben, F. Jonathan, G. Tom, H. Leigh, H. Aaron, H. Katharine, J. Simon, J. Caroline, M. Ken, S. Christopher, S. Michael, W. Bruce, B. Simon, B. Mark, B. Daniel, B. Anna, B. Clare, C. Robert, C. Sean, C. Ric, H. Roger, H. Kathryn, H. Teresa, M. Marion, P. Jon, P. Tim, S. Victoria, S. Eleanor, and W. Mark, 2023: IMPROVER: The New Probabilistic Postprocessing System at the Met Office. Bull Amer. Meteor. Soc., 104, E680–E697.
- Ronneberger et al. [2015] Ronneberger, O., P. Fischer, and T. Brox, 2015: U-Net: Convolutional Networks for Biomedical Image Segmentation. arXiv preprint arXiv:1505.04597.
- Simon et al. [2018] Simon, A., A. B. Penny, M. DeMaria, J. L. Franklin, R. J. Pasch, E. N. Rappaport, and D. A. Zelinsky, 2018: A description of the real-time HFIP Corrected Consensus Approach (HCCA) for Tropical Cyclone Track and Intensity Guidance. Wea. Forecasting, 33, 37–57, doi:10.1175/WAF-D-17-0068.1.
- Song and Ermon [2019] Song, Y. and S. Ermon, 2019: Generative Modeling by Estimating Gradients of the Data Distribution. arXiv preprint arXiv:1907.05600.
- Vannitsem el al. [2021] Vannitsem, S., J. B. Bremnes, J. Demaeyer, G. Evans, J. Flowerdew, S. Hemri, S. Lerch, N. Roberts, S. Theis, A. Atencia, Z. B. Bouallégue, J. Bhend, M. Dabernig, L. D. Cruz, L. Hieta, O. Mestre, L. Moret, I. O. Plenkovic, M. Schmeits, J. Ylhäisi, 2021: Statistical Postprocessing for Weather Forecasts: Review, Challenges, and Avenues in a Big Data World. Bull Amer. Meteor. Soc., 102, E681–E699.
- Vaswani et al. [2017] Vaswani, A., N. Shazeer, N. Parmar, J. Uszkoreit, L. Jones, A. N. Gomez, L. Kaiser, and I. Polosukhin 2017: Attention Is All You Need, arXiv preprint arXiv:1706.03762.
- Vislocky and Fritsch [1997] Vislocky, R. L., and J. M. Fritsch, 1997: Performance of an advanced MOS system in the 1996–97 National Collegiate Weather Forecasting Contest. Bull. Amer. Meteor. Soc., 78, 2851–2857.
- WMO [2013] WMO, 2013: Cascading Process to Improve Forecasting and Warning Services. Bulletin nº, 62, 11–15. [Available at https://public.wmo.int/en/resources/bulletin/cascading-process-improve-forecasting-and-warning-services.]