Community Fact-Checks Trigger Moral Outrage in Replies to Misleading Posts on Social Media
Abstract.
Displaying community fact-checks is a promising approach to reduce engagement with misinformation on social media. However, how users respond to misleading content emotionally after community fact-checks are displayed on posts is unclear. Here, we employ quasi-experimental methods to causally analyze changes in sentiments and (moral) emotions in replies to misleading posts following the display of community fact-checks. Our evaluation is based on a large-scale panel dataset comprising replies across source posts from X’s Community Notes platform. We find that informing users about falsehoods through community fact-checks significantly increases negativity (by 7.3%), anger (by 13.2%), disgust (by 4.7%), and moral outrage (by 16.0%) in the corresponding replies. These results indicate that users perceive spreading misinformation as a violation of social norms and that those who spread misinformation should expect negative reactions once their content is debunked. We derive important implications for the design of community-based fact-checking systems.
1. Introduction
Social media platforms like X (formerly Twitter), Facebook, and TikTok have become increasingly influential sources for news consumption and social engagement, especially among younger generations (Van Bavel et al., 2024; Deloitte, 2021). However, the fast-paced and interactive nature of social media has also compromised the quality of the information shared, as content can be posted rapidly without undergoing the thorough fact-checking essential to journalistic ethics (of Professional Journalists, 2014). As a result, misinformation spreads easily on social media platforms and has become a concerning issue in the digital age (Lazer et al., 2018; Vosoughi et al., 2018; Forum, 2024). The negative effects of user engagement with online misinformation have been repeatedly observed across various domains (Ecker et al., 2022; Allcott and Gentzkow, 2017; Enders et al., 2022; Green et al., 2022; Pierri et al., 2022; Ecker et al., 2024). For instance, political misinformation is especially troubling, as engagement with false information during elections can undermine democracy and destabilize societies (Ecker et al., 2024; Aral and Eckles, 2019; Vosoughi et al., 2018; Green et al., 2022). Given the significant risks and threats posed by online misinformation, social media providers are thus urged to establish content moderation policies and implement effective interventions to identify misinformation and inform users on their platforms (Donovan, 2020; Lazer et al., 2018).
As a countermeasure, the social media platform X/Twitter has recently adopted a crowdsourced (community-based) fact-checking approach, “Community Notes,” to fact-check misleading posts and communicate veracity to users on its platform. “Community Notes” represents the first attempt by a major social media platform to apply a crowdsourced approach to fact-checking on a large scale. It allows users to add context or correct information to posts via community notes, providing additional perspectives or clarifications. Once community notes are rated helpful by other community contributors, they will be directly displayed on the corresponding misleading posts. While the accuracy of crowdsourced fact-checking approaches has been thoroughly validated by previous research (Bhuiyan et al., 2020; Epstein et al., 2020; Pennycook and Rand, 2019; Saeed et al., 2022), a causal understanding of how users react to social media content that has been subject to community-based fact-checking is still in its infancy.
Previous research studying the effect of community fact-checks on social media users has primarily focused on analyzing how it affects engagement with misinformation (e. g., shares, comments, or likes) (Chuai et al., 2024b; Drolsbach et al., 2024; Chuai et al., 2024a). For instance, studies have shown that community notes can reduce users’ belief in false content and their intentions to share misleading posts (Chuai et al., 2024a; Drolsbach and Pröllochs, 2023). However, little is known about how social media users emotionally react to social media posts that have been subject to fact-checking. Emotions are highly influential for human decision-making and judgment (Lerner et al., 2015). It is thus conceivable that fact-checking social media posts triggers emotional backlash towards the authors of such content. For example, users may feel a sense of urgency to correct the record or call out the spreaders of misinformation. In this scenario, the debunking of misinformation via community notes might provoke strong emotional reactions (e. g., negative sentiment, anger, disgust) from social media users. Note that such emotional backlash from the user base may be seen as a double-edged sword. On the one hand, it can be regarded as a desirable reaction in the fight against misinformation as it may signal to the content creator and other users that spreading misinformation is unacceptable and subject to public scrutiny. Also, collective emotional backlash may help pressure authors to correct or delete misleading content and discourage others from sharing or engaging with it. On the other hand, however, social media platforms also need to maintain a healthy and constructive dialogue. In this regard, the emotional reactions from the user base pose risks of fueling political polarization, escalating conflicts, and entrenching divisions. Yet, empirical evidence on how fact-checking emotionally resonates with the audience on social media is missing.
Furthermore, fact-checking social media posts may trigger pronounced moral reactions from the user base. Content moderation of online speech is a moral minefield, especially when two key values come into conflict: upholding freedom of expression and preventing harm caused by the violation of social norms and spreading misinformation (Kozyreva et al., 2023). From a theoretical perspective, spreading online misinformation may be perceived as immoral behaviour, motivating users’ moral reasoning and judgement and triggering their moral emotions (Neumann and Rhodes, 2024). Previous work has identified the phenomenon of moral outrage, which occurs when individuals perceive the actions of another person or an entire situation as a serious violation of their moral principles or ethical standards. Moral outrage is commonly associated with a higher likelihood of inter-group hostility and can contribute to the further escalation of conflicts on the platforms (Crockett, 2017; Neumann and Rhodes, 2024; Van Bavel et al., 2024). Emotionally, this often results in a combination of anger and disgust, prompting individuals to express these emotions in an attempt to restore what they perceive as the proper moral norm (Salerno and Peter-Hagene, 2013). This response typically involves blaming the violator and demanding corrective actions (Van Bavel et al., 2024; Neumann and Rhodes, 2024). Based on this rationale, we hypothesize that social media users might react with expressions of moral outrage to misleading posts and their authors once they are informed about the falsehoods via community notes.
Research questions: In this study, we causally analyze whether the display of community notes changes expressions of sentiments and (moral) emotions in social media users’ replies to misleading posts. Specifically, we address two main research questions. Our first research question is to examine the effects of community notes on sentiments and basic emotions in replies (RQ 1.1). Previous research further suggests that emotions may play a particularly pronounced role in the context of political (mis-)information (Brady et al., 2017; Rathje et al., 2021). We thus additionally analyze how the emotional reactions differ across misleading posts that cover a political vs. a non-political topic (RQ1.2):
-
•
RQ1.1: Which sentiments (positivity, negativity) and basic emotions (e. g., anger, disgust) in replies to misleading posts are triggered by the display of community notes?
-
•
RQ1.2: Do the effects of community notes on sentiments and basic emotions in replies differ across political and non-political misleading posts?
Furthermore, when anger and disgust are mixed, they generate “moral outrage,” a more intense emotional reaction to perceived moral transgressions than either anger or disgust alone (Salerno and Peter-Hagene, 2013; Crockett, 2017; Brady et al., 2021). Our second research question is to examine whether community notes trigger moral outrage in replies (RQ2.1), and analyze the sensitivity across political and non-political misleading posts (RQ2.2):
-
•
RQ2.1: Does the display of community notes trigger moral outrage in replies to misleading posts?
-
•
RQ2.2: Do the effects of community notes on moral outrage in replies differ across political and non-political misleading posts?
Data & methods: To address our research questions, we collect a dataset of replies to misleading posts that have been fact-checked via community notes over a 4-month period since the roll-out of “Community Notes” feature on X/Twitter. The dataset includes all the replies that are directly toward misleading posts before and after the display of community notes. Subsequently, we employ methods from Natural Language Processing (NLP) in combination with Regression Discontinuity Design (RDD) to estimate the causal effects of community notes on the sentiments and (moral) emotions in the replies to the fact-checked posts.
Contributions: To the best of our knowledge, this study is the first to causally analyze the emotional reactions of social media users in response to (community) fact-checks. We find that informing users about falsehoods through the display of community fact-checks significantly increases the expression of negativity in the corresponding replies by 7.3%. Furthermore, we provide a fine-granular analysis of emotions. Here, the largest effect sizes are observed for (negative) emotions from the moral emotions family. Specifically, displaying community notes increases anger in the corresponding replies by 13.2%, disgust by 4.7%, and moral outrage by 16.0%. The observed effects are significantly more pronounced for political vs. non-political posts. Overall, these results imply that social media users perceive misinformation as moral transgressions and that authors of misinformation should expect negative reactions once their content is debunked. Based on our findings, we derive important implications for behavioral theory, media literacy, and the design of community-based fact-checking systems on social media.
2. Background and Related Work
2.1. Misinformation on Social Media
Social media platforms, as a source for news consumption and social engagement, have become increasingly popular. As of July 2024, there is a large population base of 5.17 billion users on social media, and the number continues to grow (Van Bavel et al., 2024; Statista, 2024). Especially among younger users aged 18 to 24, up to 65% prefer social media as one of their preferred news sources (Deloitte, 2021). Together, these data indicate a trend toward partially substituting traditional media with social media channels that provide fast access to information (Brannon and Roy, 2024) and offer a more interactive way to engage with content (Sang et al., 2020).
Due to the lack of editorial oversight, social media platforms have also become fertile soil for spreading misinformation. Recently, there have been some critics arguing that the prevalence of misinformation on social media is overestimated, and the exposure is concentrated among narrow fringe groups (Altay et al., 2023; Budak et al., 2024). However, given the large population base on social media platforms, its negative effects can be profound. For example, the spread of online health misinformation has posed severe risks to public health in both the Global North and the Global South (Pierri et al., 2022; Enders et al., 2022; Varanasi et al., 2022; Karusala and Anderson, 2022). Additionally, the rise of AI makes generating misinformation faster, which poses new challenges and further undermines the credibility of social media (Zhou et al., 2023; Gamage et al., 2022; Zhang et al., 2023; Feuerriegel et al., 2023).
The spread of political misinformation on social media: Political misinformation has been found to spread significantly faster than non-political misinformation on social media (Vosoughi et al., 2018). The spread of political misinformation on social media has become a tool to pursue political agenda, and its negative effects are continually observed in threatening the stability of societies and eroding trust in democracy (Allcott and Gentzkow, 2017; Ecker et al., 2022, 2024). For example, conspiracy theories claiming that the 2020 U.S. presidential election was “stolen” were widely shared on social media. It is found that users who were exposed to at least one misinformation website are 17.3% more likely to believe that the election was fraudulent (Dahlke and Hancock, 2024). As surveyed, almost 40% of the U.S. public and, especially, almost 70% of Republicans negated the legitimacy of the 2020 presidential election outcome (SSRS, 2023). The reduced faith in electoral institutions have had real-world consequences in affecting voters’ behaviors in subsequent elections and hate campaigns (Green et al., 2022; Ecker et al., 2024). Similar patterns have been observed in countries of the Global South, such as in Brazil (Recuero et al., 2020; Haque et al., 2020). Moreover, political misinformation is often interconnected with the politicization of other social issues, such as health crises and climate change, further contributing to polarized attitudes toward these topics (Hart et al., 2020; Chuai et al., 2023, 2024c).
Altogether, with the increasing use of social media for news consumption and the continuously observed negative effects of misinformation across various domains, the spread of misinformation on social media has become a significant societal issue in the digital age (Vosoughi et al., 2018; Van Bavel et al., 2024). To protect users from being affected by misinformation and prevent harm, it is both warranted and required to implement effective countermeasures to fight against its spread (Aral and Eckles, 2019; Ecker et al., 2024).
2.2. Content Moderation for Misinformation
Social media providers are increasingly urged to establish content moderation policies to regulate online behavior and combat the spread of misinformation on their platforms (Donovan, 2020; Lazer et al., 2018). The content moderation process includes two main aspects: fact-checking misinformation and handling identified misinformation.
To identify misinformation, social media platforms are widely collaborating with professional third-party fact-checkers (e. g., the International Fact-Checking Network) (Meta, 2024). While fact-checking experts can accurately access veracity (Micallef et al., 2022; Lee et al., 2023), the implementation of this approach faces two main challenges. First, professional fact-checking is a lengthy and resource-consuming process, leading to a situation where only a small proportion of posts are actually checked (Micallef et al., 2022; Wilner et al., 2023; McClure Haughey et al., 2022). Second, professional fact-checkers face suspicions of (political) bias, e. g., by selectively fact-checking content (Chuai et al., 2023; Tang et al., 2024). Therefore, the trust of the public in professional fact-checking is discounted (Chuai et al., 2024a; Drolsbach et al., 2024; Flamini, 2019). To overcome these challenges, researchers have proposed to fact-check and identify misleading posts on social media platforms at scale based on the non-expert fact-checkers from the crowd (Allen et al., 2021; Micallef et al., 2020; Pennycook and Rand, 2019). While the individual assessments can have bias and noise (Allen et al., 2022), it has been shown that the accuracy of aggregated judgments, even from relatively small crowds, is reliable and comparable to the accuracy of expert fact-checkers (Bhuiyan et al., 2020; Epstein et al., 2020; Pennycook and Rand, 2019; Saeed et al., 2022). Additionally, the crowdsourced assessments are perceived as more trustworthy by the users than fact-checks from experts (Allen et al., 2021; Zhang et al., 2024; Drolsbach et al., 2024).
Subsequently, social media platforms generally have three options for handling identified misleading posts: removing them, reducing their visibility, or informing users about the falsehoods (Meta, 2024; Juneja et al., 2023; Wojcik et al., 2022). The first two options – removal and visibility reduction – are forms of “hard moderation,” where the platforms limit or entirely cut off the spread of misinformation. In contrast, informing other users that a post is misleading represents “soft moderation,” where the platforms refrain from imposing direct controls and instead allow users to make their own decisions on how they process the informed misleading post. The hard moderation approaches face a dilemma, where the two key values of protecting freedom of expression and preventing harm from the spread of misinformation come into conflict (Kozyreva et al., 2023; Schaffner et al., 2024). Given this, soft moderation approaches can be regarded as a trade-off between freedom of expression and misinformation intervention. Previous lab/survey experiments consistently show that communicating the falsehood to users (especially with explanations) is effective in reducing users’ beliefs and sharing intentions (Clayton et al., 2020; Yaqub et al., 2020; Porter and Wood, 2021; Zhang et al., 2024; Heuer and Glassman, 2022; Jahanbakhsh and Karger, 2024; Allen et al., 2021; Hassoun et al., 2023).
2.3. Sentiments, Basic Emotions, and Moral Outrage on Social Media
As an essential element of human communication, sentiments and emotions play a pivotal role in shaping interactions on social media platforms (Lerner et al., 2015; Stieglitz and Dang-Xuan, 2013; Berger and Milkman, 2012). They can be understood as two affective dimensions: valence (sentiment) and arousal (emotion). Sentiment, i. e., the valence of content (positive vs. negative), is an attitude, thought, or judgement promoted by a feeling (Yadollahi et al., 2017). Research has shown that negativity is a particularly significant characteristic of online engagement (Zollo et al., 2015; Del Vicario et al., 2016; Robertson et al., 2023). Negative sentiment tends to evoke stronger reactions, promoting users to comment and share online posts, especially among polarized communities (Zollo et al., 2015; Del Vicario et al., 2016).
The relationship between sentiments and social interaction is more nuanced than simply the valence (positive vs. negative) of the content alone. From the arousal dimension, specific emotions (i. e., affect ladenness) are embedded within the content, adding intensity to the positive or negative feelings expressed (Pang et al., 2008; Yadollahi et al., 2017). With various models classifying basic emotions, Ekman’s six basic emotion model is widely used and commonly shared across other frameworks (Yadollahi et al., 2017). Specifically, Ekman’s model identifies six universal emotions: anger, disgust, fear, joy, sadness, and surprise (Ekman, 1992; Sauter et al., 2010; Ekman et al., 2013). These emotions are considered fundamental across different cultures and can combine to form more complex emotional experiences (Sauter et al., 2010). Emotions also vary on the level of physiological arousal or activation they evoke (Berger and Milkman, 2012). For example, anger and sadness are often expressed as negative emotions. However, anger is a state of heightened arousal and makes online content more viral, while sadness is low arousal and makes online content less viral (Berger and Milkman, 2012; Chuai et al., 2022). Particularly, users’ reliance on emotions can promote their belief in misinformation (Martel et al., 2020). Several studies have found that emotions can explain the spread of true vs. false information on social media, with anger being the most significant emotion in driving the spread of misinformation (Pröllochs et al., 2021; Chuai and Zhao, 2022).
Additionally, moral emotions can arise in response to perceived moral violations or standards and motivate moral behaviour (Haidt et al., 2003). One large family of moral emotions is other-condemning emotions that often lead to behavioural outcomes, that is, actions to correct the other’s behaviour and increase justice-relevant judgement (Haidt et al., 2003; Van de Vyver and Abrams, 2015). Specifically, anger and disgust are the main other-condemning emotions used in coordinating and constraining the behaviour of the group member who made the morally unacceptable actions (Haidt et al., 2003). During the COVID-19 pandemic, other-condemning emotions are significantly associated with the higher virality of misinformation on social media (Solovev and Pröllochs, 2022). Within political contexts, social media posts containing moral-emotional language have been shown to be 20% more likely to be shared, particularly within polarized partisan networks (liberal or conservative), with stronger effects within these groups than between them (Brady et al., 2017). This highlights the role of moral emotions in amplifying online engagement, particularly through expressions of out-group animosity. Such expressions, especially within partisan networks, have been shown to drive higher engagement than in-group favoritism, further entrenching political polarization (Rathje et al., 2021).
Previous studies highlight moral outrage – a mixture of anger and disgust triggered by a perceived moral norm violation – as a powerful emotion that motivates people to shame and punish wrongdoers, especially in the digital age (Salerno and Peter-Hagene, 2013; Crockett, 2017; Brady et al., 2023). Social media platforms, such as X/Twitter, inherently amplify expressions of moral outrage over time, as users who learn such language get rewarded with an increased number of likes and reposts (Brady et al., 2021). Moral outrage is also contagious. Knowing that a person or entity is being publicly condemned can provoke moral outrage in others (Shah et al., 2020). This contagious has the potential to ignite online firestorms – large waves of insults, criticism, or swearing directed at persons and organizations on social media (Rost et al., 2016; Strathern et al., 2020). In addition, users frequently overestimate the level of outrage and hostility in social media posts, perceiving emotional expressions as more extreme than the authors actually report. This overperception can lead to escalated responses and increase the spread of moral outrage (Brady et al., 2023). The consequences of heightened moral outrage on social media are double-edged. On the one hand, it can fuel inter-group conflict and polarization, exacerbating online tensions and divisions. On the other hand, it can also amplify constructive facets of morality, such as social support and prosociality (Van Bavel et al., 2024; Crockett, 2017). This dual role underscores the importance of understanding how moral outrage operates in specific circumstances to mitigate its negative impacts while promoting its potential positive effects.
Overall, the analysis of sentiments and (moral) emotions is a crucial and growing area of research for understanding online engagement and its consequences. A large research body has documented that sentiments, (moral) emotions, and moral outrage play a pronounced role in shaping engagement with (mis-)information on social media. However, an understanding of how users emotionally react to social media posts after they are informed of the falsehoods is missing, which presents the aim of our study.
3. Data and Methods
3.1. Datasets
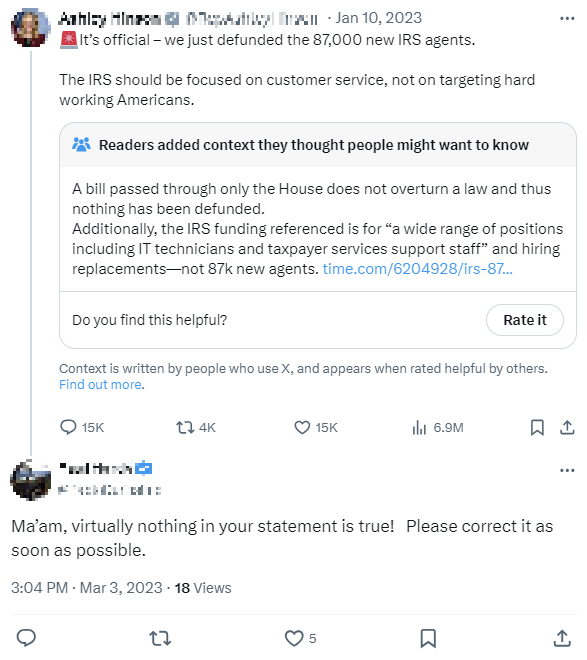
In this study, we analyze the emotional reactions of social media users in response to (community) fact-checks. For this purpose, we collect a large dataset of posts that have been fact-checked on X’s (formerly Twitter) “Community Notes” platform (formerly Birdwatch). “Community Notes” was officially rolled out to users on December 11, 2022, and is a crowdsourced fact-checking program that allows users to identify posts that they believe are misleading and write short textual notes that provide context to the posts. After a community note is created, other users can rate its helpfulness and, if it reaches a certain level of helpfulness, it is displayed prominently beneath the original post. An example of a misleading post with a displayed community note and one direct reply is shown in Fig. 1(a). Importantly, before note display, users who reply to the source posts can only see the original post content (as shown in Fig. 1(b)). After note display, users who reply to the source posts can see both original post content and displayed community notes flagging the post content as being misleading.
As detailed in the following, we collect data from three different sources: (i) note dataset, (ii) post dataset, and (iii) reply dataset. Subsequently, we combine these three data sources into a longitudinal dataset that allows us to analyze the changes in reply emotions before and after the display of community notes.
3.1.1. Note dataset.
X publishes all community notes and their associated status histories on a dedicated website and updates them daily.111https://x.com/i/communitynotes/download-data We downloaded the community note datasets on April 8, 2023, which include all note contributions up until April 6, 2023. Our note dataset contains the details for each note, including its unique ID, creation time, classification (misleading or not misleading), referenced source post ID, and the note status history (i. e., when the notes were rated helpful and displayed on the source posts). In our data, there are community notes for source posts. However, only source posts (10.3%) received displayed community notes until the date of data collection.
3.1.2. Post dataset.
We use X Academic Research API to search for the source posts with displayed community notes and successfully collect (82.6%) posts. Notably, given that the “Community Notes” program was rolled out on December 11, 2022, and mainly developed in the U.S., we only consider the source posts that were created after the roll-out and are written in English. There are source posts remaining after this filtering step.
3.1.3. Reply dataset.
We retrieve the entire conversation thread for each source post via X’s Academic Research API.222https://developer.x.com/en/docs/twitter-api/conversation-id Each conversation thread contains all the replies to the original posts, and they share one unique conversation ID. In this study, we analyze the changes of sentiments and emotions in replies to the original misleading posts after the display of community notes. Therefore, we only consider direct replies to the source posts and omit indirect replies. We successfully pull direct replies to misleading source posts (94.3%) that were fact-checked via community notes during a period of 4 months since its roll-out (Table 1). The remaining 5.7% () misleading source posts have no (English) replies and are thus omitted.
| (1) | (2) | (3) | |
| All | Politics | Non-politics | |
| #Replies | 2,225,260 | 1,068,732 | 1,156,528 |
| #Source posts | 1841 | 477 | 1364 |
| Date range of replies | 2022-12-11 – 2023-05-28 | 2022-12-11 – 2023-05-27 | 2022-12-11 – 2023-05-28 |
| Date range of source posts | 2022-12-11 – 2023-04-05 | 2022-12-11 – 2023-04-05 | 2022-12-11 – 2023-04-05 |
| Sentiments in replies | |||
| Positive | 0.112 (0.222) | 0.098 (0.209) | 0.124 (0.233) |
| Negative | 0.565 (0.336) | 0.608 (0.324) | 0.525 (0.342) |
| Sentiments in source posts | |||
| Source positive | 0.114 (0.222) | 0.084 (0.184) | 0.125 (0.233) |
| Source negative | 0.443 (0.334) | 0.513 (0.315) | 0.419 (0.337) |
| Emotions in replies | |||
| Anger | 0.181 (0.260) | 0.205 (0.272) | 0.160 (0.246) |
| Disgust | 0.097 (0.183) | 0.098 (0.181) | 0.096 (0.185) |
| Fear | 0.050 (0.146) | 0.047 (0.138) | 0.054 (0.153) |
| Joy | 0.066 (0.170) | 0.061 (0.163) | 0.069 (0.176) |
| Sadness | 0.107 (0.192) | 0.109 (0.193) | 0.104 (0.192) |
| Surprise | 0.172 (0.247) | 0.164 (0.241) | 0.180 (0.252) |
| Emotions in source posts | |||
| Source anger | 0.159 (0.243) | 0.195 (0.260) | 0.147 (0.236) |
| Source disgust | 0.041 (0.117) | 0.041 (0.112) | 0.040 (0.119) |
| Source fear | 0.173 (0.276) | 0.151 (0.242) | 0.181 (0.287) |
| Source joy | 0.077 (0.176) | 0.068 (0.158) | 0.080 (0.182) |
| Source sadness | 0.126 (0.211) | 0.140 (0.216) | 0.122 (0.209) |
| Source surprise | 0.175 (0.245) | 0.174 (0.249) | 0.175 (0.244) |
3.2. Sentiments and Basic Emotions
We extract sentiment and emotion features in the source posts and their replies using two state-of-the-art machine learning models. Specifically, we compute the probabilities of positive and negative sentiments for each source post and reply using the Twitter-roBERTa-base model (2022 updated). It was trained on 124 million posts created from January 2018 to December 2021, and fine-tuned for sentiment analysis.333https://huggingface.co/cardiffnlp/twitter-roberta-base-sentiment-latest This model achieves a high prediction performance compared to other sentiment models (Camacho-collados et al., 2022; Loureiro et al., 2022). Subsequently, we compute the probabilities of Ekman’s six basic emotions (i. e., anger, disgust, fear, joy, sadness, and surprise) (Ekman, 1992; Sauter et al., 2010) for each source post and reply using a distilled version of the RoBERTa-base model.444https://huggingface.co/j-hartmann/emotion-english-distilroberta-base The model was pre-trained on OpenWebTextCorpus, a reproduction of OpenAI’s WebText dataset with more than 8 million documents, and fine-tuned for emotion analysis (Hartmann, 2022). The performance of this emotion analysis model is comparable to human annotations and has been used in several previous studies (Butt et al., 2022; Rozado et al., 2022). Summary statistics for the sentiments and emotions in the source posts and replies are reported in Table 1.
3.3. Political vs. Non-Political Posts
Misleading posts within the domain of politics are particularly concerning as they threaten the functioning of democracy and have the potential to destabilize societies (Ecker et al., 2024). Therefore, we additionally conduct a sensitivity analysis on the changes of sentiments and emotions in replies to misleading posts that cover a political vs. a non-political topic. To do so, we extract topic domains from the context annotations attached to each source post and classify them as political or non-political. X performs entity recognition and semantic analysis (e. g., keywords, hashtags, and handles) for all posts and assigns corresponding domain labels based on a topic domain list.555The topic domains are curated by domain experts and have undergone refinement over several years. X’s internal team audits this approach quarterly through the manual review of posts across all the domains. The precision scores are consistently 80%. The topic domain list is available via https://developer.x.com/en/docs/twitter-api/annotations/overview. Within the domain list, we consider “Politician,” “Political Body,” and “Political Race” as political topic domains. Posts containing one of the political topic domains are classified as political; otherwise, they are classified as non-political. As a result, there are political misleading posts in our data, accounting for 25.9% of all misleading posts. However, nearly half of the replies are directed at political misleading posts (see Table 1).
3.4. Empirical Models
In this study, we longitudinally examine the direct replies to the source posts before and after the display of community notes. To address our research questions, we use Regression Discontinuity Design (RDD) to causally estimate the effects of the display of community notes in terms of sentiments and basic emotions. RDD is a quasi-experimental method to estimate the average treatment effect of an intervention by exploiting a discontinuity in the relationship between a running variable and an outcome variable at a specific threshold or cutoff point (Angrist and Pischke, 2009; Chuai et al., 2024b). In the following, we introduce the dependent variables (Section 3.4.1), display indicator and running variable (Section 3.4.2), and additional independent variables (Section 3.4.3) in our analysis. Subsequently, we detail the specification of our empirical RDD models (Section 3.4.4).
3.4.1. Dependent variables.
We define the following dependent variables that measure expressions of sentiments, basic emotions, and moral outrage in replies to social media posts:
-
•
Dependent variables for positive and negative sentiments
-
–
: A continuous variable from 0 to 1 that indicates the probability of positive sentiment in a reply.
-
–
: A continuous variable from 0 to 1 that indicates the probability of negative sentiment in a reply.
-
–
-
•
Dependent variables for basic emotions
-
–
: A continuous variable from 0 to 1 that indicates the probability of anger in a reply.
-
–
: A continuous variable from 0 to 1 that indicates the probability of disgust in a reply.
-
–
: A continuous variable from 0 to 1 that indicates the probability of fear in a reply.
-
–
: A continuous variable from 0 to 1 that indicates the probability of joy in a reply.
-
–
: A continuous variable from 0 to 1 that indicates the probability of sadness in a reply.
-
–
: A continuous variable from 0 to 1 that indicates the probability of surprise in a reply.
-
–
-
•
Dependent variable for moral outrage
-
–
: A continuous variable from 0 to 1 that indicates the probability of moral outrage in a reply. Following the definition of moral outrage and previous research (Salerno and Peter-Hagene, 2013; Crockett, 2017; Brady et al., 2021), we use the multiply of anger and disgust (i. e., ) to measure moral outrage.
-
–
3.4.2. Display indicator and running variable.
Based on RDD, we aim to examine whether there are significant discontinued changes in sentiments and emotions after the display of community notes and estimate the treatment effects. The key rationale behind this is that the sentiments and emotions in replies should change smoothly (or keep stable) over time if without the display of community notes. Given this, we define the display indicator of community notes (binary treatment indicator) as . It is equal to 1 if a reply is created after note display; otherwise, it is equal to 0. Additionally, we examine the changes of sentiments and emotions over time before and after the display of community notes. Therefore, we define the running variable as , which is a continuous variable indicating the hour(s) from note display to reply creation.
3.4.3. Additional independent variables.
Given that connected social media users may share similar emotions (Goldenberg and Gross, 2020; Kramer et al., 2014; Rosenbusch et al., 2019), the sentiments and emotions in the source posts are likely to affect the sentiments and emotions in the replies from users who are exposed to these source posts. Thus, we incorporate the source sentiments and emotions into the regression models as independent variables:
-
•
Independent variables for source sentiments in misleading posts
-
–
: A continuous variable from 0 to 1 that indicates the probability of positive sentiment in a source post.
-
–
: A continuous variable from 0 to 1 that indicates the probability of negative sentiment in a source post.
-
–
-
•
Independent variables for source emotions in misleading posts
-
–
: A continuous variable from 0 to 1 that indicates the probability of anger in a source post.
-
–
: A continuous variable from 0 to 1 that indicates the probability of disgust in a source post.
-
–
: A continuous variable from 0 to 1 that indicates the probability of fear in a source post.
-
–
: A continuous variable from 0 to 1 that indicates the probability of joy in a source post.
-
–
: A continuous variable from 0 to 1 that indicates the probability of sadness in a source post.
-
–
: A continuous variable from 0 to 1 that indicates the probability of surprise in a source post.
-
–
In addition, the times when community notes are displayed on the source post are not fixed and depend on note helpfulness scores that are recalculated every one hour. Therefore, changes in sentiments and emotions after note display might be confounded by the post age from post creation to reply creation. Given this, we use to control for the possible confounding effects of post age. Descriptive statistics of sentiments and emotions in replies and source posts are summarized in Table 1.
3.4.4. Regression models.
We specify two RDD models to estimate the effects of the display of community notes on sentiments and emotions in replies, respectively. For positive and negative sentiments, the RDD model is specified as:
| (1) |
where denotes the dependent variable of or , is the intercept, and is the residual. to are coefficient estimates for the independent variables.
For the six basic emotions, the RDD model is specified as:
| (2) | ||||
where denotes the dependent variable of one of the six basic emotions: , , , , , or . Additionally, we further take (i. e., ) as the dependent variable to explore the changes in moral outrage after the display of community notes. The independent variables for source sentiments are replaced with the variables for source emotions.
Analogous to previous research (Vosoughi et al., 2018), we cluster the standard errors in all regression models by the unique source posts. This approach is necessary because replies to the same source post are likely to be correlated, violating the independence assumption. By clustering the standard errors, we account for the potential within-cluster correlations and provide more precise and reliable standard error estimates. In addition to the cluster-robust method, the incorporation of the source sentiments and emotions in the regression models also explicitly controls for the correlations of the replies within the same source posts. To balance the scales of variables, we further -standardize all continuous variables when fitting the RDD models. The -standardization is based on:
| (3) |
where denotes original value for a continuous variable , and is the standardized value. and are mean and standard deviation of the variable , respectively. Therefore, the coefficient estimates for , i. e., , in the models cannot be directly interpreted as the effects of note display. Given this, we define that is the outcome of a dependent variable before the display of community notes and is the outcome of a dependent variable after the display of community notes. Assuming that all the other independent variables are equal for the outcomes of and , we have:
| (4) | ||||
The value of can represent the estimated (predicted) effects of the display of community notes on the sentiments and emotions, with all else being equal.
4. Results
4.1. Data Overview
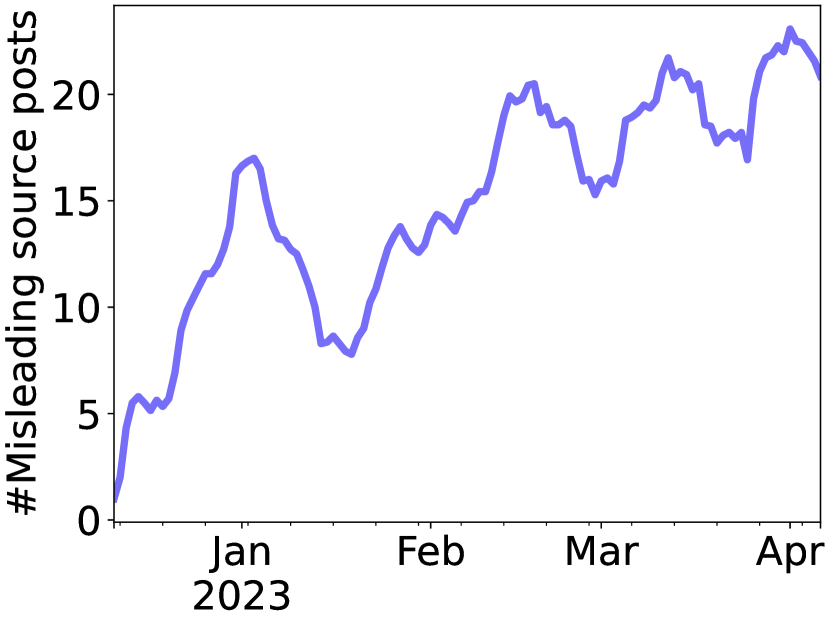
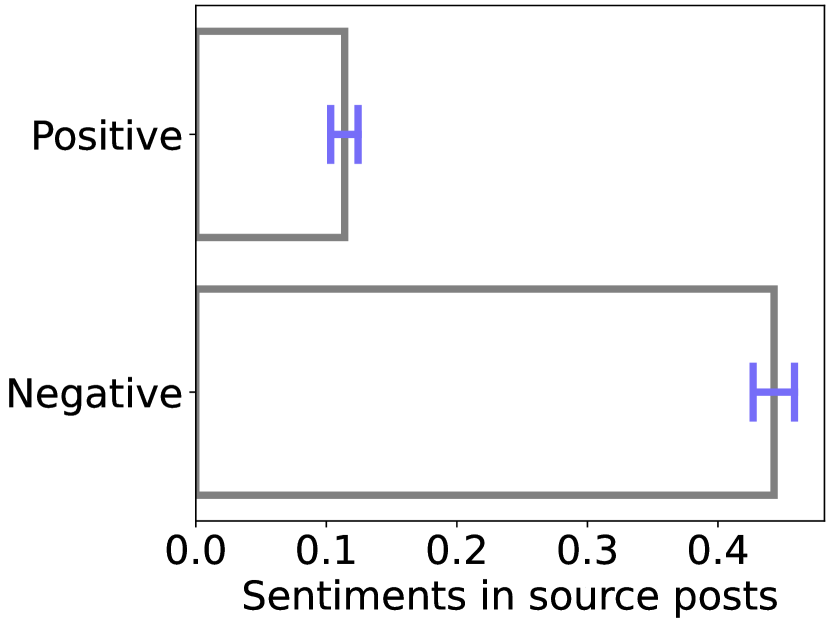
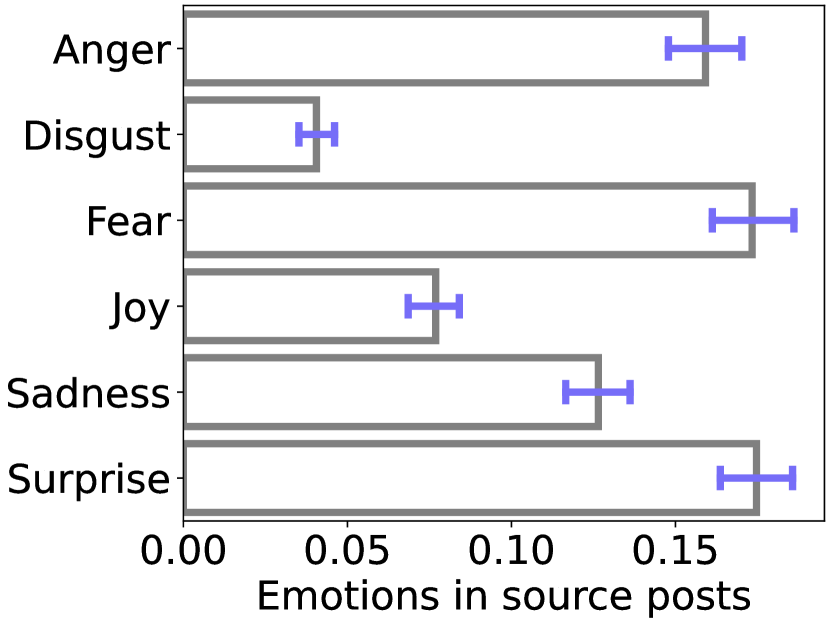
Our dataset covers four months since the roll-out of the “Community Notes” program on X in December of 2022. Fig. 2(a) shows that the daily number of misleading posts on which community notes are displayed has an increasing trend, with an average of 15.7. Fig. 2(b) shows that misleading source posts tend to have higher negative sentiment (mean of 0.443), compared to positive sentiment (mean of 0.114; , ). In terms of emotions, anger (mean of 0.159), fear (mean of 0.173), and surprise (mean of 0.175) are most common in the fact-checked misleading source posts (Fig. 2(c)).
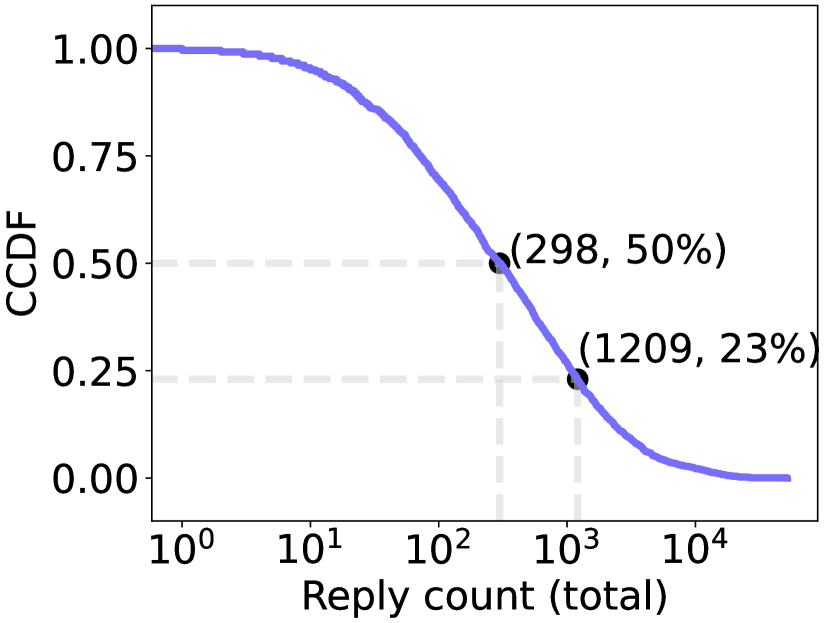
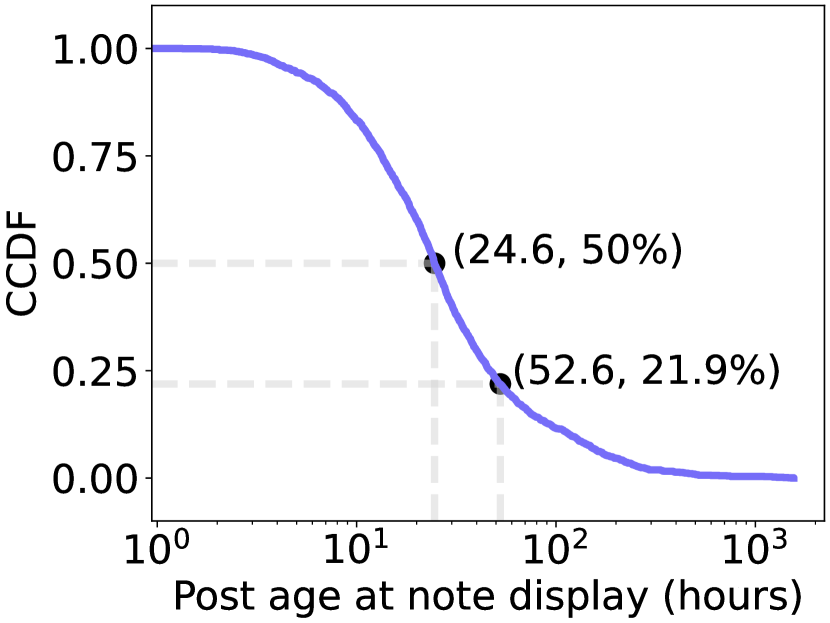
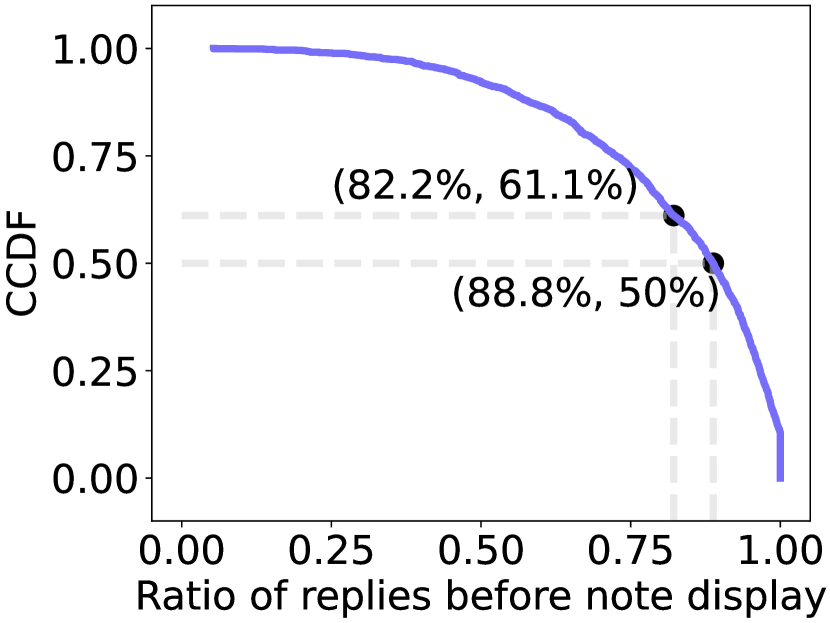
To examine the effects of community notes on the sentiments and emotions in replies, we collect a large-scale longitudinal dataset of replies to misleading posts. Fig. 2(d) shows that each misleading source post receives an average of (median of ) replies in total (i. e., before and after the display of community notes). On average, community notes are displayed 52.5 hours (median of 24.6 hours) after the creation of the source misleading posts (Fig. 2(e)). Notably, most of the replies (mean of 82.2%, median of 88.8%) are created before the display of community notes (Fig. 2(f)). Therefore, some misleading posts may not have sufficient reply samples after note display to perform comparisons with the replies before note display. Given this, we restrict our analysis to misleading posts that have at least () 5 replies both before and after the display of community notes. This criterion results in misleading posts being included in the comparison of sentiments and emotions in replies before and after note display.
To shed light on the relationships between sentiments and basic emotions in our reply dataset, we examine their cross-correlations. We find that anger (, ), disgust (, ), fear (, ), and sadness (, ) have significantly positive correlations with negative sentiment, while joy (, ) and surprise (, ) are positively correlated with positive sentiment (see Table S1 in Suppl. S1 for all cross-correlations). This suggests that, in the replies to misleading posts, negative feelings are often expressed through anger, disgust, fear, and sadness. Notably, anger and disgust have the strongest correlations with negative sentiment. We further examine the cross-correlations among the six basic emotions in each reply. We find that only anger and disgust have a significantly positive correlation with each other (, ). Other emotions all show negative correlations (reported in Table S2 in Suppl. S1). This suggests that replies to misleading posts often express anger and disgust together, which is a strong indicator of moral outrage (Salerno and Peter-Hagene, 2013).
4.2. Analysis of Sentiments and Basic Emotions (RQ1.1)
4.2.1. Descriptive analysis.
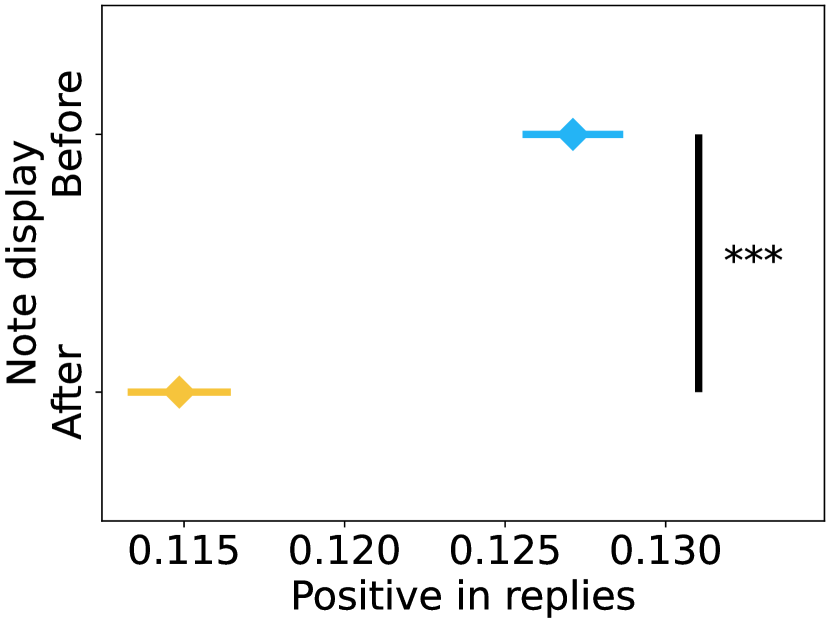
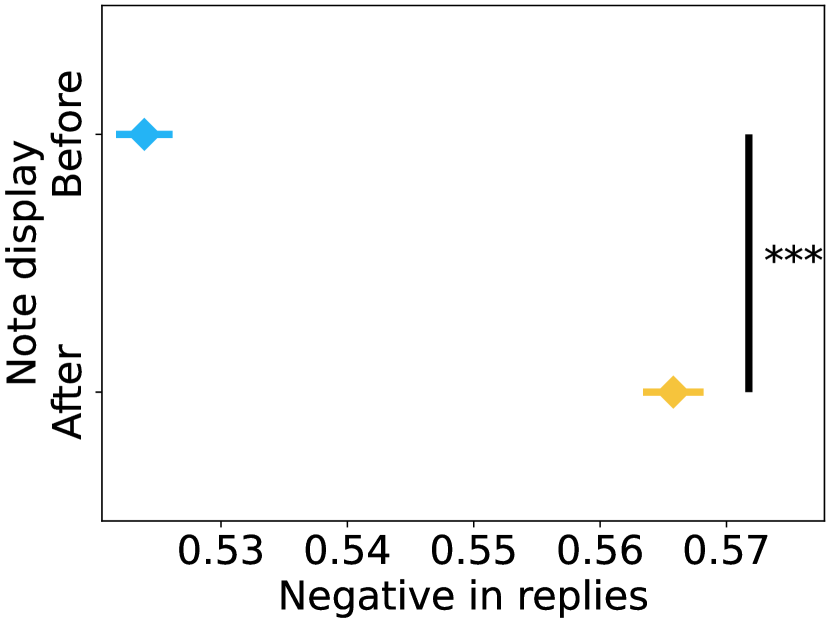
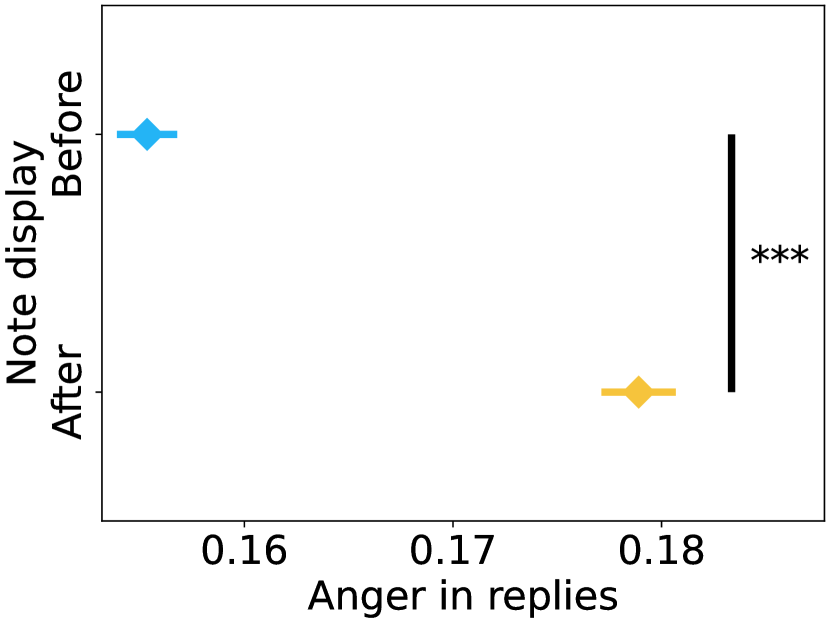
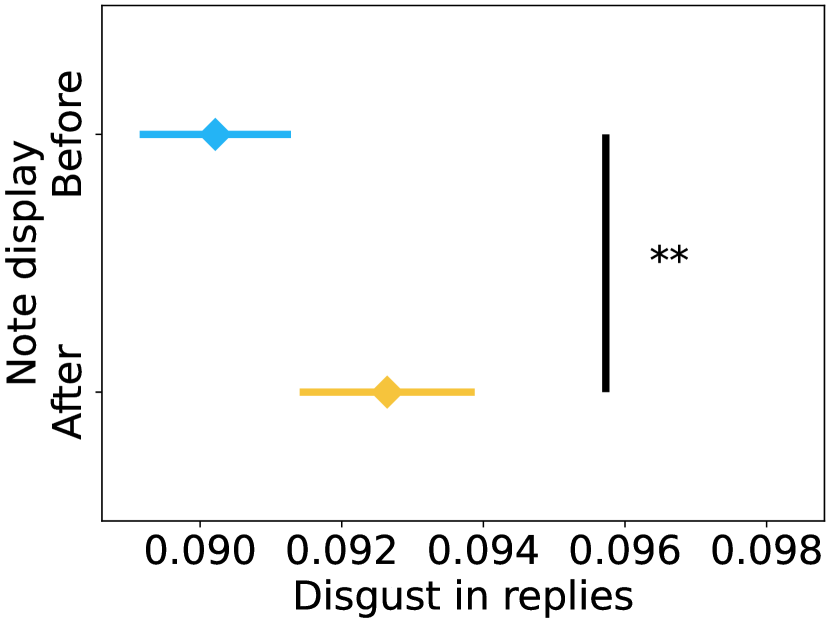
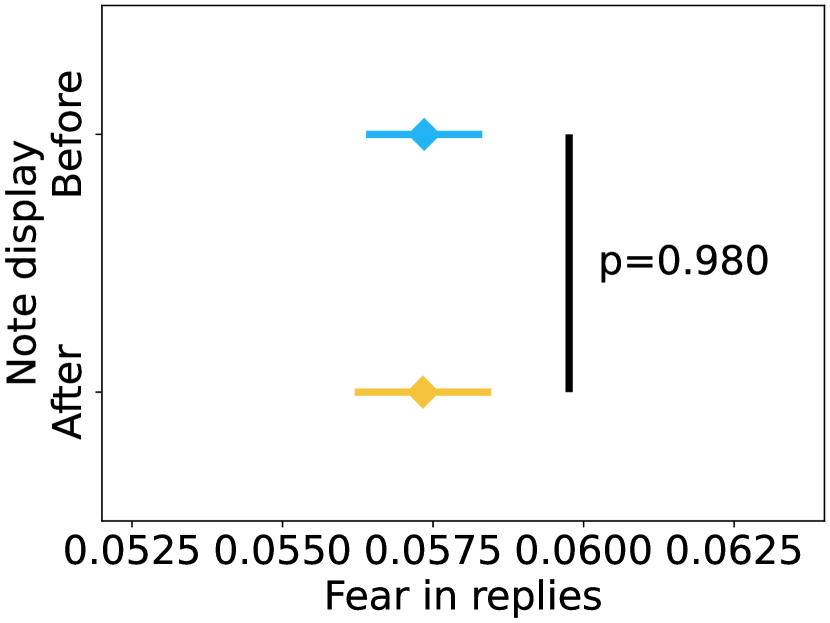
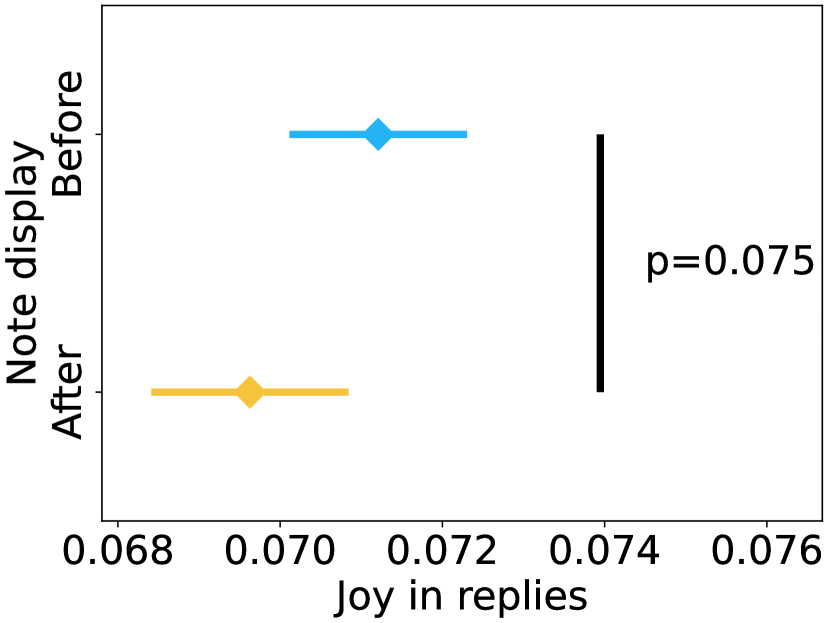
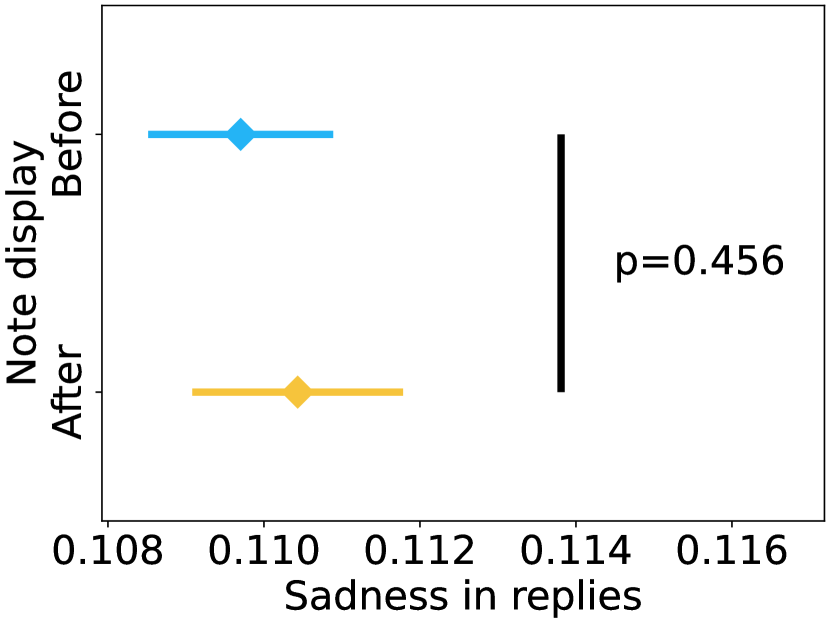
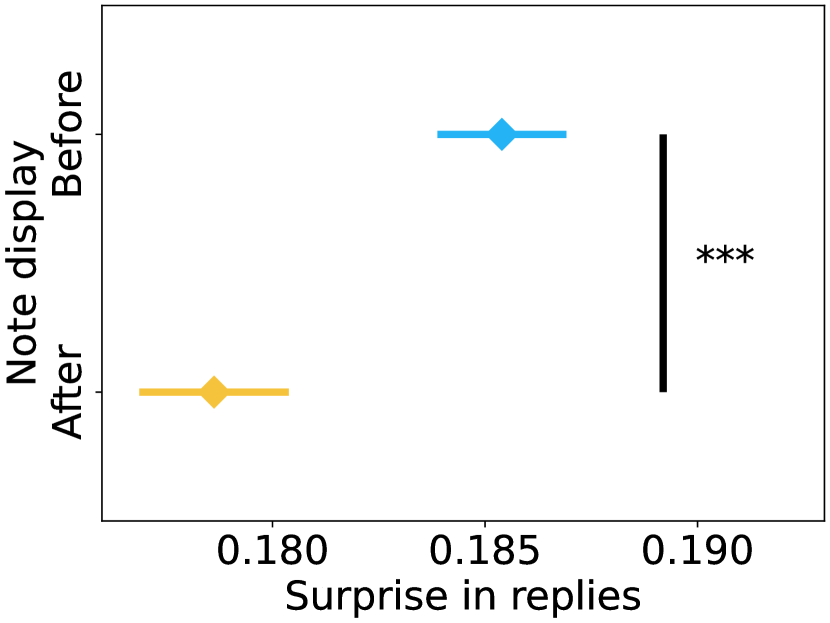
We start by descriptively reporting changes in sentiments and emotions in replies after the display of community notes, compared to before note display. Fig. 3 shows the comparisons between means before note display and means after note display across sentiments and emotions. For sentiments, positive sentiment in replies after the display of community notes (mean of 0.115) is significantly lower than before the note display (mean of 0.127; , ; Fig. 3(a)). In contrast, negative sentiment in replies after the display of community notes (mean of 0.566) is significantly higher than before the note display (mean of 0.524; , ; Fig. 3(b)). In terms of basic emotions, anger (mean of 0.179) and disgust (mean of 0.093) in replies after the display of community notes are significantly higher than anger (mean of 0.155; , ; Fig. 3(c)) and disgust (mean of 0.090; , ; Fig. 3(d)) in replies before the note display, respectively. Fear (before: 0.057, after: 0.057; , ; Fig. 3(e)), joy (before: 0.071, after: 0.070; , ; Fig. 3(f)), and sadness (before: 0.110, after: 0.110; , ; Fig. 3(g)) have no statistically significant changes after the display of community notes. Surprise in replies after the display of community notes (mean of 0.179) is significantly lower than that in replies before the note display (mean of 0.185; , ; Fig. 3(h)). Taken together, our descriptive analysis suggests that replies after note display tend to be more negative and embed higher anger and disgust, compared to replies before the display of community notes.
4.2.2. Causal analysis.
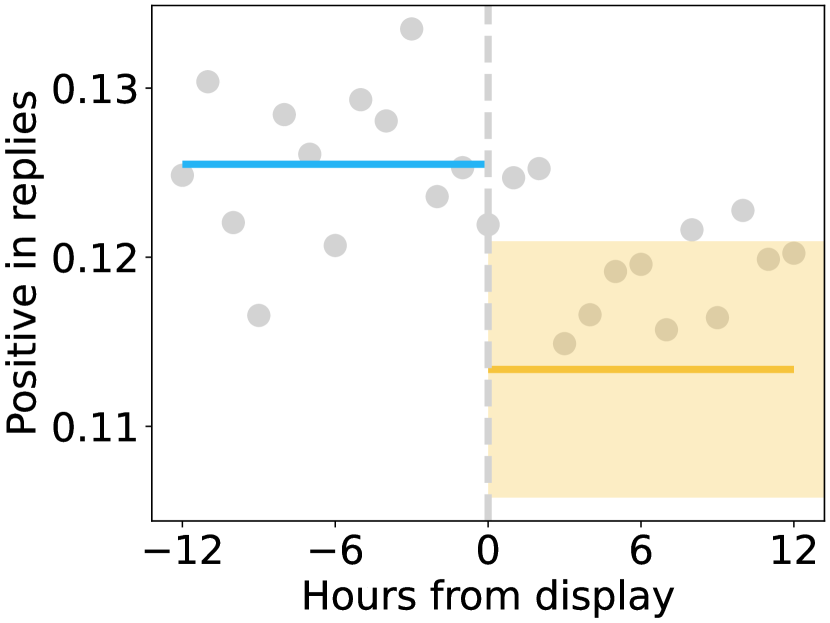
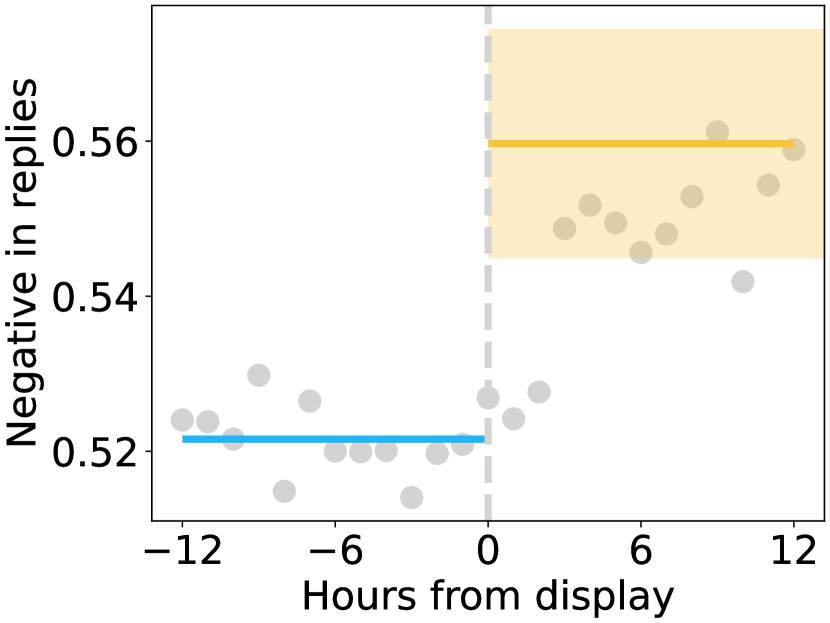
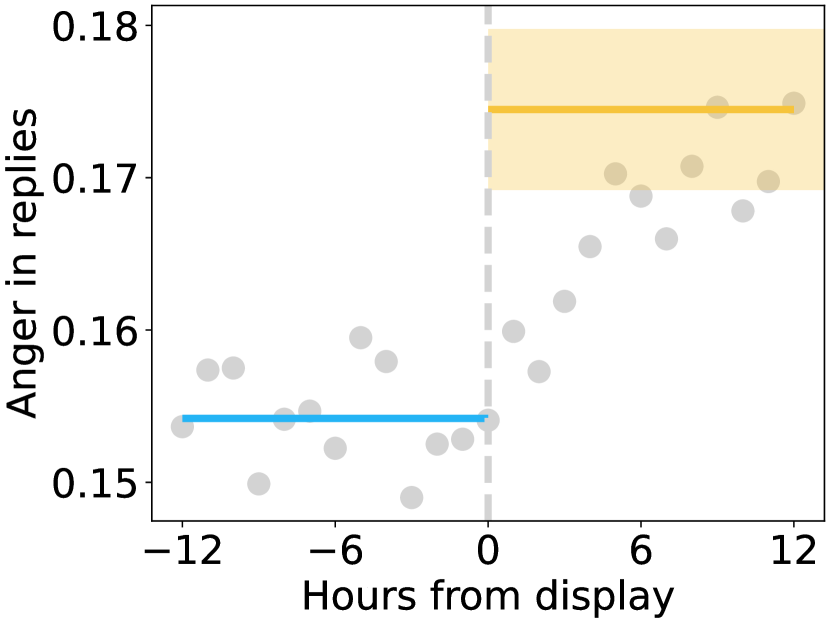
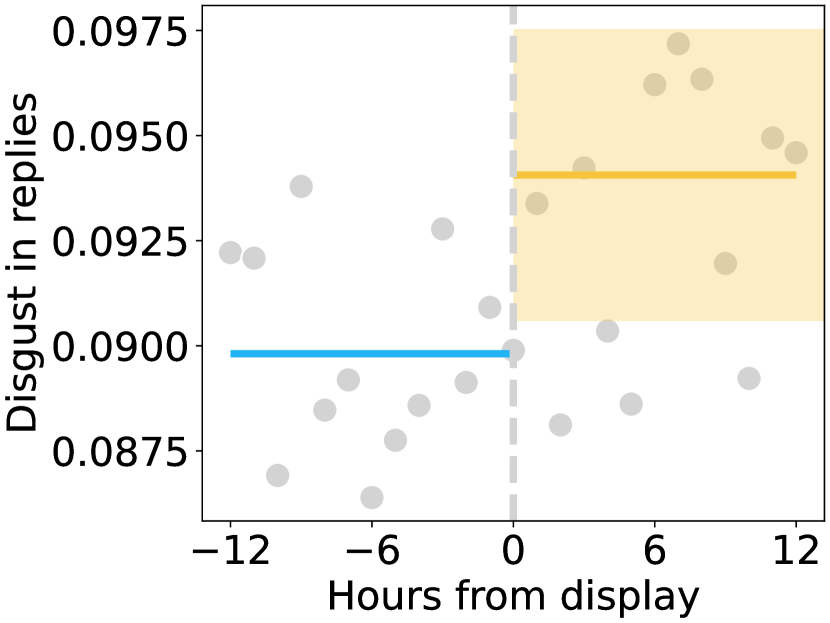
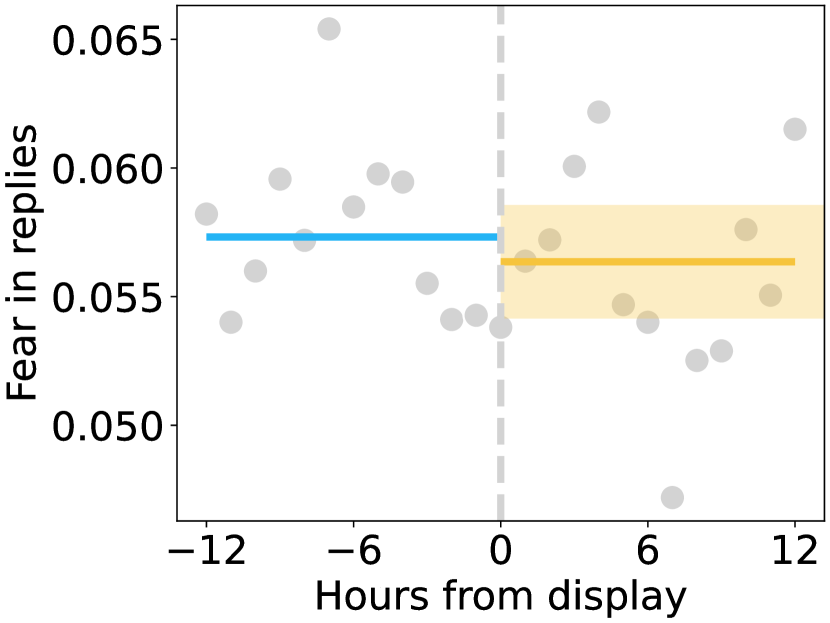
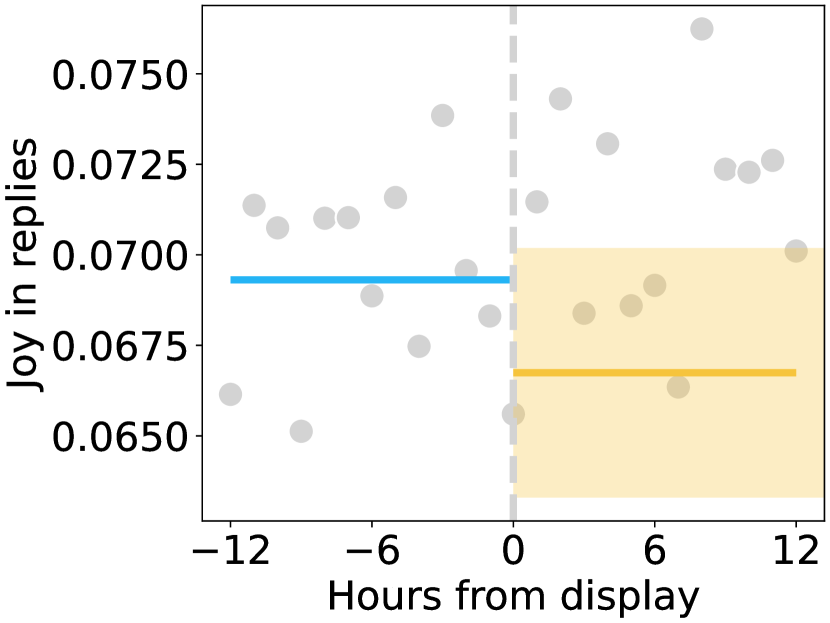
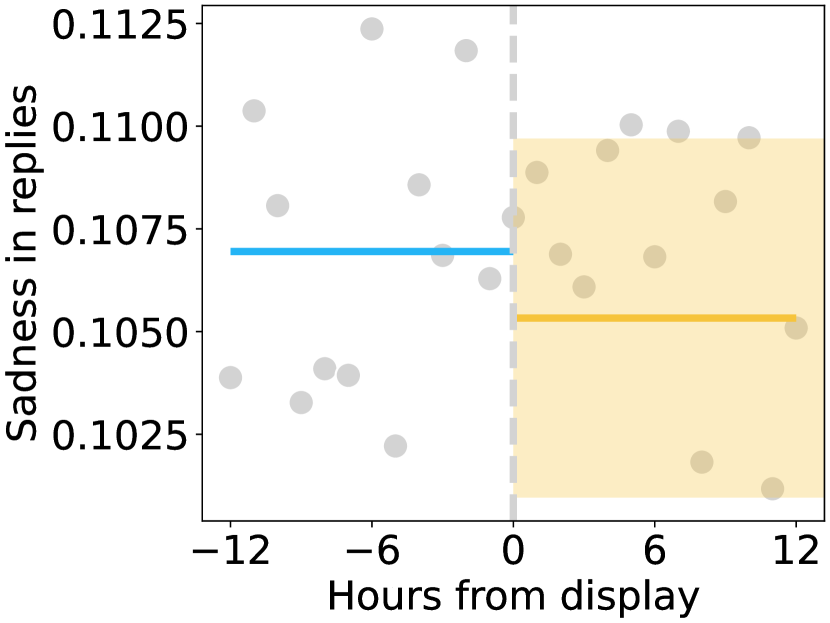
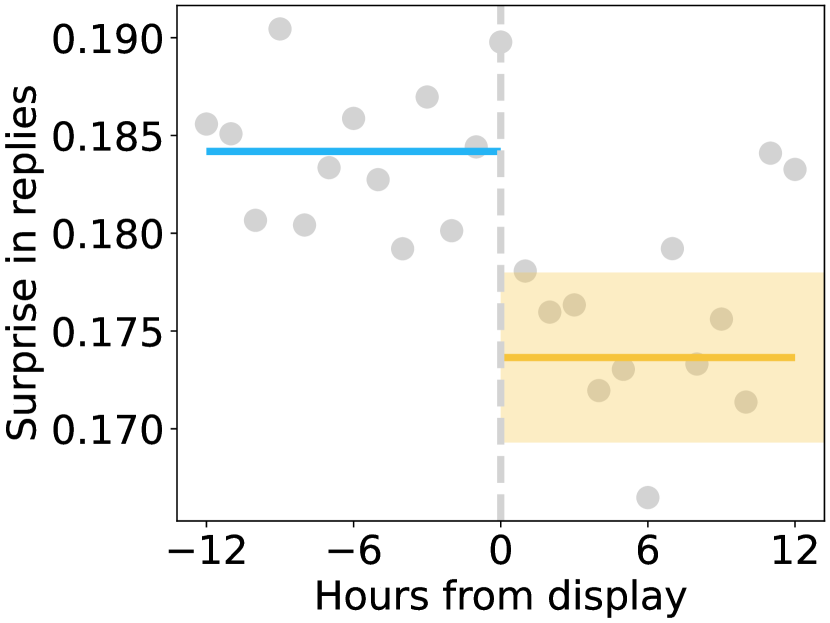
We now use Regression Discontinuity Design (RDD) to estimate the causal changes in sentiments and emotions in replies to source misleading posts that are attributed to the display of community notes. The coefficient estimates for the regressions across sentiments and basic emotions are visualized in Fig. 4. To interpret the effects of the display of community notes on the specific sentiments and emotions in replies to misleading posts, we examine the extent to which the sentiments and emotions in replies change compared to the baselines before the display of community notes. To this end, we consider a 12-hour window before and after the display of community notes. Then, we use the averages of sentiments and emotions over 12 hours before the display of community notes as baselines for comparison. The changes in sentiments and emotions in replies to misleading posts during this window, along with the predicted effects of displaying community notes, are visualized in Fig. 5.
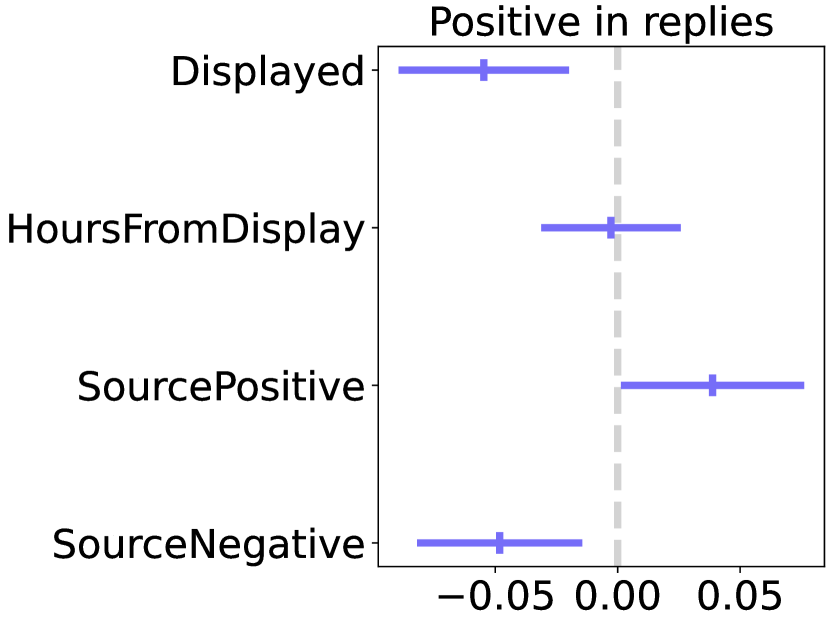
Effect of community notes display: For positive sentiment in replies, the coefficient estimate of is significantly negative (Fig. 4(a): , ; 95% CI: ). This means that the display of community notes decreases the positive sentiment in replies by 0.012 (95% CI: ). As shown in Fig. 5(a), the baseline of positive sentiment in replies before note display is 0.125, and the positive sentiment in replies after note display is predicted to be 0.113 (95% CI: ). This suggests that positive sentiment in replies decreases by 9.7% after the display of community notes compared to that before note display. In contrast, for negative sentiment in replies, the coefficient estimate of is significantly positive (Fig. 4(b): , ; 95% CI: ). This means that the display of community notes increases the negative sentiment in replies by 0.038 (95% CI: ). As shown in Fig. 5(b), the baseline of negative sentiment in replies before note display is 0.522, and the negative sentiment in replies after note display is predicted to be 0.560, (95% CI: ). This suggests that negative sentiment in replies increases by 7.3% after the display of community notes compared to that before note display.
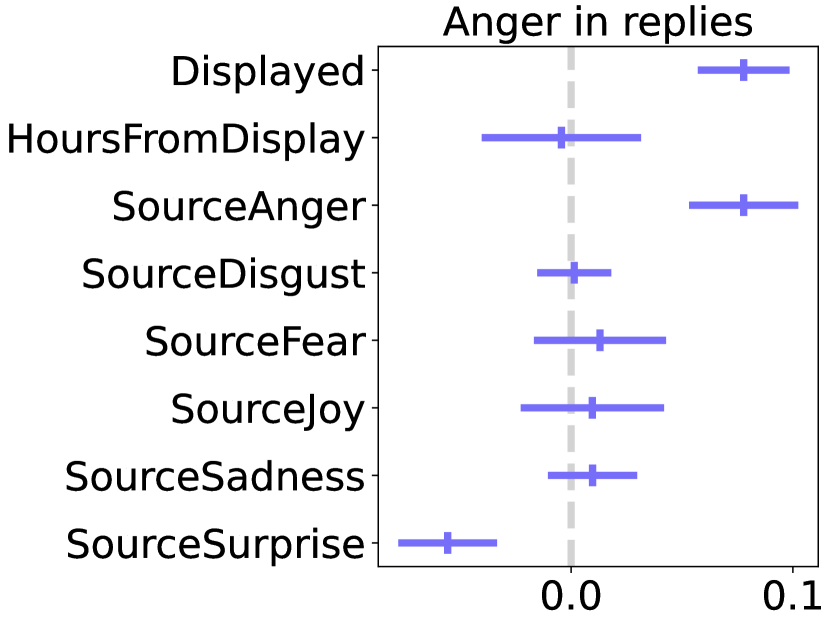
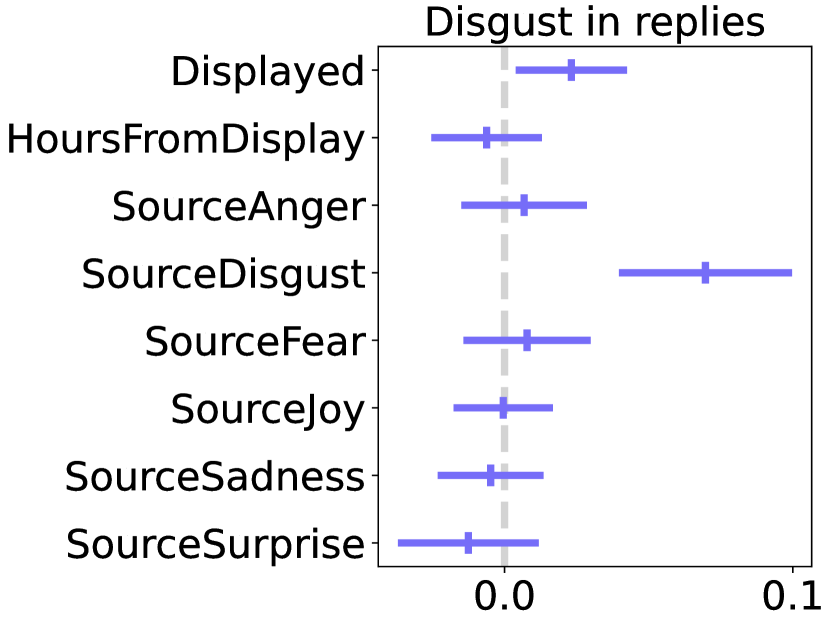
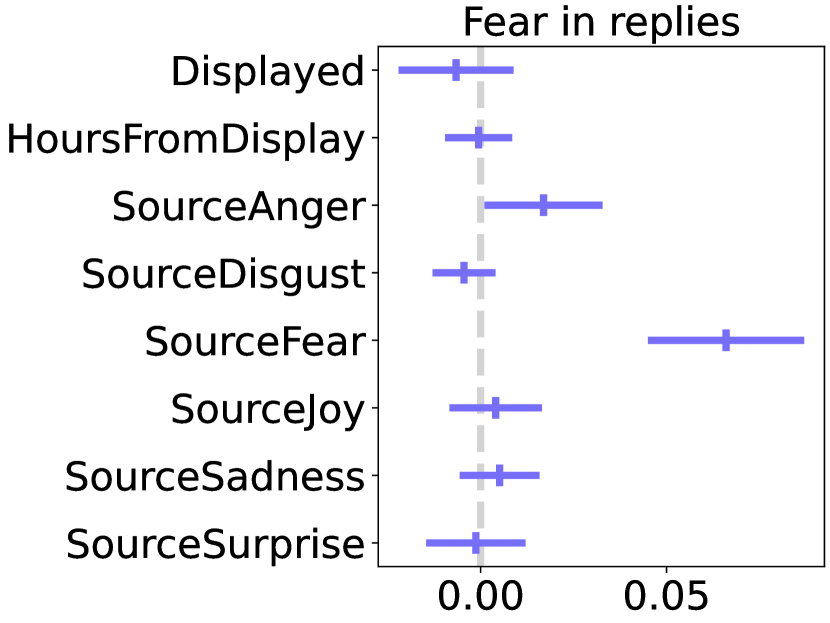
We further examine the effects of community notes display on changes in basic emotions in replies to misleading posts before and after the display of community notes. The results are as follows:
-
•
For anger in replies, the coefficient estimate of is significantly positive (Fig. 4(c): , ; 95% CI: ). This means that the display of community notes increases anger in replies by 0.020 (95% CI: ). As shown in Fig. 5(c), the baseline of anger in replies before note display is 0.154, and the predicted anger in replies after note display is 0.174 (95% CI: ). This suggests that anger in replies increases by 13.2% after the display of community notes compared to that before note display.
-
•
For disgust in replies, the coefficient estimate of is significantly positive (Fig. 4(d): , ; 95% CI: ). This means that the display of community notes increases disgust in replies by 0.004 (95% CI: ). As shown in Fig. 5(d), the baseline of disgust in replies before note display is 0.090, and the predicted disgust in replies after note display is 0.094 (95% CI: ). This suggests that disgust in replies increases by 4.7% after the display of community notes compared to that before note display.
-
•
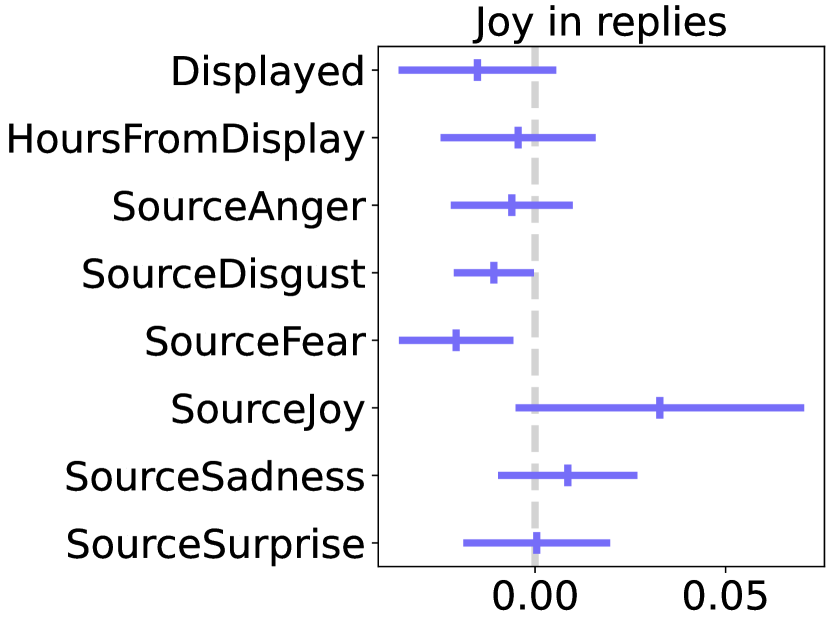
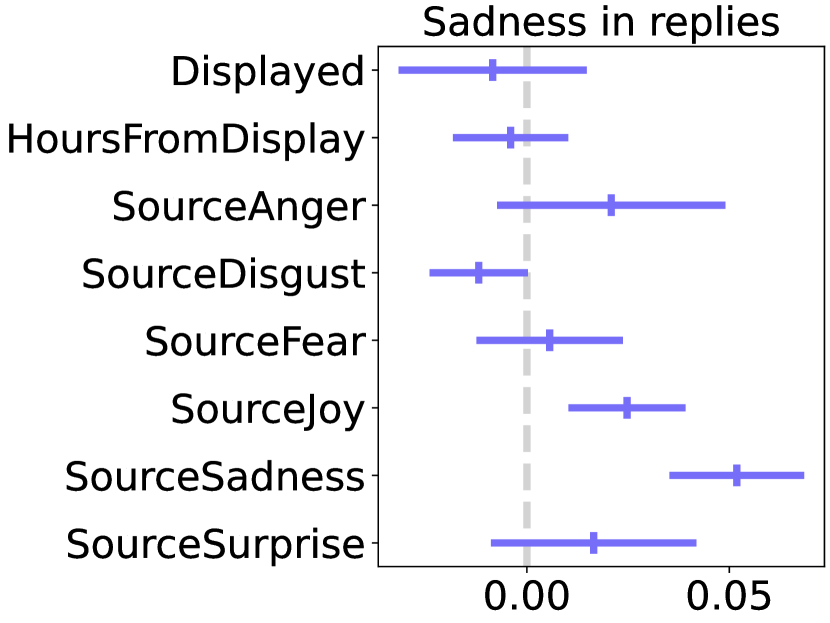
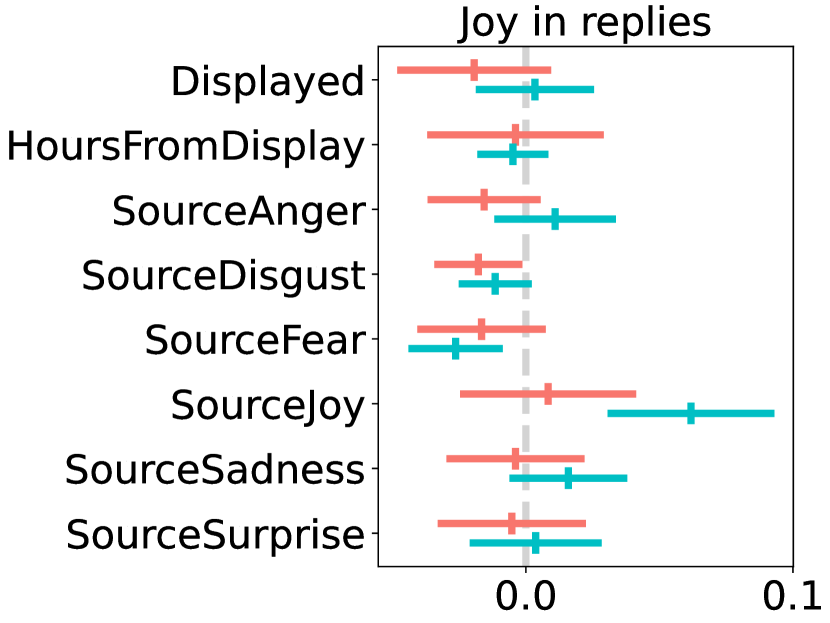
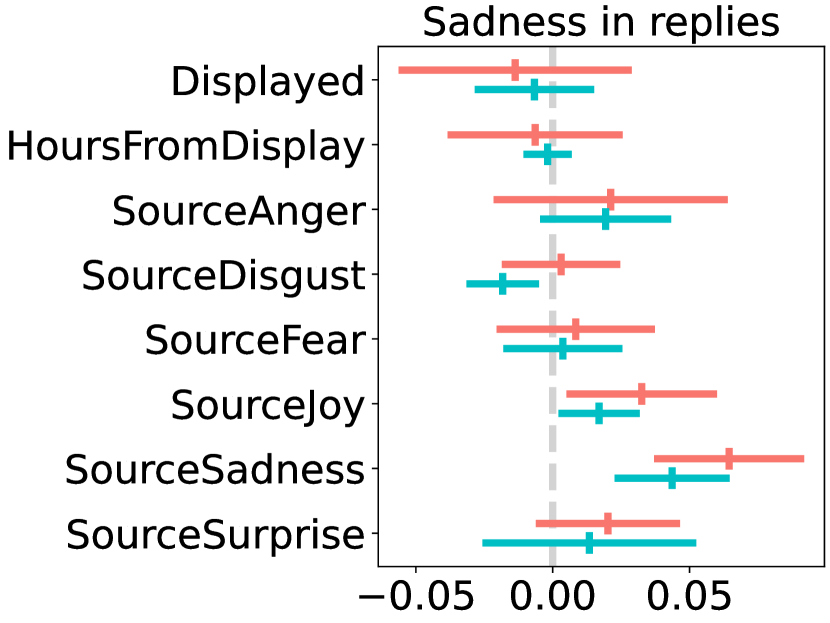
The coefficient estimates of for fear (Fig. 4(e): , ; 95% CI: ), joy (Fig. 4(f): , ; 95% CI: ), and sadness (Fig. 4(g): , ; 95% CI: ) in replies are all not statistically significant. This means that the display of community notes has no significant effects on the three emotions in replies to misleading posts.
-
•
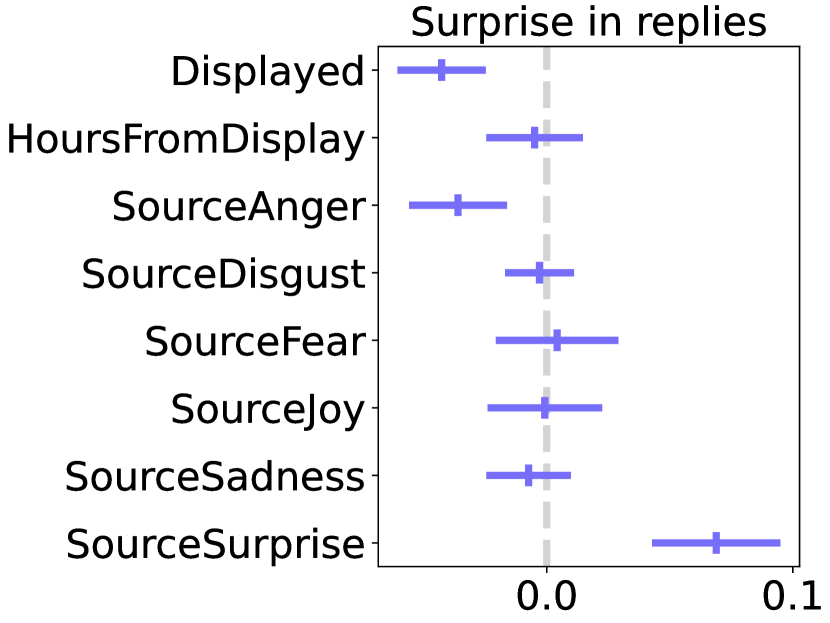
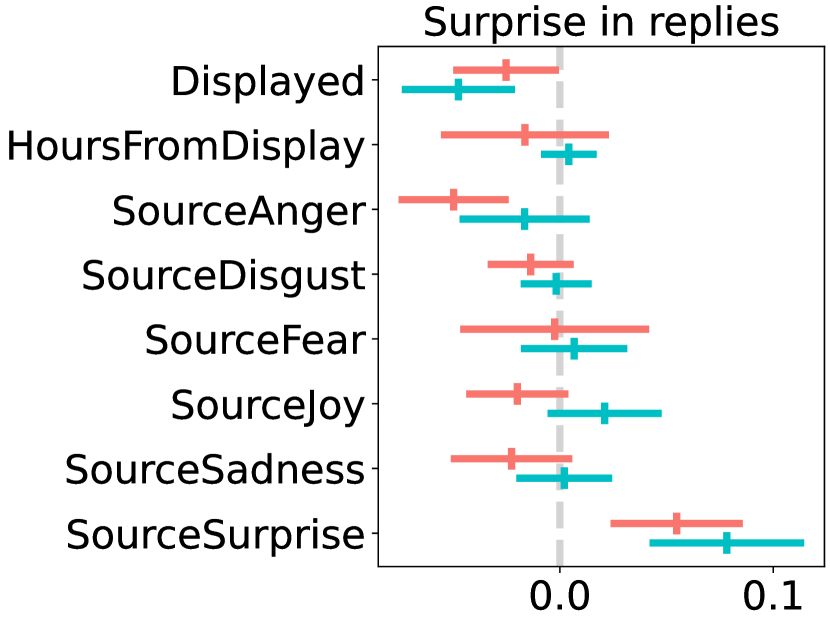
For surprise in replies, the coefficient estimate of is significantly negative (Fig. 4(h): , ; 95% CI: ). This means that the display of community notes decreases surprise in replies by 0.011 (95% CI: ). As shown in Fig. 5(h), the baseline of surprise in replies before note display is 0.184, and the predicted surprise in replies after note display is 0.174 (95% CI: ). This suggests that surprise in replies decreases by 5.7% after the display of community notes compared to that before note display.
Taken together, the display of community notes increases 7.3% more negative sentiment and triggers 13.2% more anger and 4.7% more disgust in replies to misleading posts, respectively. The effects of community notes display on sentiments and emotions in replies are concordant with the observed changes of sentiments and emotions in replies after the display of community notes (see Fig. 3 in the descriptive analysis).
Effect of sentiments and emotions in source posts: We further examine the link between the original sentiments and emotions in the source misleading posts and the subsequent sentiments and emotions in the direct replies. For positive sentiment in replies, the coefficient estimate of in Fig. 4(a) is significantly positive (, ; 95% CI: ); for negative sentiment in replies, the coefficient estimate of in Fig. 4(b) is also significantly positive (, ; 95% CI: ). This means that the positive and negative sentiments in replies are positively linked to the original positive and negative sentiments in the source misleading posts, respectively. In terms of emotions, the coefficient estimate of in Fig. 4(c) (, ; 95% CI: ), the coefficient estimate of in Fig. 4(d) (, ; 95% CI: ), the coefficient estimate of in Fig. 4(e) (, ; 95% CI: ), the coefficient estimate of in Fig. 4(g) (, ; 95% CI: ), and the coefficient estimate of in Fig. 4(h) (, ; 95% CI: ) are all significantly positive. This suggests that the expressions of anger, disgust, fear, sadness, and surprise in source misleading posts have significantly positive effects on anger, disgust, fear, sadness, and surprise in the subsequent replies, respectively. However, the coefficient estimate of in Fig. 4(f) is not statistically significant (, ; 95% CI: ). Thus, we find no evidence that the expression of joy in replies is significantly linked to the expression of joy in the source misleading posts.
Effect of reply timing: We examine whether the sentiments and emotions in replies change over time without the display of community notes. We find that the coefficient estimates of for all the dependent variables of positive sentiment (Fig. 4(a): , ; 95% CI: ), negative sentiment (Fig. 4(b): , ; 95% CI: ), anger (Fig. 4(c): , ; 95% CI: ), disgust (Fig. 4(d): , ; 95% CI: ), fear (Fig. 4(e): , ; 95% CI: ), joy (Fig. 4(f): , ; 95% CI: ), sadness (Fig. 4(g): , ; 95% CI: ), and surprise (Fig. 4(h): , ; 95% CI: ) are not statistically significant. Additionally, the coefficient estimates of across sentiments and emotions are also not statistically significant (see details in Suppl. S2). This means that the sentiments and emotions in replies are relatively stable over time if community notes are not displayed on the corresponding misleading posts.
Summary of findings: In sum, we find that replies are more negative and express more anger and disgust after the display of community notes compared to those before the display. Specifically, the display of community notes triggers 13.2% more anger and 4.7% more disgust in replies to source misleading posts. Additionally, the sentiments and almost all emotions (except for joy) in replies are positively linked to those expressed in the source misleading posts. Furthermore, we find that the expressions of sentiments and emotions in replies are relatively stable over time if without the display of community notes.
4.3. Analysis Across Politic and Non-Political Misleading Posts (RQ1.2)
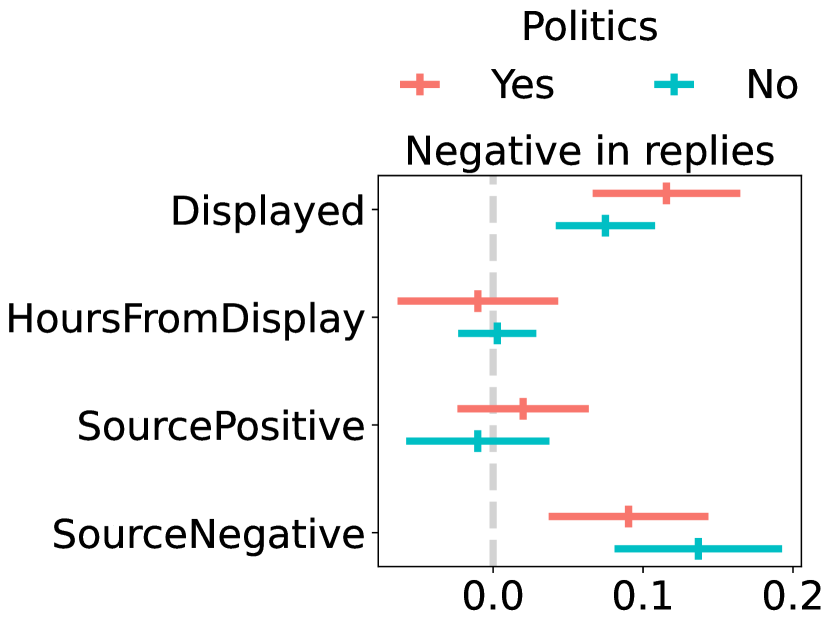
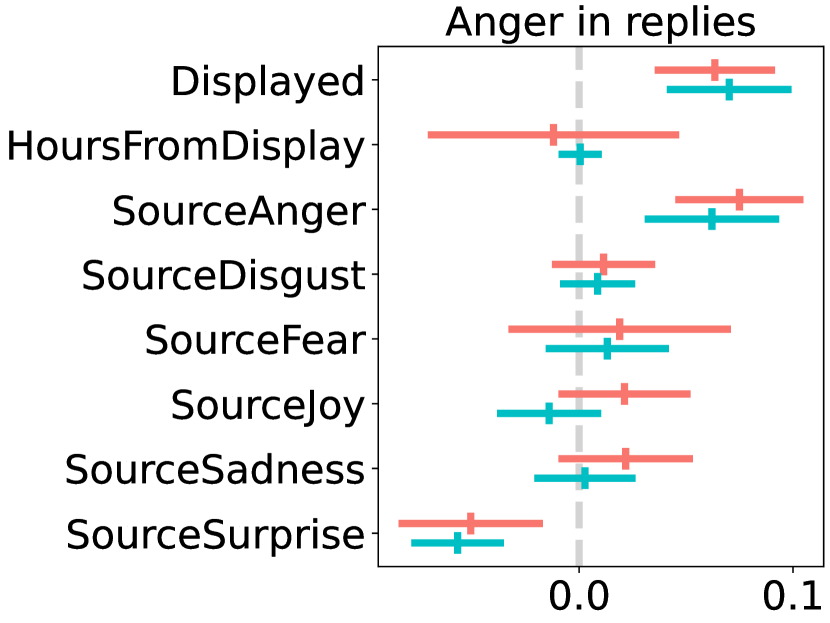
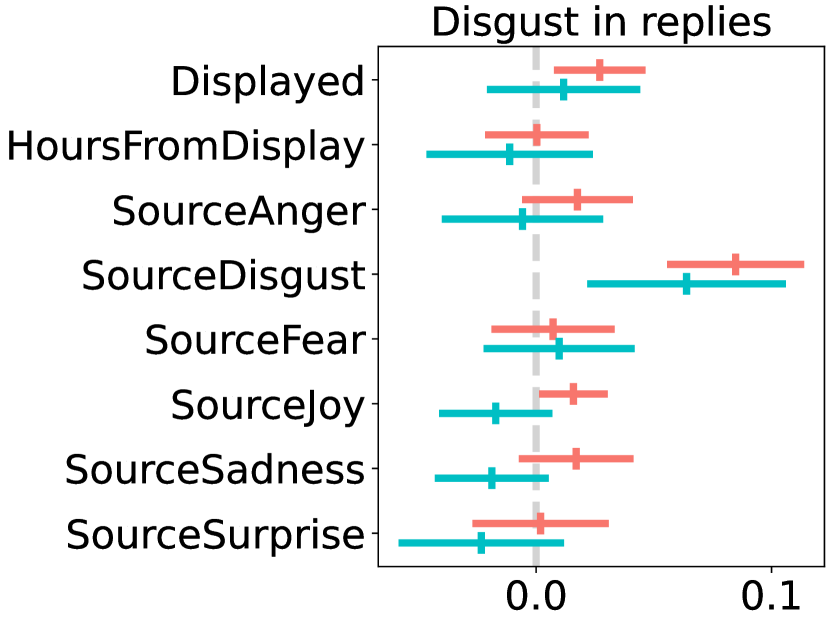
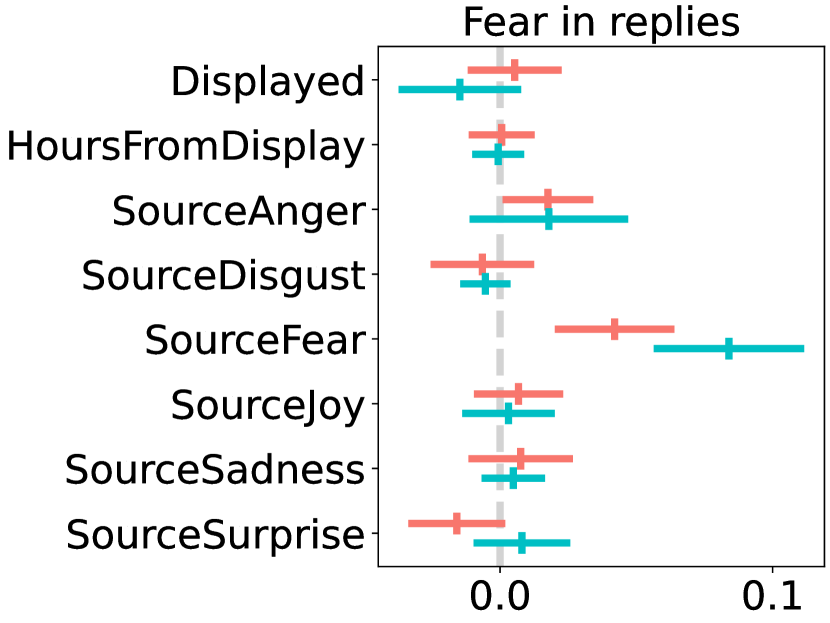
We conduct sensitivity analysis to examine whether the effects of community notes on sentiments and emotions in replies vary across political and non-political misleading posts. The coefficient estimates for the sensitivity analysis across political and non-political misleading posts are reported in Fig. 6.
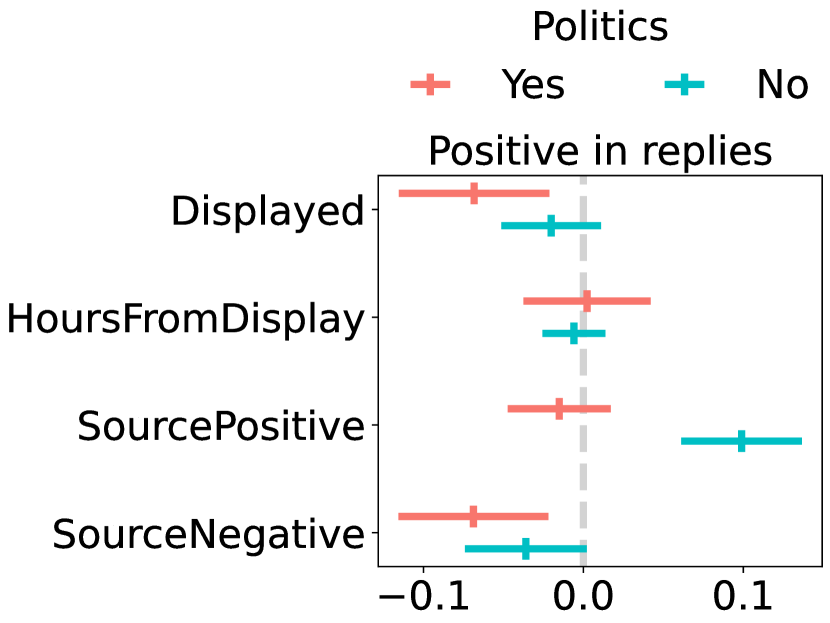
We first examine the sensitivity of the effects of community notes on positive and negative sentiments. In Fig. 6(a), the coefficient estimate of for positive sentiment in replies to political misleading posts is significant and negative (, ; 95% CI: ). However, the coefficient estimate of for positive sentiment in replies to non-political misleading posts is not statistically significant (, ; 95% CI: ). This means that the negative effect of community notes on positive sentiment in replies is limited to political misleading posts. Regarding the negative sentiment in replies (Fig. 6(b)), the coefficient estimates of are significantly positive in both political (, ; 95% CI: ) and non-political misleading posts (, ; 95% CI: ). This means that the effects of community notes generally apply to both political and non-political misleading posts.
Next, we examine the sensitivity of the effects of community notes on basic emotions:
-
•
In terms of anger in replies (Fig. 6(c)), the coefficient estimates of are significantly positive in both political (, ; 95% CI: ) and non-political misleading posts (, ; 95% CI: ). This suggests that the display of community notes triggers more anger in replies to both political and non-political misleading posts.
-
•
In Fig. 6(d), the coefficient estimate of for disgust in replies to political misleading posts is significantly positive (, ; 95% CI: ). However, the coefficient estimate of for disgust in replies to non-political misleading posts is statistically not significant (, ; 95% CI: ). This indicates that the effect of community notes on increasing disgust in replies is only applicable to political misleading posts.
-
•
As shown in Figs. 6(e)–6(g), the coefficient estimates of for fear (politics: , ; 95% CI: ; non-politics: , ; 95% CI: ), joy (politics: , ; 95% CI: ; non-politics: , ; 95% CI: ), and sadness (politics: , ; 95% CI: ; non-politics: , ; 95% CI: ) in replies to both political and non-political misleading posts are consistently not significant. This means that the display of community notes has no significant effects on fear, joy, and sadness in replies to either political or non-political misleading posts.
-
•
In Fig. 6(h), the coefficient estimates of for surprise in replies to both political (, ; 95% CI: ) and non-political misleading posts (, ; 95% CI: ) are significantly negative. This means that the display of community notes generally leads to a decrease of surprise in replies to both political and non-political misleading posts.
Additionally, we examine the associations between the sentiments and emotions in replies and the original source sentiments and emotions across political and non-political misleading posts. We find that, in Fig. 6(a), the coefficient estimate of is not statistically significant for positive sentiment in replies to political misleading posts (, ; 95% CI: ), while it is significantly positive for positive sentiment in replies to non-political misleading posts (, ; 95% CI: ). Similarly, in Fig. 6(f), the coefficient estimate of is statistically not significant for joy in replies to political misleading posts (, ; 95% CI: ), while it is significantly positive for joy in replies to non-political misleading posts (, ; 95% CI: ). This suggests that the positive associations between positive sentiment (joy) and positive sentiment (joy) in replies disappear for political misleading posts. For negative sentiment (Fig. 6(b); politics: , ; 95% CI: ; non-politics: , ; 95% CI: ) and other emotions of anger (Fig. 6(c); politics: , ; 95% CI: ; non-politics: , ; 95% CI: ), disgust (Fig. 6(d); politics: , ; 95% CI: ; non-politics: , ; 95% CI: ), fear (Fig. 6(e); politics: , ; 95% CI: ; non-politics: , ; 95% CI: ), sadness (Fig. 6(g); politics: , ; 95% CI: ; non-politics: , ; 95% CI: ), and surprise (Fig. 6(h); politics: , ; 95% CI: ; non-politics: , ; 95% CI: ) in replies, they are positively associated with their corresponding ones in the source misleading posts, irrespective of political or non-political.
Finally, we find that the coefficient estimates of for positive sentiment (Fig. 6(a); politics: , ; 95% CI: ; non-politics: , ; 95% CI: ), negative sentiment (Fig. 6(b); politics: , ; 95% CI: ; non-politics: , ; 95% CI: ), anger (Fig. 6(c); politics: , ; 95% CI: ; non-politics: , ; 95% CI: ), disgust (Fig. 6(d); politics: , ; 95% CI: ; non-politics: , ; 95% CI: ), fear (Fig. 6(e); politics: , ; 95% CI: ; non-politics: , ; 95% CI: ), joy (Fig. 6(f); politics: , ; 95% CI: ; non-politics: , ; 95% CI: ), sadness (Fig. 6(g); politics: , ; 95% CI: ; non-politics: , ; 95% CI: ), and surprise (Fig. 6(h); politics: , ; 95% CI: ; non-politics: , ; 95% CI: ) in replies to either political or non-political misleading posts are consistently not significant. This suggests that the stability of sentiments and emotions over time is robust to politics.
Summary of findings: Taken together, we observe two aspects of our findings that are specific to political misleading posts: (i) The effects of community notes on the decrease of positive sentiment and the increase of disgust in replies only apply to political misleading posts; (ii) The transfer of positive sentiment, particularly joy, from source posts to replies is disrupted in discussions on political topics.
4.4. Analysis of Moral Outrage (RQ2.1 & RQ2.2)
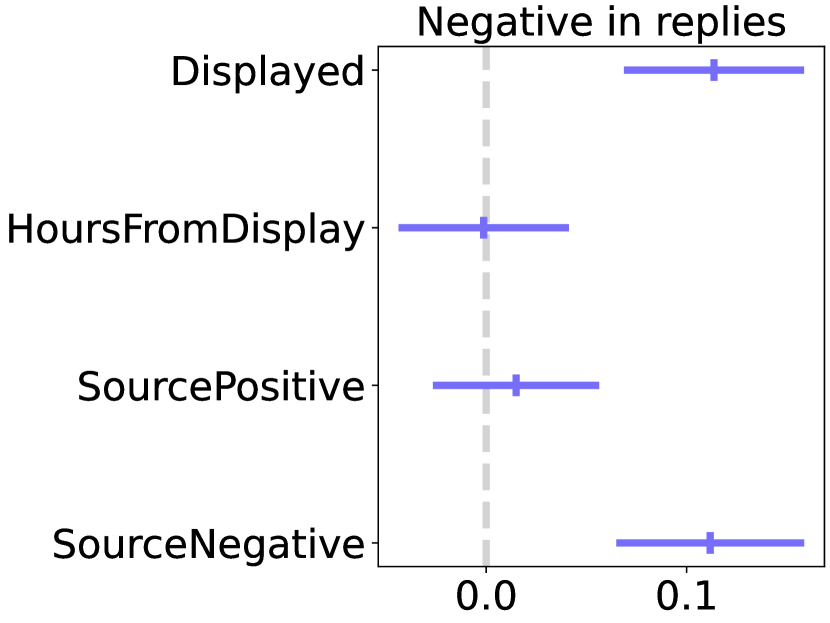
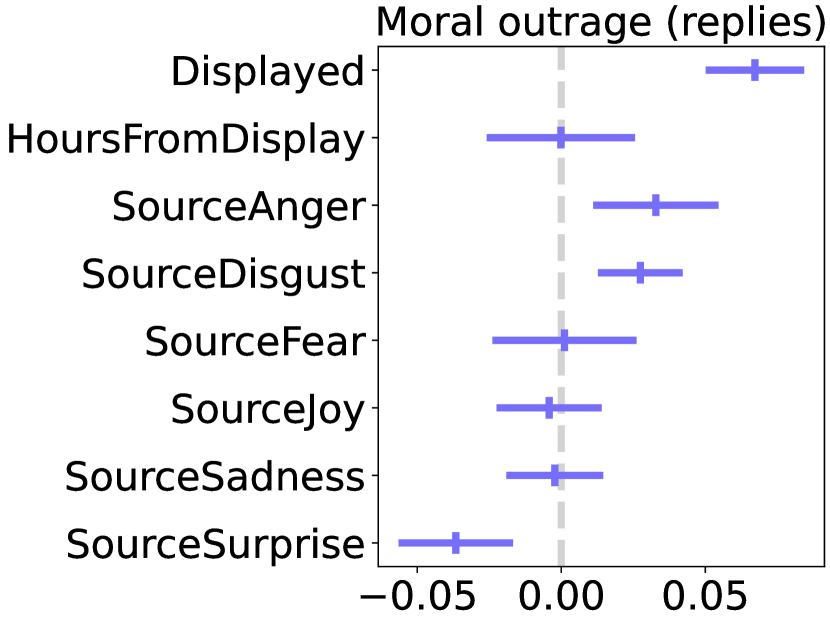
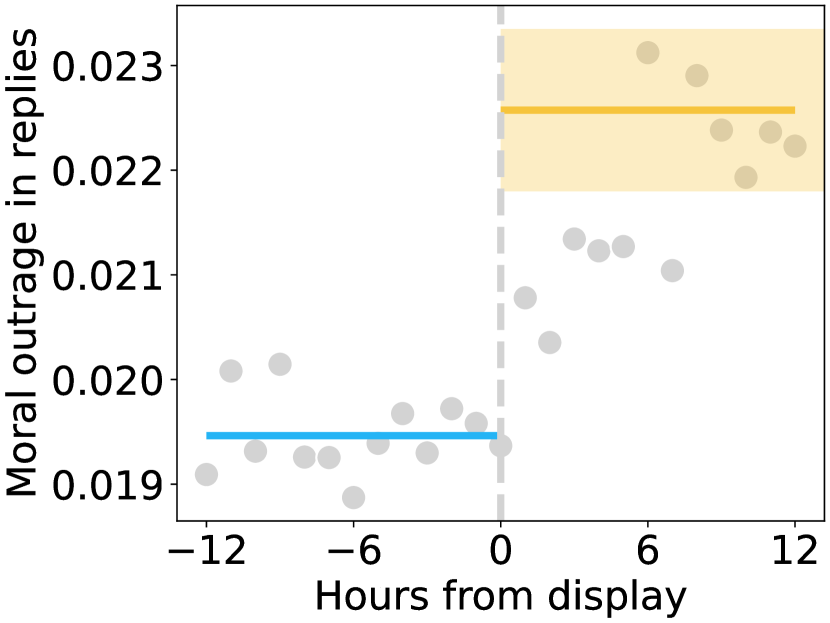
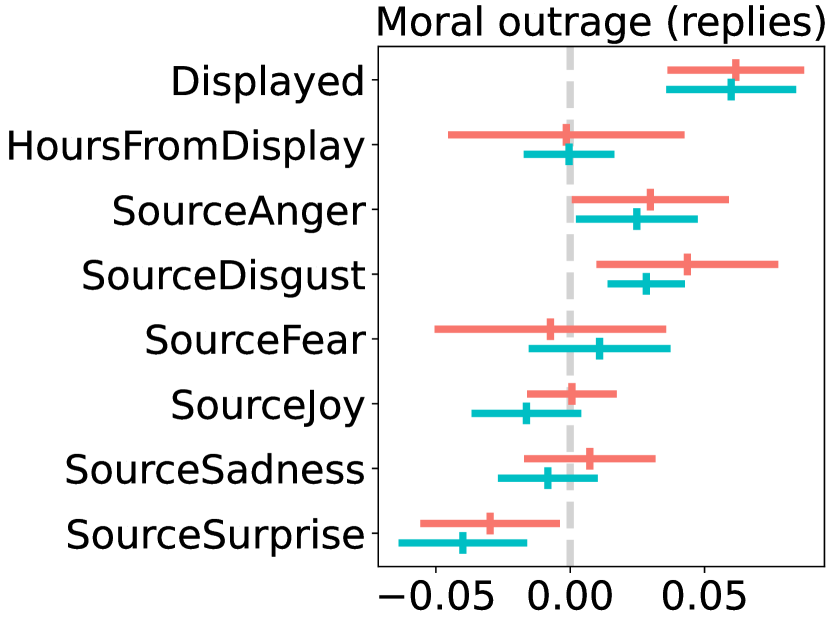
Given that moral outrage is typically expressed through anger and disgust, we examine whether the display of community notes triggers the moral outrage of users in their replies to misleading posts. Analogous to previous research (Crockett, 2017), we define the dependent variable moral outrage as . We first examine the changes of moral outrage in replies to all misleading posts. As shown in Fig. 7(a). the coefficient estimate of is significantly positive (, ; 95% CI: ). This means that the display of community notes increases moral outrage in replies to misleading posts by 0.003 (95% CI: ). Additionally, using the baseline of moral outrage during a period of 12 hours before note display (mean of 0.019, Fig. 7(b)), we find that the display of community notes triggers 16% more moral outrage in replies and increases it to 0.023 (95% CI: ).
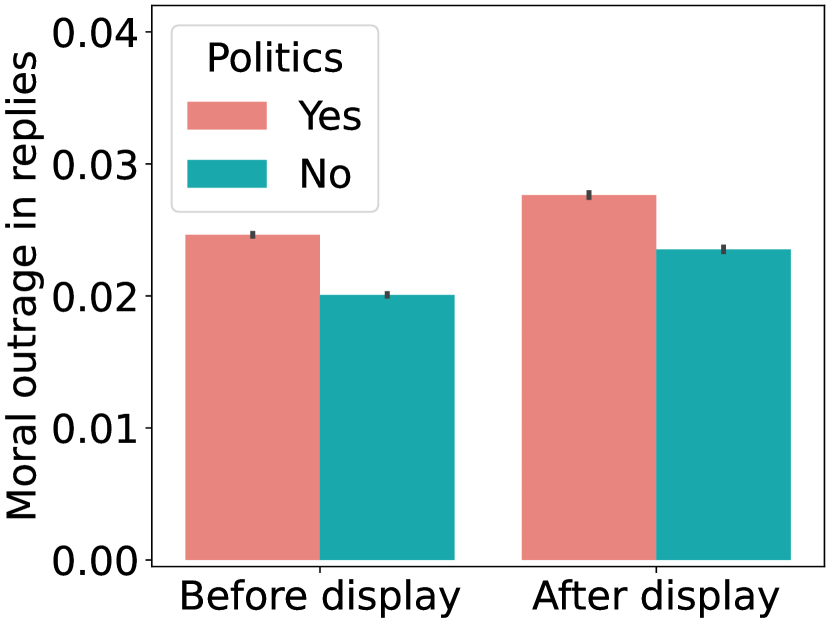
We further examine the effects of community notes display on moral outrage in replies to political and non-political misleading posts separately. As shown in Fig. 7(c), the coefficient estimates of are significantly positive within both political (, ; 95% CI: ) and non-political misleading posts (, ; 95% CI: ). This indicates that the effects of community notes in triggering moral outrage are robust across political and non-political misleading posts. Additionally, we analyze the average levels of moral outrage in replies to political and non-political misleading posts before and after the display of community notes (Fig. 7(d)). Before note display, the averages of moral outrage in replies to political and non-political misleading posts are 0.025 and 0.020, respectively (, ). After note display, these averages increase to 0.028 for political posts and 0.024 for non-political posts (, ). This suggests that the moral outrage in replies to political misleading posts is significantly higher than that in replies to non-political misleading posts, regardless of the display of community notes. However, the averages of moral outrage in the source posts between political (mean of 0.010) and non-political ones (mean of 0.009; , ) have no significant difference. This indicates that the heightened moral outrage in replies to political posts, compared to non-political posts, is not simply a transfer from the source posts’ moral outrage.
Validation: To further validate whether the measured moral outrage is primarily toward the misleading posts or their authors, we consider two scenarios where replies may not be directed toward original posts: mentions of other users (not authors) in replies and mentions of community notes in replies. If the level of moral outrage in these two scenarios is lower than in replies directed solely toward original posts, this would suggest that the moral outrage in replies is primarily focused on misleading content.
Social media users may mention other users (not authors) in their replies and shift the focus of the replies away from misleading posts. We find that the ratio of mentioning other users in replies after note display (10.4%) is lower than that in replies before note display (12.3%). Meanwhile, after note display, moral outrage in replies that do not mention others (mean of 0.028) is 180.0% more than that in replies that mention others (mean of 0.010; , ). Additionally, after the display of community notes, replies may discuss community notes rather than the original misleading posts. Given this, we check how many replies mention community notes after their display through the keywords: “community note” and “CN.” We find that, out of replies created after note display, only (0.6%) replies mention community notes. Moreover, moral outrage in replies that do not mention community notes (mean of 0.026) is 73.3% higher than the moral outrage in replies that mention community notes (mean of 0.015; , ). Taken together, the two validations suggest that the majority of replies, especially those with high moral outrage, are directed toward source misleading posts.
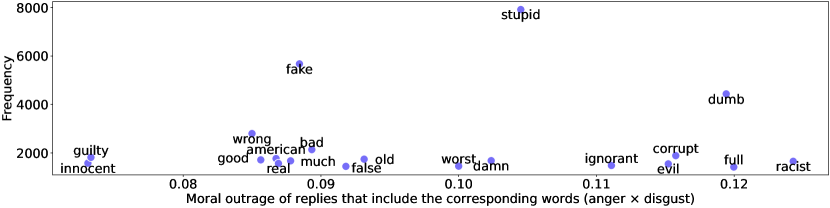
Furthermore, we analyze the most frequently used words in replies that express moral outrage. We extract all words from replies posted after note display, focusing on those with a higher level of moral outrage (i. e., above the mean value). The most frequent word in these replies is “you,” often indicating a direct reference to the post author. Subsequently, we remove stop words and use Spacy, a Python library for advanced natural language processing, to extract the twenty most frequent adjectives. Then, we calculate the average level of moral outrage for each word based on the replies that include it. Fig. 7(e) shows that “stupid,” “fake,” and “dumb” are the most frequent adjectives in replies expressing moral outrage, with mean values of 0.105, 0.088, and 0.119, respectively. Additionally, words associated with higher levels of moral outrage (greater than 0.100) tend to be more critical (e. g., racist, dumb, and corrupt), while words associated with lower levels of moral outrage (below 0.100) are more related to the veracity of the content (e. g., wrong, fake, and false). This suggests that higher levels of moral outrage are associated with the use of more critical or aggressive words.
Summary of findings: Altogether, our analysis suggests that the display of community notes triggers moral outrage in replies to the corresponding misleading posts. Additionally, political misleading posts tend to receive more moral outrage compared to non-political misleading posts. However, the effects of community notes on moral outrage in replies are robust across political and non-political misleading posts.
4.5. Robustness Checks
We conduct several additional robustness checks to ensure the reliability of our findings. (1) We check for possible multicollinearity issues through Variance Inflation Factors (VIFs). The VIFs are all close to one; and, thus well below the critical threshold of four (see details in Suppl. S5.1). (2) We incorporate month-year fixed effects into our regression models and repeat the analysis. We control for the month-year fixed effects based on the creation time of misleading posts and the creation time of replies separately. The results remain robust and consistent with our main findings (see details in Suppl. S5.2). (3) We repeat our analysis based on alternative sentiment and emotion lexicons. Specifically, we use the VADER lexicon for sentiments and the NRC lexicon for emotions. The results remain robust across machine learning models and lexicons (see details in Suppl. S5.3). (4) Given that the sentiments and emotions in community notes can potentially moderate the effects of community notes display, we incorporate sentiments and emotions in community notes and their interactions with into our regression models. The coefficient estimates of across the dependent variables remain robust. Additionally, the majority of the coefficient estimates for the interactions between sentiments (emotions) in community notes and are not statistically significant. This suggests that users’ emotional reactions are not significantly affected by the sentiments or emotions in community notes (see details in Suppl. S5.4).
4.6. Summary of Main Findings
In summary, we conduct a comprehensive causal analysis on the role of community notes in triggering sentiments, emotions, and moral outrage in replies to fact-checked social media posts. Furthermore, we extend our analysis by conducting sensitivity analysis across political and non-political misleading posts. Our main findings are as follows:
-
•
The display of community notes triggers 7.3% more negativity, 13.2% more anger, and 4.7% more disgust in replies to misleading posts (RQ1.1).
-
•
The effects of community notes on negativity and anger are robust across political and non-political misleading posts, while the effect on disgust only applies to political misleading posts (RQ1.2).
-
•
The display of community notes triggers 16% more moral outrage (RQ2.1), which is robust across political and non-political misleading posts (RQ2.2).
In addition to our main findings, we find the evidence of emotion transfers and time-independence for sentiments and emotions in online social networks:
-
•
The sentiments and emotions in replies to misleading posts are positively correlated with the sentiments and emotions of the corresponding source posts (with very few exceptions).
-
•
The sentiments and emotions in replies are stable over time if the posts are not subject to fact-checking (i. e., do not receive a displayed community note).
5. Discussion
5.1. Relevance
The spread of online misinformation has become a significant challenge that social media platforms have to tackle. However, traditional (expert-based) fact-checking approaches have limitations regarding their scalability and face trust issues among the user base. As a remedy, crowdsourced fact-checking represents a promising approach to identify misinformation at scale and increase users’ trust in fact-checks. As the first large-scale attempt of crowdsourced fact-checking approach on a major social media platform, the “Community Notes” program has been shown to be effective in producing trustworthy community fact-checks and reducing engagement with misleading posts on X (Chuai et al., 2024a; Drolsbach et al., 2024). It provides a reference for other social media platforms to implement similar crowdsourced fact-checking approaches (e. g., YouTube (YouTube, 2024)). However, to improve and extend the “Community Notes” program safely, it is important to understand how community notes affect the discussion environment after they are displayed on misleading posts, i. e., how users’ emotional expressions change after they are informed about the falsehood. To this end, our study causally examines the changes in emotional expressions in replies to misleading posts before and after the display of community notes. As detailed in the next sections, our findings provide important insights into the effects of (community-based) fact-checking on the discussion environment on social media and may help to improve the design of crowdsourced fact-checking platforms.
5.2. Interpretations
5.2.1. Community notes trigger negativity, anger, and disgust in replies to misleading posts.
We find that the display of community notes leads users to post more negative replies, which is primarily due to heightened expressions of anger and disgust. These observations align with previous survey and lab studies in the field of psychology that people often report anger and disgust in response to moral violations of community, autonomy, and divinity ethics (Molho et al., 2017; van der Eijk and Columbus, 2023). In the context of our study, the display of community notes signals to users that the posts they are exposed to spread misinformation, which may thereby trigger their perception of a moral violation. Anger and disgust, though both negative, differ in their aggressive tendencies when responding to moral violations. Anger is typically associated with high-cost, direct aggression (e. g., physical violence or confrontational responses), whereas disgust is typically associated with less costly indirect aggression (e. g., gossip and social exclusion). Additionally, previous research suggests that people tend to express more anger than disgust when moral violations directly affect themselves, while they express more disgust than anger when moral violations target others (Molho et al., 2017). Quantitatively, our findings reveal that the display of community notes increases anger in replies to misleading posts by 13.2%, compared to a 4.7% increase in disgust. Thus, users are more likely to express anger than disgust, which may indicate that users perceive the misleading content to primarily impact their own interests (rather than others’). Notably, our sensitivity analysis further reveals that the effect of community notes in increasing disgust is statistically significant only in replies to political misleading posts. This could partially explain why the display of community notes is less effective in reducing the spread of political misleading posts, compared to non-political ones, which has been observed in a previous study (Chuai et al., 2024a).
5.2.2. Community notes trigger moral outrage in replies to misleading posts.
When anger and disgust are mixed, they generate “moral outrage,” a more intense emotional reaction to perceived moral transgressions than either anger or disgust alone (Salerno and Peter-Hagene, 2013; Crockett, 2017; Brady et al., 2021). Our findings show that the display of community notes increases moral outrage by 16% in replies to misleading posts, a greater increase than those observed for anger (13.2%) and disgust (4.7%) individually. This empirical evidence underscores the significant role of moral outrage in users’ responses to the moral transgression of spreading misleading posts. Specifically, our findings suggest that displaying community notes on misleading posts is a strong stimulus that calls attention to the moral norm violation, thereby motivating expressions of moral outrage. Notably, research suggests that if users experience moral violations personally without such external stimuli, their intentions to express moral outrage might decrease (Crockett, 2017).
The expression of moral outrage to spreading misinformation is a double-edged sword that can both mitigate the harm of online misinformation and exacerbate the polarization of online communities. On the one hand, moral outrage can strengthen debunking effects on exposed users and pressure authors to correct or delete their misleading posts (Peng et al., 2023; Chuai et al., 2024a). Previous research has shown that the display of community notes significantly increases the likelihood of deleting misleading posts by their authors (Chuai et al., 2024a). Moreover, those who attempt to spread misinformation can expect strong negative reactions from the user base once their content is debunked, which may help to discipline users and encourage more responsible behavior on social media. On the other hand, social media platforms also need to maintain a healthy, inclusive, and balanced online environment. However, online moral outrage can deepen social divides and fuel political polarization (Crockett, 2017; Brady et al., 2021; Ecker et al., 2024). In this light, while moral outrage can be a powerful tool for combating misinformation, it has also the potential to escalate conflicts and entrench divisions within online communities. The potential negative effects of moral outrage triggered by community notes require a further rigorous examination to find a trade-off between mitigating the spread of misinformation and maintaining a positive discussion atmosphere.
5.2.3. Emotion transfers and stable emotional responses over time.
Our study provides strong empirical evidence supporting the idea that connected users on social media platforms express similar sentiments/emotions. Specifically, we find that all sentiments and emotions in misleading posts, especially non-political ones, are effectively transferred to subsequent sentiments and emotions in replies. This emotion transfer phenomenon can be explained primarily through two mechanisms: emotion contagion and emotion alignment (i. e., homophily) among connected users. Here, emotion contagion refers to the spreading effect of emotions from one user to another (Rosenbusch et al., 2019; Goldenberg and Gross, 2020), and emotion homophily indicates that like-minded users tend to flock together, potentially forming echo chambers that dominate online interactions and reinforce biases and attitude polarization (Cinelli et al., 2021). Our findings further reveal that the intensity of sentiments and emotions in replies remains stable over time, showing no signs of fading. Moreover, misleading posts fact-checked via community notes are predominantly characterized by negativity. The persistence of emotion transfers may further exacerbate these dynamics (Zollo et al., 2015; Del Vicario et al., 2016; Chuai and Zhao, 2022).
5.3. Implications for Further Design of Community-Based Fact-Checking
Community-based fact-checking is a promising approach and can effectively reduce engagement with misinformation on social media (Allen et al., 2021; Jahanbakhsh and Karger, 2024; Zhang et al., 2024; Chuai et al., 2024a; Drolsbach et al., 2024). However, our study finds that communicating falsehoods to users via community fact-checks can also trigger moral outrage in response to the perceived moral violation of spread misinformation. This heightened moral outrage can have dual impacts. On the one hand, it may strengthen the effectiveness of community-based fact-checking by pressuring (disciplining) users to reconsider their actions. On the other hand, however, it may also backfire by increasing tension and polarization on social media.
The dual role of moral outrage highlights the need to minimize its negative consequences without undermining its positive effects in the design and implementation of community-based fact-checking to maintain health and constructive dialogue on social media. Given this, social media platforms might consider implementing a temporary freezing period for misleading posts once they receive helpful community fact-checks. During this period – e. g., one hour – the misleading posts would be invisible to others, while the authors are notified, giving them time to delete or correct the misleading content. If they do not respond within the given timeframe, the community fact-checks with associated misleading posts would then be publicly on the platform. Similarly, platforms may consider temporarily limiting the ability to comment on posts flagged by community fact-checks. This could take the form of a complete ban on posting responses during this period or a personal delay, where written comments are visible to others only after a certain period. In general, platforms may need to emphasize community guidelines in heated/morally charged discussions (e. g., labels/brief prompts that appear when a user is about to post a highly emotional response; or additional monitoring by moderation teams).
5.4. Limitations and Future Research
Our study has several limitations that could open up potential avenues for future research. First, our study is limited to a 4-month period since the roll-out of the “Community Notes” program. As the program is continually evolving, it would be valuable to examine the effects of community notes on sentiments, emotions, and moral outrage over a longer observation timeframe.666Notably, we collected our dataset via the X/Twitter Academic Research API before it was deprecated. Currently, it is costly to collect such a high volume of data from X/Twitter.
Second, on the date of data collection, the “Community Notes” program was primarily well-established in the U.S., and the fact-checked posts were mainly in English. Consequently, we only consider English posts in our study. In the future, a multilingual and cross-cultural evaluation would be beneficial to get a more comprehensive understanding of how community notes impact users’ emotional reactions across languages and cultures.
Third, our measurement of moral outrage cannot definitively ascertain whether it is directed toward misleading posts or their authors. To validate our approach, we analyze two special cases: mentions of other users and mentions of community notes in replies. We find that the moral outrage in replies that mention other users or community notes is significantly lower than the moral outrage in replies that solely react to the misleading posts and do not mention other users or community notes. Additionally, replies with high moral outrage frequently use aggressive words (e. g., “stupid,” “dumb”). All of these analyses support the notion that community notes trigger moral outrage and critical remarks to misleading posts or their authors. Future research could further validate our findings through more advanced subject-aware emotion detection models.
Finally, it has been found that the display of community notes increases the probability of post deletion by authors (Chuai et al., 2024a). A possible contributing factor may be that expressions of moral outrage pressure authors to delete their misleading posts. This notion could be validated through the examination of moral outrage in replies to deleted and non-deleted posts. However, deleted misleading posts and corresponding replies cannot be collected through X’s API. As a remedy, future research could conduct lab experiments to causally examine whether expressions of moral outrage increase authors’ intentions to delete their misleading posts. Additionally, it would be interesting to further examine how the authors of misleading posts adapt their future behaviors on social media.
6. Conclusion
Community-based fact-checking is a promising approach to reduce engagement with misinformation on social media. Yet, an understanding of how community fact-checks affect users’ emotional perception of misleading posts and their authors was missing. In this study, we analyze a large-scale panel dataset of replies to misleading posts that have been fact-checked via community notes. Our findings provide strong causal evidence that community fact-checks trigger moral outrage in replies to misleading posts. This suggests that social media users perceive spreading misinformation as moral transgressions, and that spreaders of misinformation should expect negative responses once their content is debunked. Our study highlights the need for further examination of both the positive and negative consequences of such emotional backlash.
7. Ethics Statement
This research has received ethical approval from the Ethics Review Panel of the University of Luxembourg (ref. ERP 23-053 REMEDIS). All analyses are based on publicly available data. To respect privacy, we explicitly do not publish usernames in our paper and only report aggregate results. We declare no competing interests.
Acknowledgements.
This research is supported by the Luxembourg National Research Fund (FNR) and Belgian National Fund for Scientific Research (FNRS), as part of the project REgulatory Solutions to MitigatE DISinformation (REMEDIS), grant ref. INTER_FNRS_21_16554939_REMEDIS. Furthermore, this research is supported by a research grant from the German Research Foundation (DFG grant 492310022).References
- (1)
- Allcott and Gentzkow (2017) Hunt Allcott and Matthew Gentzkow. 2017. Social media and fake news in the 2016 election. Journal of Economic Perspectives 31, 2 (2017), 211–236.
- Allen et al. (2021) Jennifer Allen, Antonio A Arechar, Gordon Pennycook, and David G Rand. 2021. Scaling up fact-checking using the wisdom of crowds. Science Advances 7, 36 (2021), eabf4393.
- Allen et al. (2022) Jennifer Allen, Cameron Martel, and David G Rand. 2022. Birds of a feather don’t fact-check each other: Partisanship and the evaluation of news in Twitter’s Birdwatch crowdsourced fact-checking program. In CHI.
- Altay et al. (2023) Sacha Altay, Manon Berriche, and Alberto Acerbi. 2023. Misinformation on misinformation: Conceptual and methodological challenges. Social Media + Society 9, 1 (2023), 20563051221150412.
- Angrist and Pischke (2009) Joshua D Angrist and Jörn-Steffen Pischke. 2009. Mostly harmless econometrics: An empiricist’s companion. Princeton University Press.
- Aral and Eckles (2019) Sinan Aral and Dean Eckles. 2019. Protecting elections from social media manipulation. Science 365, 6456 (2019), 858–861.
- Berger and Milkman (2012) Jonah Berger and Katherine L Milkman. 2012. What makes online content viral? Journal of Marketing Research 49, 2 (2012), 192–205.
- Bhuiyan et al. (2020) Md Momen Bhuiyan, Amy X Zhang, Connie Moon Sehat, and Tanushree Mitra. 2020. Investigating differences in crowdsourced news credibility assessment: Raters, tasks, and expert criteria. In CSCW.
- Brady et al. (2021) William J Brady, Killian McLoughlin, Tuan N Doan, and Molly J Crockett. 2021. How social learning amplifies moral outrage expression in online social networks. Science Advances 7, 33 (2021), eabe5641.
- Brady et al. (2023) William J Brady, Killian L McLoughlin, Mark P Torres, Kara F Luo, Maria Gendron, and MJ Crockett. 2023. Overperception of moral outrage in online social networks inflates beliefs about intergroup hostility. Nature Human Behaviour 7, 6 (2023), 917–927.
- Brady et al. (2017) William J Brady, Julian A Wills, John T Jost, Joshua A Tucker, and Jay J Van Bavel. 2017. Emotion shapes the diffusion of moralized content in social networks. Proceedings of the National Academy of Sciences 114, 28 (2017), 7313–7318.
- Brannon and Roy (2024) William Brannon and Deb Roy. 2024. The speed of news in Twitter (X) versus radio. Scientific Reports 14, 1 (2024), 11939.
- Budak et al. (2024) Ceren Budak, Brendan Nyhan, David M Rothschild, Emily Thorson, and Duncan J Watts. 2024. Misunderstanding the harms of online misinformation. Nature 630, 8015 (2024), 45–53.
- Butt et al. (2022) Sabur Butt, Shakshi Sharma, Rajesh Sharma, Grigori Sidorov, and Alexander Gelbukh. 2022. What goes on inside rumour and non-rumour tweets and their reactions: A psycholinguistic analyses. Computers in Human Behavior 135 (2022), 107345.
- Camacho-collados et al. (2022) Jose Camacho-collados, Kiamehr Rezaee, Talayeh Riahi, Asahi Ushio, Daniel Loureiro, Dimosthenis Antypas, Joanne Boisson, Luis Espinosa Anke, Fangyu Liu, and Eugenio Martínez Cámara. 2022. TweetNLP: Cutting-edge natural language processing for social media. In EMNLP: System Demonstrations.
- Chuai et al. (2022) Yuwei Chuai, Yutian Chang, and Jichang Zhao. 2022. What really drives the spread of COVID-19 Tweets: A revisit from perspective of content. In DSAA.
- Chuai et al. (2024a) Yuwei Chuai, Moritz Pilarski, Gabriele Lenzini, and Nicolas Pröllochs. 2024a. Community notes reduce the spread of misleading posts on X. In OSF.
- Chuai et al. (2024b) Yuwei Chuai, Haoye Tian, Nicolas Pröllochs, and Gabriele Lenzini. 2024b. Did the roll-out of Community Notes reduce engagement with misinformation on X/Twitter?. In CSCW.
- Chuai and Zhao (2022) Yuwei Chuai and Jichang Zhao. 2022. Anger can make fake news viral online. Frontiers in Physics 10 (2022), 970174.
- Chuai et al. (2024c) Yuwei Chuai, Jichang Zhao, and Gabriele Lenzini. 2024c. From news sharers to post viewers: How topic diversity and conspiracy theories shape engagement with misinformation during a health crisis? ArXiv (2024).
- Chuai et al. (2023) Yuwei Chuai, Jichang Zhao, Nicolas Pröllochs, and Gabriele Lenzini. 2023. Political elites in false statements on the internet. ArXiv (2023).
- Cinelli et al. (2021) Matteo Cinelli, Gianmarco De Francisci Morales, Alessandro Galeazzi, Walter Quattrociocchi, and Michele Starnini. 2021. The echo chamber effect on social media. Proceedings of the National Academy of Sciences 118, 9 (2021), e2023301118.
- Clayton et al. (2020) Katherine Clayton, Spencer Blair, Jonathan A Busam, Samuel Forstner, John Glance, Guy Green, Anna Kawata, Akhila Kovvuri, Jonathan Martin, Evan Morgan, et al. 2020. Real solutions for fake news? Measuring the effectiveness of general warnings and fact-check tags in reducing belief in false stories on social media. Political Behavior 42 (2020), 1073–1095.
- Crockett (2017) Molly J Crockett. 2017. Moral outrage in the digital age. Nature Human Behaviour 1, 11 (2017), 769–771.
- Dahlke and Hancock (2024) Ross Dahlke and Jeffrey Hancock. 2024. Effects of misinformation on election beliefs: Disentangling motivated reasoning from selective exposure. OSF 17 (2024).
- Del Vicario et al. (2016) Michela Del Vicario, Gianna Vivaldo, Alessandro Bessi, Fabiana Zollo, Antonio Scala, Guido Caldarelli, and Walter Quattrociocchi. 2016. Echo chambers: Emotional contagion and group polarization on facebook. Scientific Reports 6, 1 (2016), 37825.
- Deloitte (2021) Deloitte. 2021. Are younger generations moving away from traditional news sources? https://www.forbes.com/sites/kenrapoza/2017/02/26/can-fake-news-impact-the-stock-market/.
- Donovan (2020) Joan Donovan. 2020. Social-media companies must flatten the curve of misinformation. Nature (2020).
- Drolsbach and Pröllochs (2023) Chiara Patricia Drolsbach and Nicolas Pröllochs. 2023. Believability and harmfulness shape the virality of misleading social media posts. In WWW. https://doi.org/10.1145/3543507.3583857
- Drolsbach et al. (2024) Chiara Patricia Drolsbach, Kirill Solovev, and Nicolas Pröllochs. 2024. Community notes increase trust in fact-checking on social media. PNAS Nexus (2024), pgae217.
- Ecker et al. (2024) Ullrich Ecker, Jon Roozenbeek, Sander van der Linden, Li Qian Tay, John Cook, Naomi Oreskes, and Stephan Lewandowsky. 2024. Misinformation poses a bigger threat to democracy than you might think. Nature 630, 8015 (2024), 29–32.
- Ecker et al. (2022) Ullrich KH Ecker, Stephan Lewandowsky, John Cook, Philipp Schmid, Lisa K Fazio, Nadia Brashier, Panayiota Kendeou, Emily K Vraga, and Michelle A Amazeen. 2022. The psychological drivers of misinformation belief and its resistance to correction. Nature Reviews Psychology 1, 1 (2022), 13–29.
- Ekman (1992) Paul Ekman. 1992. An argument for basic emotions. Cognition & Emotion 6, 3-4 (1992), 169–200.
- Ekman et al. (2013) Paul Ekman, Wallace V Friesen, and Phoebe Ellsworth. 2013. Emotion in the human face: Guidelines for research and an integration of findings. Vol. 11. Elsevier.
- Enders et al. (2022) Adam M. Enders, Joseph Uscinski, Casey Klofstad, and Justin Stoler. 2022. On the relationship between conspiracy theory beliefs, misinformation, and vaccine hesitancy. PLOS One 17, 10 (2022), e0276082.
- Epstein et al. (2020) Ziv Epstein, Gordon Pennycook, and David Rand. 2020. Will the crowd game the algorithm? Using layperson judgments to combat misinformation on social media by downranking distrusted sources. In CHI.
- Feuerriegel et al. (2023) Stefan Feuerriegel, Renée DiResta, Josh A Goldstein, Srijan Kumar, Philipp Lorenz-Spreen, Michael Tomz, and Nicolas Pröllochs. 2023. Research can help to tackle AI-generated disinformation. Nature Human Behaviour 7, 11 (2023), 1818–1821.
- Flamini (2019) Daniela Flamini. 2019. Most Republicans don’t trust fact-checkers, and most Americans don’t trust the media. https://www.poynter.org/ifcn/2019/most-republicans-dont-trust-fact-checkers-and-most-americans-dont-trust-the-media/.
- Forum (2024) World Economic Forum. 2024. Global risks report. https://www.weforum.org/publications/global-risks-report-2024/.
- Gamage et al. (2022) Dilrukshi Gamage, Piyush Ghasiya, Vamshi Bonagiri, Mark E Whiting, and Kazutoshi Sasahara. 2022. Are deepfakes concerning? Analyzing conversations of deepfakes on reddit and exploring societal implications. In CHI.
- Goldenberg and Gross (2020) Amit Goldenberg and James J Gross. 2020. Digital emotion contagion. Trends in Cognitive Sciences 24, 4 (2020), 316–328.
- Green et al. (2022) Jon Green, William Hobbs, Stefan McCabe, and David Lazer. 2022. Online engagement with 2020 election misinformation and turnout in the 2021 Georgia runoff election. Proceedings of the National Academy of Sciences 119, 34 (2022), e2115900119.
- Haidt et al. (2003) Jonathan Haidt et al. 2003. The moral emotions. Handbook of Affective Sciences 11, 2003 (2003), 852–870.
- Haque et al. (2020) Md Mahfuzul Haque, Mohammad Yousuf, Ahmed Shatil Alam, Pratyasha Saha, Syed Ishtiaque Ahmed, and Naeemul Hassan. 2020. Combating misinformation in Bangladesh: Roles and responsibilities as perceived by journalists, fact-checkers, and users. In CSCW.
- Hart et al. (2020) P Sol Hart, Sedona Chinn, and Stuart Soroka. 2020. Politicization and polarization in COVID-19 news coverage. Science Communication 42, 5 (2020), 679–697.
- Hartmann (2022) Jochen Hartmann. 2022. Emotion english DistilRoBERTa-base. https://huggingface.co/j-hartmann/emotion-english-distilroberta-base/.
- Hassoun et al. (2023) Amelia Hassoun, Ian Beacock, Sunny Consolvo, Beth Goldberg, Patrick Gage Kelley, and Daniel M Russell. 2023. Practicing information sensibility: How Gen Z engages with online information. In CHI.
- Heuer and Glassman (2022) Hendrik Heuer and Elena Leah Glassman. 2022. A comparative evaluation of interventions against misinformation: Augmenting the WHO checklist. In CHI.
- Hutto and Gilbert (2014) Clayton Hutto and Eric Gilbert. 2014. VADER: A parsimonious rule-based model for sentiment analysis of social media text. In ICWSM.
- Jahanbakhsh and Karger (2024) Farnaz Jahanbakhsh and David R Karger. 2024. A browser extension for in-place signaling and assessment of misinformation. In CHI.
- Juneja et al. (2023) Prerna Juneja, Md Momen Bhuiyan, and Tanushree Mitra. 2023. Assessing enactment of content regulation policies: A post hoc crowd-sourced audit of election misinformation on YouTube. In CHI.
- Karusala and Anderson (2022) Naveena Karusala and Richard Anderson. 2022. Towards conviviality in navigating health information on social media. In CHI.
- Kozyreva et al. (2023) Anastasia Kozyreva, Stefan M Herzog, Stephan Lewandowsky, Ralph Hertwig, Philipp Lorenz-Spreen, Mark Leiser, and Jason Reifler. 2023. Resolving content moderation dilemmas between free speech and harmful misinformation. Proceedings of the National Academy of Sciences 120, 7 (2023), e2210666120.
- Kramer et al. (2014) Adam DI Kramer, Jamie E Guillory, and Jeffrey T Hancock. 2014. Experimental evidence of massive-scale emotional contagion through social networks. Proceedings of the National Academy of Sciences 111, 24 (2014), 8788–8790.
- Lazer et al. (2018) David MJ Lazer, Matthew A Baum, Yochai Benkler, Adam J Berinsky, Kelly M Greenhill, Filippo Menczer, Miriam J Metzger, Brendan Nyhan, Gordon Pennycook, David Rothschild, and others. 2018. The science of fake news. Science 359, 6380 (2018), 1094–1096.
- Lee et al. (2023) Sian Lee, Aiping Xiong, Haeseung Seo, and Dongwon Lee. 2023. “Fact-checking” fact checkers: A data-driven approach. Harvard Kennedy School Misinformation Review (2023).
- Lerner et al. (2015) Jennifer S Lerner, Ye Li, Piercarlo Valdesolo, and Karim S Kassam. 2015. Emotion and decision making. Annual Review of Psychology 66, 1 (2015), 799–823.
- Loureiro et al. (2022) Daniel Loureiro, Francesco Barbieri, Leonardo Neves, Luis Espinosa Anke, and Jose Camacho-collados. 2022. TimeLMs: Diachronic language models from Twitter. In ACL: System Demonstrations.
- Martel et al. (2020) Cameron Martel, Gordon Pennycook, and David G Rand. 2020. Reliance on emotion promotes belief in fake news. Cognitive Research: Principles and Implications 5 (2020), 1–20.
- McClure Haughey et al. (2022) Melinda McClure Haughey, Martina Povolo, and Kate Starbird. 2022. Bridging contextual and methodological gaps on the “misinformation beat”: Insights from journalist-researcher collaborations at speed. In CHI.
- Meta (2024) Meta. 2024. Meta’s third-party fact-checking program. https://www.facebook.com/formedia/mjp/programs/third-party-fact-checking
- Micallef et al. (2022) Nicholas Micallef, Vivienne Armacost, Nasir Memon, and Sameer Patil. 2022. True or false: Studying the work practices of professional fact-checkers. In CSCW.
- Micallef et al. (2020) Nicholas Micallef, Bing He, Srijan Kumar, Mustaque Ahamad, and Nasir Memon. 2020. The role of the crowd in countering misinformation: A case study of the COVID-19 infodemic. In BigData.
- Mohammad and Turney (2013) Saif M. Mohammad and Peter D. Turney. 2013. Crowdsourcing a word–emotion association lexicon. Computational Intelligence 29, 3 (2013), 436–465.
- Molho et al. (2017) Catherine Molho, Joshua M Tybur, Ezgi Güler, Daniel Balliet, and Wilhelm Hofmann. 2017. Disgust and anger relate to different aggressive responses to moral violations. Psychological Science 28, 5 (2017), 609–619.
- Neumann and Rhodes (2024) Dominik Neumann and Nancy Rhodes. 2024. Morality in social media: A scoping review. New Media & Society 26, 2 (2024), 1096–1126.
- of Professional Journalists (2014) Society of Professional Journalists. 2014. Code of ethics. https://www.spj.org/ethicscode.asp
- Pang et al. (2008) Bo Pang, Lillian Lee, et al. 2008. Opinion mining and sentiment analysis. Foundations and Trends® in Information Retrieval 2, 1–2 (2008), 1–135.
- Peng et al. (2023) Kun Peng, Yu Zheng, Yuewei Qiu, and Qingrui Li. 2023. Rage of righteousness: Anger’s role in promoting debunking effects during the COVID-19 pandemic. Computers in Human Behavior 148 (2023), 107896.
- Pennycook and Rand (2019) Gordon Pennycook and David G Rand. 2019. Fighting misinformation on social media using crowdsourced judgments of news source quality. Proceedings of the National Academy of Sciences 116, 7 (2019), 2521–2526.
- Pierri et al. (2022) Francesco Pierri, Brea L. Perry, Matthew R. DeVerna, Kai-Cheng Yang, Alessandro Flammini, Filippo Menczer, and John Bryden. 2022. Online misinformation is linked to early COVID-19 vaccination hesitancy and refusal. Scientific Reports 12, 1 (2022), 5966.
- Porter and Wood (2021) Ethan Porter and Thomas J Wood. 2021. The global effectiveness of fact-checking: Evidence from simultaneous experiments in Argentina, Nigeria, South Africa, and the United Kingdom. Proceedings of the National Academy of Sciences 118, 37 (2021), e2104235118.
- Pröllochs et al. (2021) Nicolas Pröllochs, Dominik Bär, and Stefan Feuerriegel. 2021. Emotions explain differences in the diffusion of true vs. false social media rumors. Scientific Reports 11, 1 (2021), 22721.
- Rathje et al. (2021) Steve Rathje, Jay J. Van Bavel, and Sander van der Linden. 2021. Out-group animosity drives engagement on social media. Proceedings of the National Academy of Sciences 118, 26 (2021), e2024292118.
- Recuero et al. (2020) Raquel Recuero, Felipe Bonow Soares, and Anatoliy Gruzd. 2020. Hyperpartisanship, disinformation and political conversations on Twitter: The Brazilian presidential election of 2018. In ICWSM.
- Robertson et al. (2023) Claire E Robertson, Nicolas Pröllochs, Kaoru Schwarzenegger, Philip Pärnamets, Jay J Van Bavel, and Stefan Feuerriegel. 2023. Negativity drives online news consumption. Nature Human Behaviour 7, 5 (2023), 812–822.
- Rosenbusch et al. (2019) Hannes Rosenbusch, Anthony M Evans, and Marcel Zeelenberg. 2019. Multilevel emotion transfer on YouTube: Disentangling the effects of emotional contagion and homophily on video audiences. Social Psychological and Personality Science 10, 8 (2019), 1028–1035.
- Rost et al. (2016) Katja Rost, Lea Stahel, and Bruno S Frey. 2016. Digital social norm enforcement: Online firestorms in social media. PLOS One 11, 6 (2016), e0155923.
- Rozado et al. (2022) David Rozado, Ruth Hughes, and Jamin Halberstadt. 2022. Longitudinal analysis of sentiment and emotion in news media headlines using automated labelling with Transformer language models. Plos One 17, 10 (2022), e0276367.
- Saeed et al. (2022) Mohammed Saeed, Nicolas Traub, Maelle Nicolas, Gianluca Demartini, and Paolo Papotti. 2022. Crowdsourced fact-checking at Twitter: How does the crowd compare with experts?. In CIKM.
- Salerno and Peter-Hagene (2013) Jessica M Salerno and Liana C Peter-Hagene. 2013. The interactive effect of anger and disgust on moral outrage and judgments. Psychological Science 24, 10 (2013), 2069–2078.
- Sang et al. (2020) Yoonmo Sang, Jee Young Lee, Sora Park, Caroline Fisher, and Glen Fuller. 2020. Signalling and expressive interaction: Online news users’ different modes of interaction on digital platforms. Digital Journalism 8, 4 (2020), 467–485.
- Sauter et al. (2010) Disa A Sauter, Frank Eisner, Paul Ekman, and Sophie K Scott. 2010. Cross-cultural recognition of basic emotions through nonverbal emotional vocalizations. Proceedings of the National Academy of Sciences 107, 6 (2010), 2408–2412.
- Schaffner et al. (2024) Brennan Schaffner, Arjun Nitin Bhagoji, Siyuan Cheng, Jacqueline Mei, Jay L Shen, Grace Wang, Marshini Chetty, Nick Feamster, Genevieve Lakier, and Chenhao Tan. 2024. ”Community guidelines make this the best party on the internet”: An in-depth study of online platforms’ content moderation policies. In CHI.
- Shah et al. (2020) Zakir Shah, Jianxun Chu, Sara Qaisar, Zameer Hassan, and Usman Ghani. 2020. Perceived public condemnation and avoidance intentions: The mediating role of moral outrage. Journal of Public Affairs 20, 1 (2020), e2027.
- Solovev and Pröllochs (2022) Kirill Solovev and Nicolas Pröllochs. 2022. Moral emotions shape the virality of COVID-19 misinformation on social media. In WWW.
- SSRS (2023) SSRS. 2023. CNN Poll on Biden, economy and elections. https://www.documentcloud.org/documents/23895856-cnn-poll-on-biden-economy-and-elections
- Statista (2024) Statista. 2024. Number of internet and social media users worldwide as of July 2024. https://www.statista.com/statistics/617136/digital-population-worldwide/.
- Stieglitz and Dang-Xuan (2013) Stefan Stieglitz and Linh Dang-Xuan. 2013. Emotions and information diffusion in social media—sentiment of microblogs and sharing behavior. Journal of Management Information Systems 29, 4 (2013), 217–248.
- Strathern et al. (2020) Wienke Strathern, Mirco Schoenfeld, Raji Ghawi, and Juergen Pfeffer. 2020. Against the others! Detecting moral outrage in social media networks. In ASONAM.
- Tang et al. (2024) Huiyun Tang, Gabriele Lenzini, Samuel Greiff, Björn Rohles, and Anastasia Sergeeva. 2024. “Who knows? Maybe it really works”: Analysing users’ perceptions of health misinformation on social media. In DIS.
- Van Bavel et al. (2024) Jay J Van Bavel, Claire E Robertson, Kareena Del Rosario, Jesper Rasmussen, and Steve Rathje. 2024. Social media and morality. Annual Review of Psychology 75, 1 (2024), 311–340.
- Van de Vyver and Abrams (2015) Julie Van de Vyver and Dominic Abrams. 2015. Testing the prosocial effectiveness of the prototypical moral emotions: Elevation increases benevolent behaviors and outrage increases justice behaviors. Journal of Experimental Social Psychology 58 (2015), 23–33.
- van der Eijk and Columbus (2023) Frances van der Eijk and Simon Columbus. 2023. Expressions of moral disgust reflect both disgust and anger. Cognition and Emotion 37, 3 (2023), 499–514.
- Varanasi et al. (2022) Rama Adithya Varanasi, Joyojeet Pal, and Aditya Vashistha. 2022. Accost, accede, or amplify: Attitudes towards COVID-19 misinformation on WhatsApp in India. In CHI.
- Vosoughi et al. (2018) Soroush Vosoughi, Deb Roy, and Sinan Aral. 2018. The spread of true and false news online. Science 359, 6380 (2018), 1146–1151.
- Wilner et al. (2023) Tamar Wilner, Kayo Mimizuka, Ayesha Bhimdiwala, Jason C Young, and Ahmer Arif. 2023. It’s about time: Attending to temporality in misinformation interventions. In CHI.
- Wojcik et al. (2022) Stefan Wojcik, Sophie Hilgard, Nick Judd, Delia Mocanu, Stephen Ragain, MB Hunzaker, Keith Coleman, and Jay Baxter. 2022. Birdwatch: Crowd wisdom and bridging algorithms can inform understanding and reduce the spread of misinformation. ArXiv (2022).
- Yadollahi et al. (2017) Ali Yadollahi, Ameneh Gholipour Shahraki, and Osmar R Zaiane. 2017. Current state of text sentiment analysis from opinion to emotion mining. ACM Computing Surveys (CSUR) 50, 2 (2017), 1–33.
- Yaqub et al. (2020) Waheeb Yaqub, Otari Kakhidze, Morgan L Brockman, Nasir Memon, and Sameer Patil. 2020. Effects of credibility indicators on social media news sharing intent. In CHI.
- YouTube (2024) YouTube. 2024. Testing new ways to offer viewers more context and information on videos. https://blog.youtube/news-and-events/new-ways-to-offer-viewers-more-context/
- Zhang et al. (2023) Yixuan Zhang, Joseph D Gaggiano, Nutchanon Yongsatianchot, Nurul M Suhaimi, Miso Kim, Yifan Sun, Jacqueline Griffin, and Andrea G Parker. 2023. What do we mean when we talk about trust in social media? A systematic review. In CHI.
- Zhang et al. (2024) Yixuan Zhang, Yimeng Wang, Nutchanon Yongsatianchot, Joseph D Gaggiano, Nurul M Suhaimi, Anne Okrah, Miso Kim, Jacqueline Griffin, and Andrea G Parker. 2024. Profiling the dynamics of trust & distrust in social media: A survey study. In CHI.
- Zhou et al. (2023) Jiawei Zhou, Yixuan Zhang, Qianni Luo, Andrea G Parker, and Munmun De Choudhury. 2023. Synthetic lies: Understanding AI-generated misinformation and evaluating algorithmic and human solutions. In CHI.
- Zollo et al. (2015) Fabiana Zollo, Petra Kralj Novak, Michela Del Vicario, Alessandro Bessi, Igor Mozetič, Antonio Scala, Guido Caldarelli, and Walter Quattrociocchi. 2015. Emotional dynamics in the age of misinformation. PLOS One 10, 9 (2015), e0138740.
Supplementary Materials for “Community Fact-Checks Trigger Moral Outrage in Replies to Misleading Posts on Social Media”
Appendix S1 Data Overview
S1.1. Correlations Between Sentiments and Emotions in Source Posts and Sentiments and Emotions in Replies
Given the potential emotion transfers from source posts to their replies, we analyze the correlations between source sentiments and emotions in the misleading posts and the subsequent sentiments and emotions in the replies. Of note, the replies after the display of community notes are excluded in the analysis of emotion transfers to prevent the potential contamination of note display. We find that all the sentiments and emotions in replies are positively correlated to the corresponding source sentiments and emotions in the misleading posts (see Fig. S1).
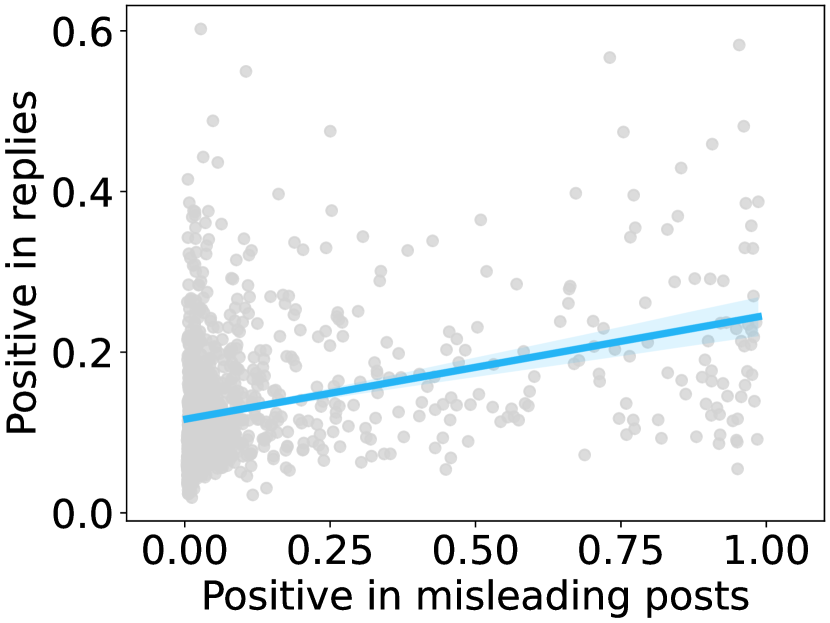
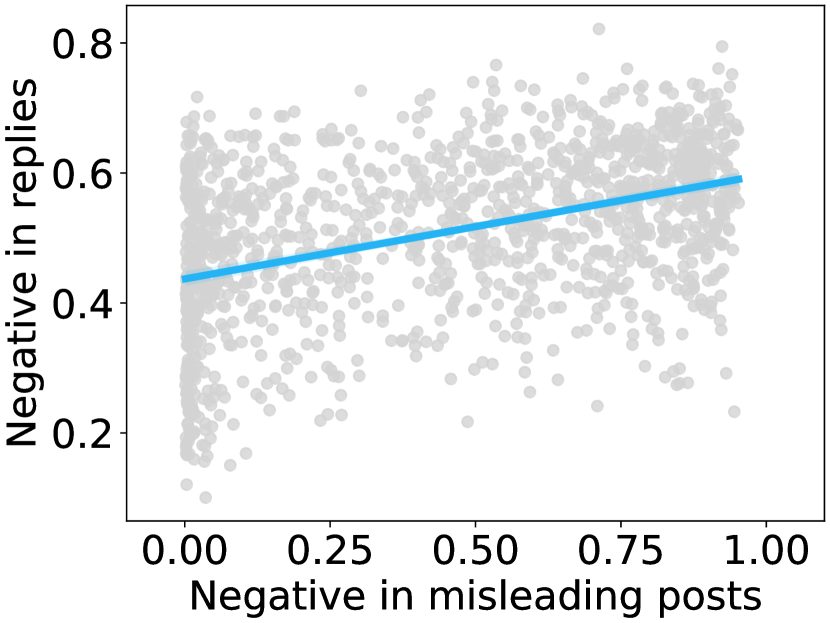
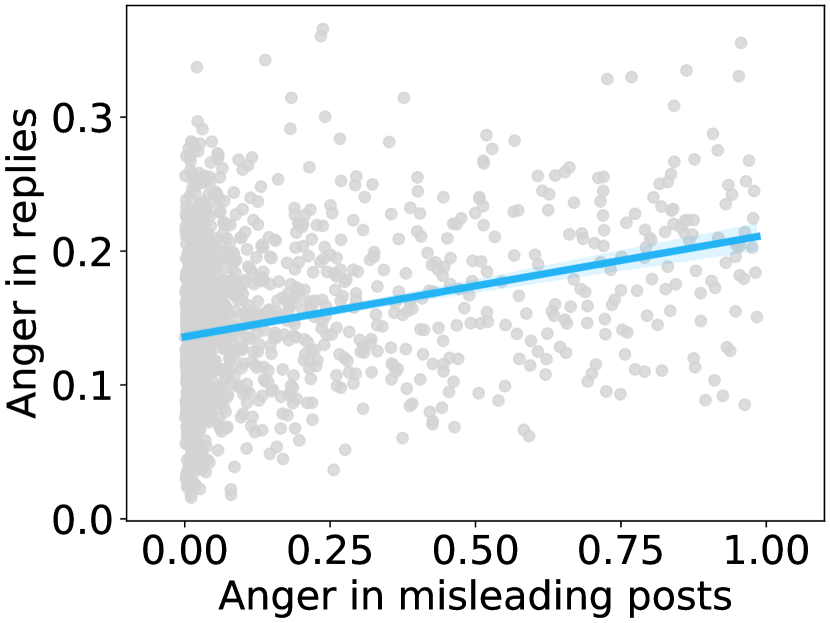
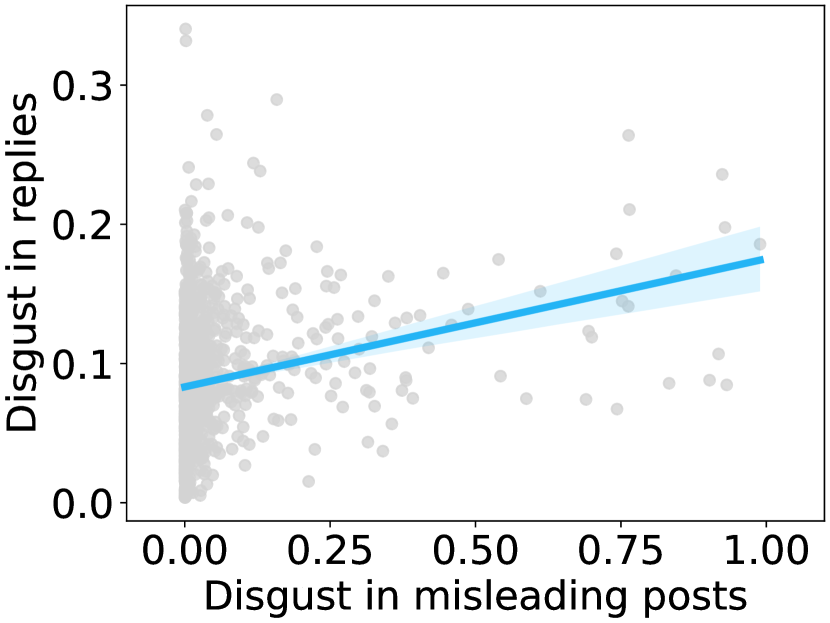
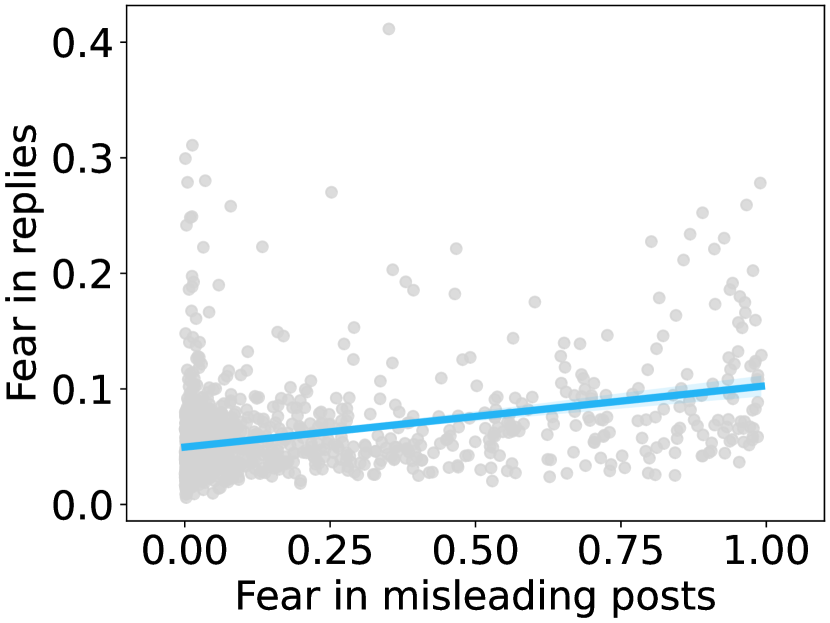
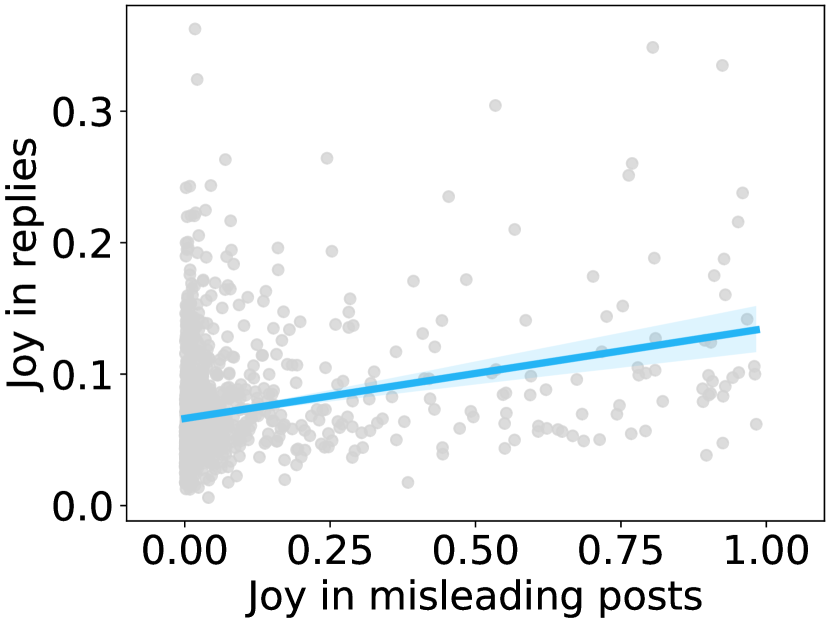
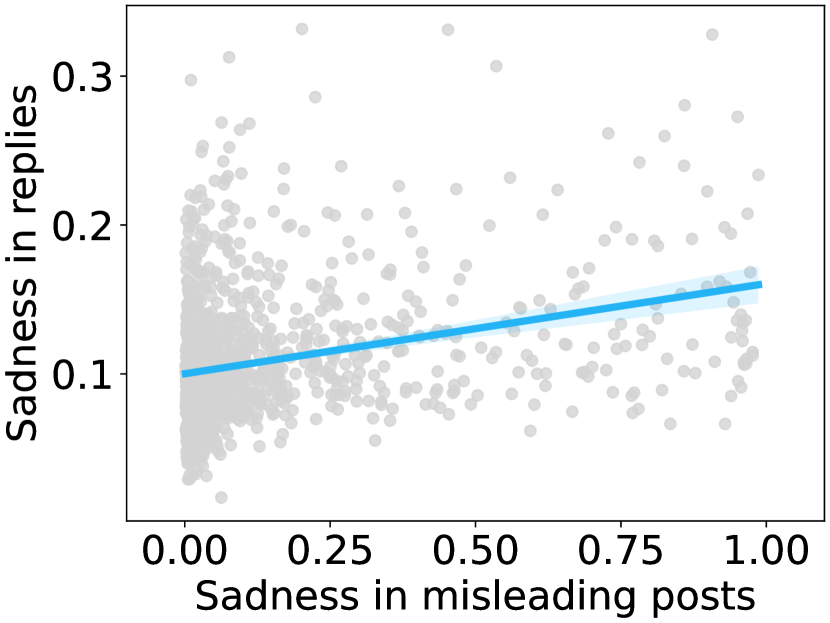
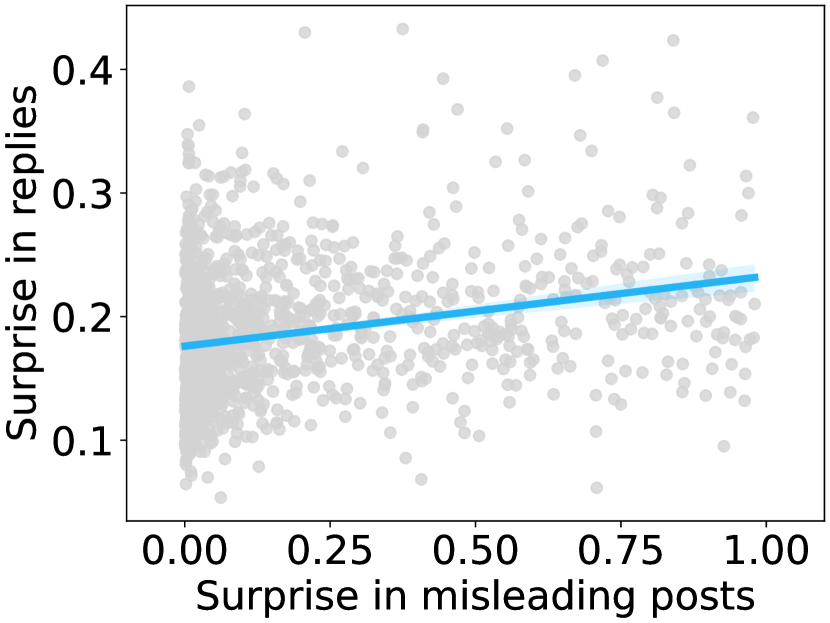
S1.2. Correlations Between Sentiments and Emotions
The correlations between sentiments and emotions are shown in Table S1. Anger, disgust, fear, and sadness are positively associated with negative sentiment, while joy and surprise are positively associated with positive sentiment.
| Anger | Disgust | Fear | Joy | Sadness | Surprise | |
| Positive | ∗∗∗ | ∗∗∗ | ∗∗∗ | ∗∗∗ | ∗∗∗ | ∗∗∗ |
| Negative | ∗∗∗ | ∗∗∗ | ∗∗∗ | ∗∗∗ | ∗∗∗ | ∗∗∗ |
S1.3. Correlations Among Emotions
The correlations among the six basic emotions in replies are reported in Table S2. Only anger and disgust are positively correlated, and all the other pairs of emotions are negatively correlated.
| Anger | Disgust | Fear | Joy | Sadness | Surprise | |
| Anger | ||||||
| Disgust | ∗∗∗ | |||||
| Fear | ∗∗∗ | ∗∗∗ | ||||
| Joy | ∗∗∗ | ∗∗∗ | ∗∗∗ | |||
| Sadness | ∗∗∗ | ∗∗∗ | ∗∗∗ | ∗∗∗ | ||
| Surprise | ∗∗∗ | ∗∗∗ | ∗∗∗ | ∗∗∗ | ∗∗∗ |
Appendix S2 Analysis of Specific Sentiments and Emotions
The estimation results for the analysis of the changes of specific sentiments and emotions in replies after the display of community notes are reported in Table S3, Table S4, and Table S5.
| (1) | (2) | |
| Positive | Negative | |
| Displayed | ∗∗ | ∗∗∗ |
| HoursFromDisplay | ||
| SourcePositive | ∗ | |
| SourceNegative | ∗∗ | ∗∗∗ |
| PostAge | ||
| Intercept | ||
| #Replies () | ||
| #Source posts |
| (1) | (2) | (3) | |
| Anger | Disgust | Fear | |
| Displayed | ∗∗∗ | ∗ | |
| HoursFromDisplay | |||
| SourceAnger | ∗∗∗ | ∗ | |
| SourceDisgust | ∗∗∗ | ||
| SourceFear | ∗∗∗ | ||
| SourceJoy | |||
| SourceSadness | |||
| SourceSurprise | ∗∗∗ | ||
| PostAge | |||
| Intercept | |||
| #Replies () | |||
| #Source posts |
| (1) | (2) | (3) | |
| Joy | Sadness | Surprise | |
| Displayed | ∗∗∗ | ||
| HoursFromDisplay | |||
| SourceAnger | ∗∗∗ | ||
| SourceDisgust | ∗ | ||
| SourceFear | ∗∗ | ||
| SourceJoy | ∗∗∗ | ||
| SourceSadness | ∗∗∗ | ||
| SourceSurprise | ∗∗∗ | ||
| PostAge | |||
| Intercept | |||
| #Replies () | |||
| #Source posts |
Appendix S3 Sensitivity Analysis
The estimation results for the sensitivity analysis across political and non-political misleading posts are reported in Table S6, Table S7, and Table S8.
| (1) | (2) | (3) | (4) | |
| Positive: politics | Positive: non-politics | Negative: politics | Negative: non-politics | |
| Displayed | ∗∗ | ∗∗∗ | ∗∗∗ | |
| HoursFromDisplay | ||||
| SourcePositive | ∗∗∗ | |||
| SourceNegative | ∗∗ | ∗∗∗ | ∗∗∗ | |
| PostAge | ||||
| Intercept | ∗ | ∗∗∗ | ∗∗∗ | ∗∗∗ |
| #Replies () | ||||
| #Source posts |
| Anger | Disgust | Fear | ||||
| (1) | (2) | (3) | (4) | (5) | (6) | |
| Politics | Non-politics | Politics | Non-politics | Politics | Non-politics | |
| Displayed | ∗∗∗ | ∗∗∗ | ∗∗ | |||
| HoursFromDisplay | ||||||
| SourceAnger | ∗∗∗ | ∗∗∗ | ∗ | |||
| SourceDisgust | ∗∗∗ | ∗∗ | ||||
| SourceFear | ∗∗∗ | ∗∗∗ | ||||
| SourceJoy | ∗ | |||||
| SourceSadness | ||||||
| SourceSurprise | ∗∗ | ∗∗∗ | ||||
| PostAge | ||||||
| Intercept | ∗∗∗ | ∗∗∗ | ∗∗ | |||
| #Replies () | ||||||
| #Source posts | ||||||
| Joy | Sadness | Surprise | ||||
| (1) | (2) | (3) | (4) | (5) | (6) | |
| Politics | Non-politics | Politics | Non-politics | Politics | Non-politics | |
| Displayed | ∗ | ∗∗∗ | ||||
| HoursFromDisplay | ||||||
| SourceAnger | ∗∗∗ | |||||
| SourceDisgust | ∗ | ∗∗ | ||||
| SourceFear | ∗∗ | |||||
| SourceJoy | ∗∗∗ | ∗ | ∗ | |||
| SourceSadness | ∗∗∗ | ∗∗∗ | ||||
| SourceSurprise | ∗∗∗ | ∗∗∗ | ||||
| PostAge | ||||||
| Intercept | ∗ | ∗∗ | ||||
| #Replies () | ||||||
| #Source posts | ||||||
Appendix S4 Moral Outrage Analysis
The estimation results for the analysis of moral outrage in replies are reported in Table S9.
| (1) | (2) | (3) | |
| All | Politics | Non-politics | |
| Displayed | ∗∗∗ | ∗∗∗ | ∗∗∗ |
| HoursFromDisplay | |||
| SourceAnger | ∗∗ | ∗ | ∗ |
| SourceDisgust | ∗∗∗ | ∗ | ∗∗∗ |
| SourceFear | |||
| SourceJoy | |||
| SourceSadness | |||
| SourceSurprise | ∗∗∗ | ∗ | ∗∗∗ |
| PostAge | |||
| Intercept | ∗ | ∗∗∗ | |
| #Replies () | |||
| #Source posts |
Appendix S5 Robustness Checks
S5.1. Variance Inflation Factors
The Variance Inflation Factors (VIFs) for the independent variables are reported in Table S10.
| (1) | (2) | |
| Sentiments | Emotions | |
| Displayed | ||
| HoursFromDisplay | ||
| SourcePositive | ||
| SourceNegative | ||
| SourceAnger | ||
| SourceDisgust | ||
| SourceFear | ||
| SourceJoy | ||
| SourceSadness | ||
| SourceSurprise | ||
| PostAge | ||
| Mean VIF |
S5.2. Month-Year Fixed Effects
We consider the month-year fixed effects at two levels: post level and reply level. At the post level, we incorporate month-year fixed effects based on the creation time of misleading posts. The estimation results across sentiments and emotions are reported in Table S11 and Table S12. The estimation results for moral outrage are reported in Column (1) of Table S15. At the reply level, we incorporate month-year fixed effects based on the creation time of replies. The estimation results across sentiments and emotions are reported in Table S13 and Table S14. The estimation results for moral outrage are reported in Column (2) of Table S15. All the results are robust and consistent with our main findings.
| (1) | (2) | |
| Positive | Negative | |
| Displayed | ∗∗∗ | ∗∗∗ |
| HoursFromDisplay | ||
| SourcePositive | ∗ | |
| SourceNegative | ∗∗ | ∗∗∗ |
| PostAge | ||
| Post: MonthYear | ✓ | ✓ |
| Intercept | ||
| #Replies () | ||
| #Source posts |
| (1) | (2) | (3) | (4) | (5) | (6) | |
| Anger | Disgust | Fear | Joy | Sadness | Surprise | |
| Displayed | ∗∗∗ | ∗ | ∗∗∗ | |||
| HoursFromDisplay | ||||||
| SourceAnger | ∗∗∗ | ∗ | ∗∗∗ | |||
| SourceDisgust | ∗∗∗ | |||||
| SourceFear | ∗∗∗ | ∗∗ | ||||
| SourceJoy | ∗∗∗ | |||||
| SourceSadness | ∗∗∗ | |||||
| SourceSurprise | ∗∗∗ | ∗∗∗ | ||||
| PostAge | ||||||
| Post: MonthYear | ✓ | ✓ | ✓ | ✓ | ✓ | ✓ |
| Intercept | ∗ | |||||
| #Replies () | ||||||
| #Source posts |
| (1) | (2) | |
| Positive | Negative | |
| Displayed | ∗∗ | ∗∗∗ |
| HoursFromDisplay | ||
| SourcePositive | ∗ | |
| SourceNegative | ∗∗ | ∗∗∗ |
| PostAge | ||
| Reply: MonthYear | ✓ | ✓ |
| Intercept | ||
| #Replies () | ||
| #Source posts |
| (1) | (2) | (3) | (4) | (5) | (6) | |
| Anger | Disgust | Fear | Joy | Sadness | Surprise | |
| Displayed | ∗∗∗ | ∗ | ∗∗∗ | |||
| HoursFromDisplay | ||||||
| SourceAnger | ∗∗∗ | ∗ | ∗∗∗ | |||
| SourceDisgust | ∗∗∗ | ∗ | ∗ | |||
| SourceFear | ∗∗∗ | ∗∗ | ||||
| SourceJoy | ∗∗∗ | |||||
| SourceSadness | ∗∗∗ | |||||
| SourceSurprise | ∗∗∗ | ∗∗∗ | ||||
| PostAge | ||||||
| Reply: MonthYear | ✓ | ✓ | ✓ | ✓ | ✓ | ✓ |
| Intercept | ∗ | |||||
| #Replies () | ||||||
| #Source posts |
| (1) | (2) | (3) | (4) | |
| Post: month-year | Reply: month-year | Alternative lexicons | Emotions in community notes | |
| Displayed | ∗∗∗ | ∗∗∗ | ∗∗∗ | ∗∗∗ |
| HoursFromDisplay | ||||
| NoteAnger | ||||
| NoteDisgust | ||||
| NoteFear | ||||
| NoteJoy | ||||
| NoteSadness | ||||
| NoteSurprise | ∗ | |||
| Displayed NoteAnger | ||||
| Displayed NoteDisgust | ||||
| Displayed NoteFear | ||||
| Displayed NoteJoy | ||||
| Displayed NoteSadness | ||||
| Displayed NoteSurprise | ||||
| SourceAnger | ∗∗ | ∗∗ | ∗ | ∗∗ |
| SourceDisgust | ∗∗∗ | ∗∗∗ | ∗∗ | ∗∗ |
| SourceFear | ||||
| SourceJoy | ||||
| SourceSadness | ||||
| SourceSurprise | ∗∗∗ | ∗∗∗ | ∗∗∗ | |
| PostAge | ||||
| Intercept | ||||
| #Replies () | ||||
| #Source posts |
S5.3. Alternative Lexicon-Based Sentiments and Emotions
We use VADER sentiment lexicon (Hutto and Gilbert, 2014) and NRC emotion lexicon (Mohammad and Turney, 2013) as alternative methods for measuring sentiments and emotions. The estimation results across sentiments and emotions based on the alternative approaches are reported in Table S16 and Table S17. Additionally, the estimation results for moral outrage based on NRC emotion lexicon are reported in Column (3) of Table S15. All the results are robust and consistent with our main findings.
| (1) | (2) | (3) | (4) | |
| Polarity | Anger | Disgust | Fear | |
| Displayed | ∗∗ | ∗∗ | ∗∗∗ | |
| HoursFromDisplay | ||||
| SourcePolarity | ∗∗∗ | |||
| SourceAnger | ∗∗∗ | ∗ | ||
| SourceDisgust | ∗∗∗ | |||
| SourceFear | ∗∗ | ∗∗∗ | ||
| SourceJoy | ||||
| SourceSadness | ∗∗ | |||
| SourceSurprise | ||||
| PostAge | ||||
| Intercept | ||||
| #Replies () | ||||
| #Source posts |
| (1) | (2) | (3) | |
| Joy | Sadness | Surprise | |
| Displayed | |||
| HoursFromDisplay | |||
| SourceAnger | |||
| SourceDisgust | |||
| SourceFear | |||
| SourceJoy | ∗∗∗ | ||
| SourceSadness | ∗∗ | ∗∗ | |
| SourceSurprise | ∗ | ∗∗∗ | |
| PostAge | |||
| Intercept | |||
| #Replies () | |||
| #Source posts |
S5.4. Expansion With Sentiments/Emotions in Community Notes
We expand our models by incorporating sentiment (emotions) in community notes and their interactions with . The estimation results across sentiments and emotions are reported in Table S18 and Table S19. Additionally, the estimation results for moral outrage are reported in Column (4) of Table S15. All the results are robust and consistent with our main findings.
| (1) | (2) | |
| Positive | Negative | |
| Displayed | ∗∗ | ∗∗∗ |
| HoursFromDisplay | ||
| NotePositive | ∗ | |
| NoteNegative | ||
| Displayed NotePositive | ||
| Displayed NoteNegative | ||
| SourcePositive | ∗ | |
| SourceNegative | ∗∗ | ∗∗∗ |
| PostAge | ||
| Intercept | ||
| #Replies () | ||
| #Source posts |
| (1) | (2) | (3) | (4) | (5) | (6) | |
| Anger | Disgust | Fear | Joy | Sadness | Surprise | |
| Displayed | ∗∗∗ | ∗ | ∗∗∗ | |||
| HoursFromDisplay | ||||||
| NoteAnger | ∗∗ | ∗ | ∗ | |||
| NoteDisgust | ||||||
| NoteFear | ∗ | ∗ | ||||
| NoteJoy | ∗ | |||||
| NoteSadness | ∗ | ∗∗∗ | ||||
| NoteSurprise | ∗∗ | ∗∗ | ||||
| Displayed NoteAnger | ∗ | ∗∗ | ||||
| Displayed NoteDisgust | ||||||
| Displayed NoteFear | ||||||
| Displayed NoteJoy | ||||||
| Displayed NoteSadness | ∗∗ | |||||
| Displayed NoteSurprise | ||||||
| SourceAnger | ∗∗∗ | ∗ | ∗∗ | |||
| SourceDisgust | ∗∗∗ | ∗ | ||||
| SourceFear | ∗∗∗ | ∗ | ||||
| SourceJoy | ∗∗∗ | |||||
| SourceSadness | ∗∗∗ | |||||
| SourceSurprise | ∗∗∗ | ∗∗∗ | ||||
| PostAge | ||||||
| Intercept | ||||||
| #Replies () | ||||||
| #Source posts |