Republic 22institutetext: Dipartimento di Fisica, Università degli Studi di Torino, via Pietro Giuria 1, I-10125 Torino, Italy 33institutetext: East Asian Observatory, 660 North A’ohōkū Place, Hilo, Hawaii 96720, USA 44institutetext: Istituto Nazionale di Fisica Nucleare, Sezione di Torino, I-10125 Torino, Italy 55institutetext: INAF–Osservatorio Astrofisico di Torino, via Osservatorio 20, I-10025 Pino Torinese, Italy 66institutetext: INAF - Osservatorio di Astrofisica e Scienza dello Spazio, via Piero Gobetti 101, 40129 Bologna, Italy 77institutetext: Departamento de Ciencias Físicas, Universidad Andrés Bello, Fernández Concha 700, Las Condes, Santiago, Chile 88institutetext: Instituto Nacional de Astrofísica, Óptica y Electrónica, Luis Enrique Erro 1, Tonantzintla, Puebla 72840, México 99institutetext: Dipartimento di Fisica e Astronomia G. Galilei, Univeristà di Padova, Padova, Italy 1010institutetext: Eureka Scientific, 2452 Delmer Street Suite 100, Oakland, CA 94602-3017, USA
Swift-XRT follow-up analysis of
unidentified hard X-ray sources
Abstract
Context. It is currently established that the sources contributing to the cosmic X-ray background (CXB) emission are mainly nearby active galactic nuclei (AGN), in particular those that are obscured. Thus, it is important to fully identify the hard X-ray sky source population to accurately characterize the individual contribution of different AGNs to the overall CXB emission.
Aims. We present a follow-up analysis of all the 218 sources marked as unidentified in our previous revision of the third release of the Palermo Swift-BAT hard X-ray catalog (3PBC) based on our multifrequency classification scheme. These 218 sources were classified as unidentified in our previous analyses because they lack an assigned low-energy counterpart.
Methods. We searched for soft X-ray counterparts of these 218 3PBC sources in archival Swift-XRT observations obtained between 2005 January 1st and 2018 August 1st. In particular, we found 1213 archival Swift-XRT observations for 192 of the 218 unidentified sources.
Results. We found 93 possible Swift-XRT counterparts inside of the Swift-BAT positional uncertainty regions. These correspond to 73 3PBC sources, where 60 have only a single Swift-XRT detection, and 13 sources have multiple detections. We present a catalog of all the detected possible counterparts of the yet unidentified hard X-ray sources to the community as a catalog for future spectroscopic follow-up targets, together with a short catalog of our classification of the ten sources for which we found available spectra.
Key Words.:
1 Introduction
The hard X-ray sky, at energies greater than 10 keV, was systematically observed by several telescopes in the past decades. Uhuru was the first X-ray satellite (Giacconi et al., 1971), launched in 1970, which delivered an all-sky hard X-ray survey (Forman et al., 1978) in 2 – 20 keV band listing 339 sources. Subsequently, Levine et al. (1984), thanks to the X-ray and Gamma-ray detector HEAO-A4 on board the HEAO 1 satellite (Rothschild et al., 1979) conducted an all-sky survey in 13–180 keV range providing 77 newly detected sources. The INTErnational Gamma-Ray Astrophysics Laboratory INTEGRAL (Winkler et al., 2003) with its Imager on Board the INTEGRAL Satellite IBIS (Ubertini et al., 2003) was launched in 2002, observing in energy range from 15 keV up to 10 MeV. Finally, the Neil Gehrels Swift Observatory (Gehrels et al., 2004), launched in 2004, carried an all-sky hard X-ray survey at 14 – 195 keV using the Burst Alert Telescope (BAT) (Barthelmy, 2004). Significant improvements in the soft X-ray background were possible mainly thanks to NASA’s HEAO-2 Einstein observatory (Giacconi et al., 1979), the German-US-UK X-ray observatory ROSAT (Röntgen Satellite) (Hasinger et al., 1999), the Chandra X-ray observatory (Weisskopf et al., 2000) and the XMM-Newton observatory (Jansen et al., 2001).
The INTEGRAL and Swift have allowed for the creation of many catalogs focusing on the hard X-ray sky (see, e.g., Markwardt et al., 2005; Beckmann et al., 2006; Churazov et al., 2007; Krivonos et al., 2007; Sazonov et al., 2007; Tueller et al., 2008; Cusumano et al., 2010; Bottacini et al., 2012; Bird et al., 2016; Mereminskiy et al., 2016; Krivonos et al., 2017; Oh et al., 2018; Krivonos et al., 2021, 2022) and catalogs providing the association of hard X-ray sources with their low-energy counterparts (e.g., Malizia et al., 2010; Koss et al., 2019; Bär et al., 2019; Smith et al., 2020). They were also necessary for the optical spectroscopy follow-up observations (e.g., Masetti et al., 2006a, b, 2008, 2012, 2013; Parisi et al., 2014; Rojas et al., 2017; Marchesini et al., 2019a). These missions are still operational nowadays and deliver new scientific results, e.g., the INTEGRAL-IBIS 17-yr hard X-ray all-sky survey (Krivonos et al., 2022), the AGN catalog and optical spectroscopy for the second data release of the Swift-BAT AGN Spectroscopic Survey (BASS DR2) (Koss et al., 2022) and the upcoming catalog based on the Swift-BAT 157-month survey (Lien et al., 2023).
Multiple catalogs based on the Burst Alert Telescope (BAT) on board the Swift observatory exist. Koss et al. (2022) constructed the AGN catalog and optical spectroscopy for the second data release of the Swift-BAT AGN Spectroscopic Survey (BASS DR2). They provide 1449 optical spectra corresponding to 858 hard-X-ray-selected AGNs in the Swift-BAT 70-month observations. Their AGN sample is spectroscopically complete, with 857/858 AGNs reported with redshifts. Oh et al. (2018) created the 105-month Swift-BAT catalog of hard X-ray sources. This catalog covers over 90 % of the sky with a sensitivity of 8.40 10-12 erg s-1 cm-2 and 7.24 10-12 erg s-1 cm-2 over 50 % of the sky in the 14 – 195 keV band providing 1632 hard X-ray detections above 4.8 significance threshold. Cusumano et al. (2010) created the Palermo Swift-BAT Hard X-ray catalog. This work links to the 2PBC catalog release after 54 months of sky survey. The 3rd release of the Palermo Swift-BAT hard X-ray catalog (3PBC), which is based on 66 months of sky survey, is currently ongoing and is available only online111http://bat.ifc.inaf.it/bat_catalog_web/66m_bat_catalog.html. This is the catalog version we analyze in this study. The 3PBC lists 1256 sources detected above 4.8 level of significance in the 15 – 150 keV energy range. Their number increases to 1593 total sources when considering a threshold on the signal-to-noise ratio above 3.8. The catalog covers nearly 90 % of the sky to a flux limit of 1.1 10-11 erg cm-2 s-1, decreasing to 50 % when decreasing this flux threshold to 0.9 10-11 erg cm-2 s-1.
We recently conducted a refined analysis (Kosiba et al. (2023), hereinafter paper I) of all sources listed in the 3PBC catalog. Our refined analysis is based on the multifrequency classification scheme we developed to analyze hard X-ray sources, mainly focusing on extragalactic source populations (Peña-Herazo et al., 2022). Findings of our refined analysis of the 3PBC were also based on results reported in the 105-month Swift-BAT catalog (Oh et al., 2018) and the INTEGRAL hard X-ray survey above 100 keV with its 11-year release (Krivonos et al., 2015), which we used to cross-match the 3PBC sources for counterparts to obtain luminosities and spectra if available.
We found that approximately 57 % of the sources listed in the 3PBC have an extragalactic origin, while 19 % belong to our Milky Way. The remaining 24 % are yet unknown. In particular, our final revised version of the 3PBC catalog lists 1176 classified sources, 218 unidentified, and 199 unclassified. Of the 1176 classified sources, 820 have an extragalactic origin, and 356 have a Galactic origin. Compared to the original 3PBC, which has 233 unidentified and 300 unclassified sources, we decreased these fractions from 33% (533 sources) to 26% (417 sources).
Our study also allowed us to discover new Seyfert galaxies included in the Turin-SyCAT release (paper I). In the release of the Turin-SyCAT, there are 633 Seyfert galaxies, 282 new ones added thanks to our refined analysis and corresponding to an increase of 80% with respect to the Turin-SyCAT release (Peña-Herazo et al., 2022).
Moreover, trends between the hard X-ray and the gamma-ray emissions of those blazars listed in the 3PBC with a counterpart in the second release of the fourth Fermi-LAT catalog (4FGL-DR2) were also found (paper I), as expected from emission models widely adopted to explain their broadband SED (e.g., Marscher & Gear, 1985; Marscher & Travis, 1996; Massaro et al., 2006).
In this work, we examine the population of the 218 unidentified hard X-ray sources listed in our revised version of the 3PBC, i.e., those lacking an assigned counterpart at lower energies than the BAT energy range. We analyzed all soft X-ray observations (between 0.5 and 10 keV) available in the archive of the X-ray telescope (XRT) (Burrows et al., 2005) on board the Swift Observatory and found available data for 192 of the 218 3PBC sources, which is the sample we further analyze in this study. This analysis aims to search for potential counterparts in the soft X-ray data of the Swift-XRT for the 192 yet unidentified 3PBC sources. The final goal of the present analysis is to provide a catalog of all unidentified hard X-ray sources having at least one candidate counterpart if detected in the soft X-ray band, that could be targeted with follow-up spectroscopic observations to obtain its final classification, as successfully carried out in the last decades (e.g., Masetti et al., 2006a, b, 2008, 2012, 2013; Parisi et al., 2014; Rojas et al., 2017; Koss et al., 2017; Landi et al., 2017; Marchesini et al., 2019a; Tomsick et al., 2020).
The paper is organized as follows. Section 2 describes the Swift-XRT data reduction and data analysis procedure. Then Section 3 is devoted to our results while details on the multifrequency comparison are illustrated in Section 4. Finally, Section 5 is dedicated to our summary, conclusions, and future perspectives. X-ray images for all analyzed BAT sources are reported in the Appendix.
As previously adopted in the paper I, we used cgs units unless stated otherwise. We also adopted CDM cosmology with , and Hubble constant km (Bennett et al., 2014) to compute cosmological corrections through the whole manuscript.
2 Swift-XRT Observations
2.1 Sample selection
The 3PBC catalog lists 1 593 hard X-ray sources, all detected with a signal-to-noise ratio (S/N) above 3.8 in the 15–150 keV energy range. Our analysis, presented in paper I, identified 218 3PBC sources lacking an assigned counterpart at lower energies.
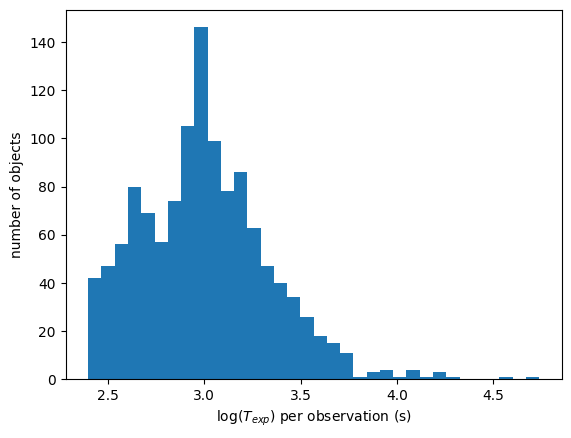
In this work, we searched the Swift-XRT archive, and we found that 192 out of these 218 hard X-ray sources have at least one X-ray observation with exposure time larger than 250 sec in the 0.5–10 keV energy range. We found a total of 1213 such observations that have been reduced and analyzed here according to the standard procedures described below. In Fig. 1, we report the distribution of the exposure time for all selected observations. The 1213 Swift-XRT observations have a mean of 1462 s and variance s with a total exposure time of 1.77 106 s.
All observations we reduced and analyzed in this study were performed between April 2005 and December 2022.
2.2 Data Reduction
Data reduction procedures applied here for all Swift-XRT observations are the same previously adopted for similar analyses (see e.g. Massaro et al., 2008b, a; Paggi et al., 2013; Marchesini et al., 2019b, 2020; Massaro et al., 2023a) and procedures of the Swift-XRT X-Ray point source catalogs (D’Elia et al., 2013; Evans et al., 2014, 2020). Thus, we only describe the basic information and refer to the above references for a more detailed description.
We downloaded raw Swift-XRT data from the archive222https://heasarc.gsfc.nasa.gov/docs/archive.html. Then we run the xrtpipeline task, developed as part of the Swift X-Ray Telescope Data Analysis Software (XRTDAS) and distributed within the HEAsoft package (version 6.30.1) (Nasa High Energy Astrophysics Science Archive Research Center (2014), Heasarc). This allowed us to obtain clean event files for all Swift-XRT observations. The entire analysis and all X-ray images shown in the present manuscript are restricted to the 0.5-10 keV energy range unless stated otherwise.
We subsequently calibrated these cleaned event files with the usual filtering criteria and using calibration files provided in the High Energy Astrophysics Science Archive Research Center (HEASARC) calibration database (CALDB) version (v.20220907)333https://heasarc.gsfc.nasa.gov/docs/heasarc/caldb/caldb_supported_
missions.html. Using the xselect task we excluded all time intervals with count rates higher than 40 photons/sec as well as those with CCD temperature exceeding -50∘C, in regions located at the edges of the XRT detector (D’Elia et al., 2013). Then, the xselect task was also used to merge all cleaned and filtered event files for those sources with multiple observations. Finally, it is worth mentioning that the entire analysis was carried out using the XIMAGE
software444https://heasarc.gsfc.nasa.gov/xanadu/ximage/ximage.html to merge the corresponding exposure maps (Giommi et al., 1992a).
2.3 Data Analysis
To detect sources, we used the sliding cell DETECT (det) algorithm available in the XIMAGE software package (Giommi et al., 1992b) on all merged event files as well as on the single event files for sources with only one observation. We set a threshold on the S/N equal to 3 for claiming detection of an X-ray source in the 0.5-10 keV energy range, as recently performed in the analysis of Massaro et al. (2023b).
Then, to identify and characterize the 3PBC sources, we labeled them using three different X-ray detection flags (XDF) on the basis of the following criteria.
-
•
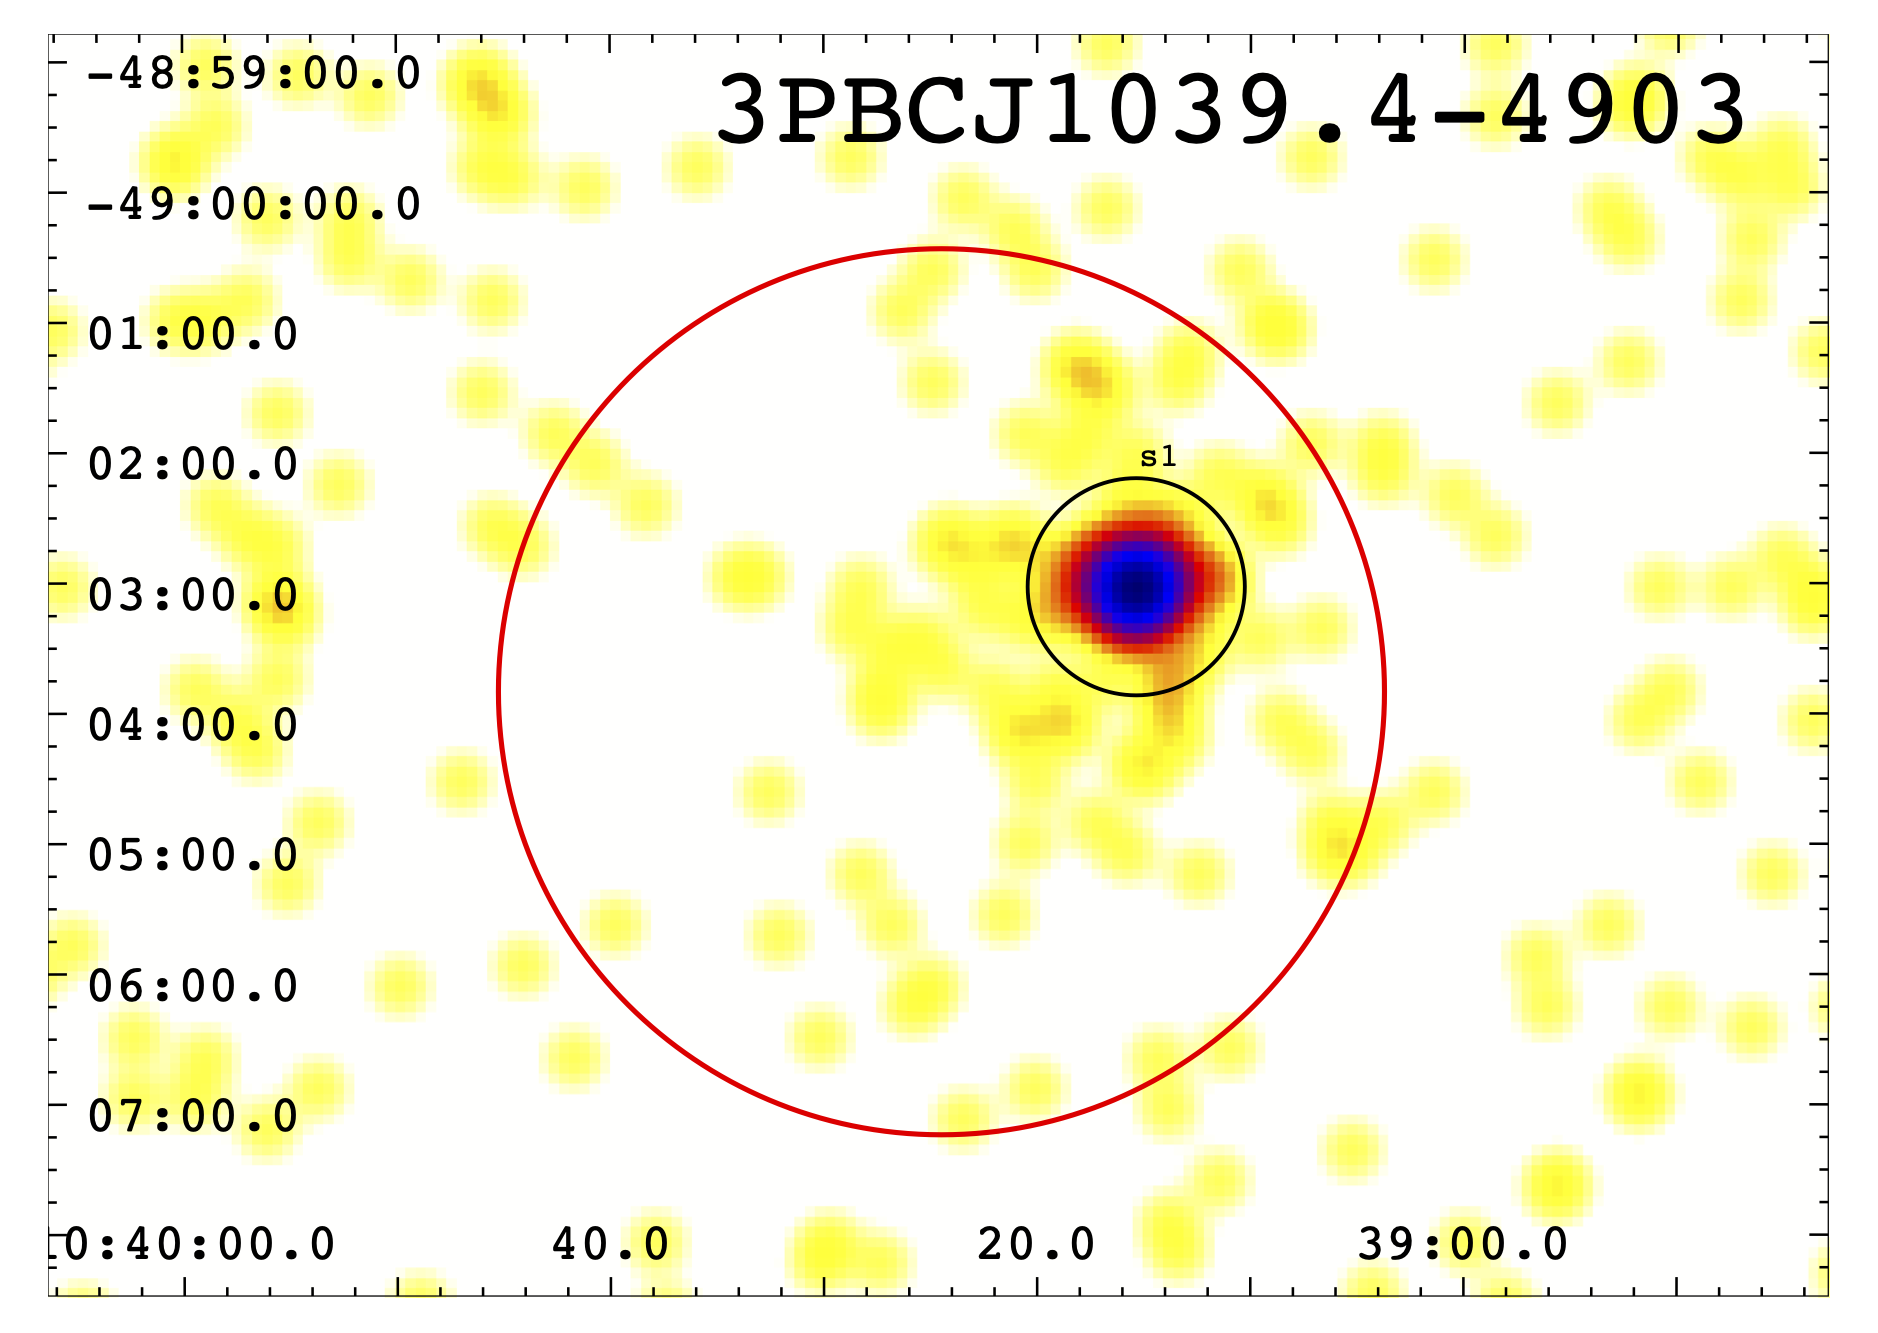
x flag: is used for 3PBC sources that have a single soft X-ray source within their BAT positional uncertainty region (see, e.g., 3PBC J1039.4-4903 shown in the left panel of Figure 2)
-
•
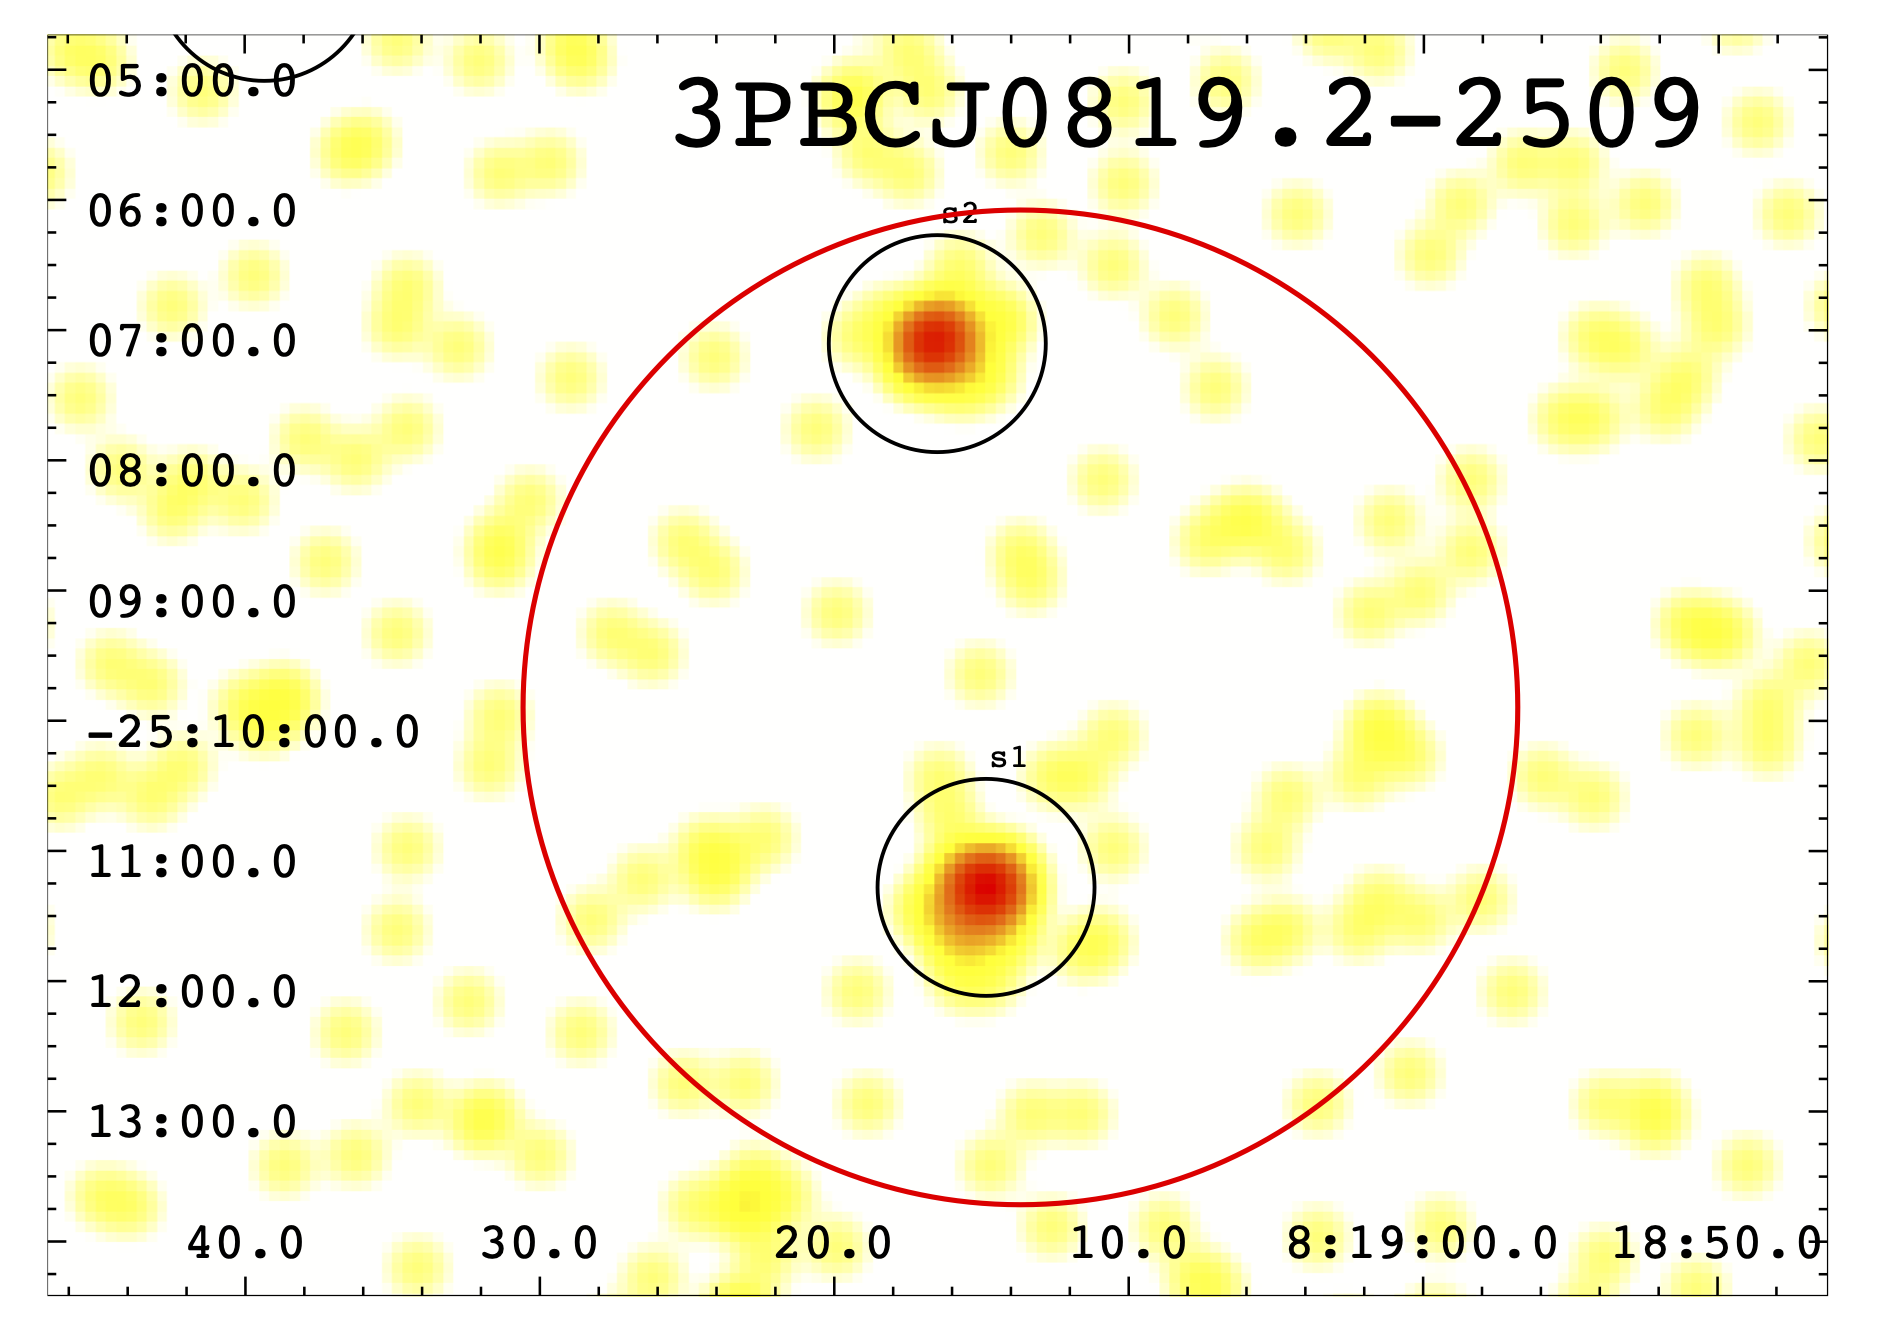
m flag: indicates 3PBC sources with more than one soft X-ray source (multiple detections) within their BAT positional uncertainty region (see, e.g., 3PBC J0819.2-2509 shown in the central panel of Figure 2)
-
•
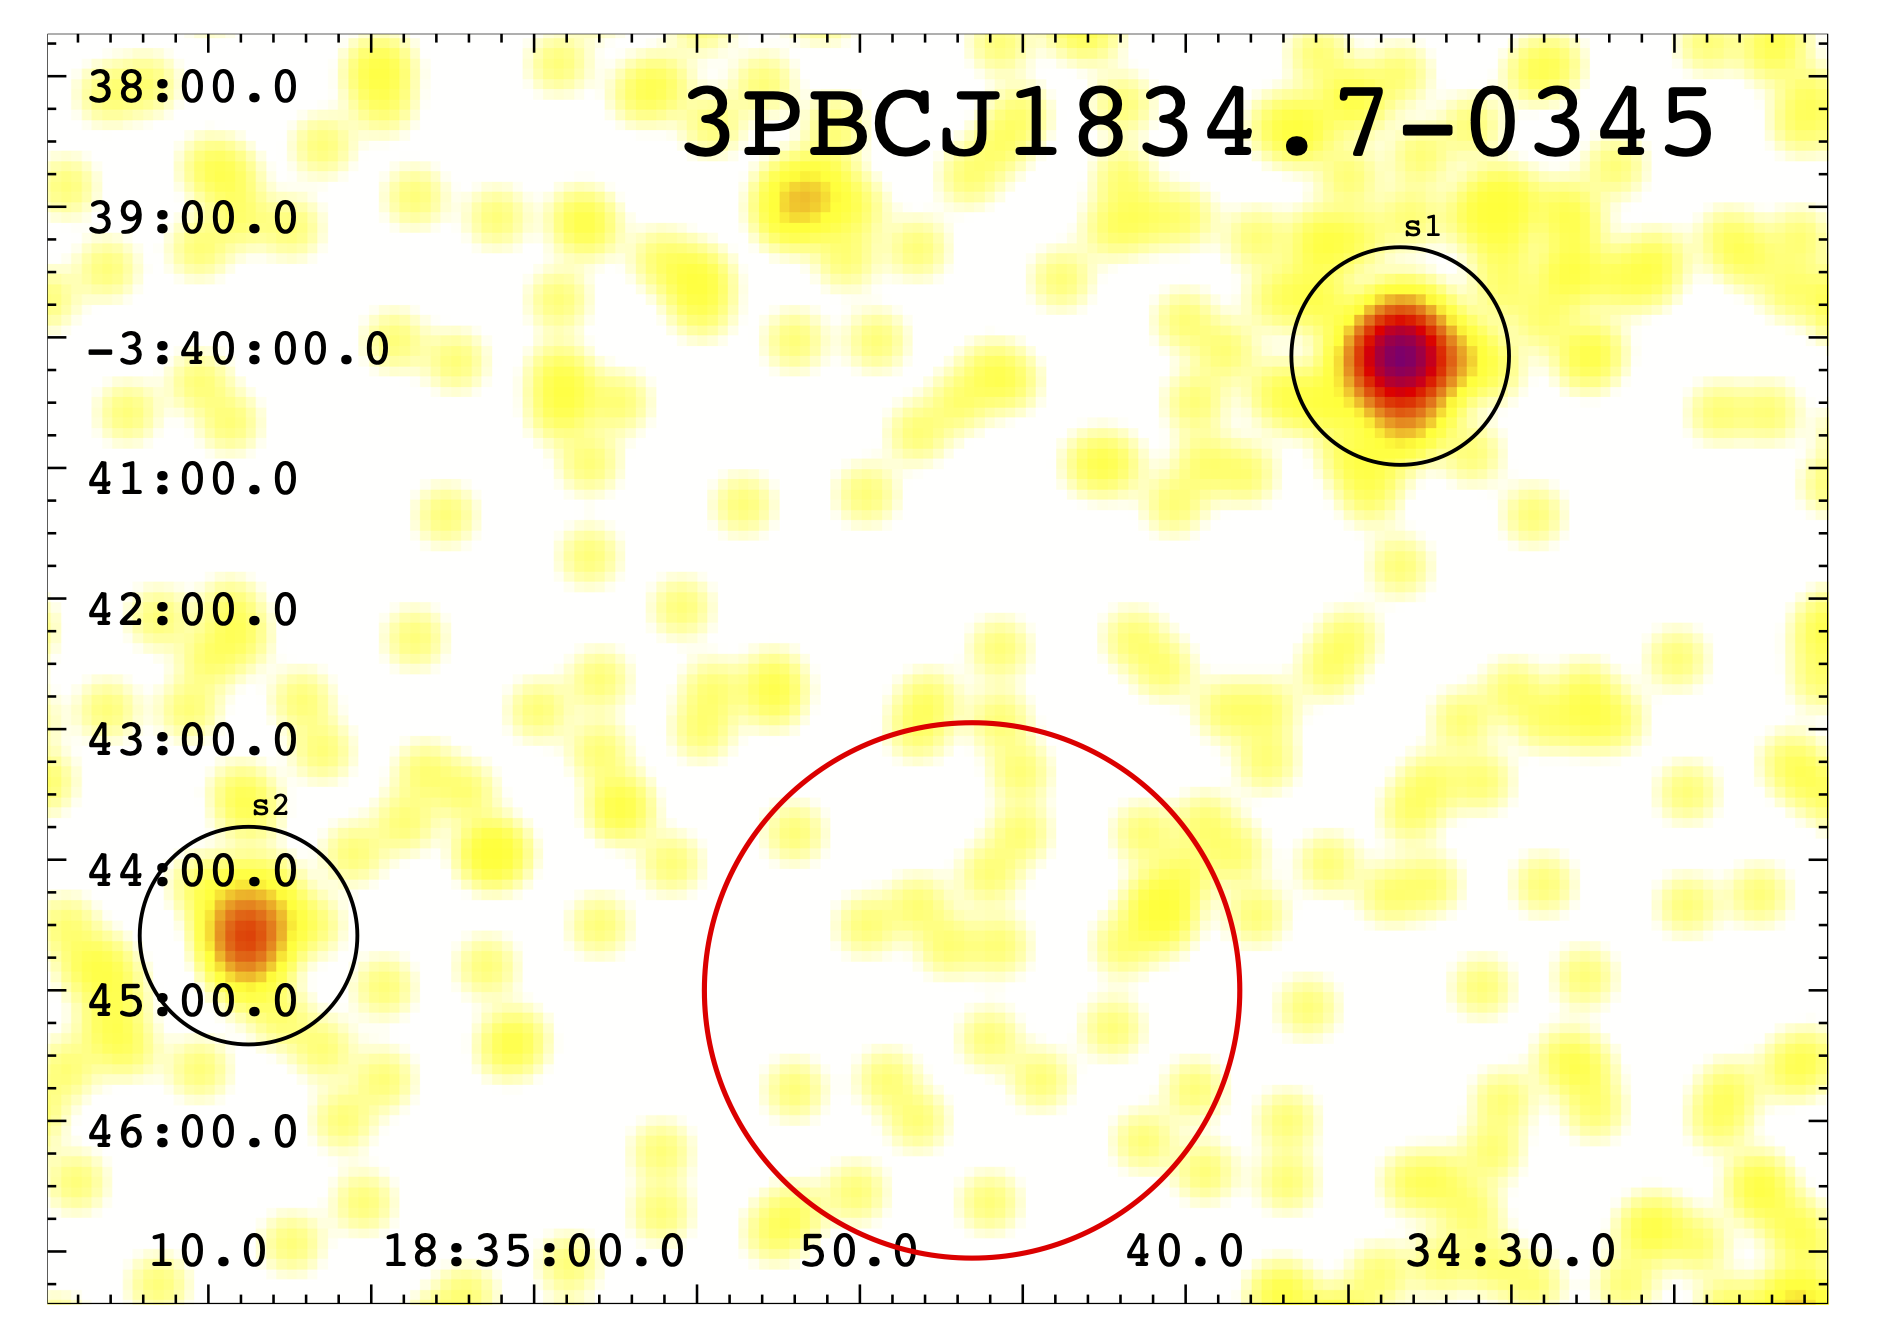
u flag: is adopted for 3PBC sources with no soft X-ray counterparts detected in their merged event files within their BAT positional uncertainty region (see, e.g., 3PBC J1834.7-0345 shown in the right panel of Figure 2).
We measured several parameters for all detected possible X-ray counterparts of the 3PBC hard X-ray sources in merged event files. In particular, we obtained coordinates of the distributions of X-ray photons from each source using the xrtcentroid task. We also measured , the number of photons within a circular region centered on the X-ray coordinates with radius 120.207″ (51 pixels), which is enclosing 90% of the Swift-XRT point spread function (PSF).
3 A soft X-ray perspective of the hard X-ray sky
3.1 Outline of the main goal
In our previous work (Kosiba et al., 2023), where we revised the 3PBC catalog, we found 218 sources without a low-energy counterpart, thus falling into the unidentified category. The main goal of the current paper is to search for candidate counterparts for these 218 unidentified sources in soft X-ray wavelengths of the Swift-XRT archival data. The final product of this analysis is a catalog of soft X-ray candidate counterparts we found in the Swift-XRT data for the yet unidentified hard X-ray sources. We release this catalog along with this publication. This paper also describes the sources we analyze in this study.
3.2 Overview of results
We analyzed all available Swift-XRT data, selected according to the criteria previously described, for a total of 1213 observations corresponding to 192 3PBC sources with a total exposure time 1.77 106 s. Considering only the Swift-XRT detections inside the BAT positional uncertainty region above the S/N = 3 we adopted, we found 93 soft X-ray sources. These 93 soft X-ray sources correspond to 73 unique 3PBC sources. From those, 13 3PBC sources are associated with multiple soft X-ray detected sources (m flag), and the remaining 60 3PBC sources are associated with a single soft X-ray detected source (x flag). Those are the final results presented in this analysis.
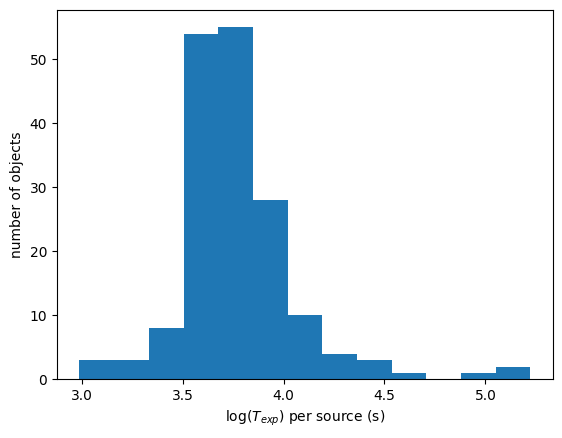
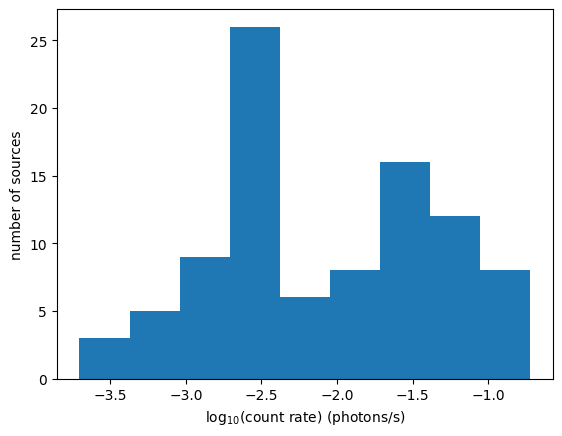
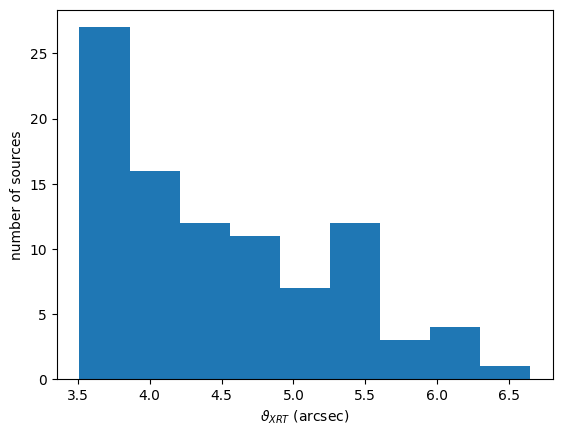
We note that all 3PBC sources with at least one soft X-ray counterpart detected within their positional uncertainty region have an integrated exposure time above 975 seconds, about four times longer than the minimum selected value. The distribution of X-ray count rates and that of their positional uncertainty in the 0.5–10 keV energy range computed using the xrtcentroid task for the 93 Swift-XRT detected sources are shown in Fig. 3 (left) and Fig. 3 (right), respectively.
For calculating the BAT positional uncertainty region (red circles in Fig. 2), we took the values reported in the 3PBC catalog (Cusumano et al., 2010).
In this section, we are focusing on the m XDF flagged sources (Fig. 4). We discuss these 13 3PBC sources separately to detail their potential soft X-ray counterparts.
In Appendix A, we report the first five columns of our final table for the first ten sources. Those are the 3PBC name, the XRT counterpart name, the XDF flag, the right ascension and declination of the centroid, and the uncertainty on the centroid’s position. The remaining seven columns of our final table are also reported in the Appendix A, listing the angular separation between XRT and BAT, count rate, uncertainty on the count rate, S/N, number of observations, integrated exposure time () and counterpart’s name in WISE.
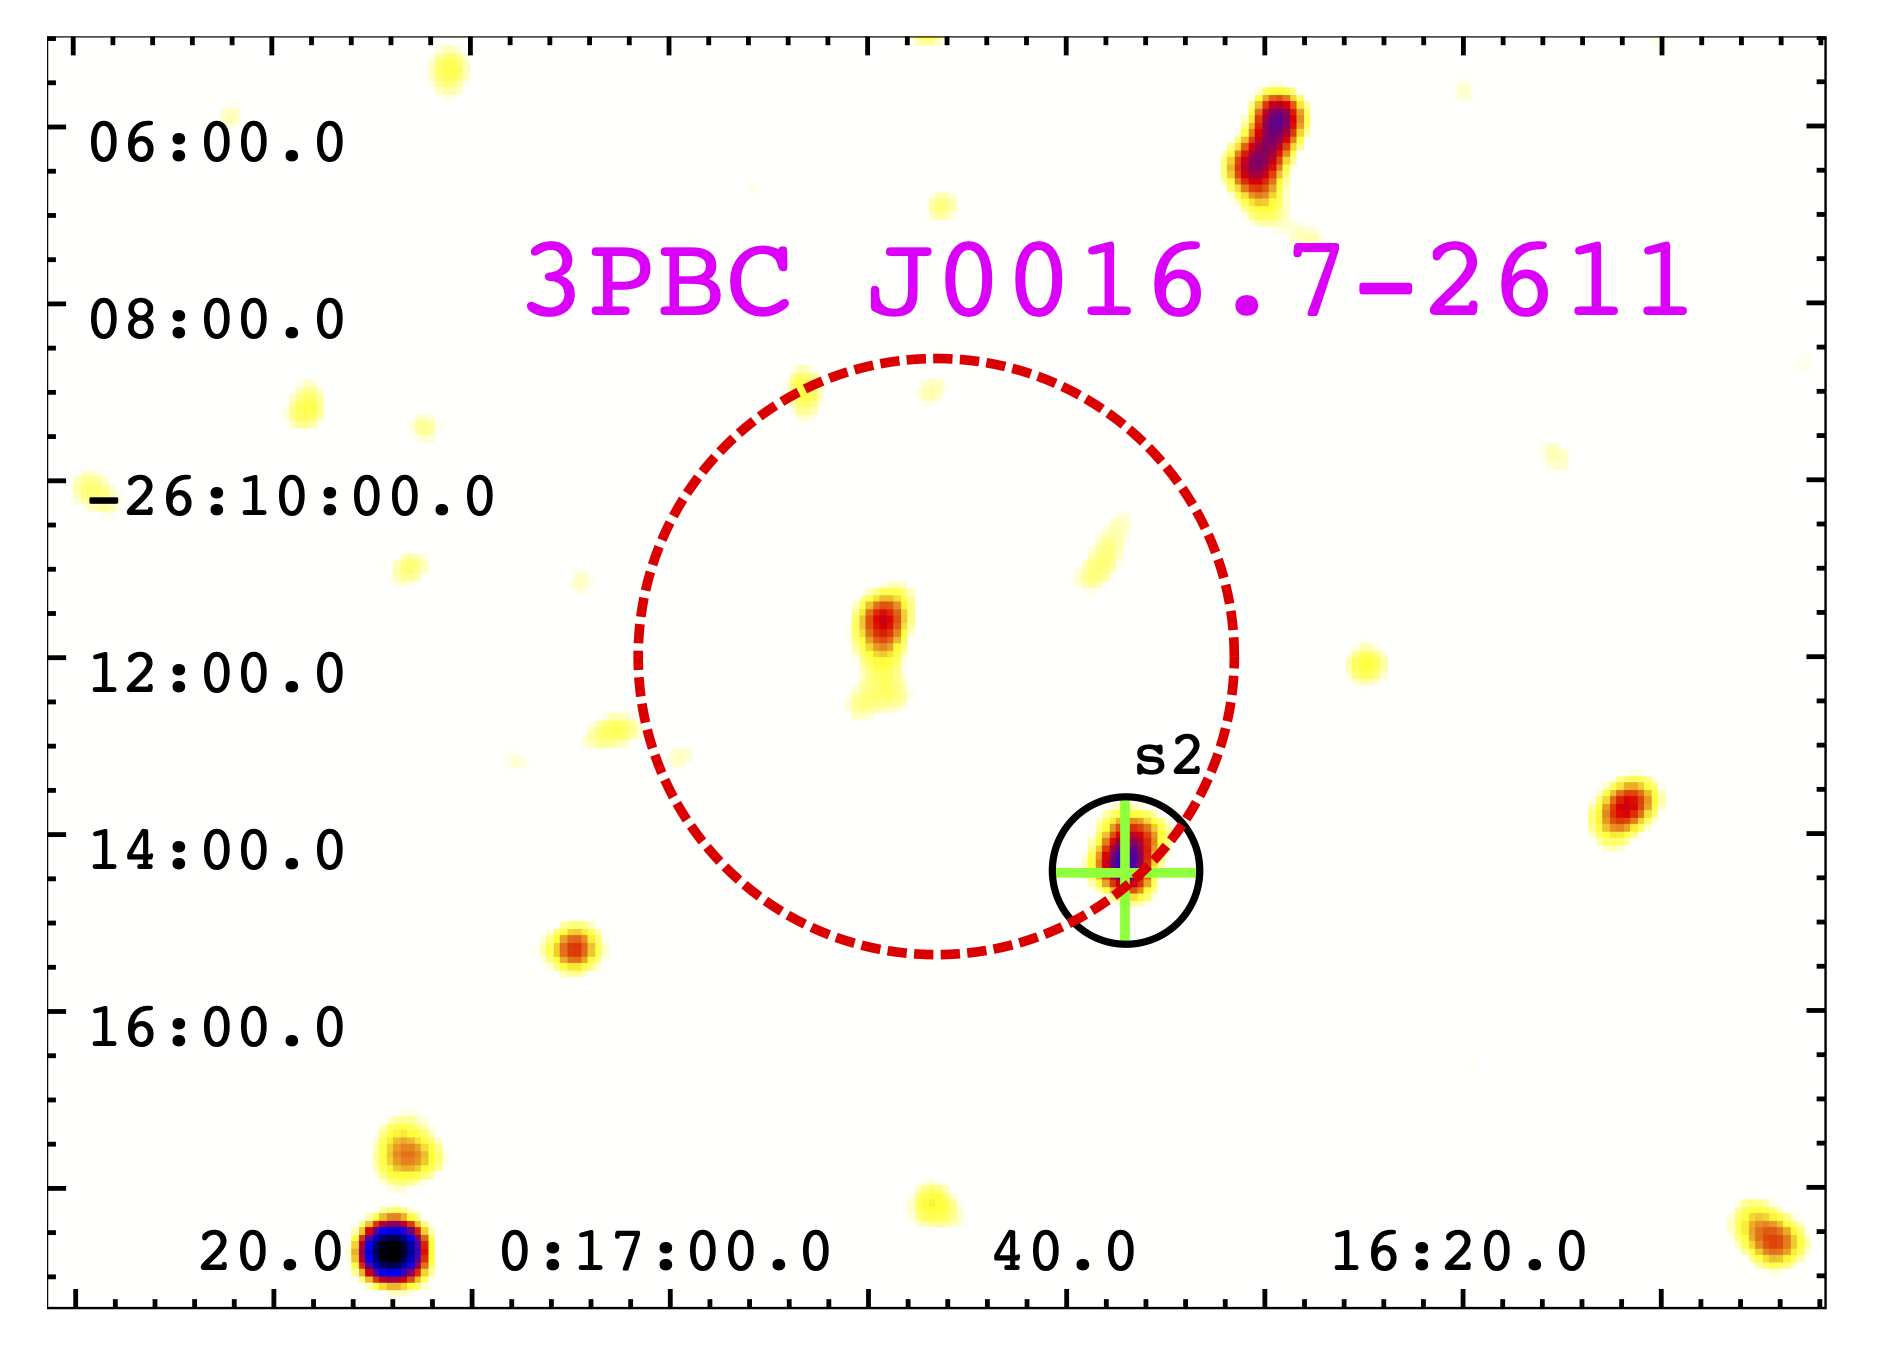
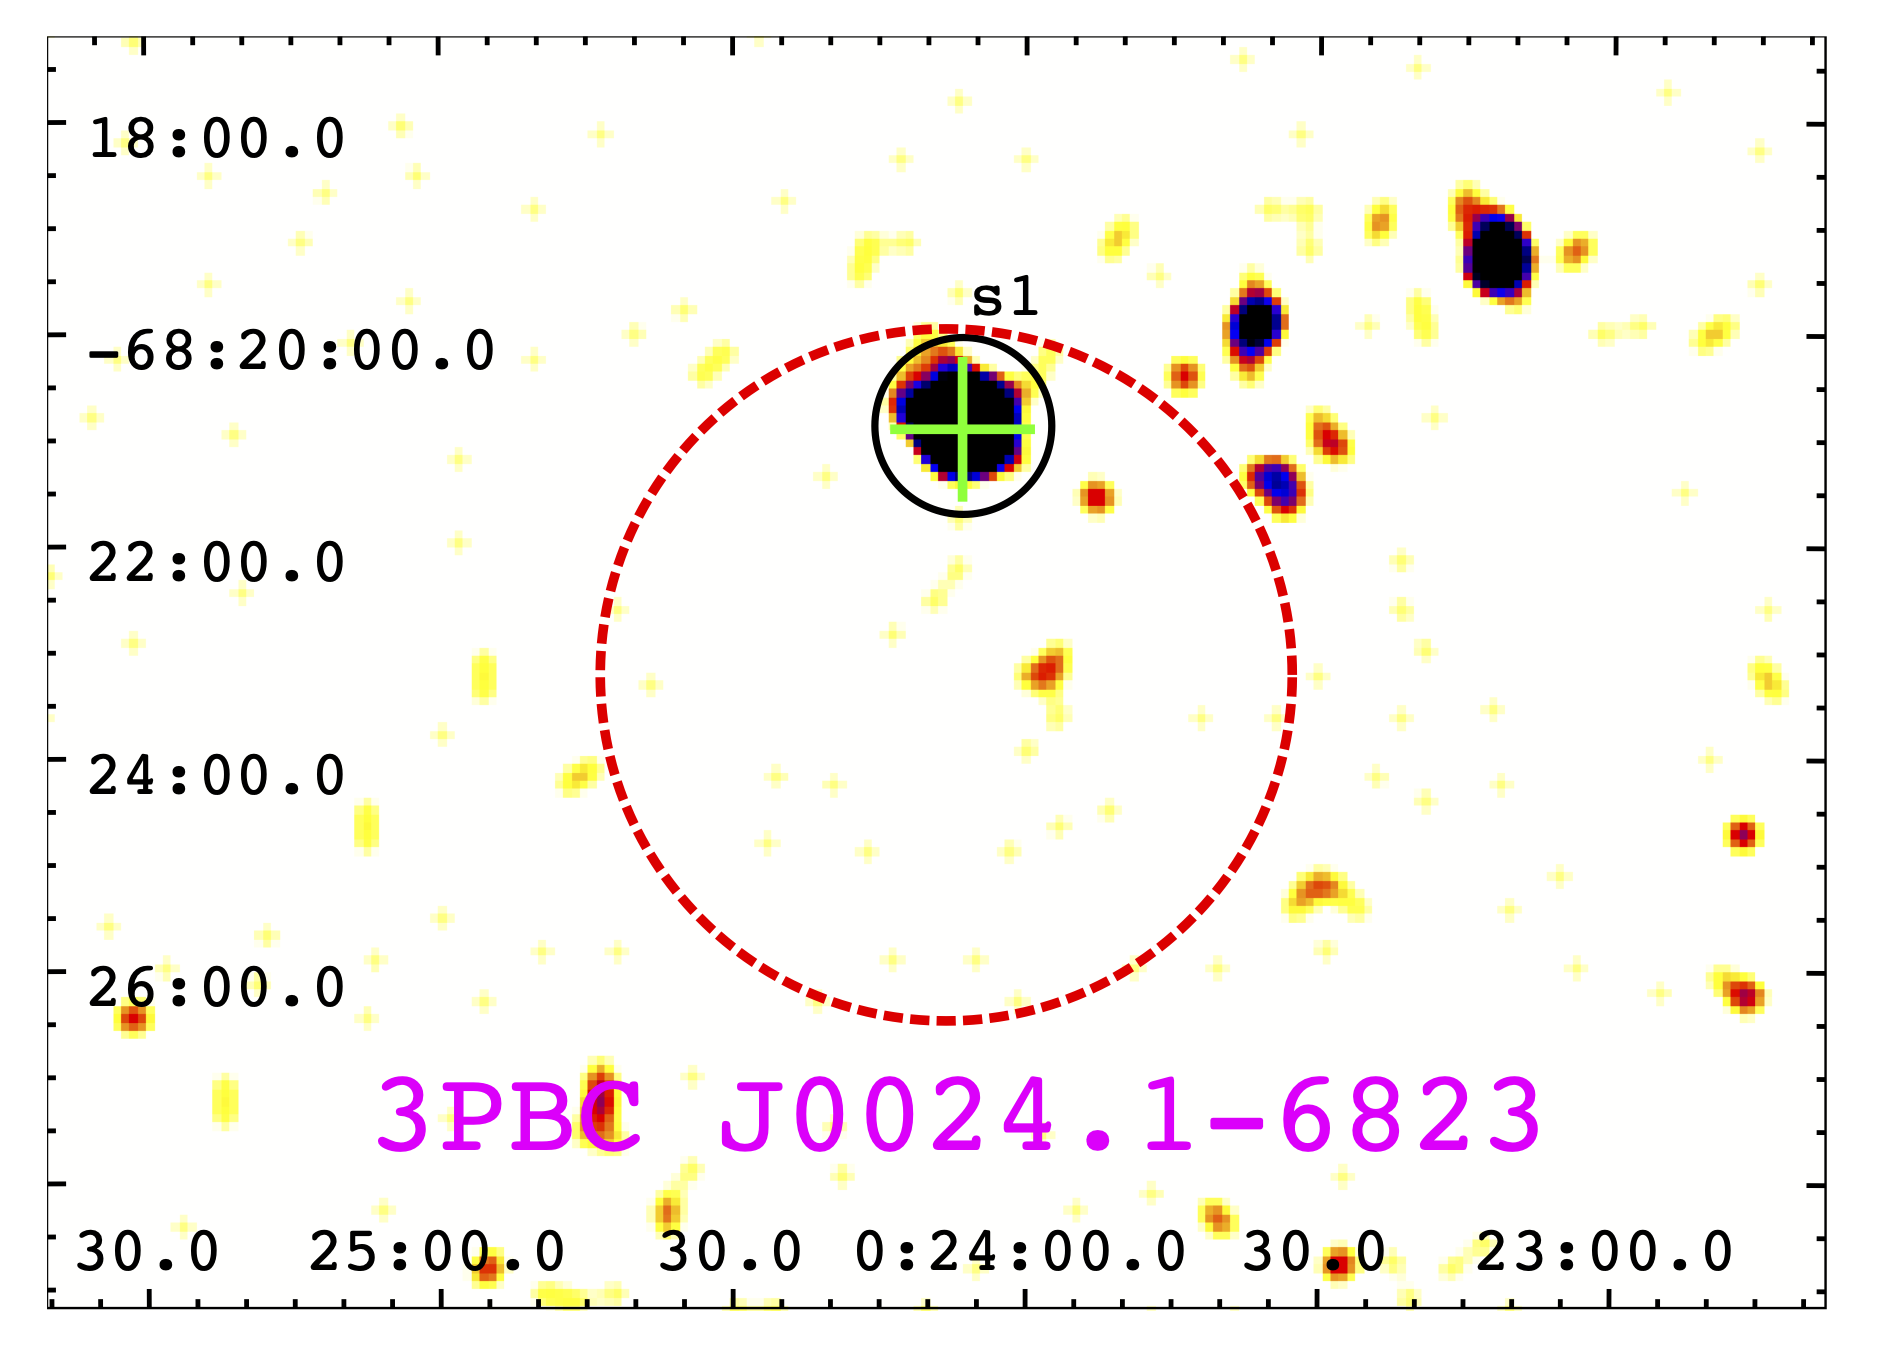
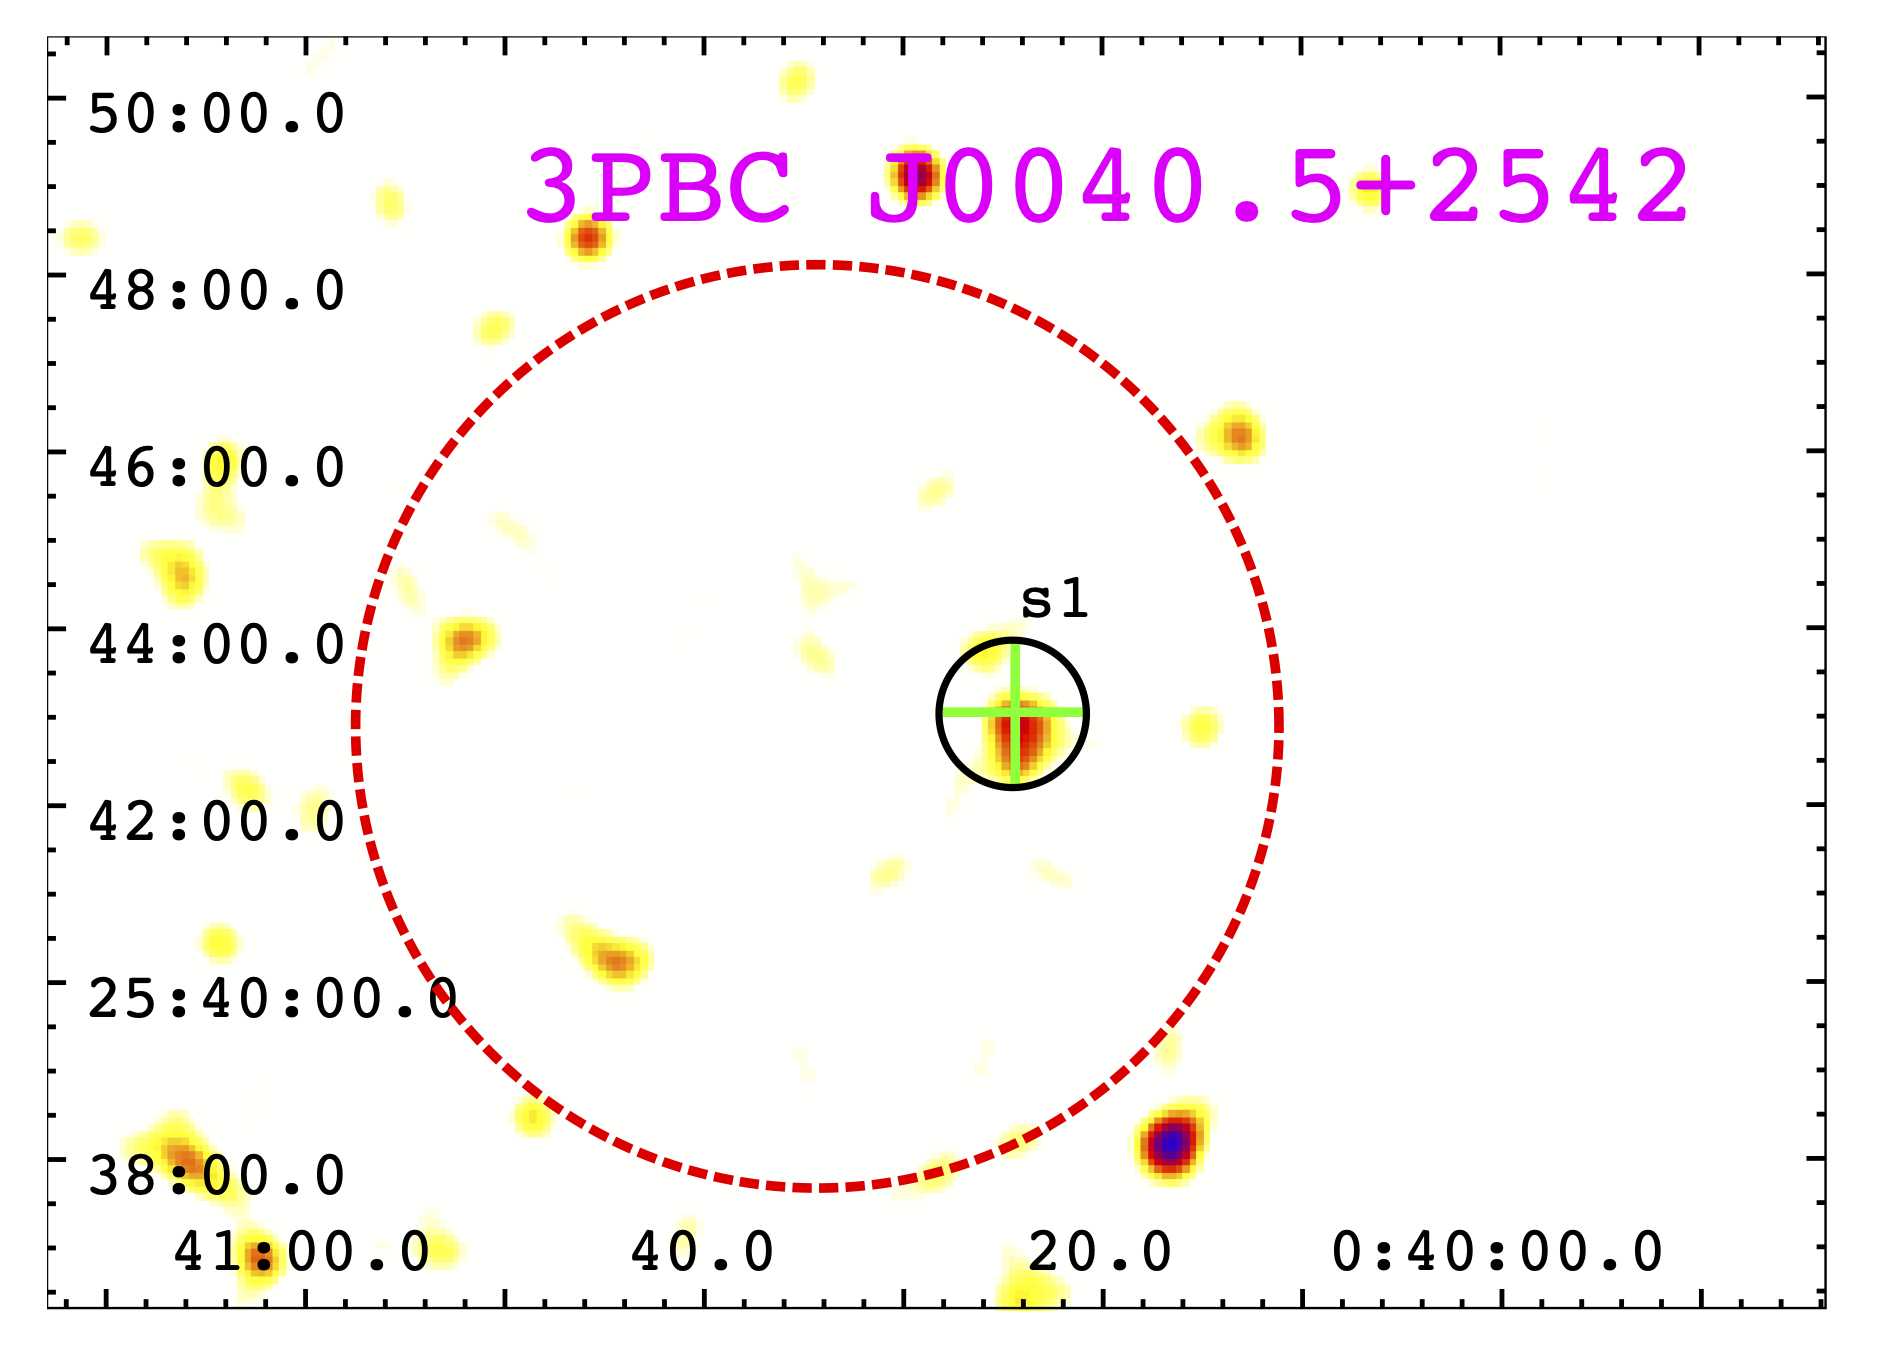
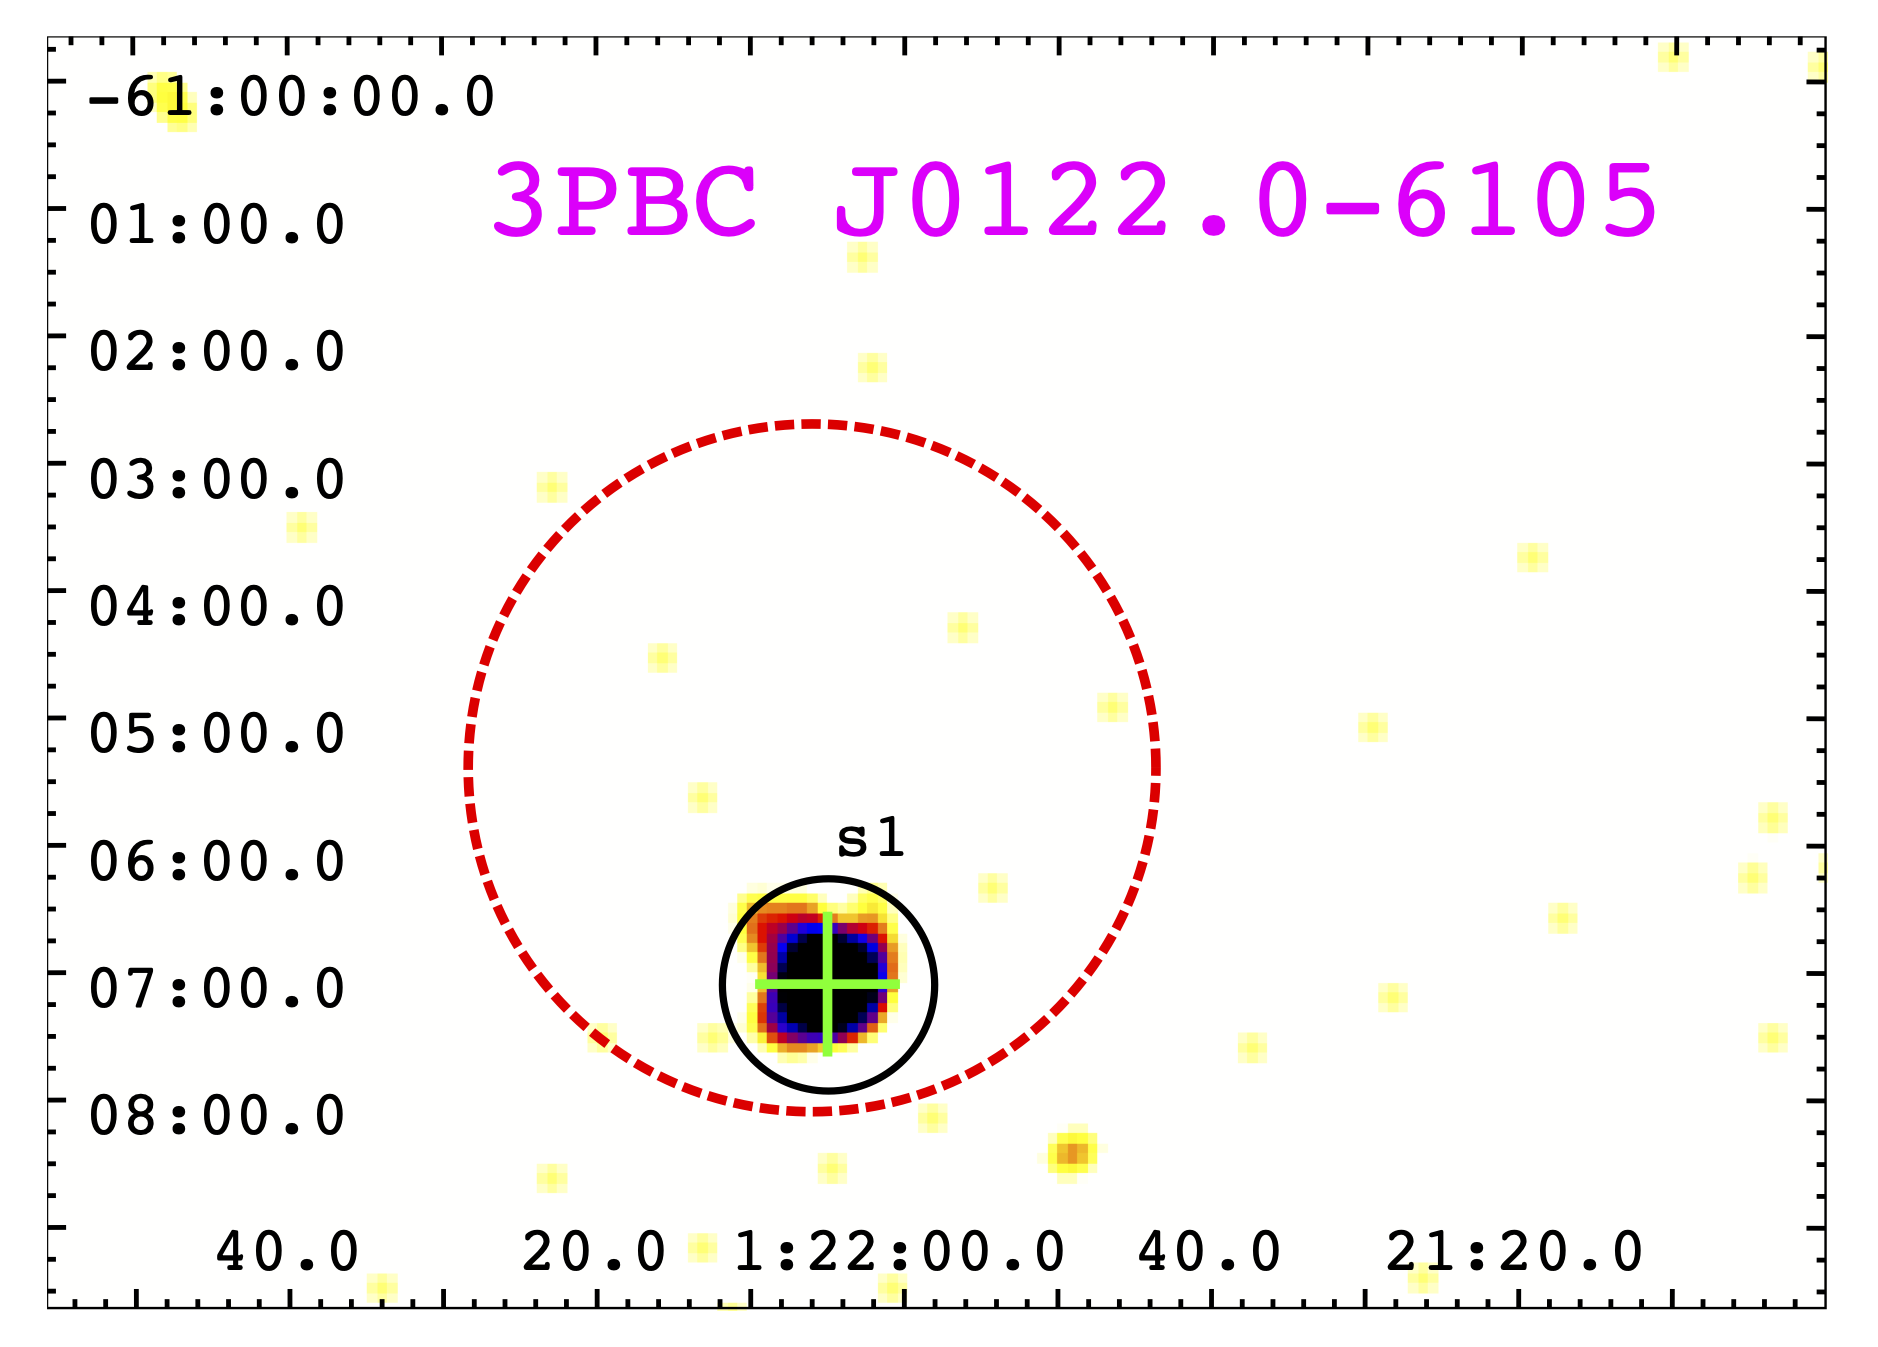
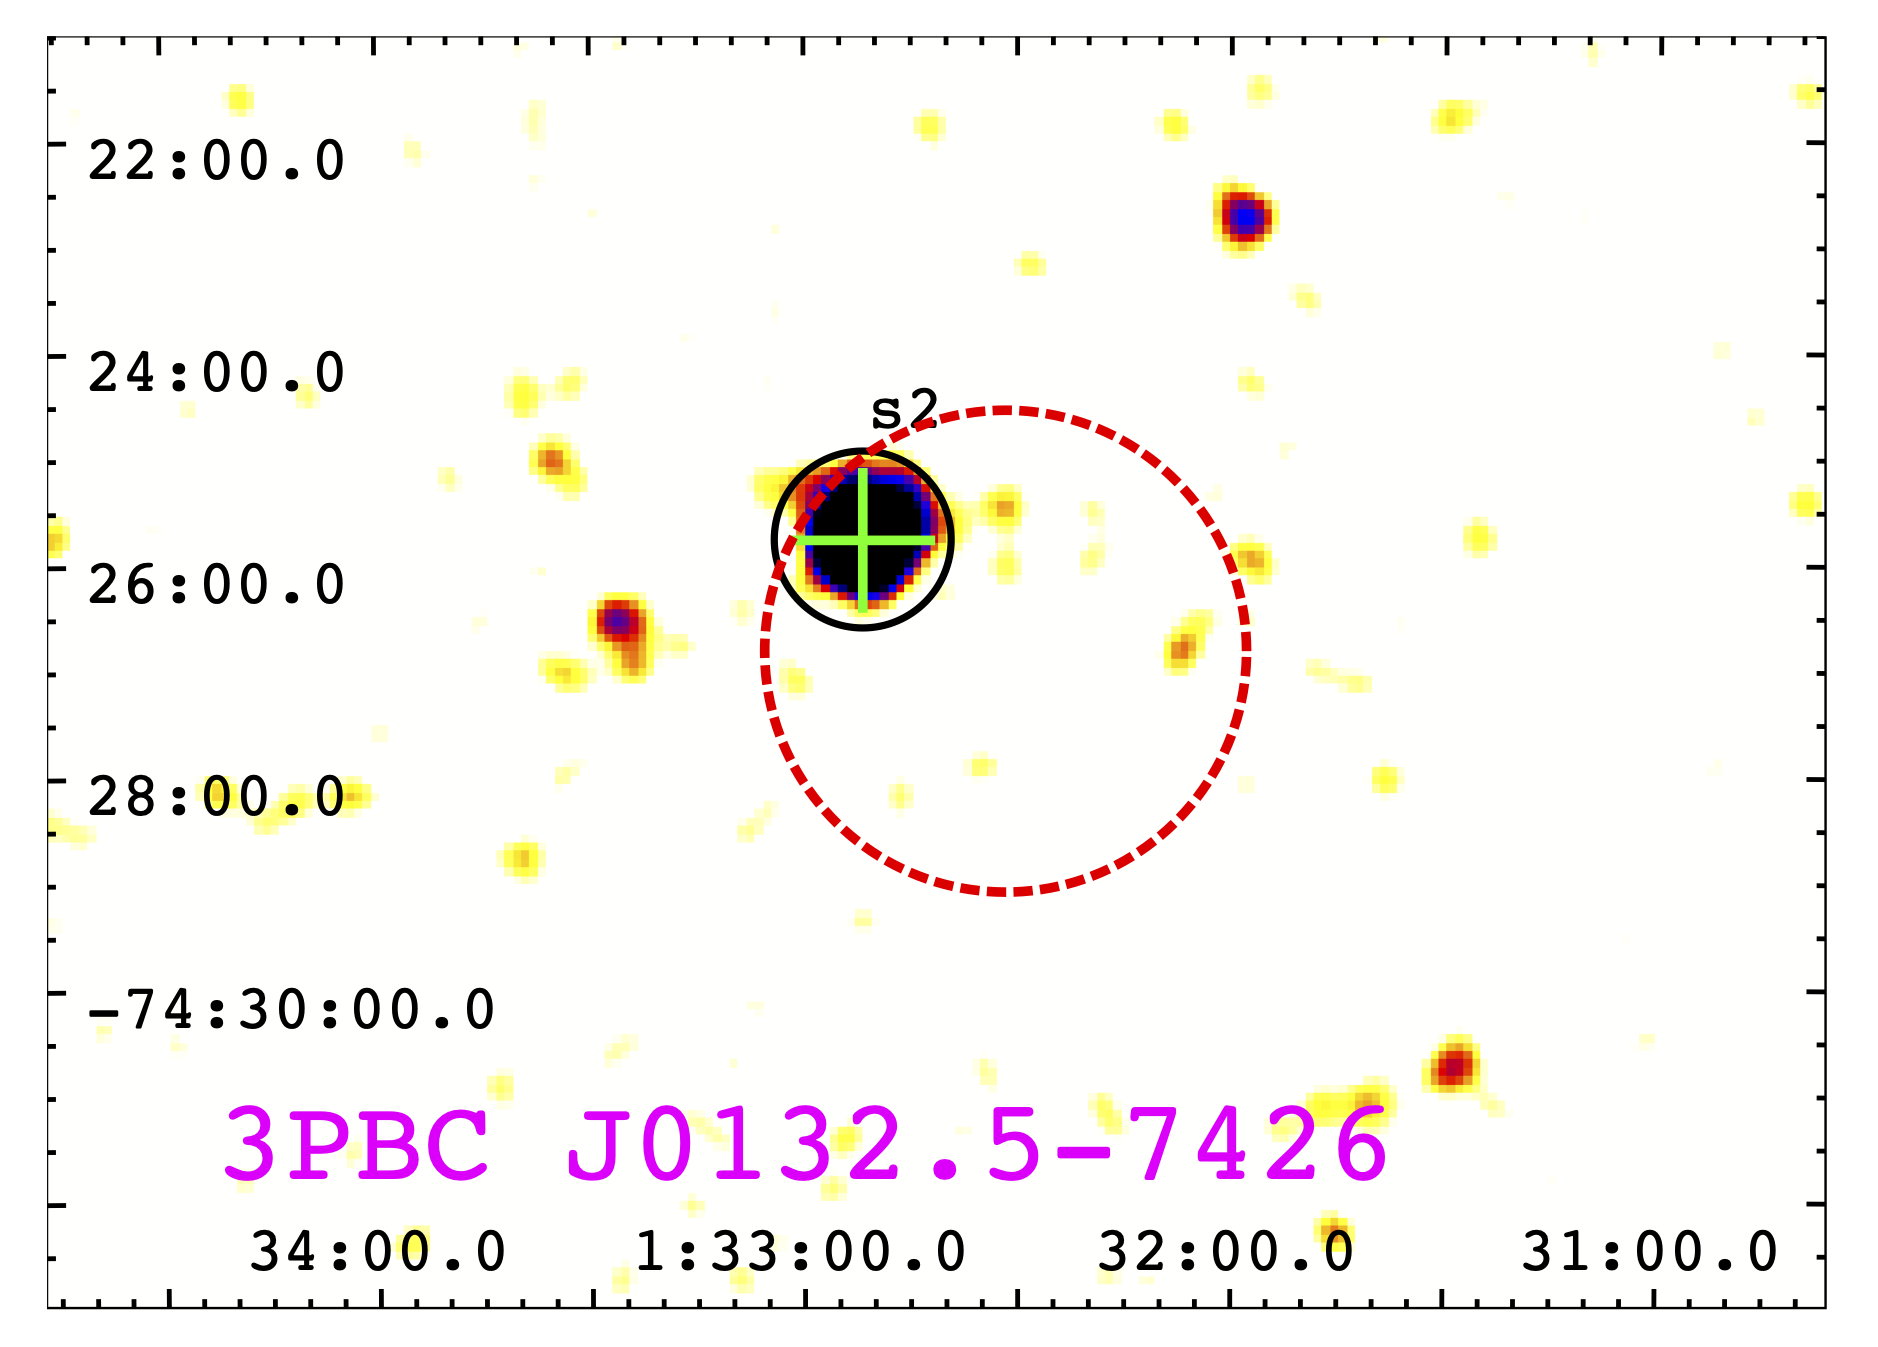
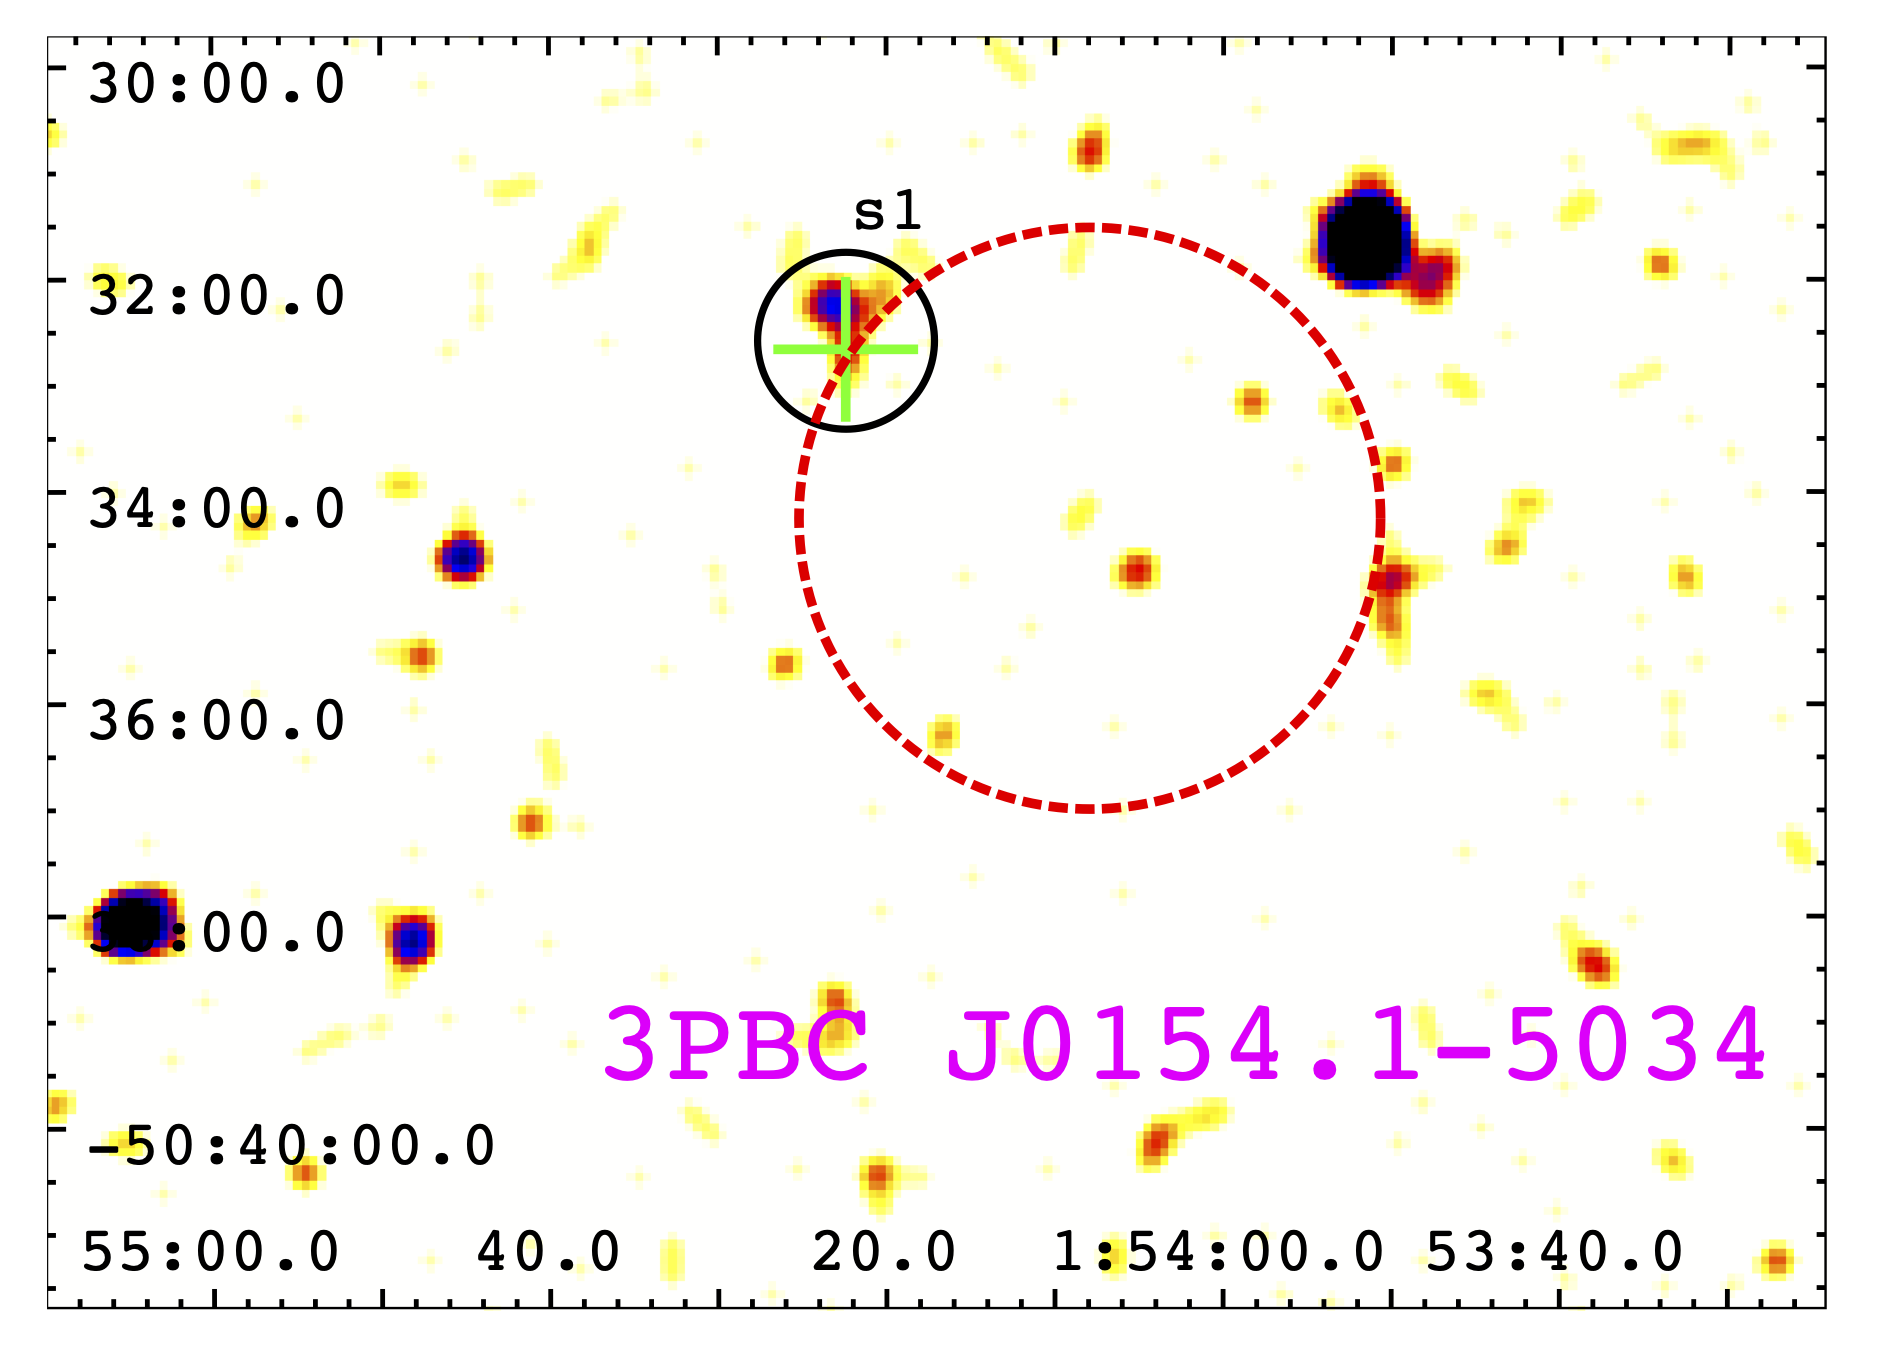
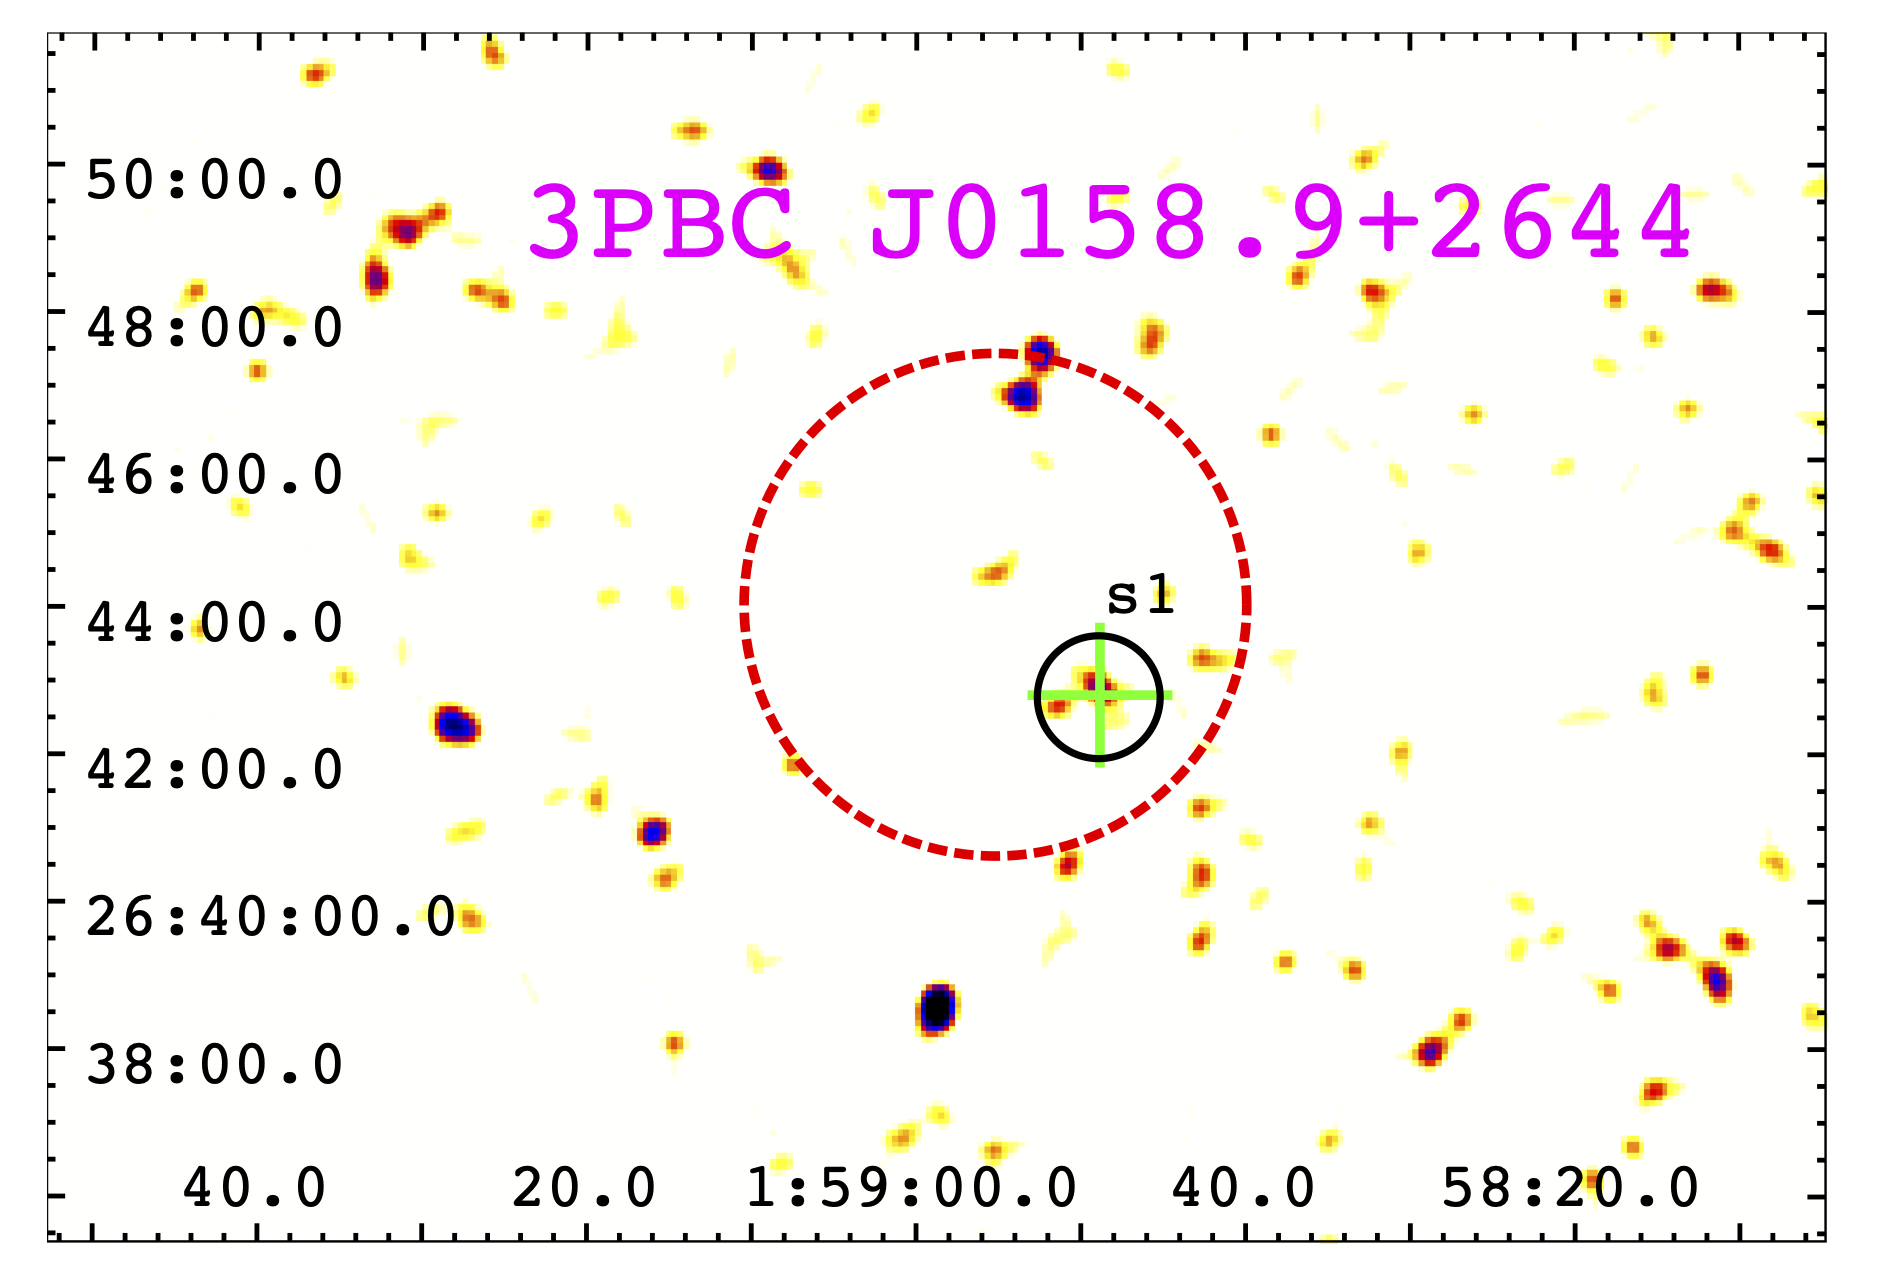
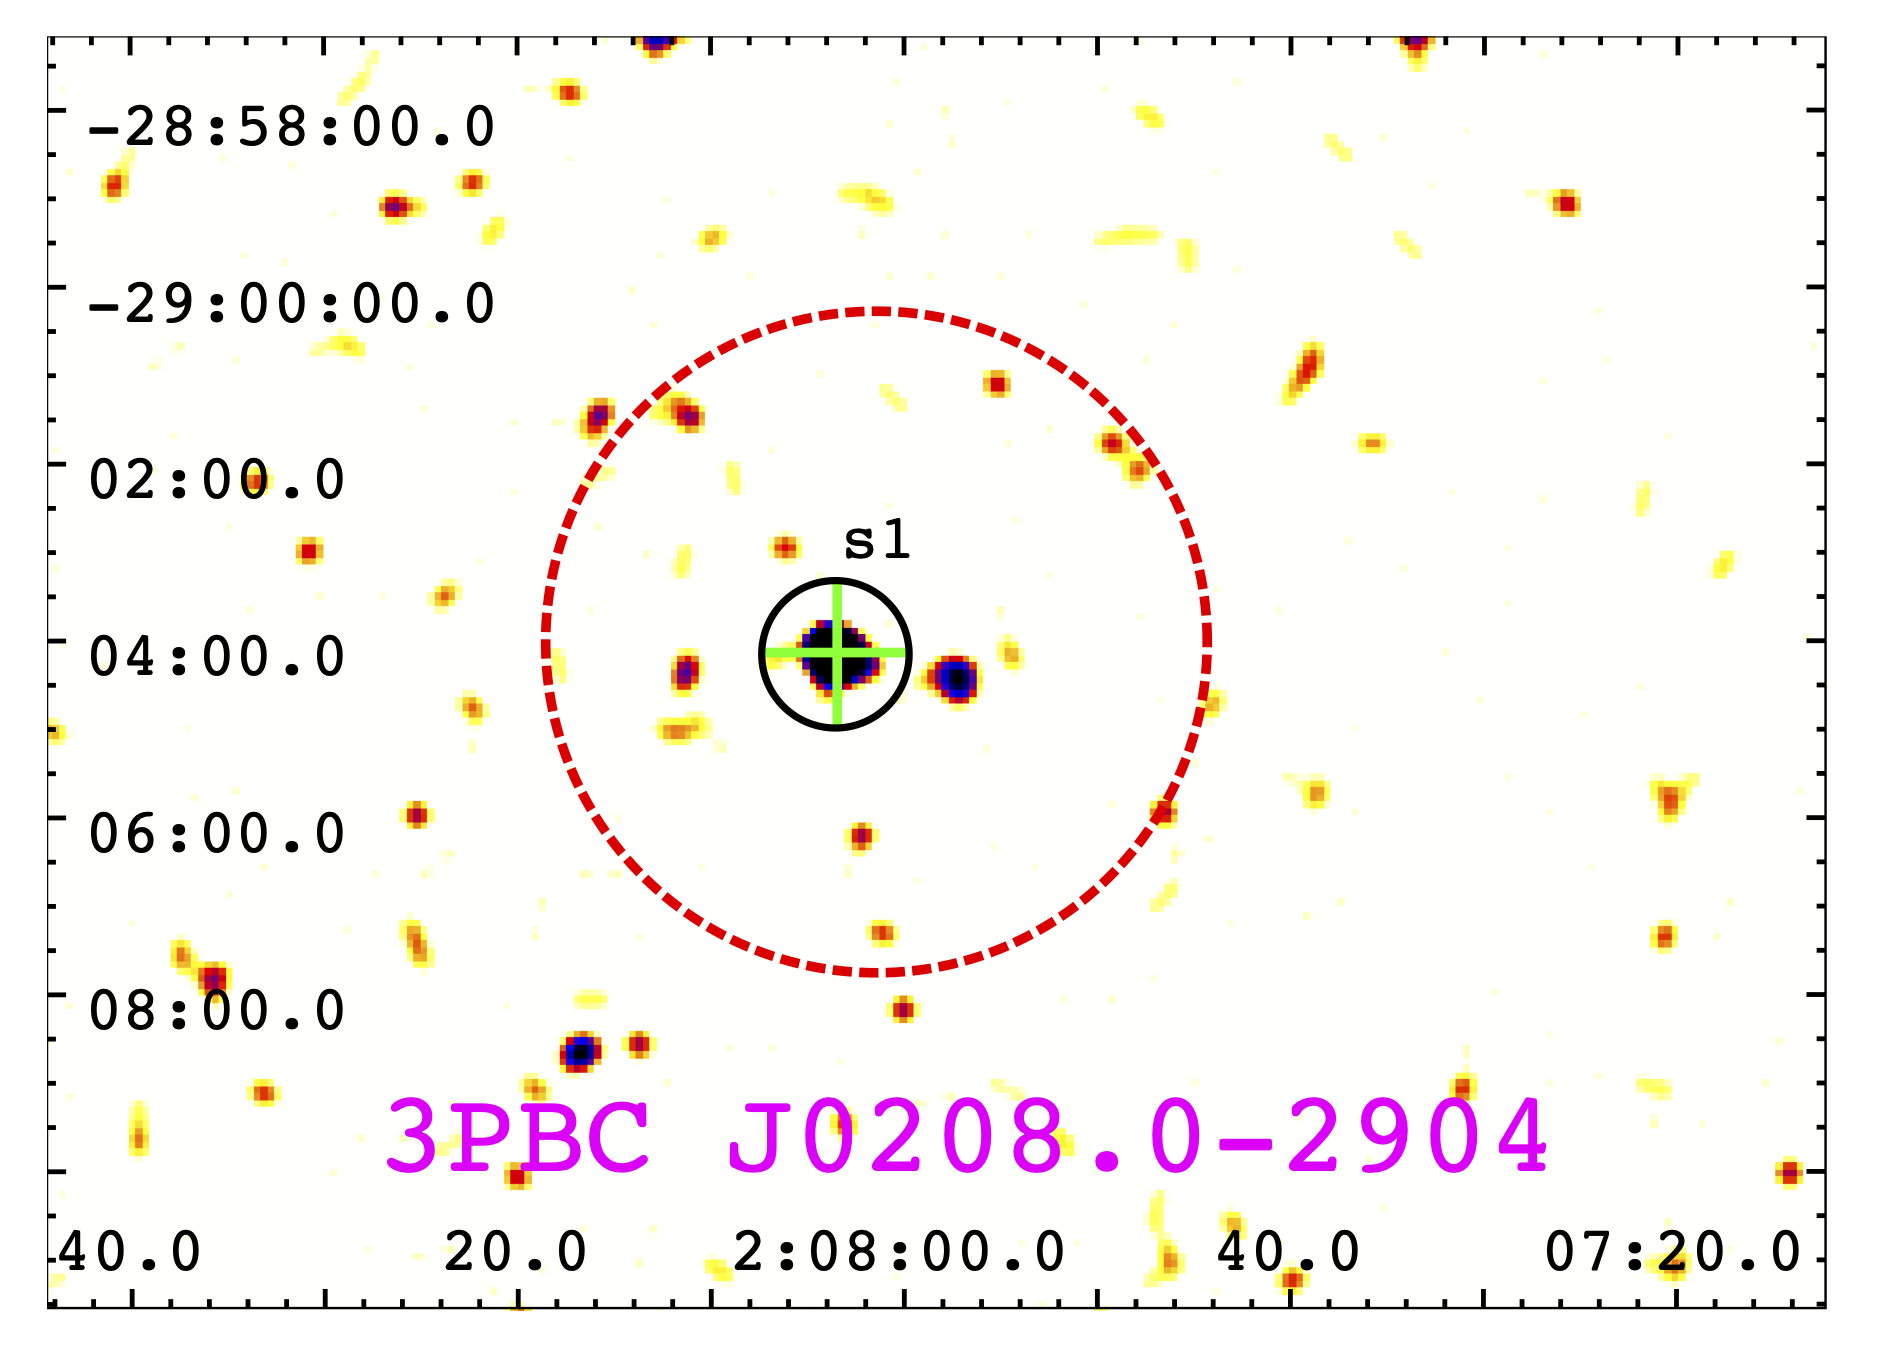
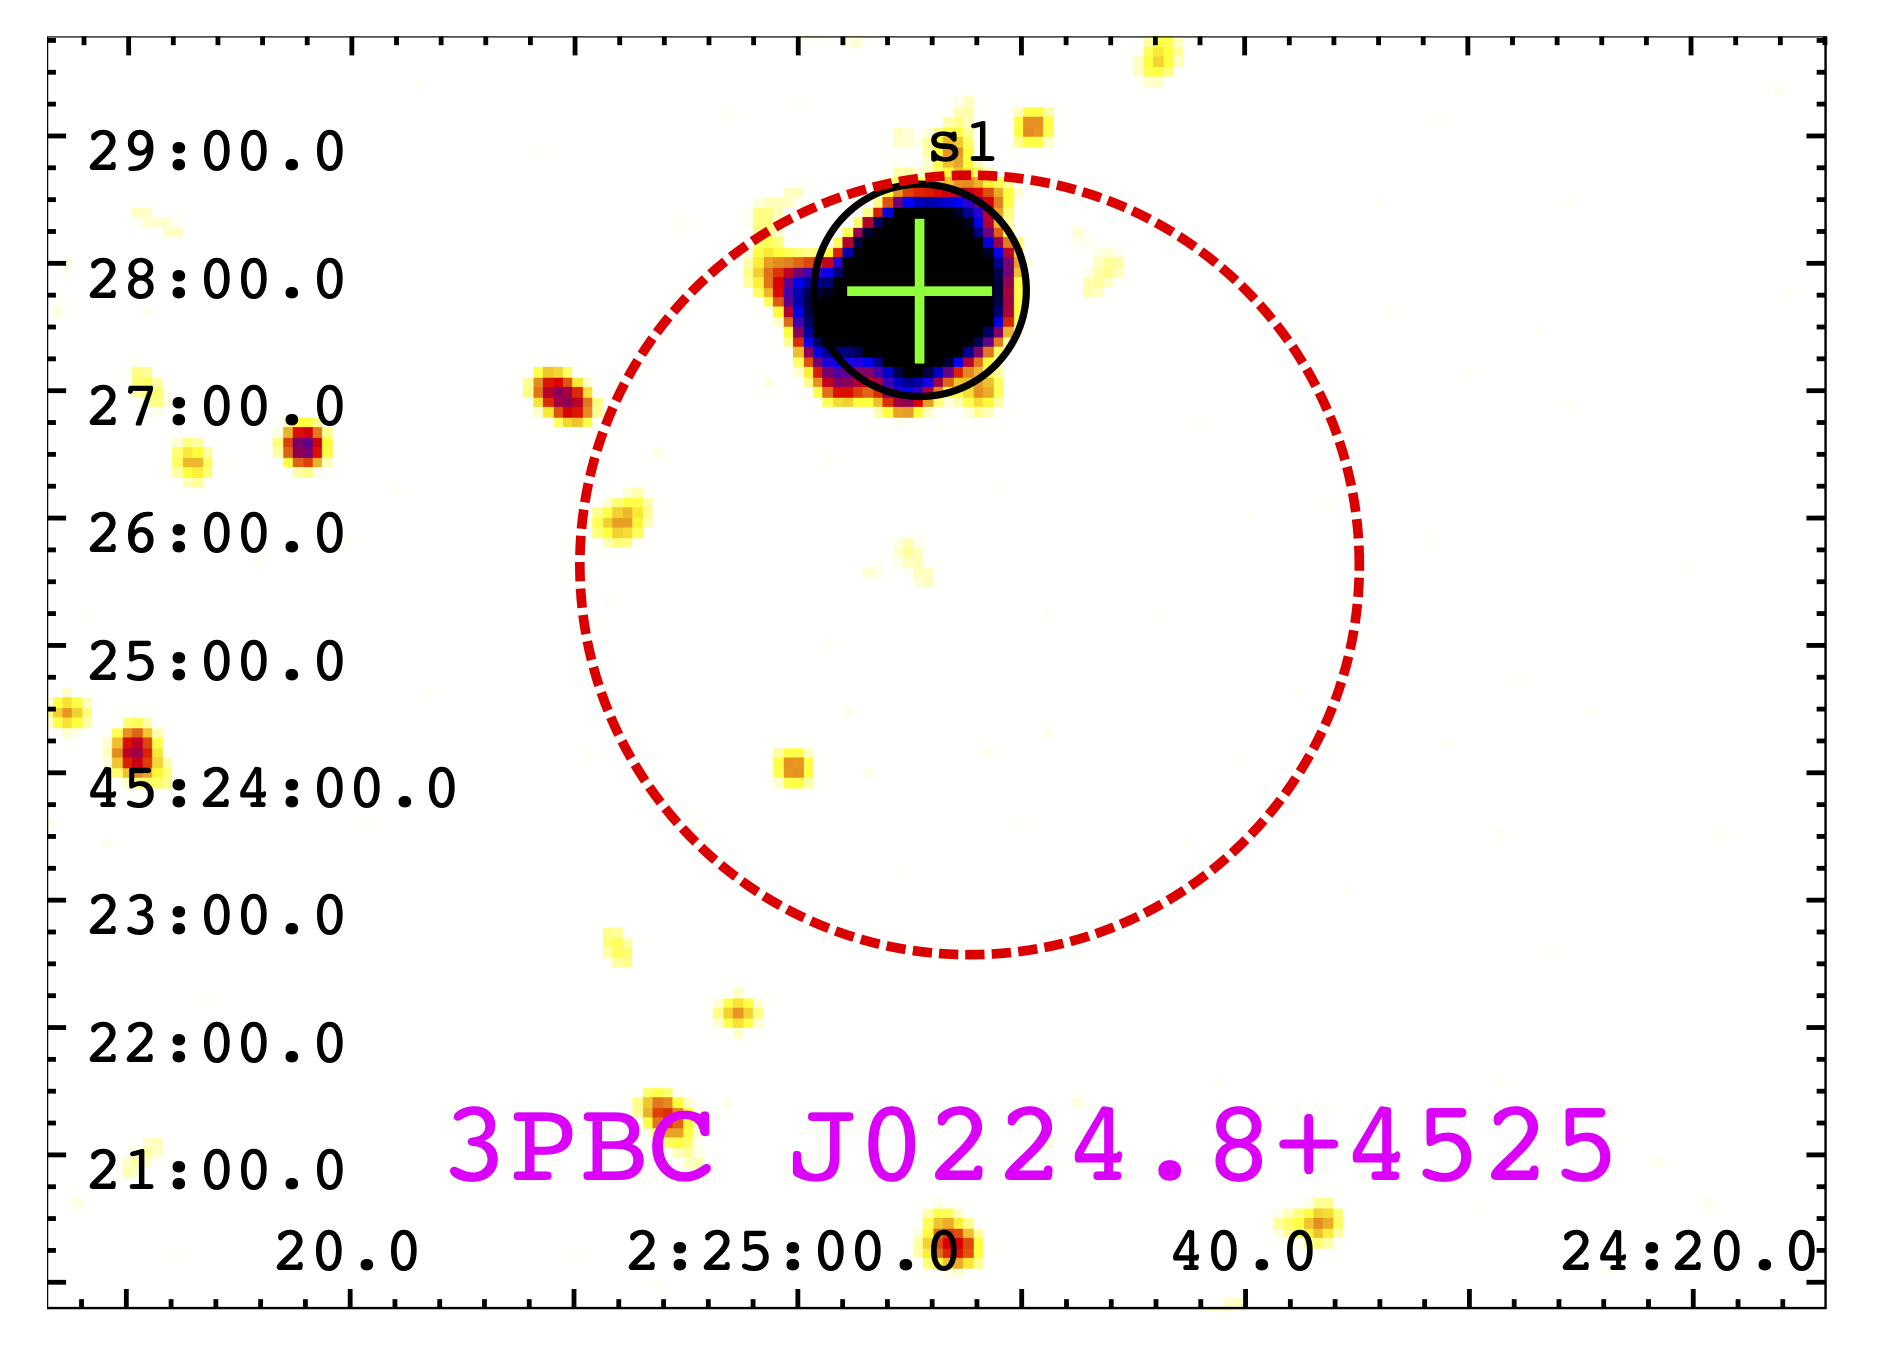
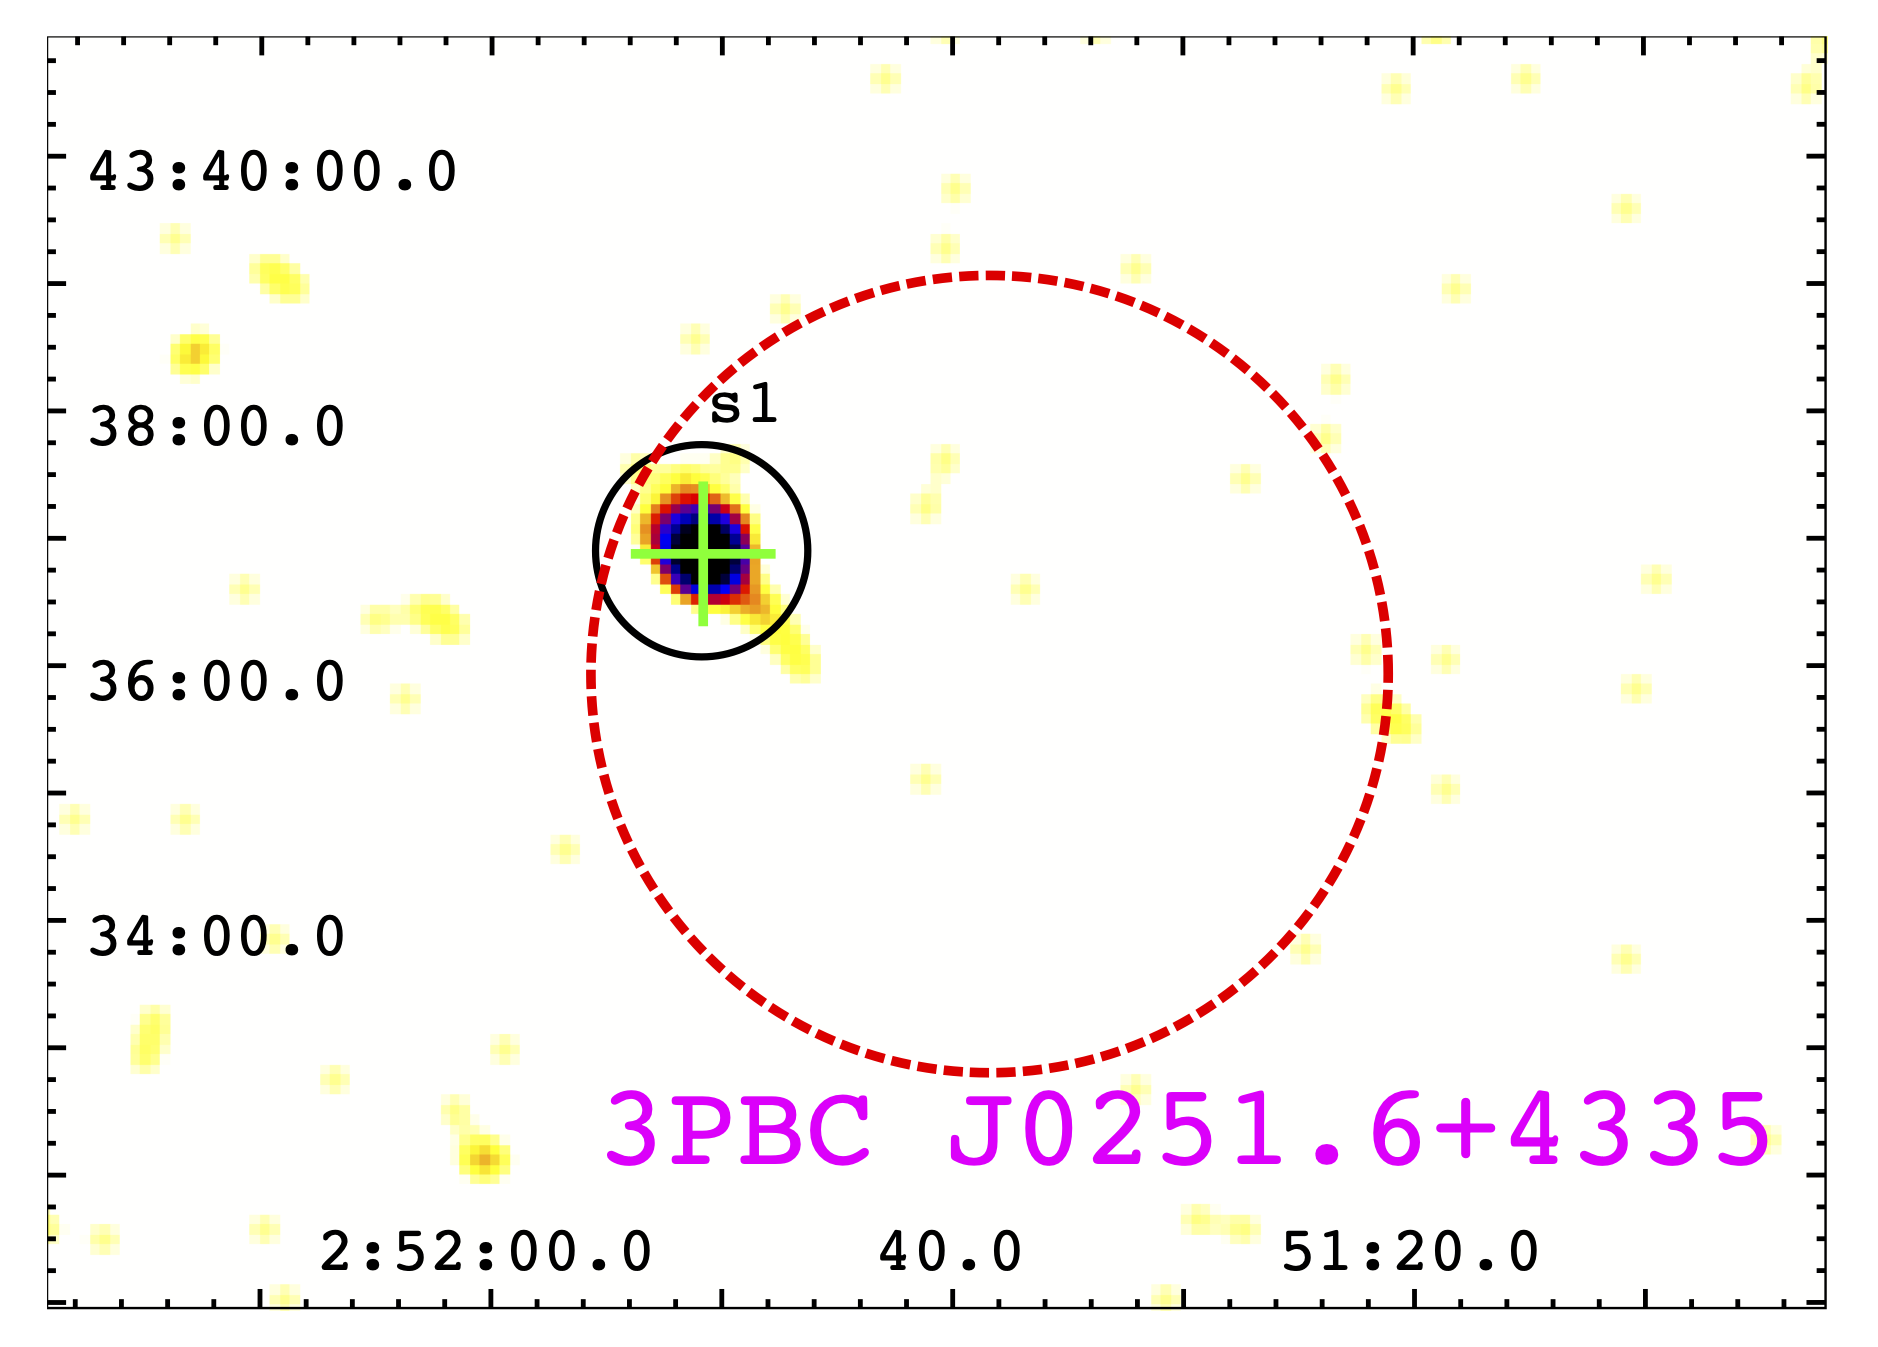
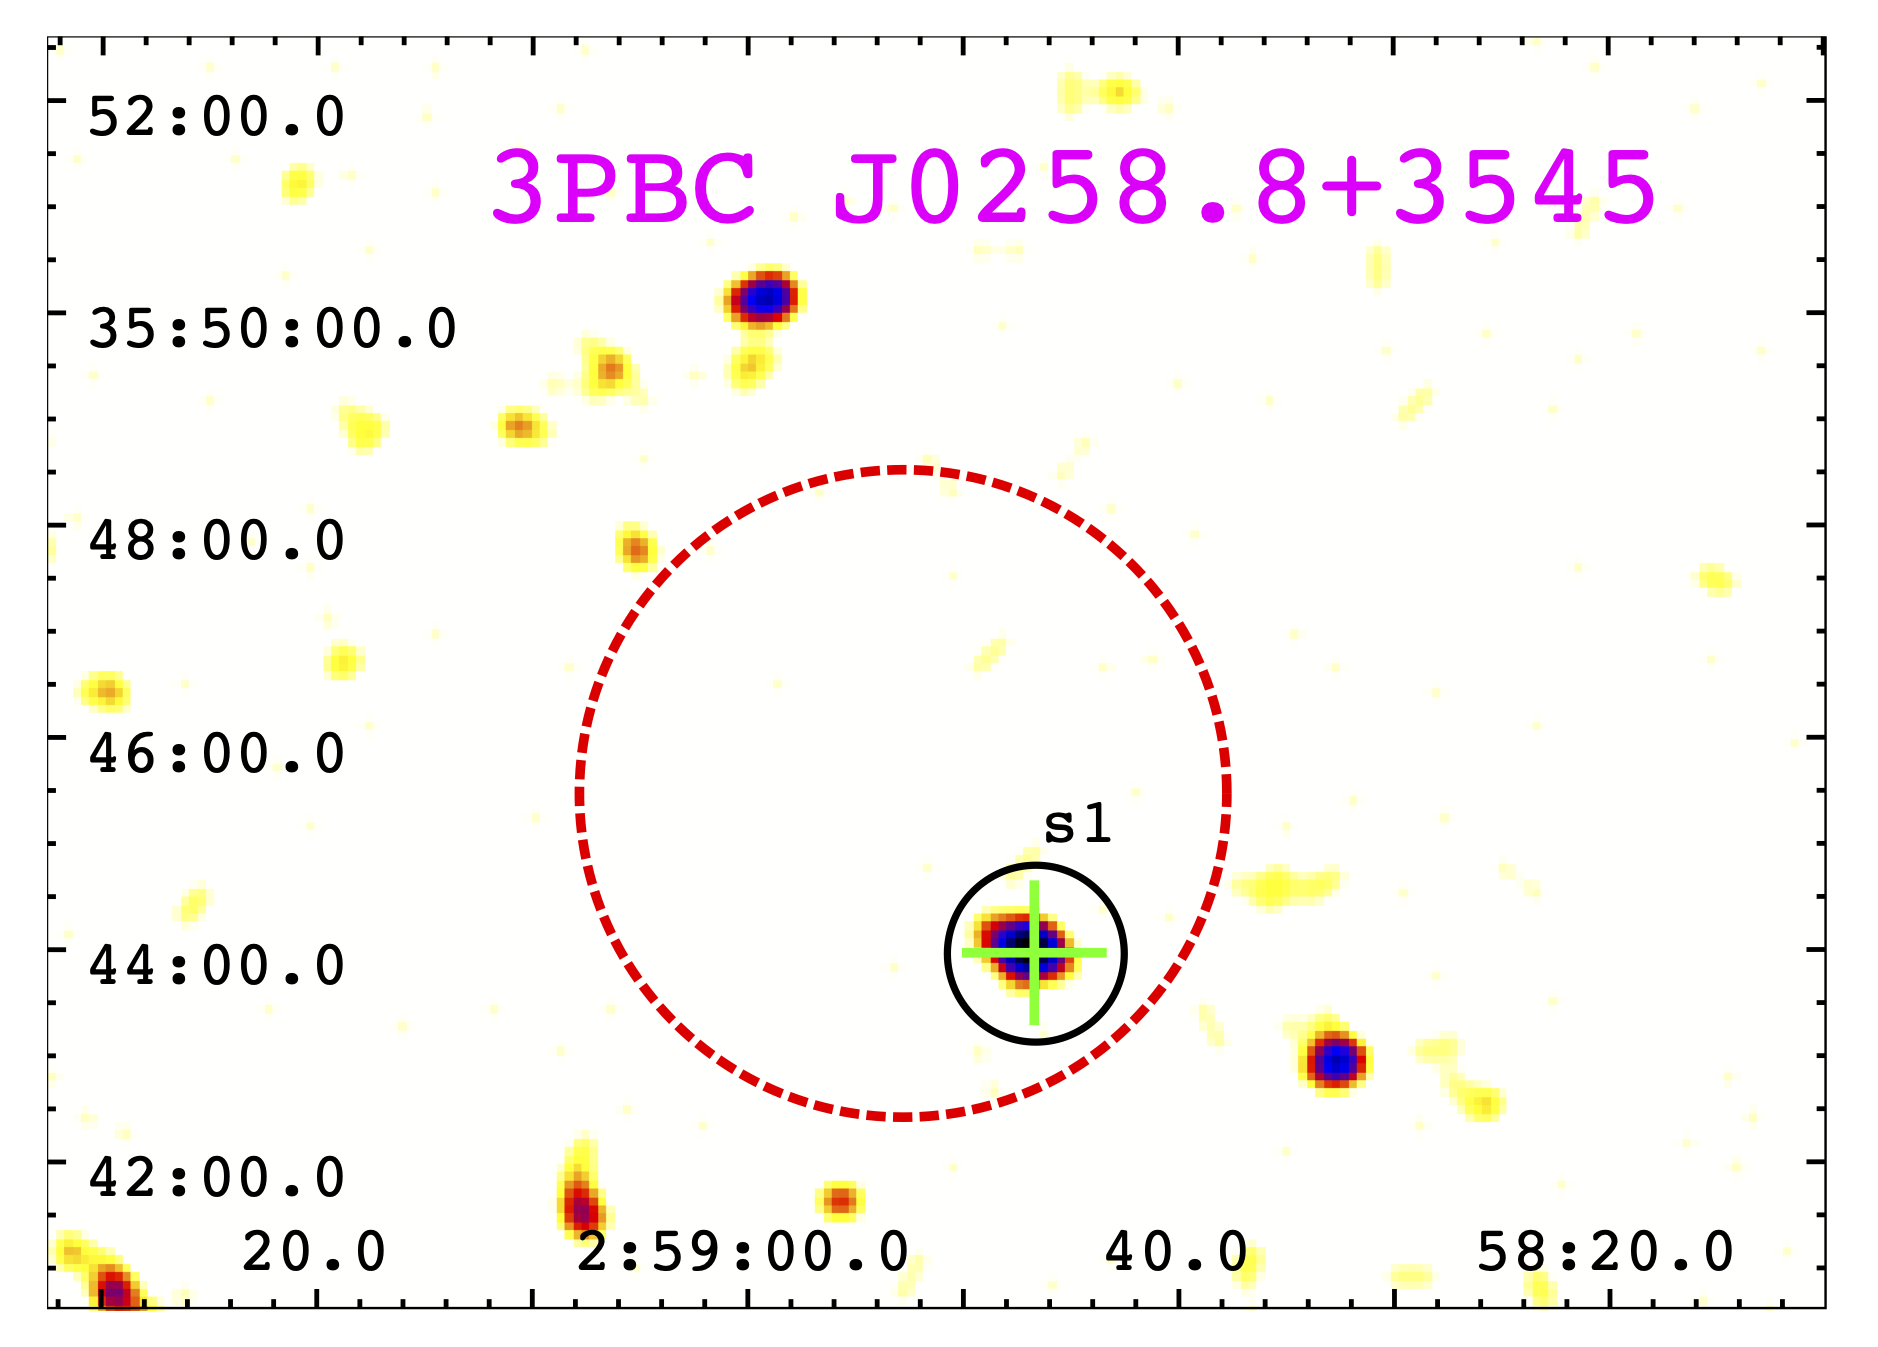
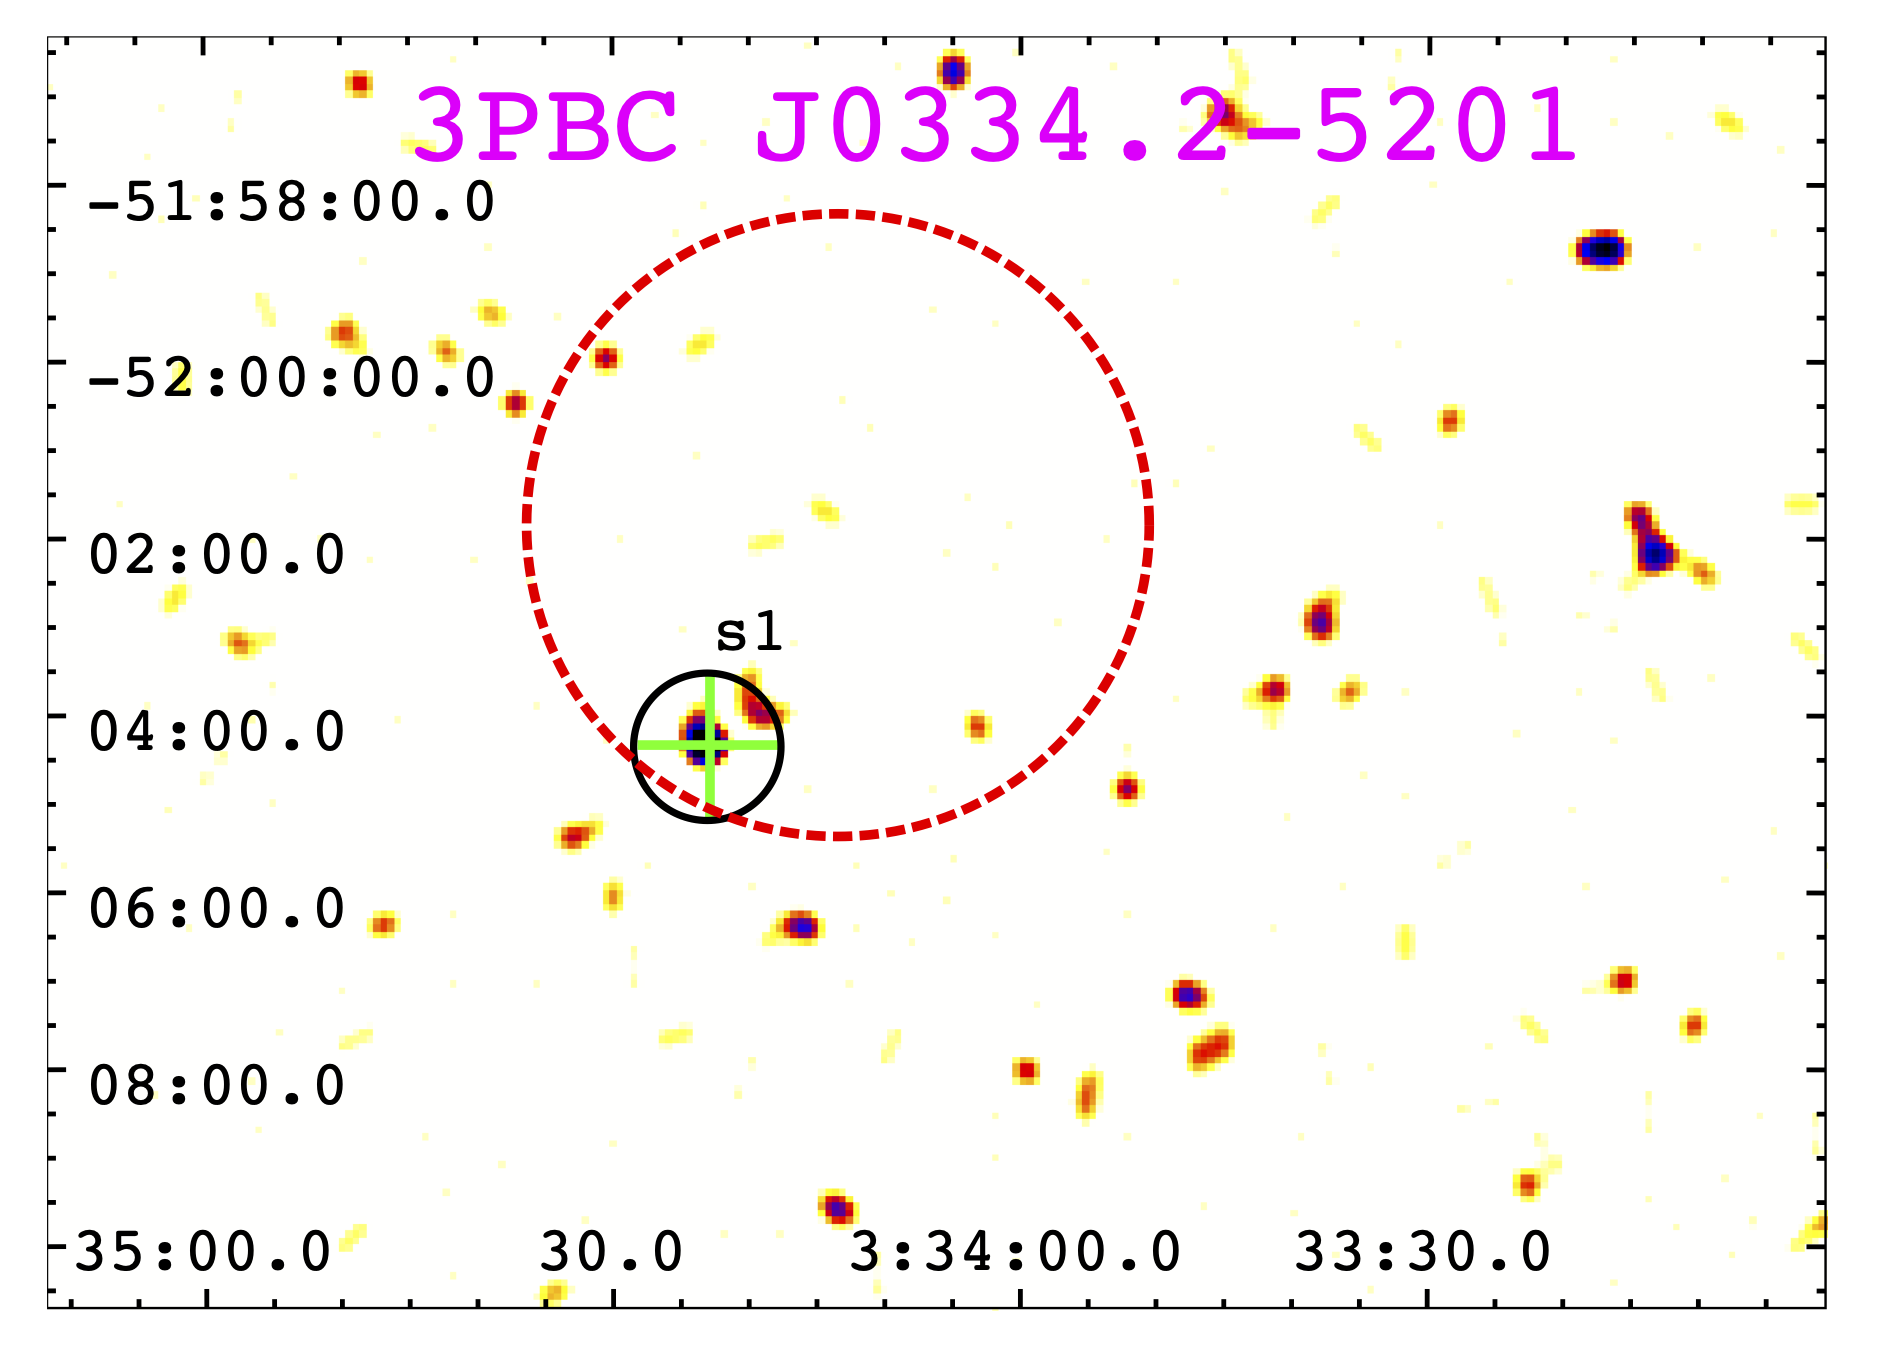
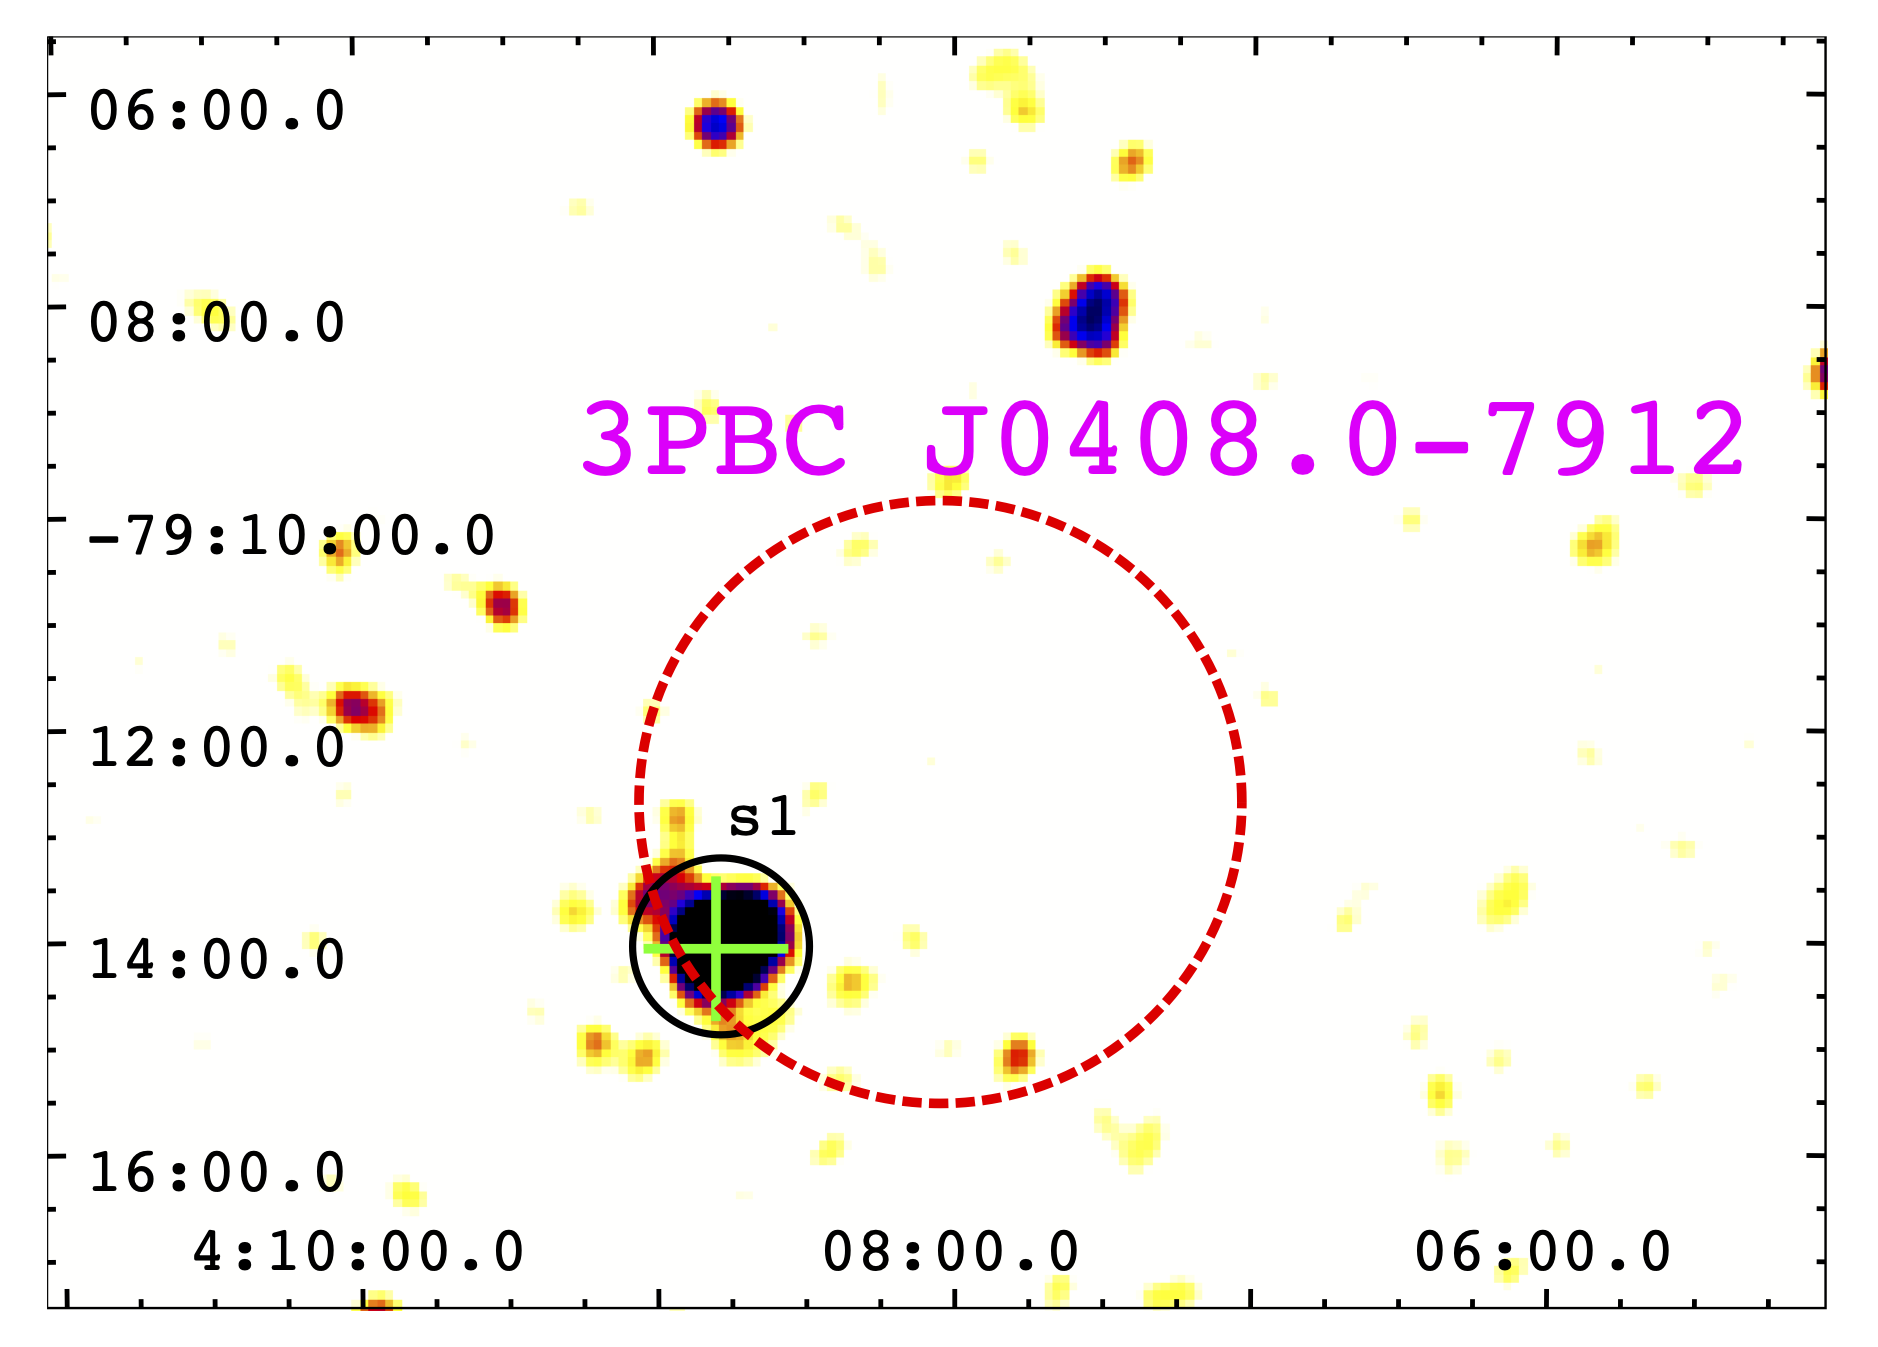
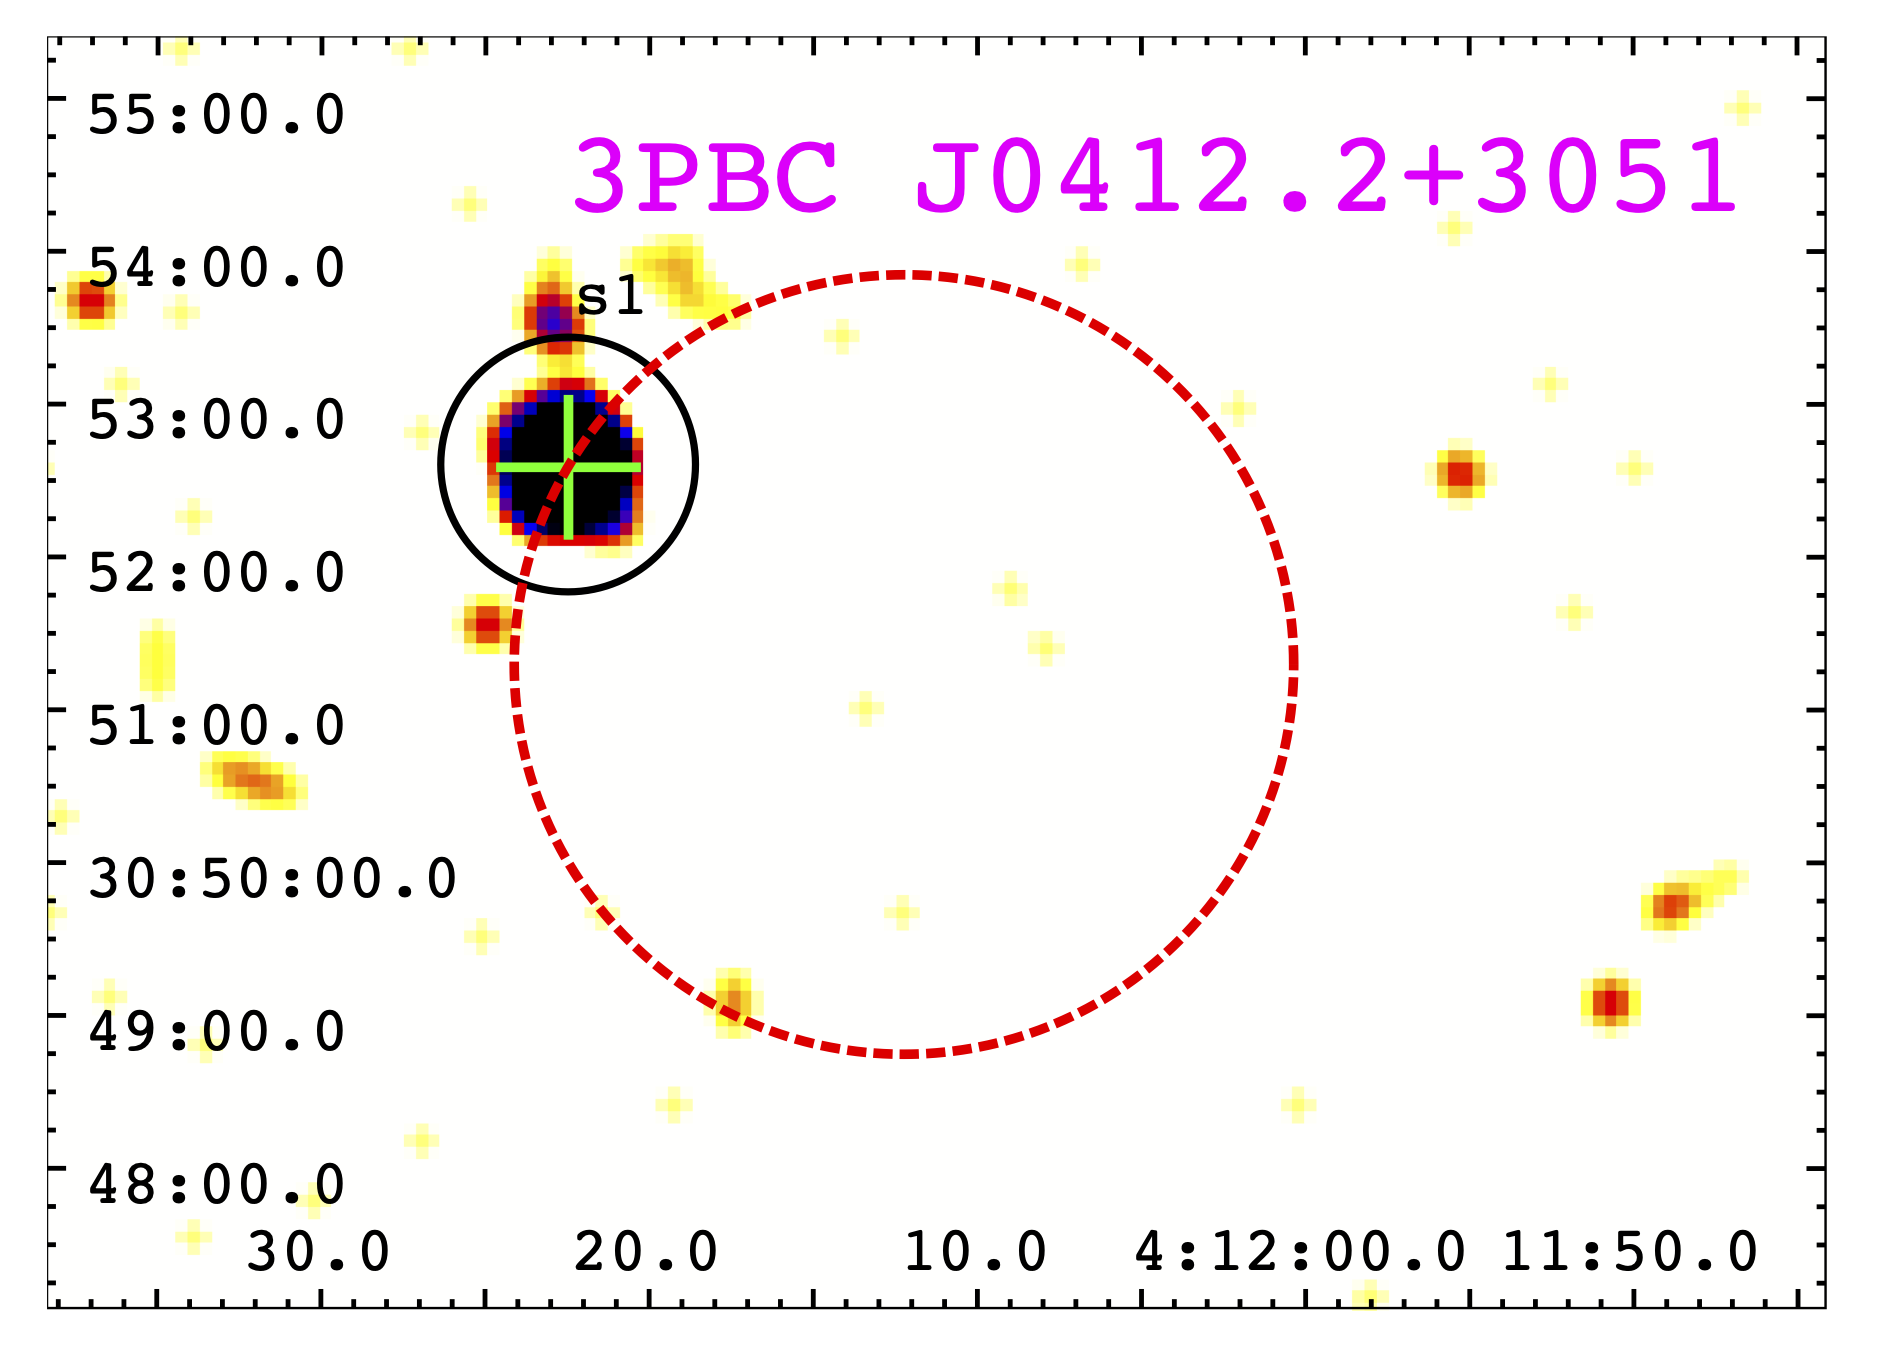
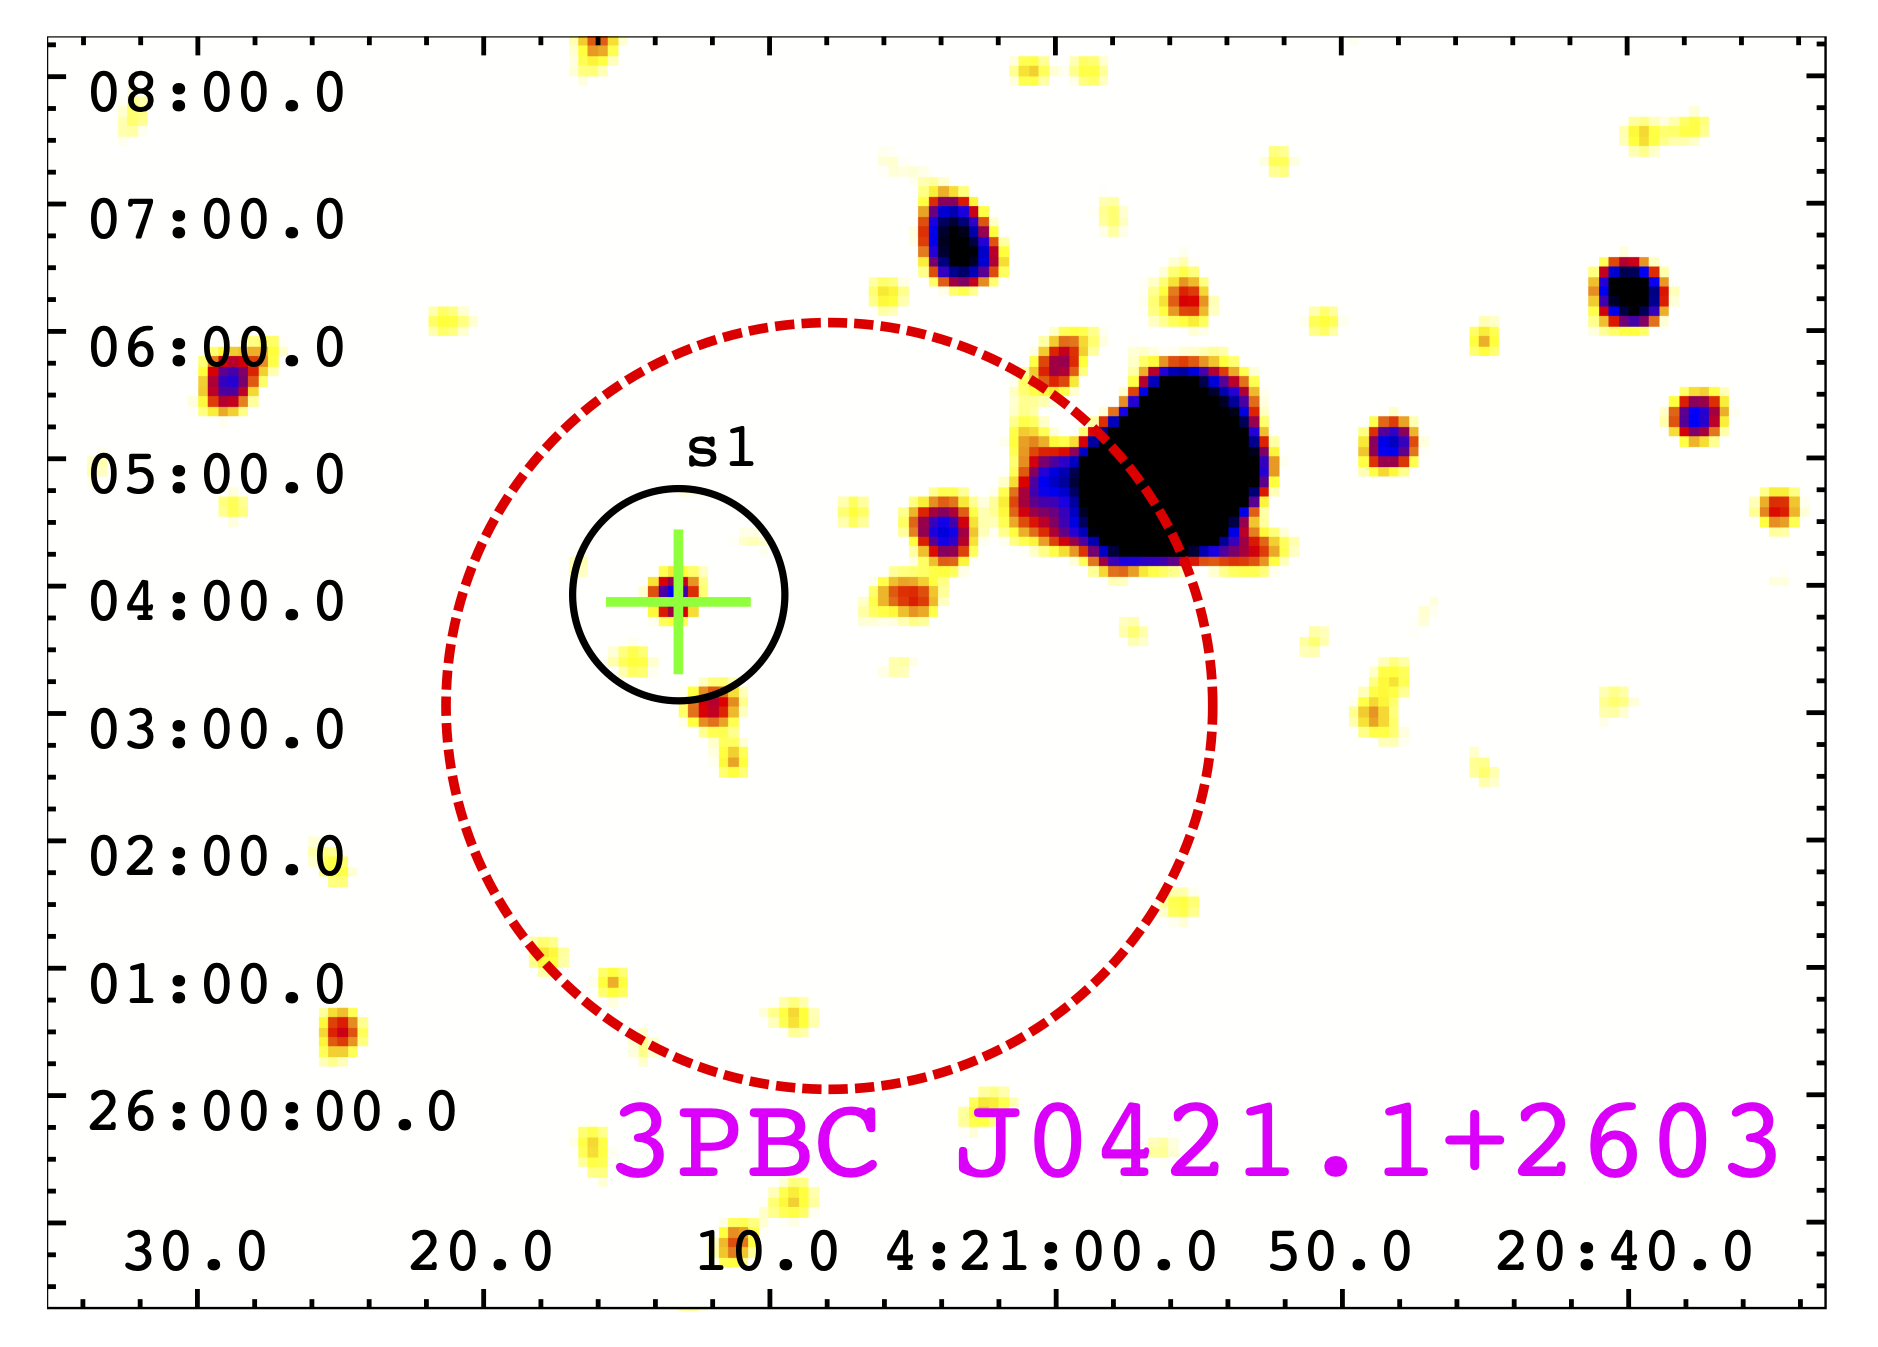
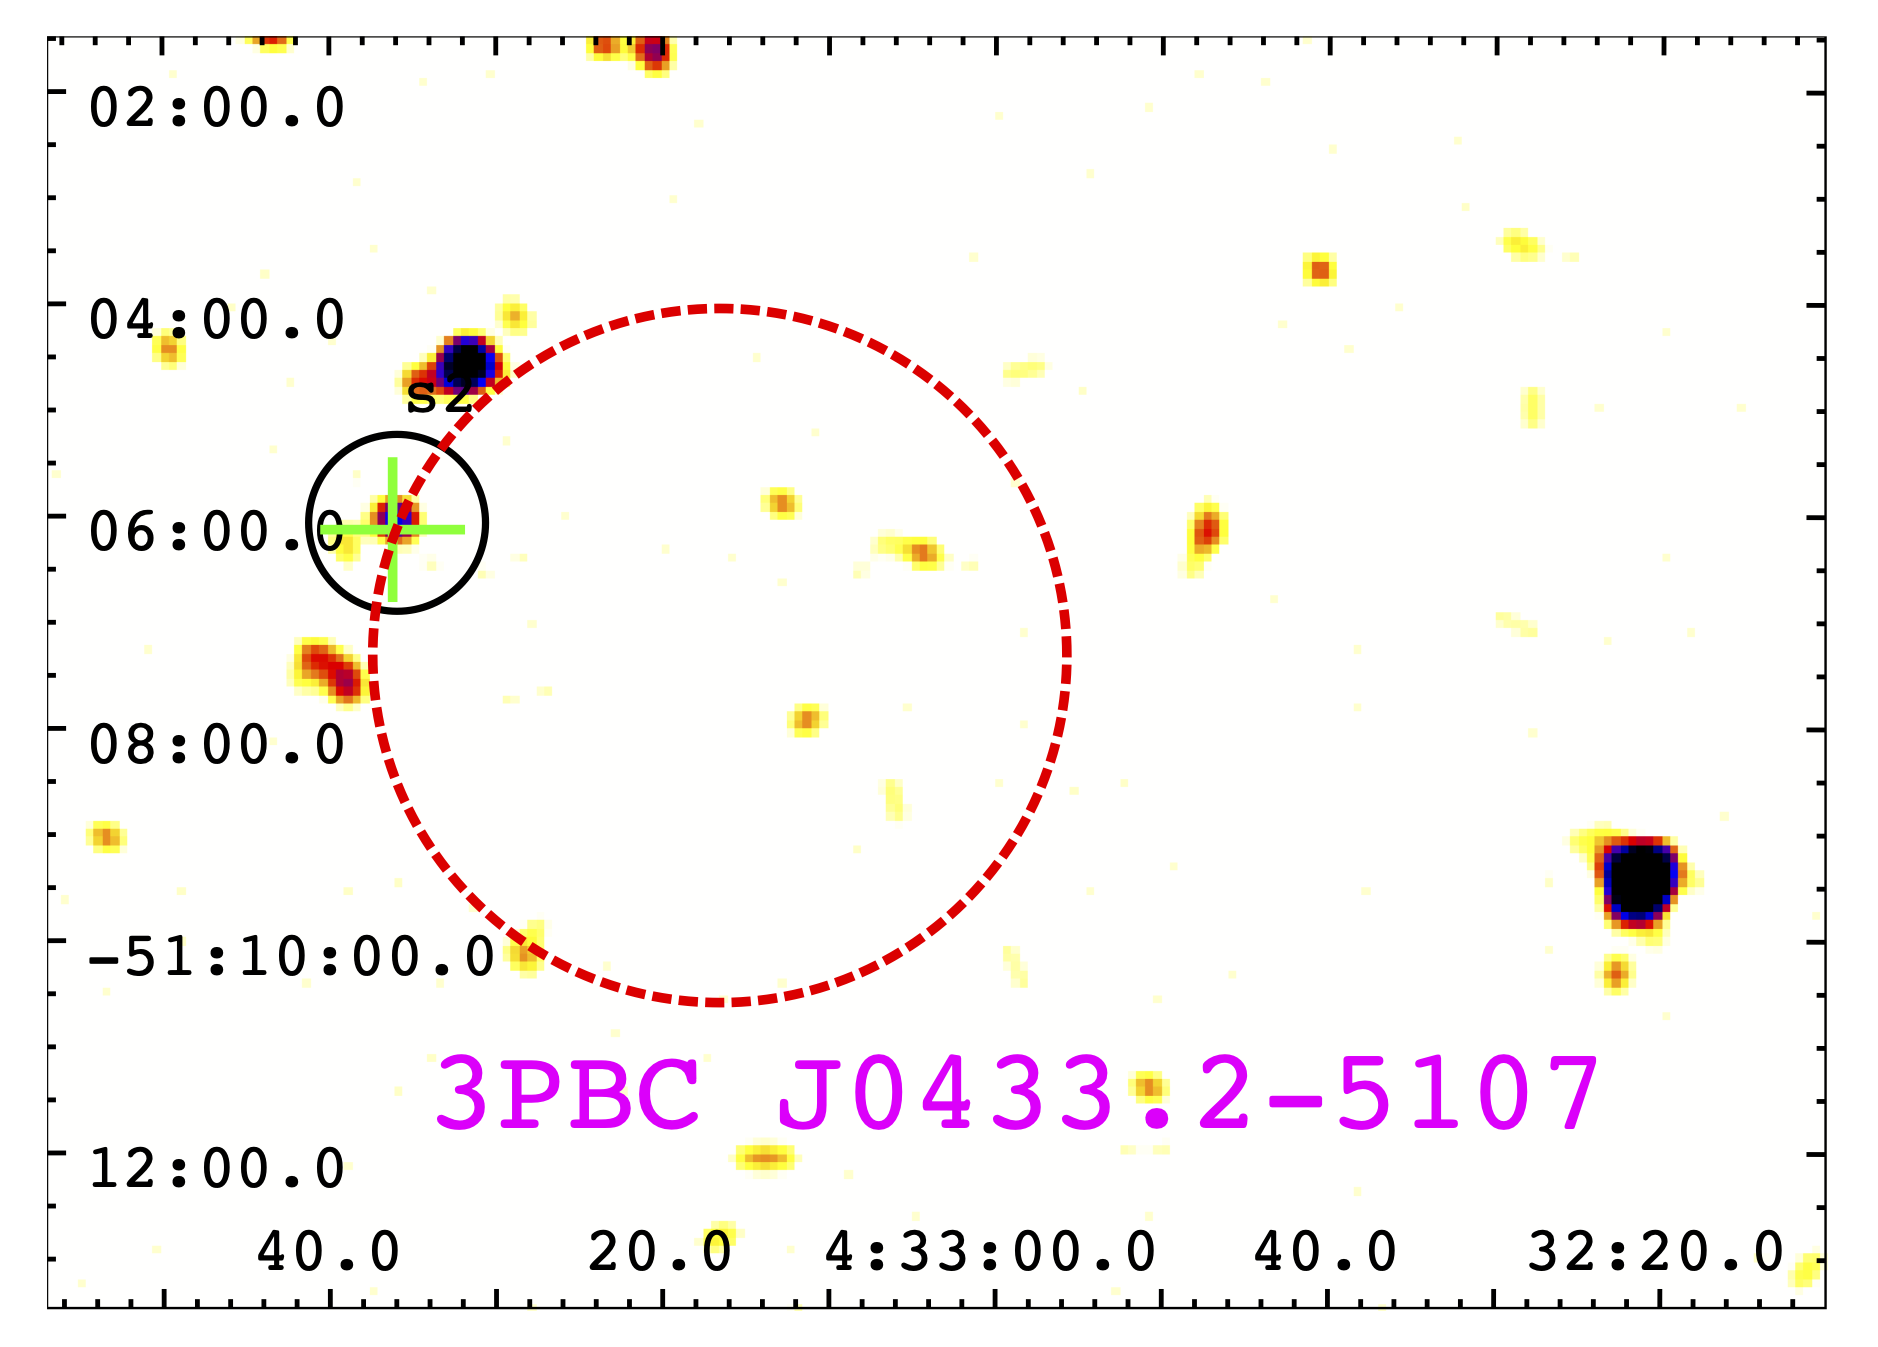
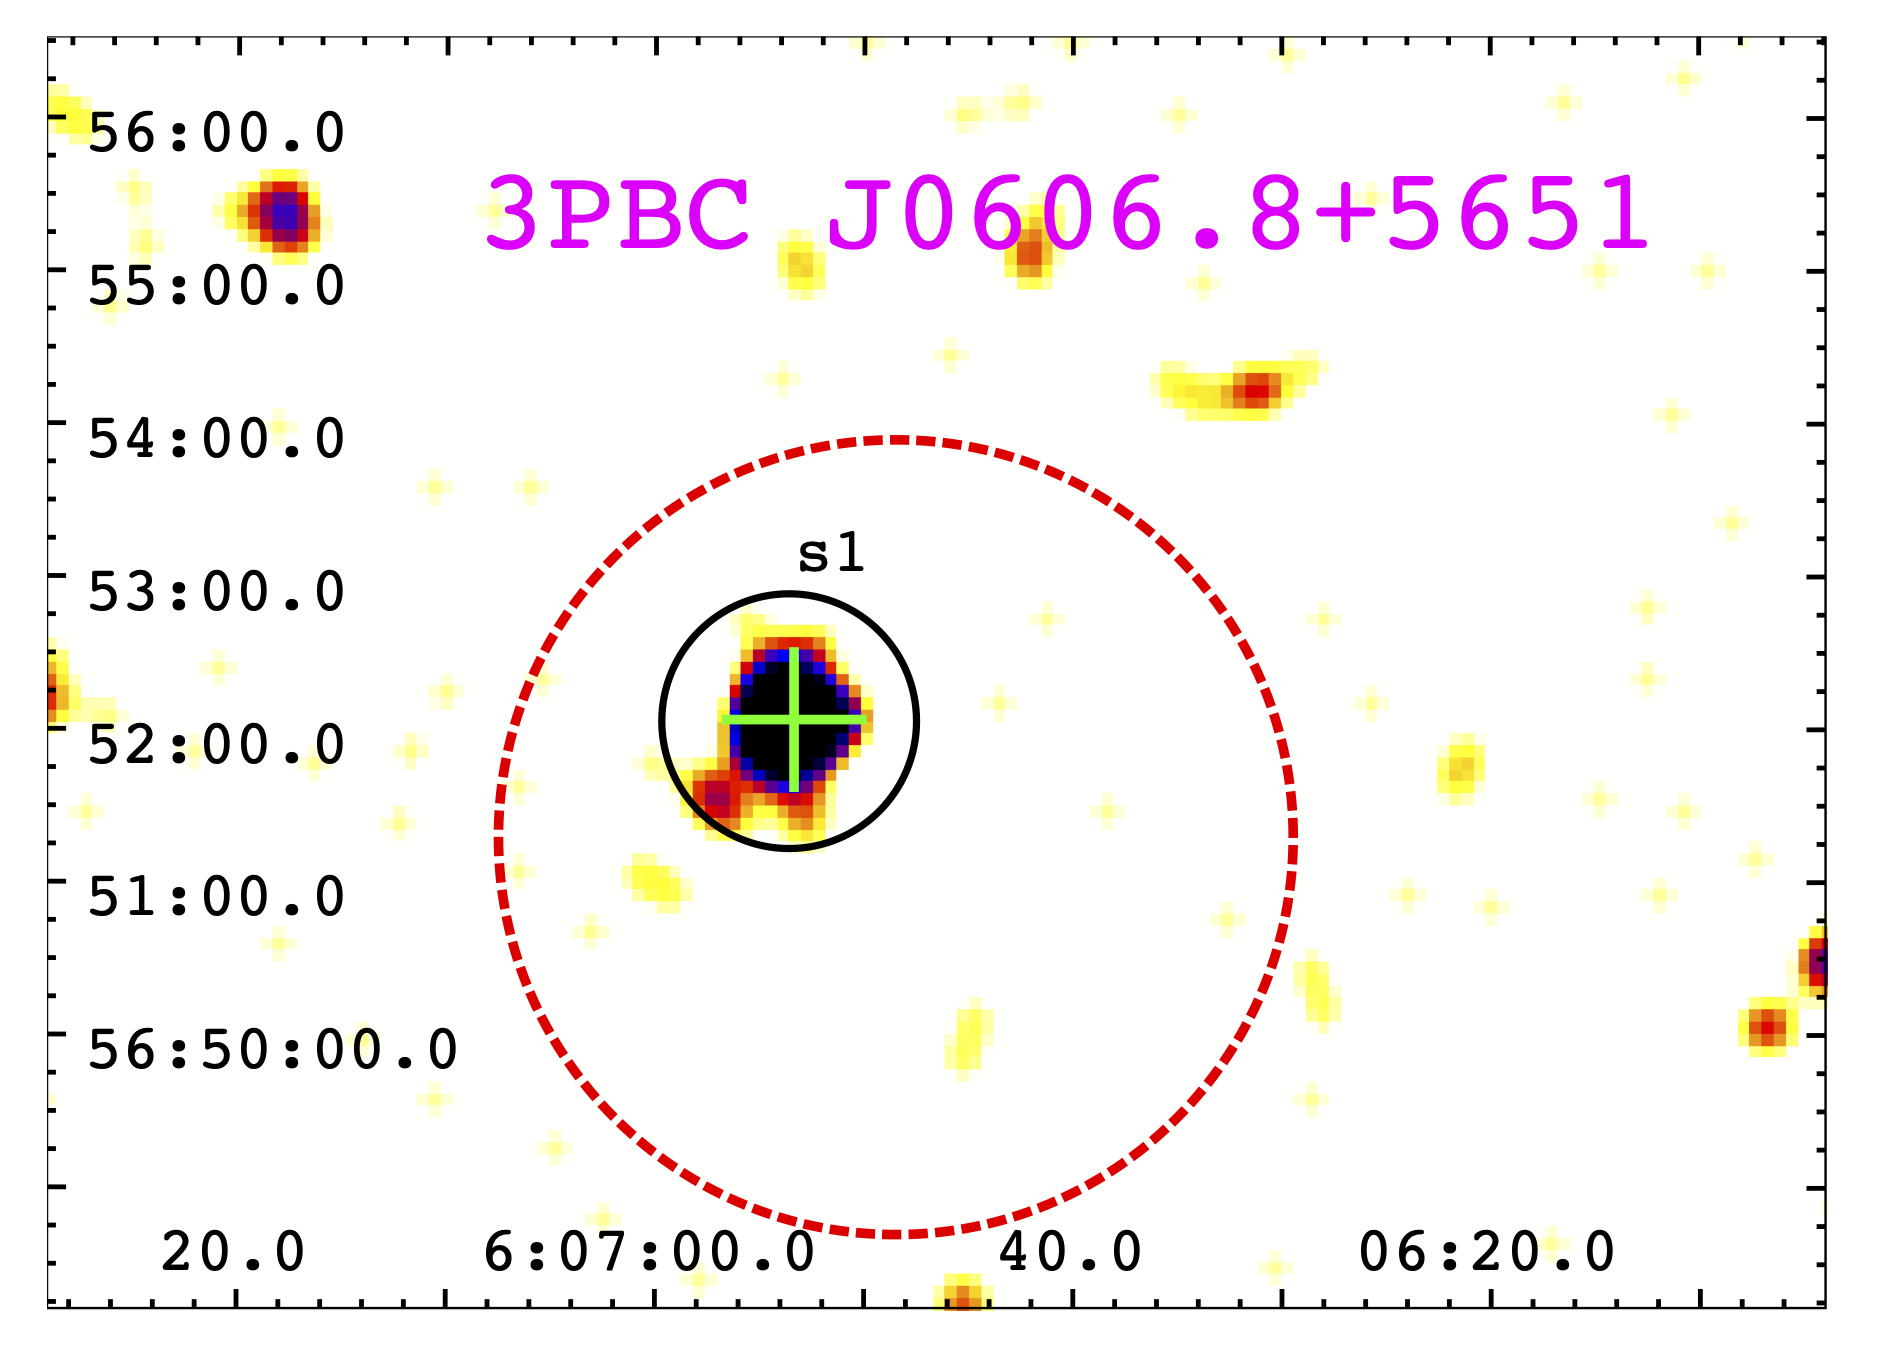
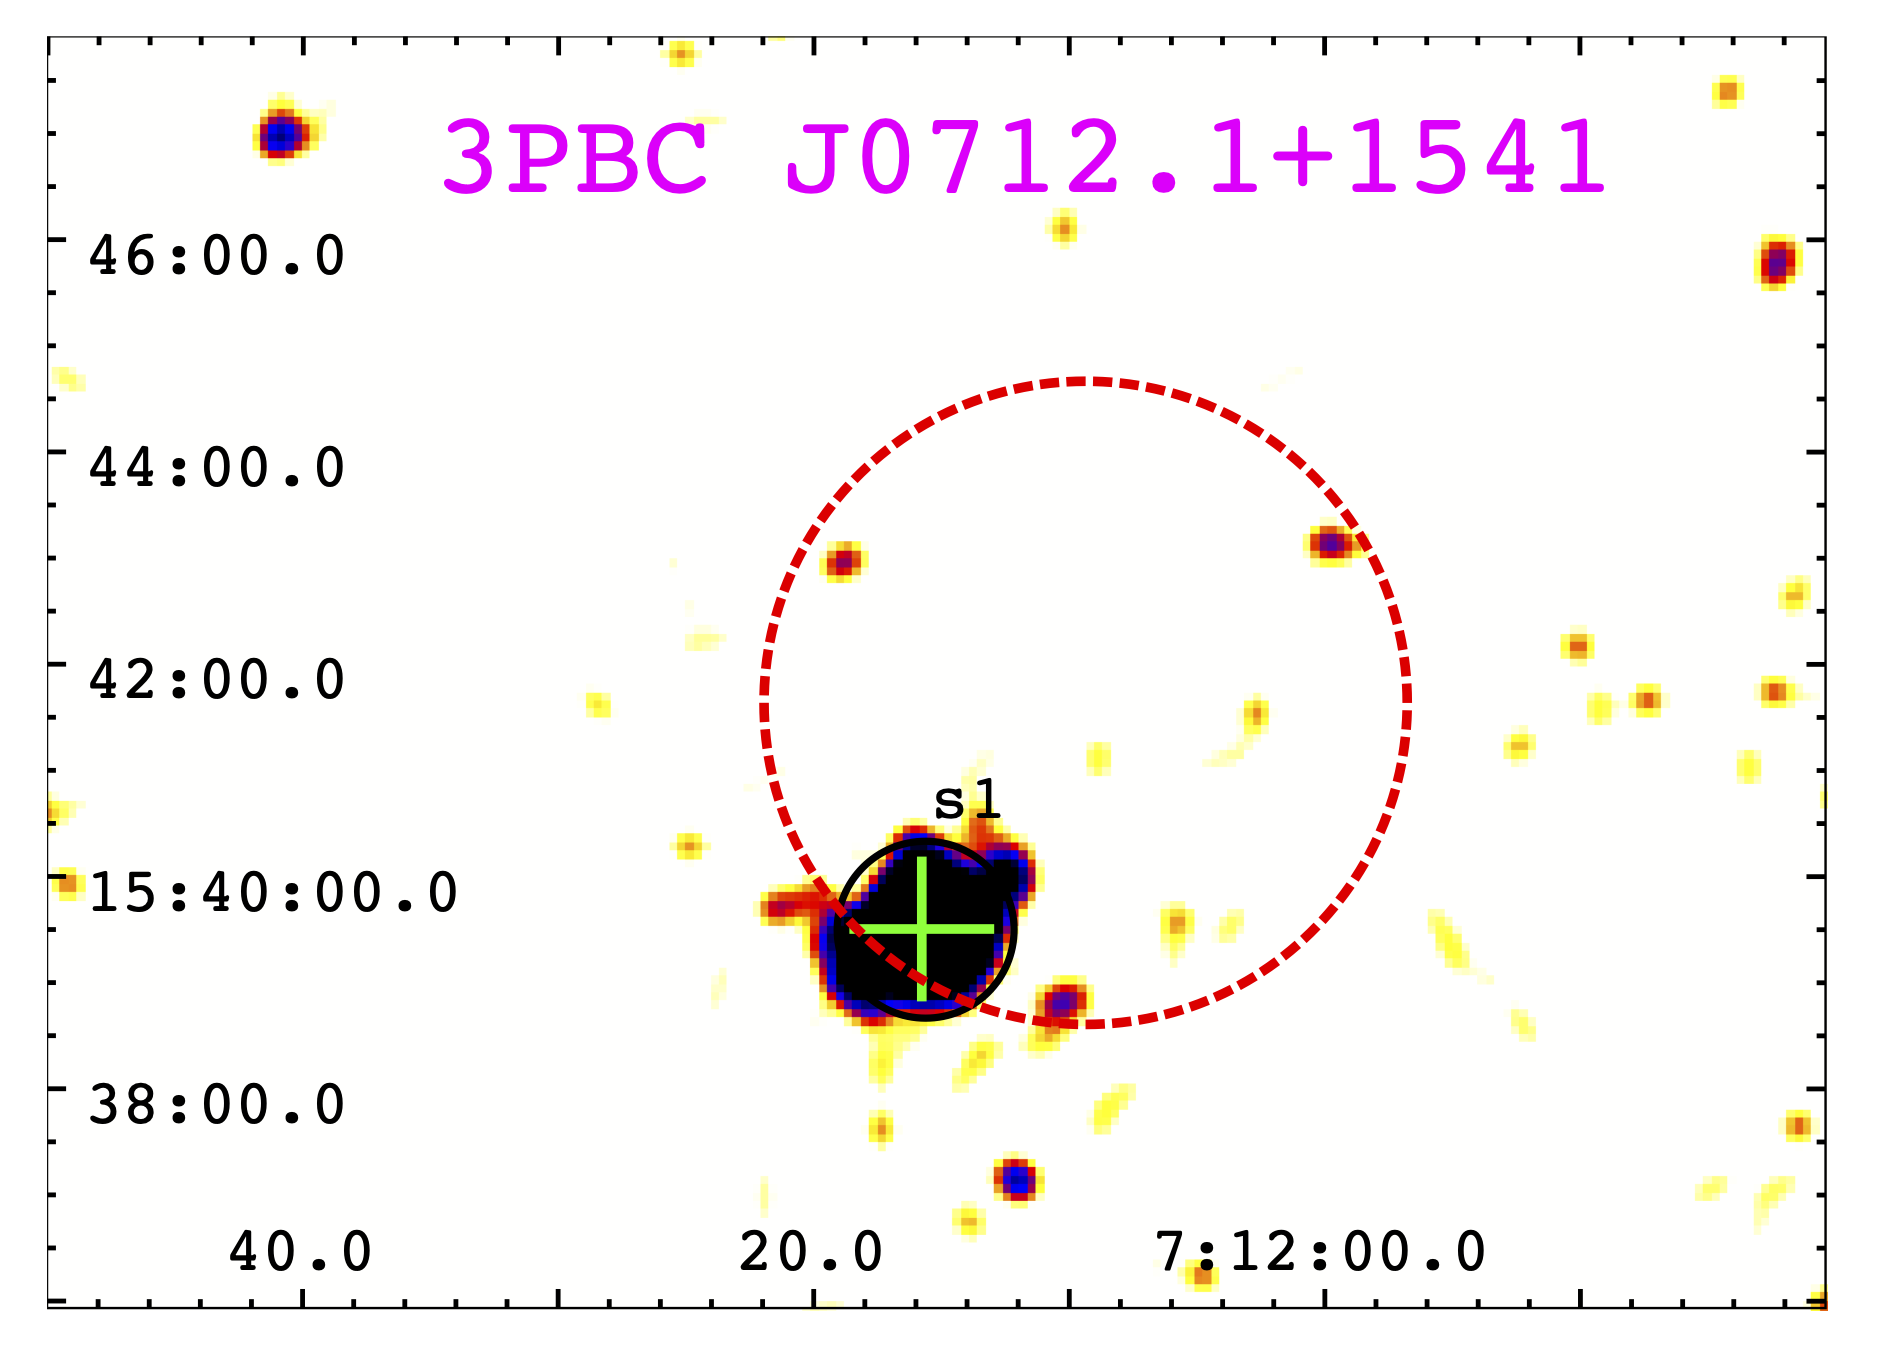
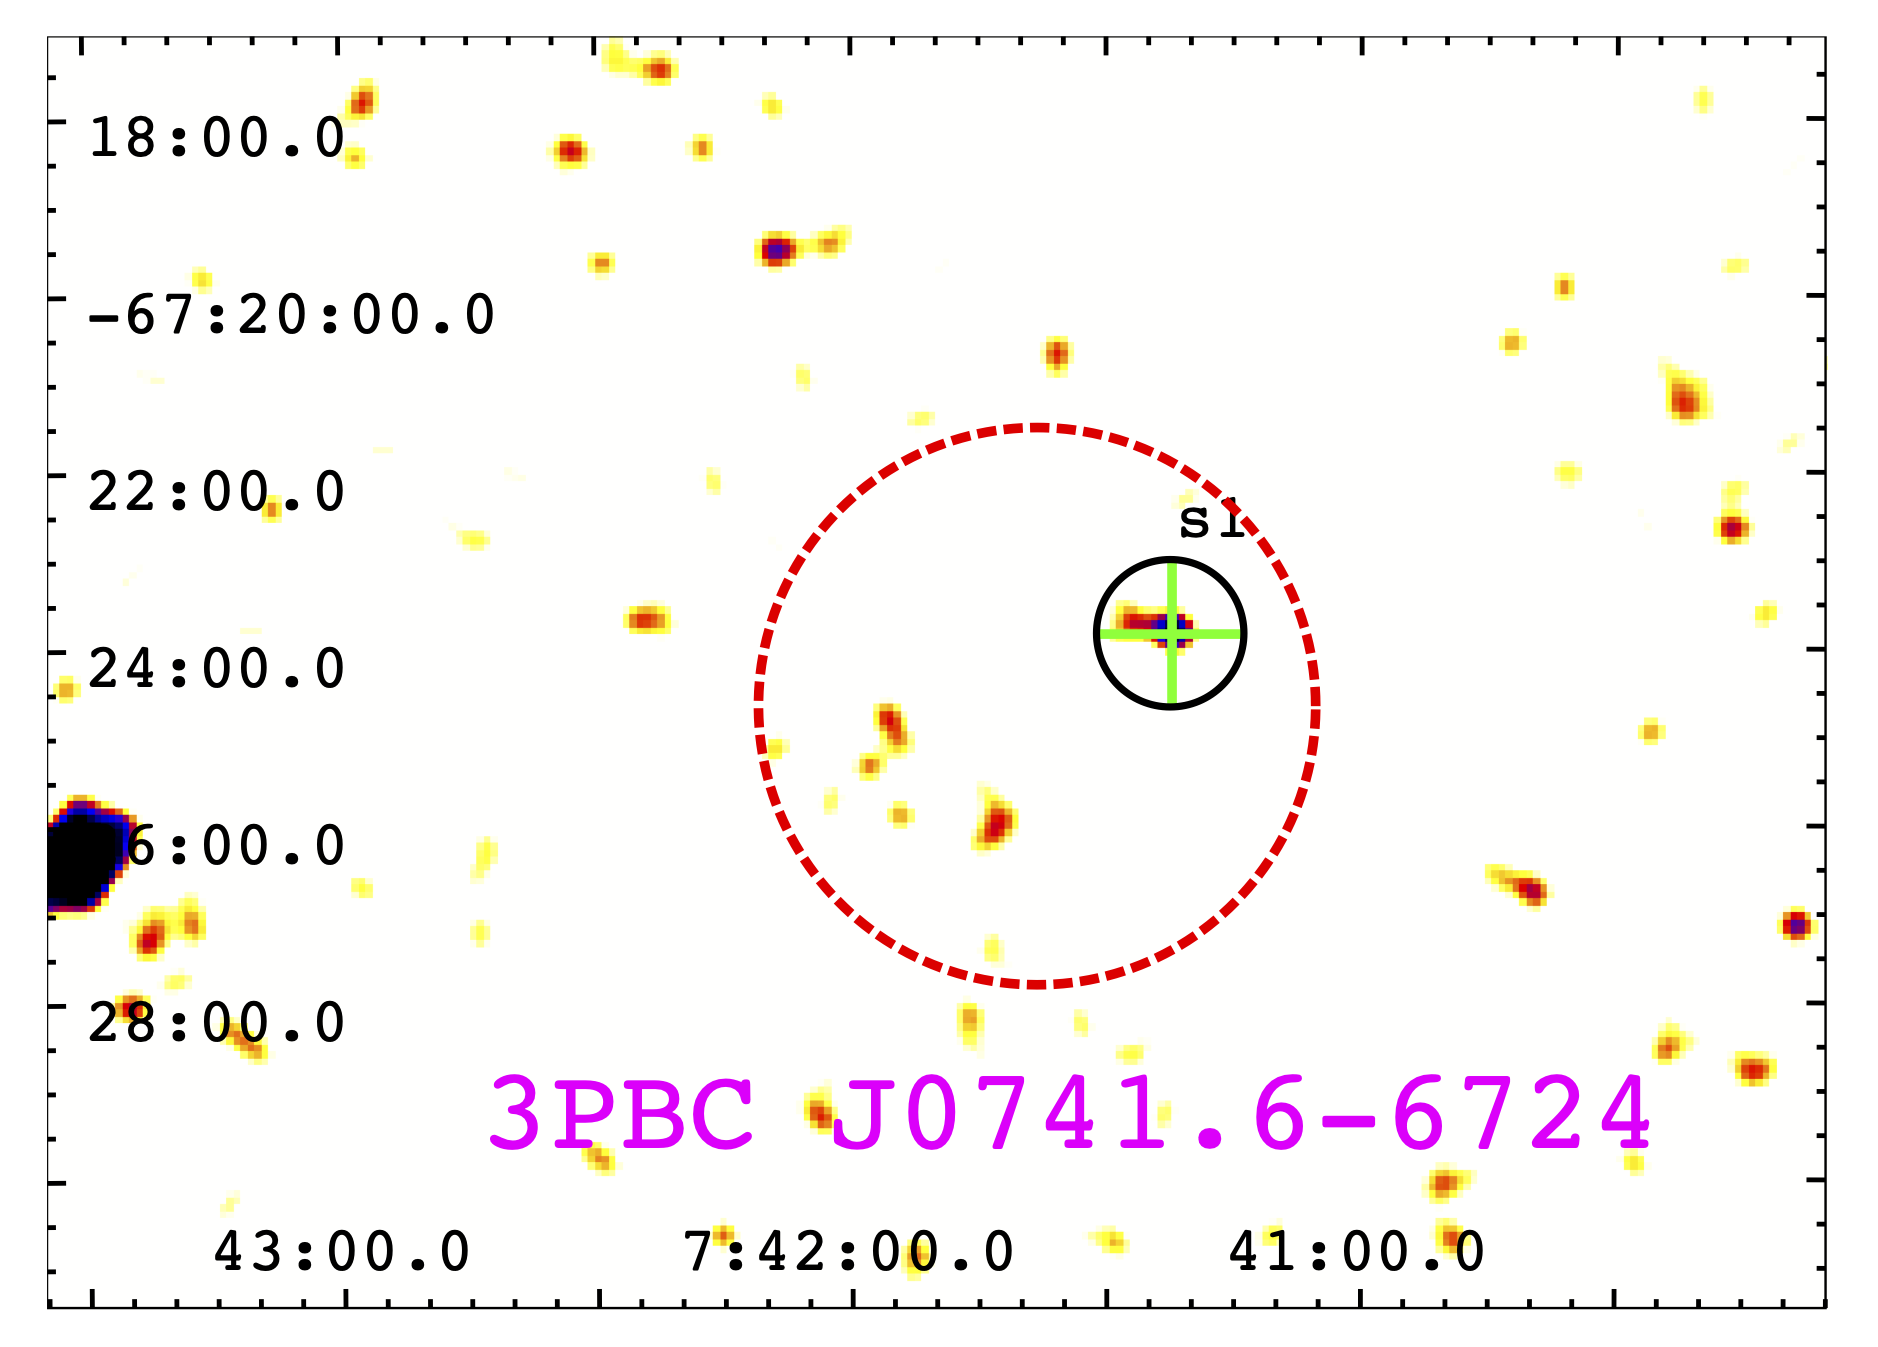
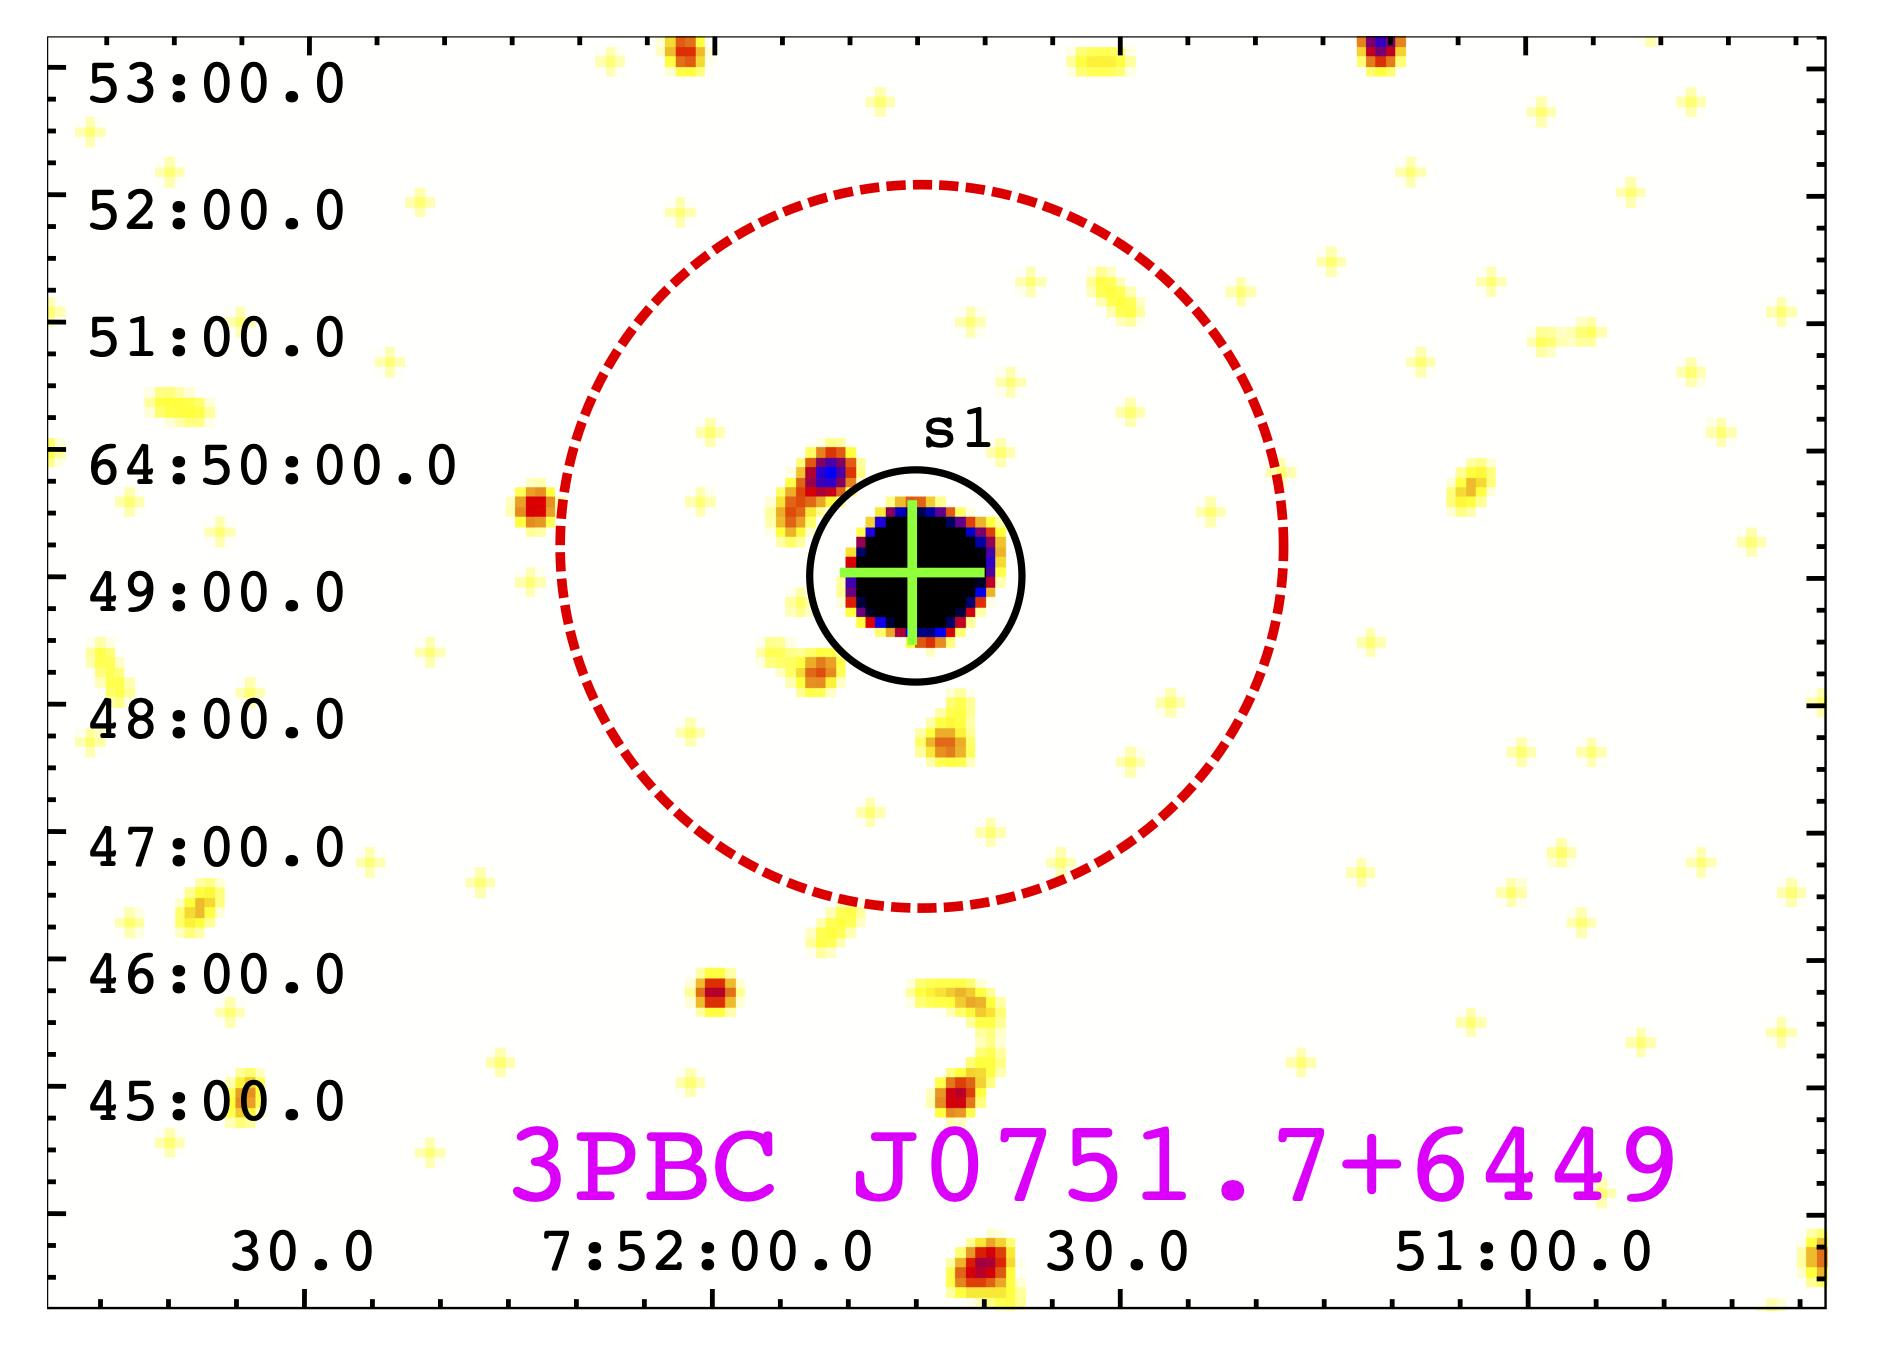
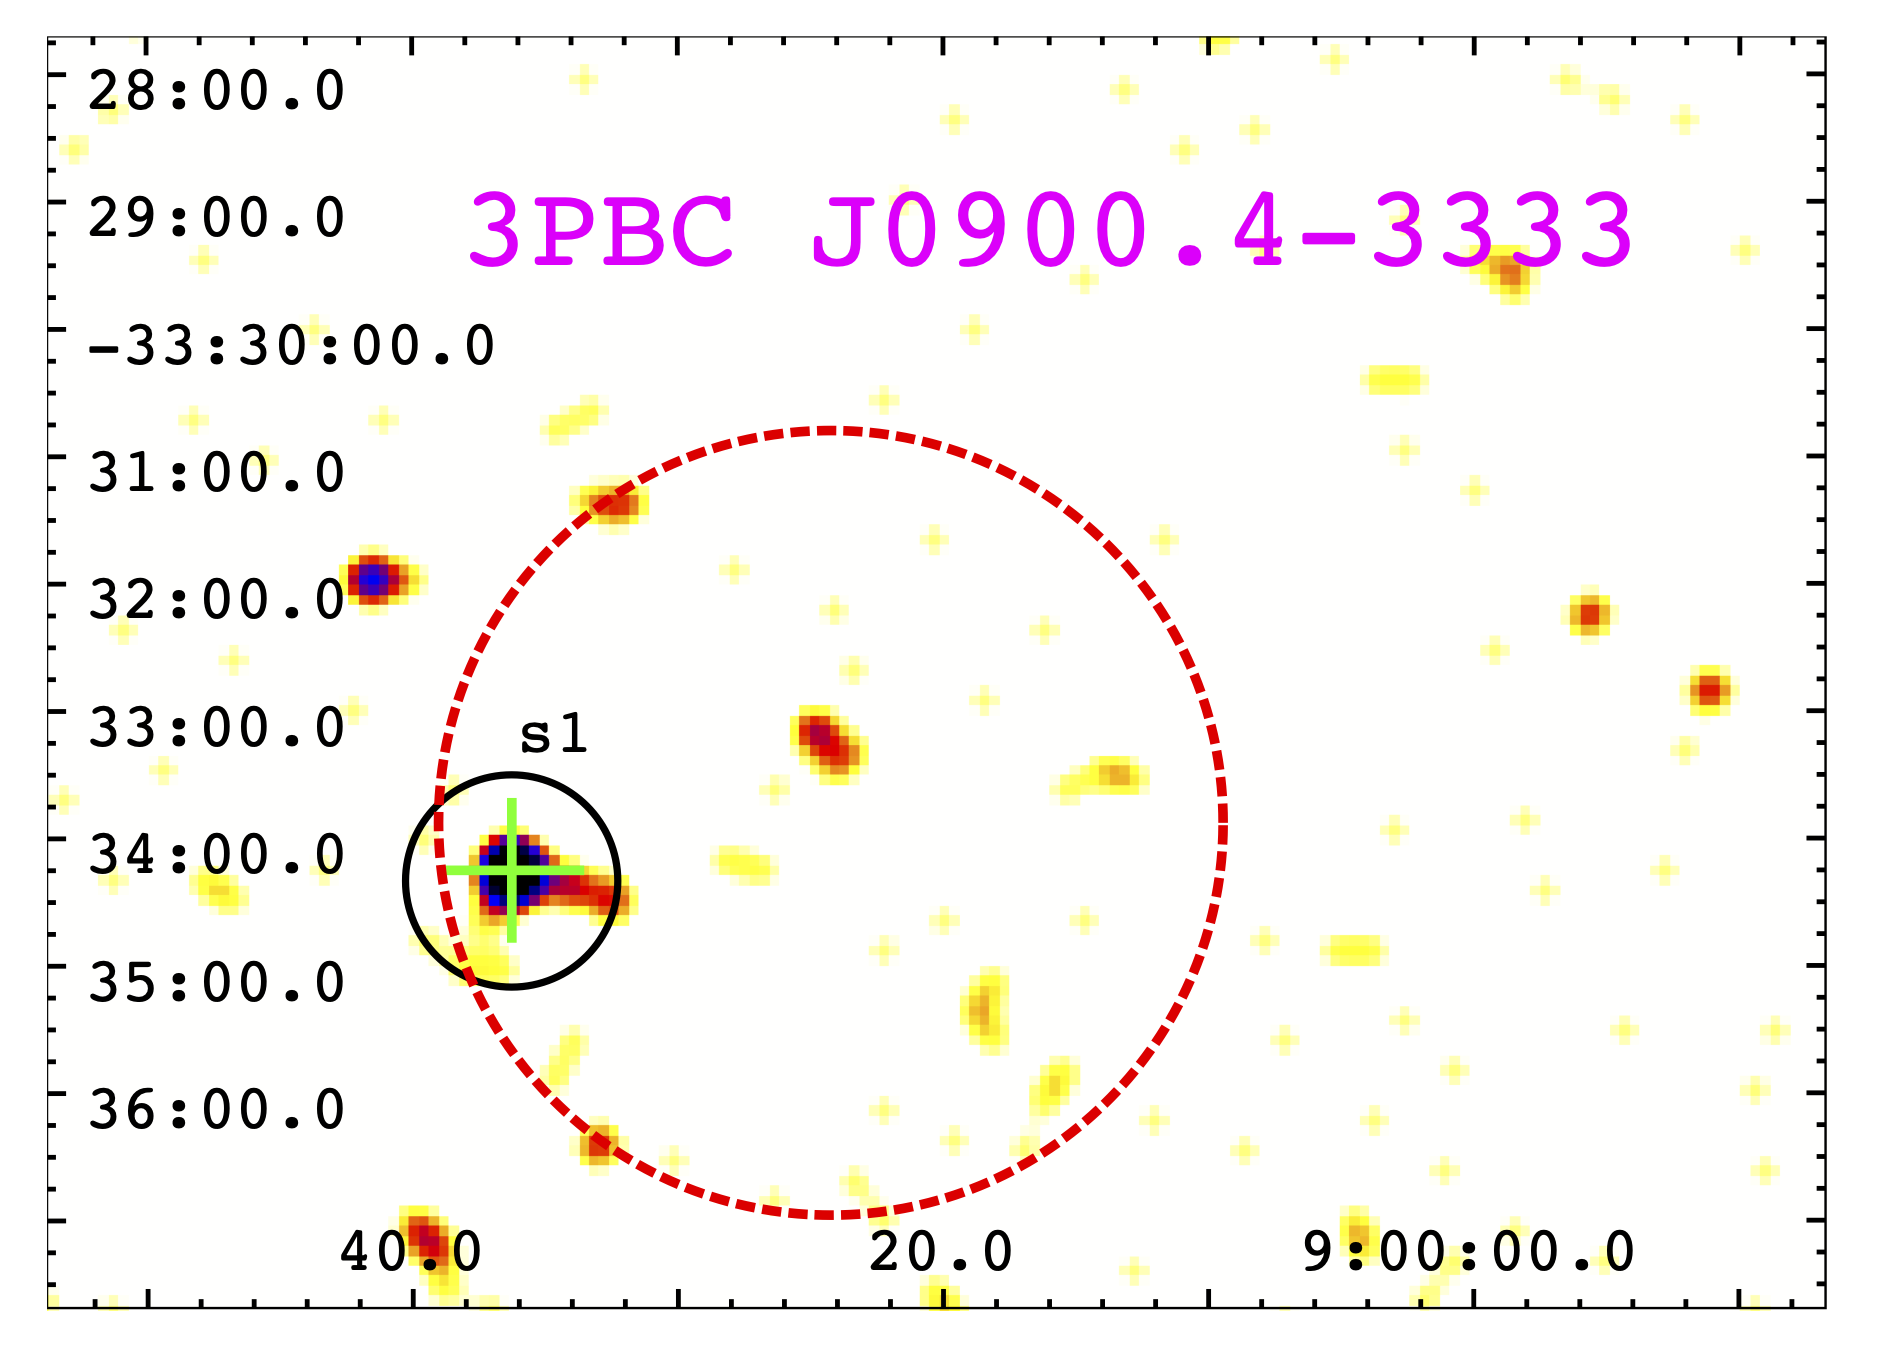
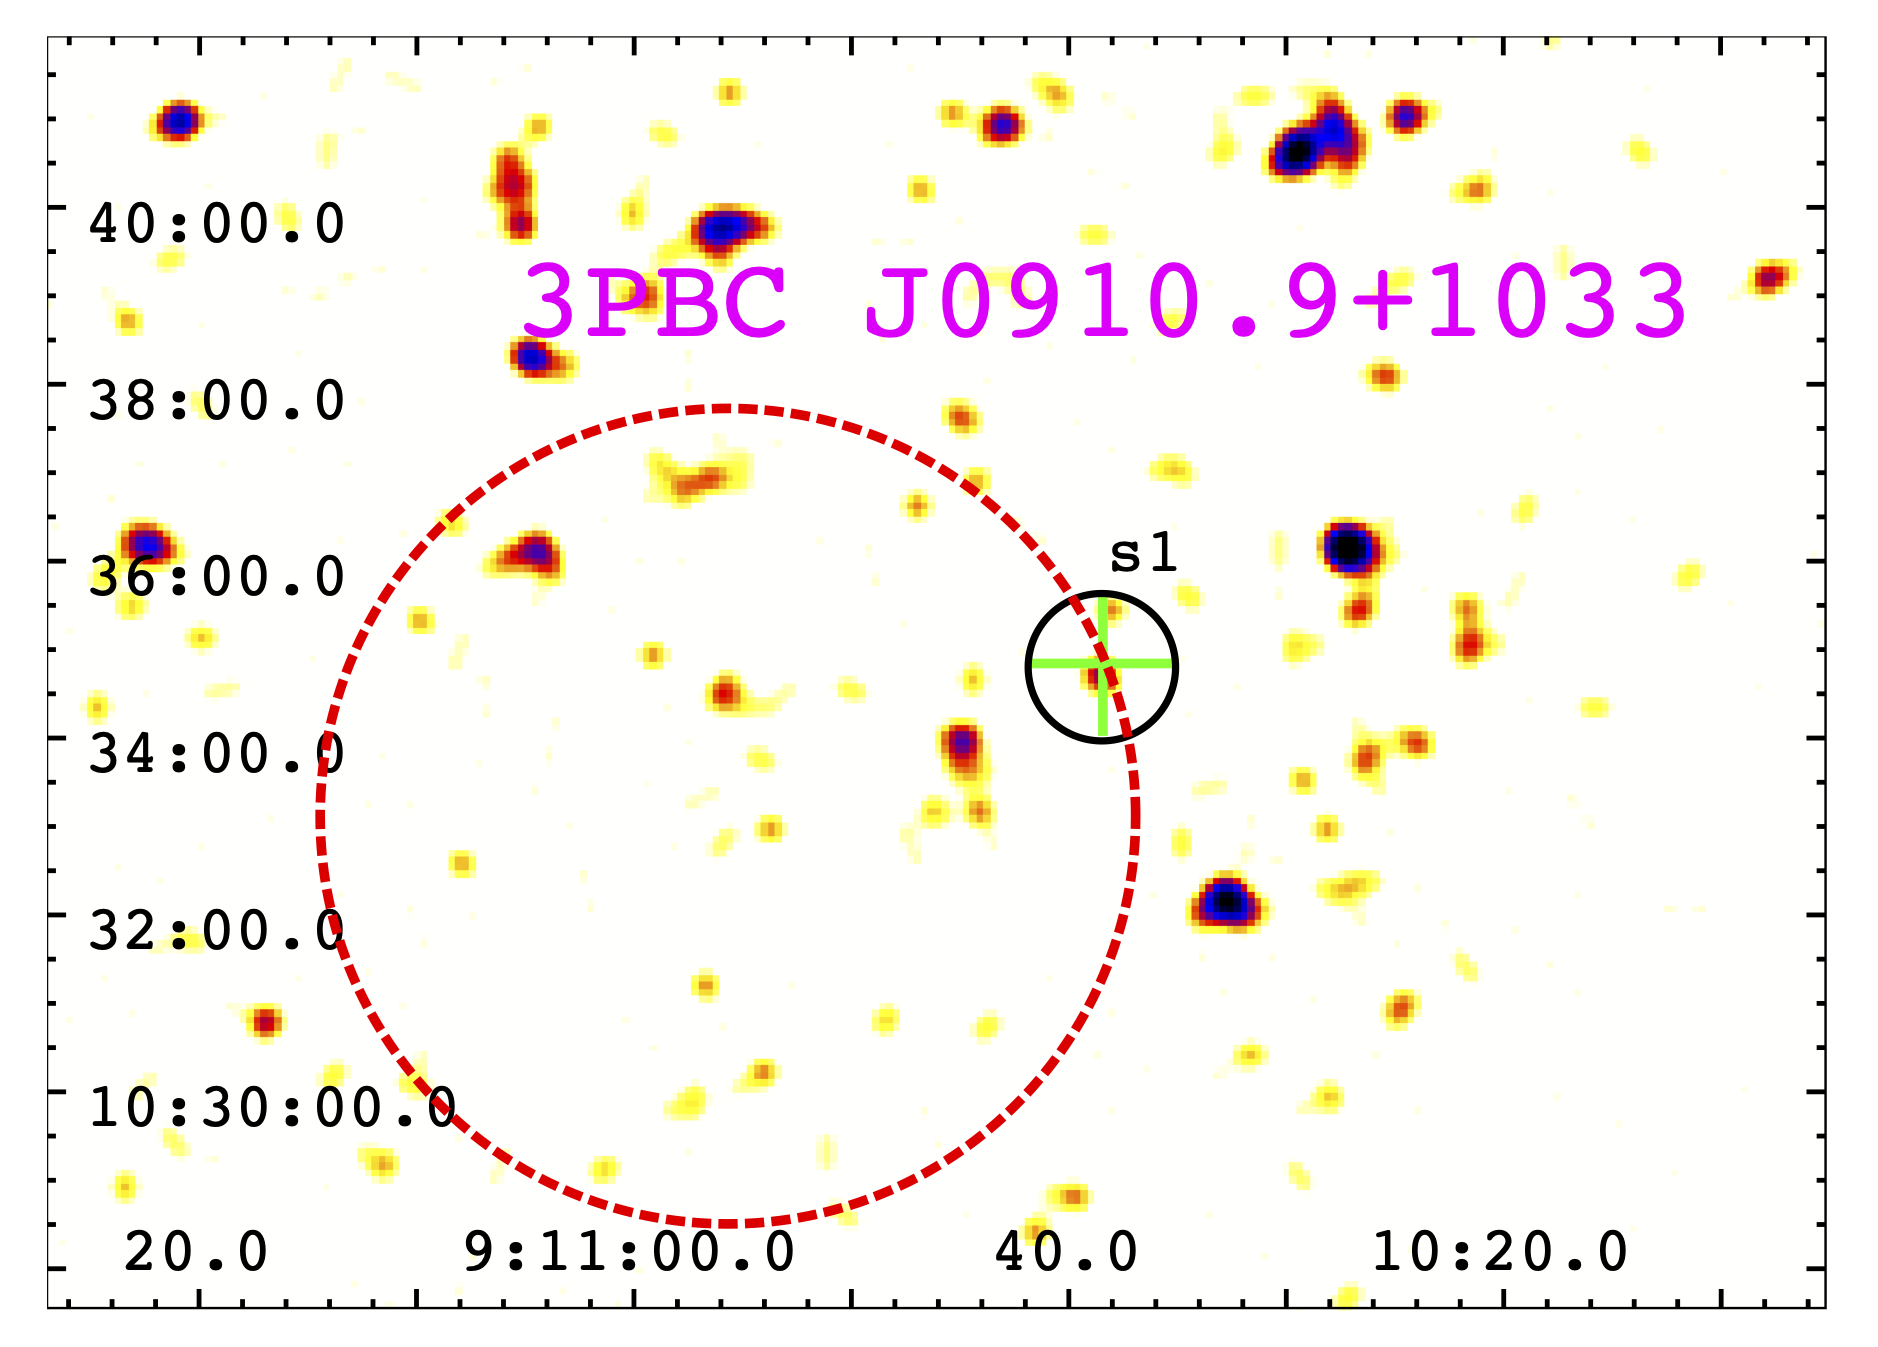
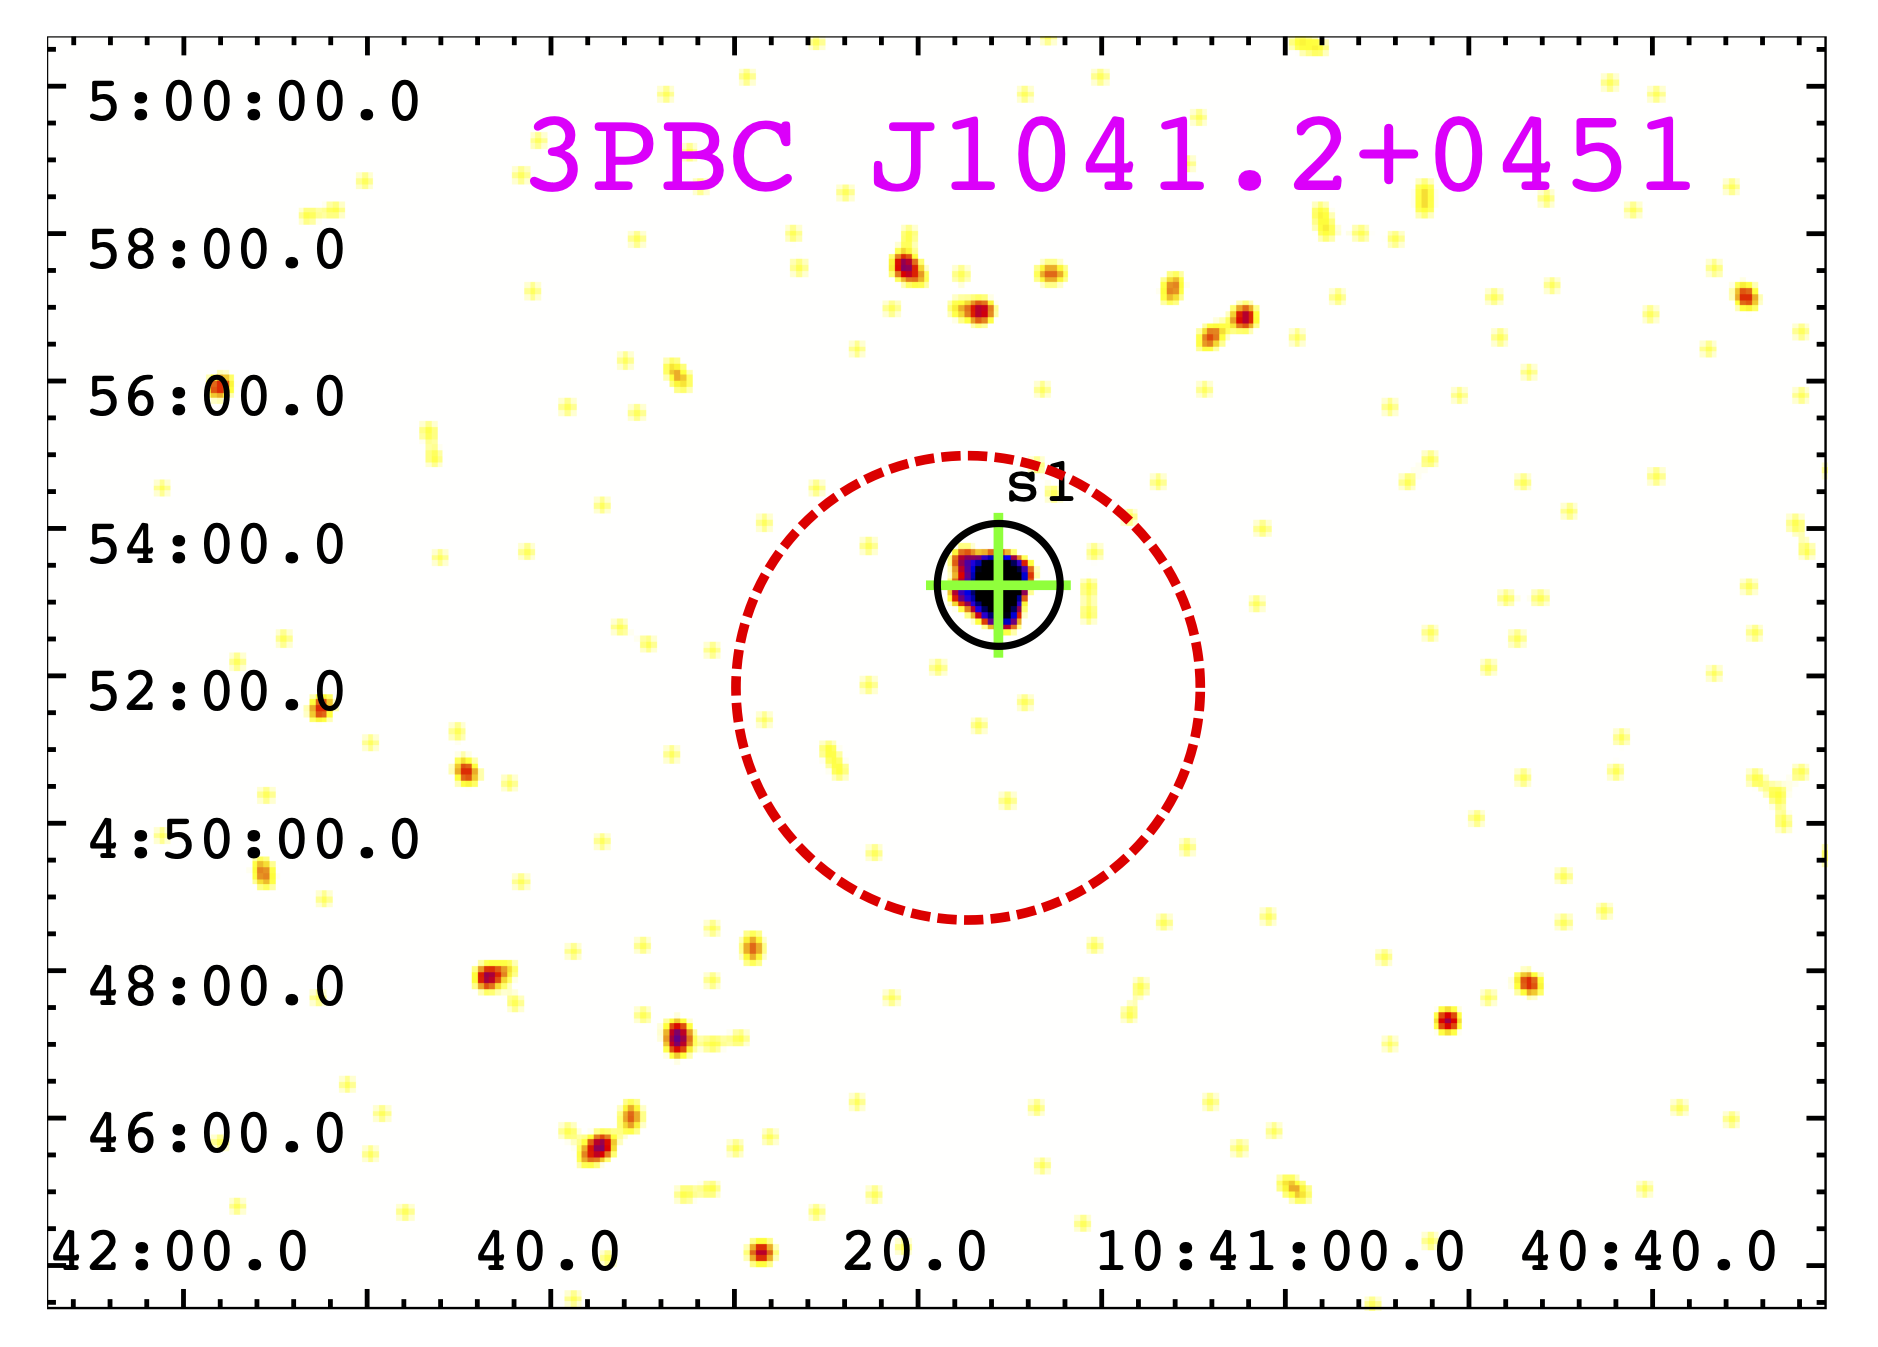
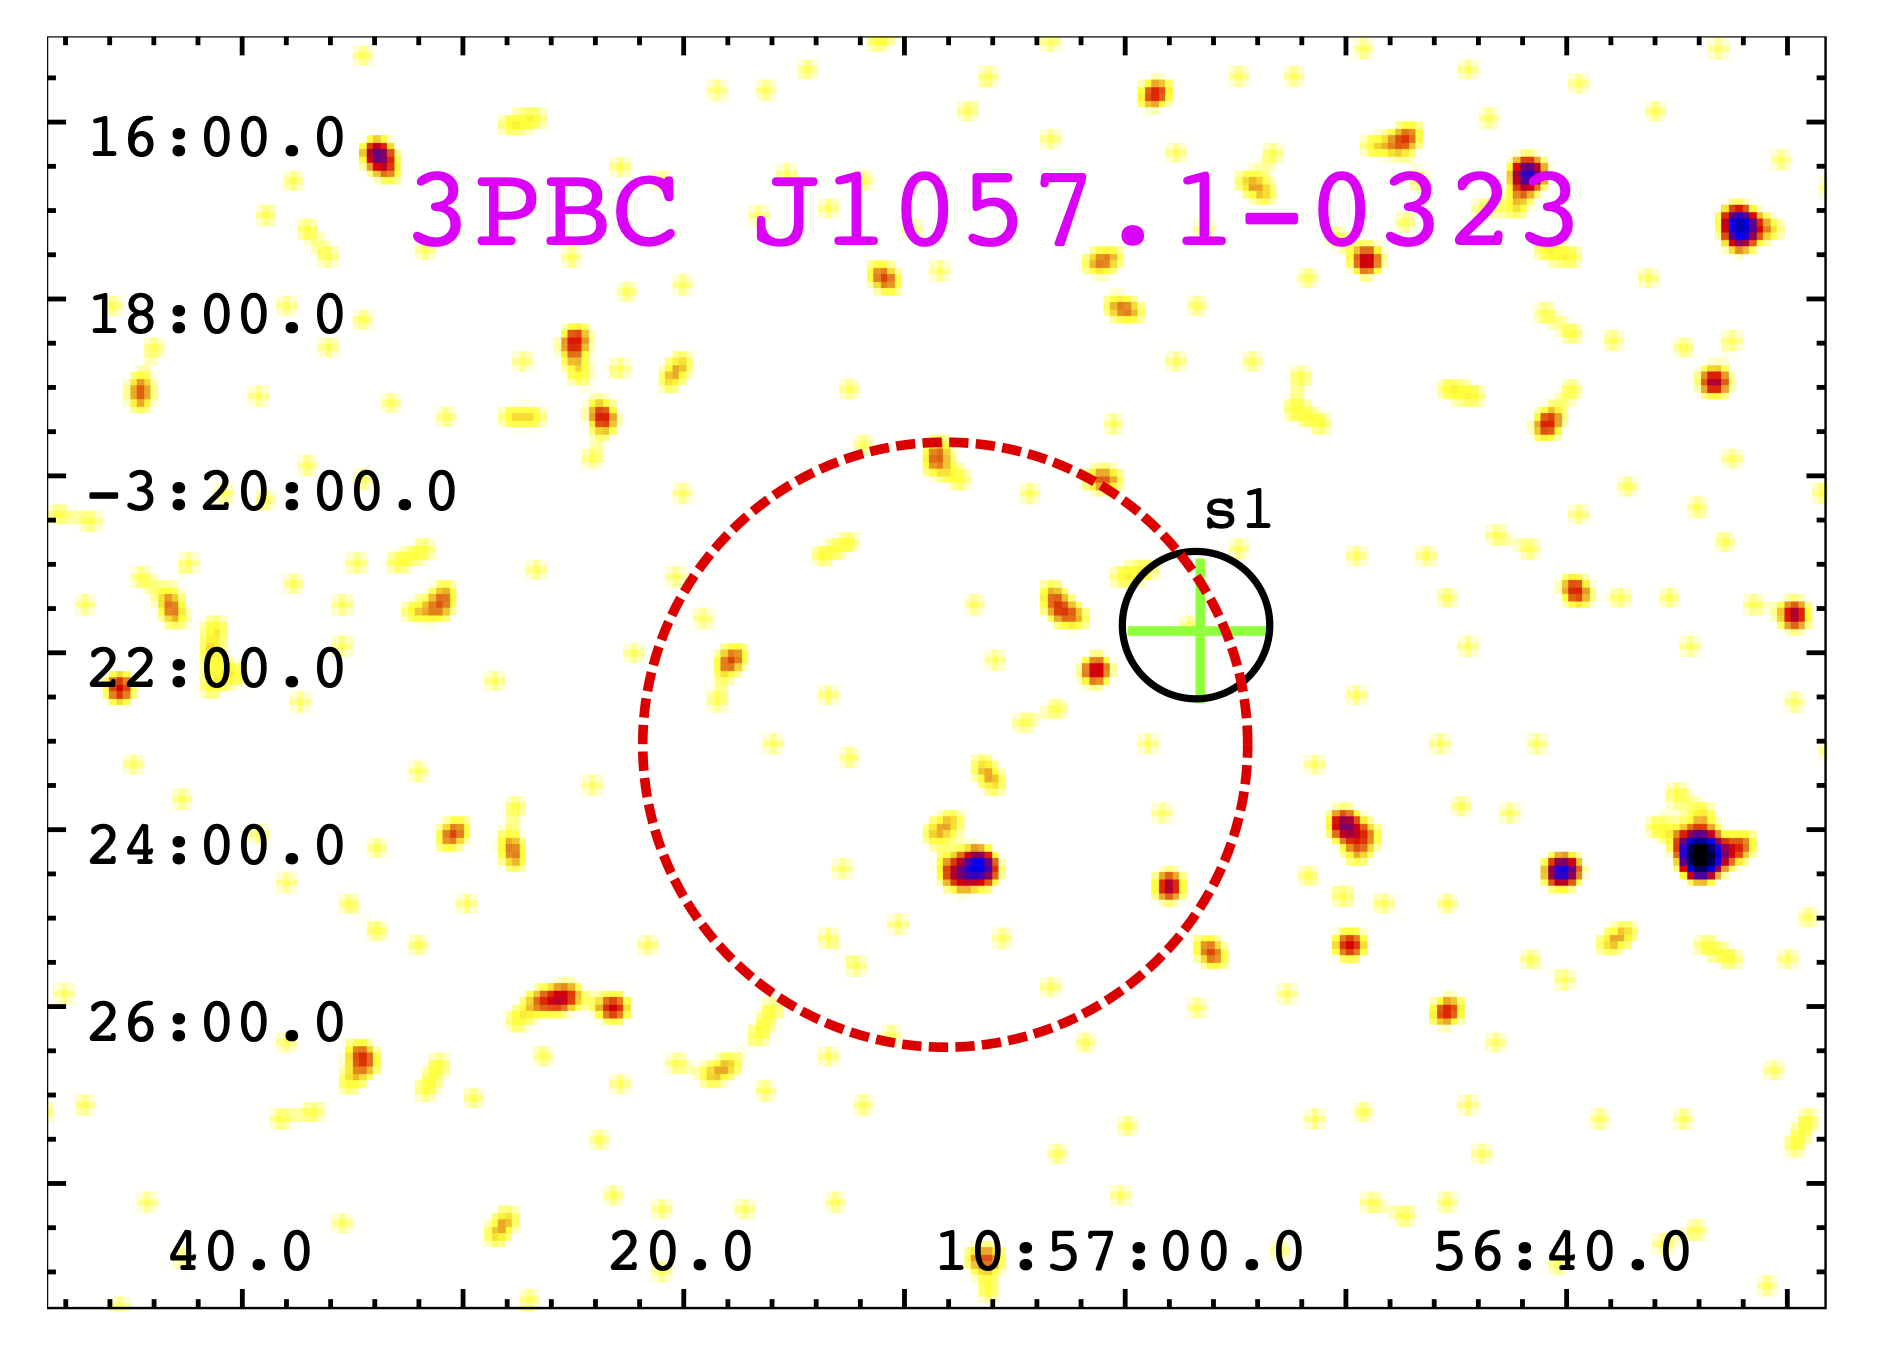
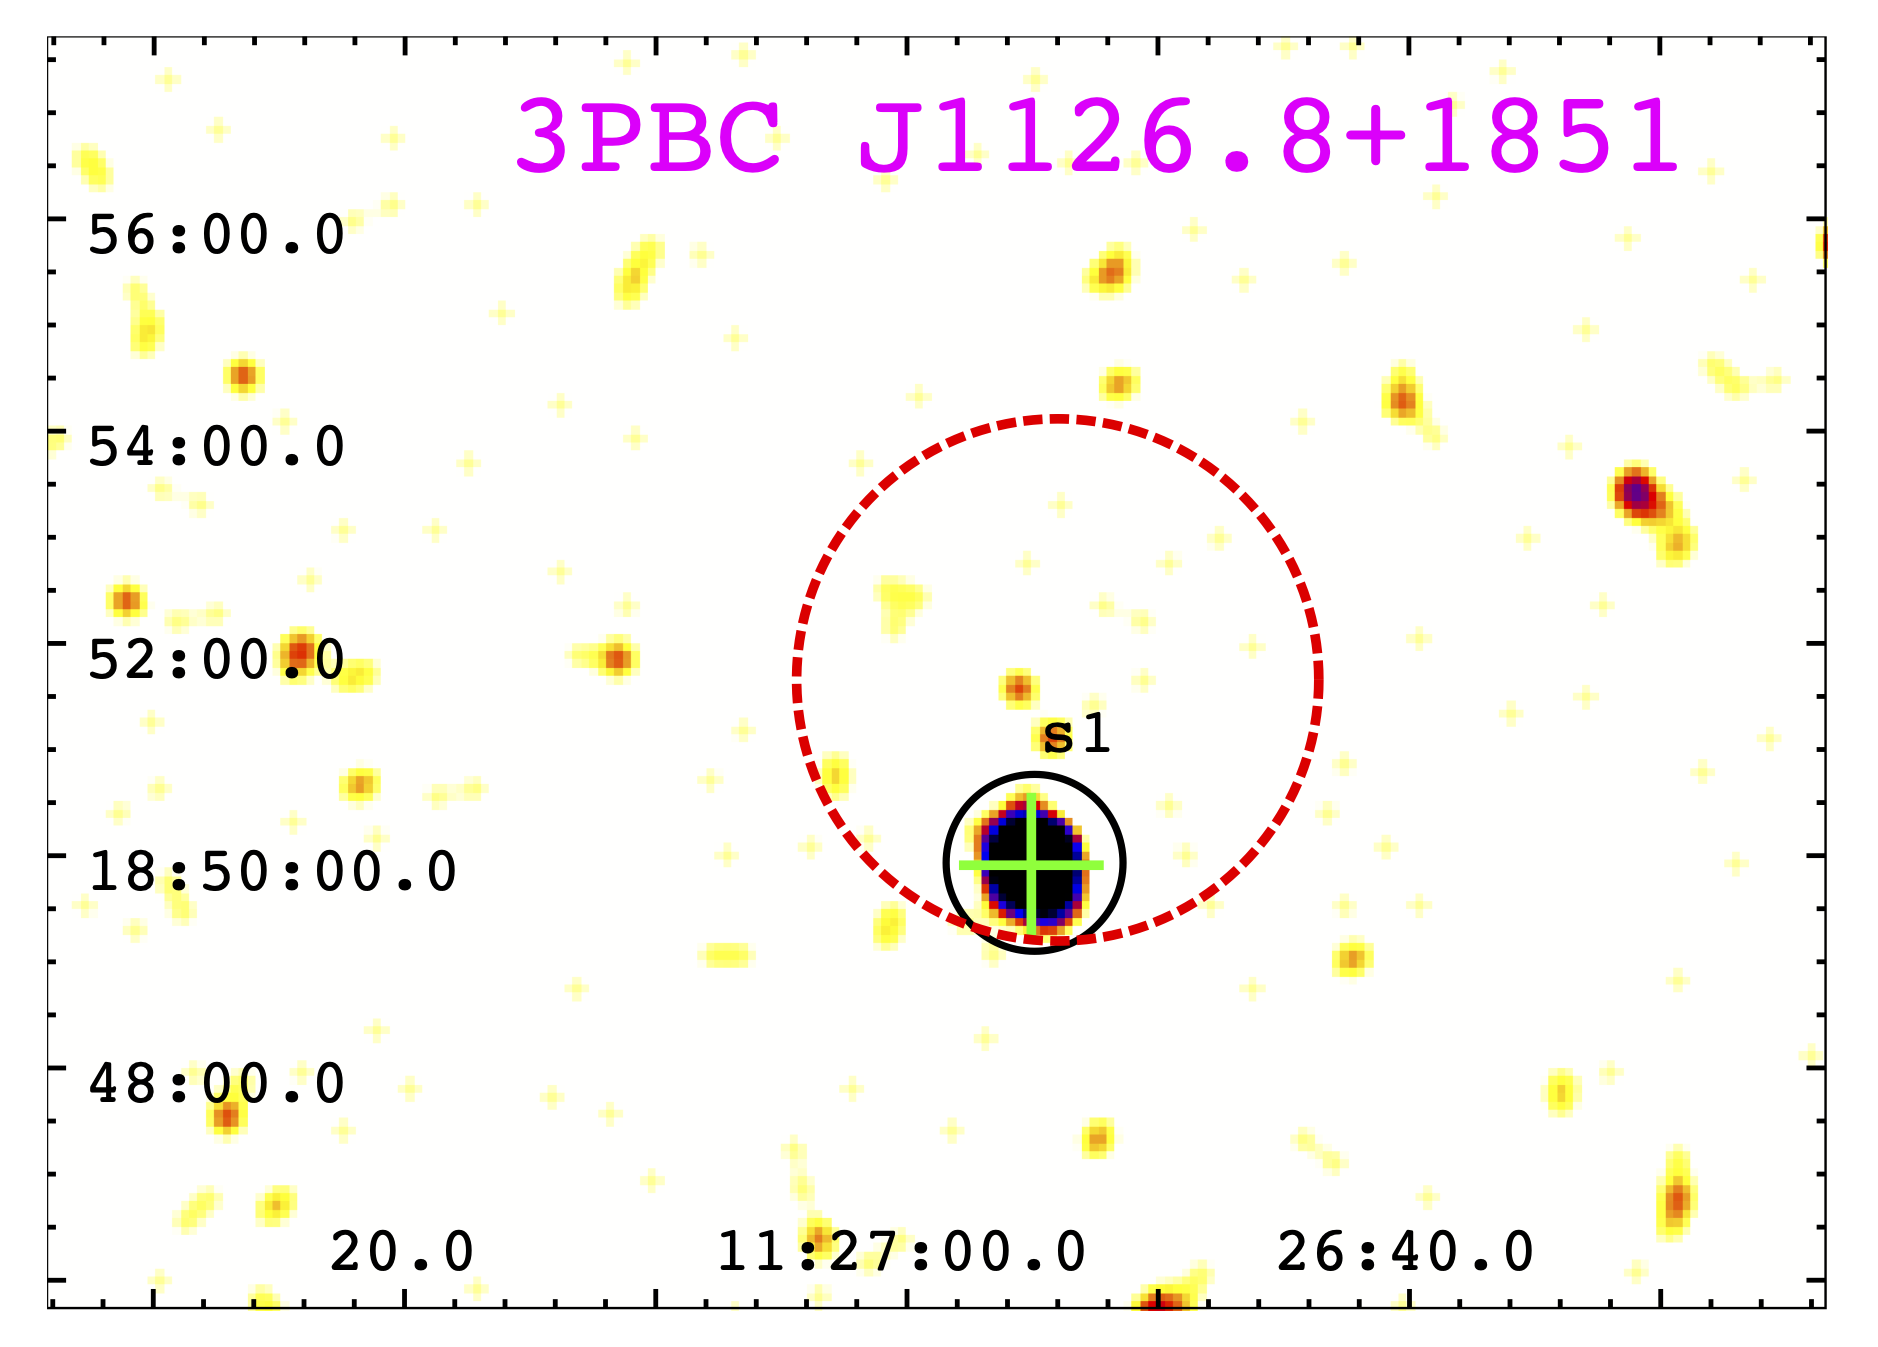
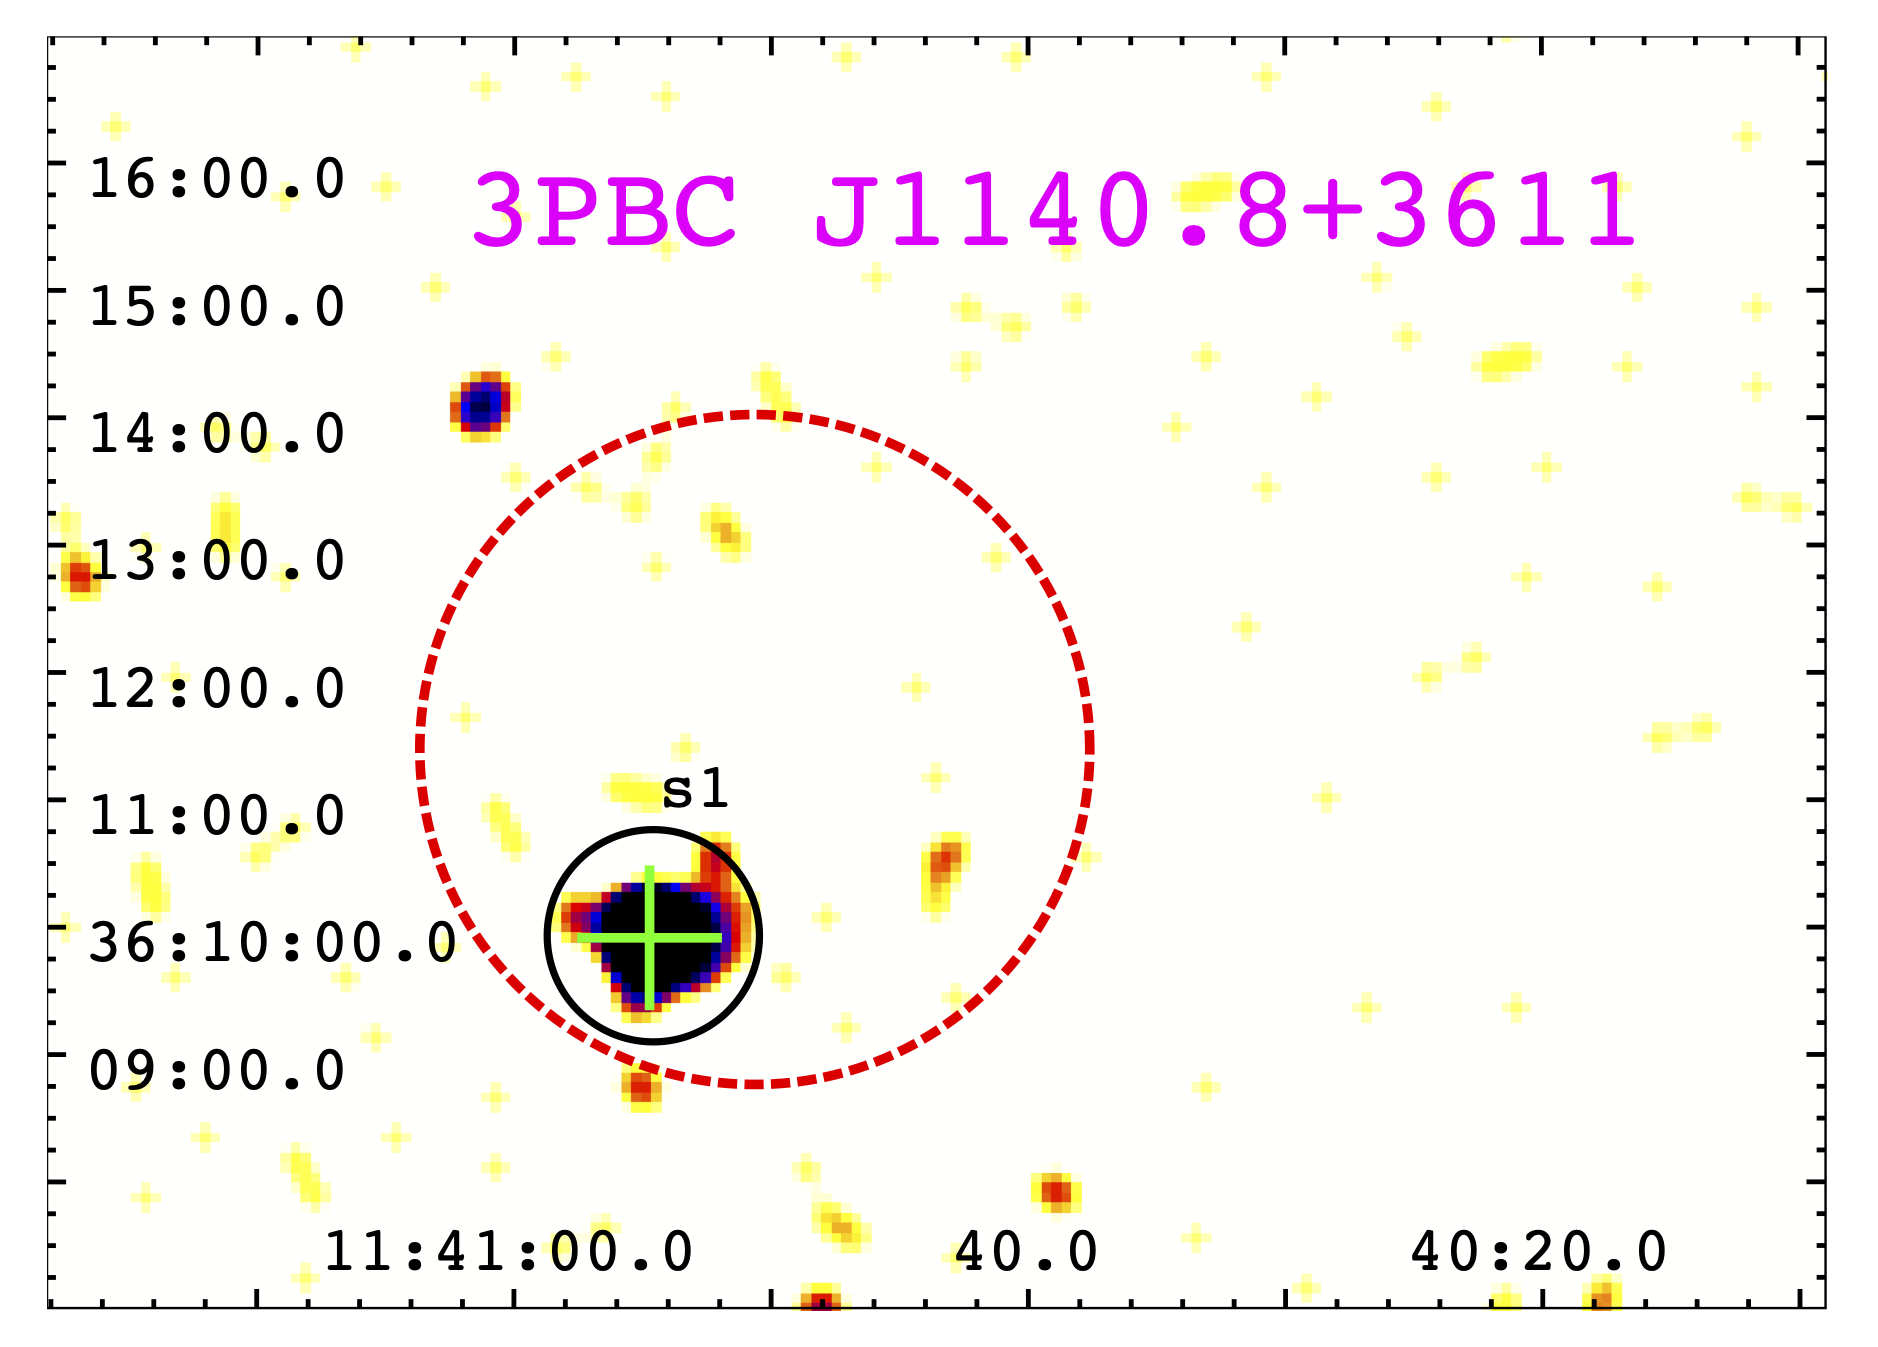
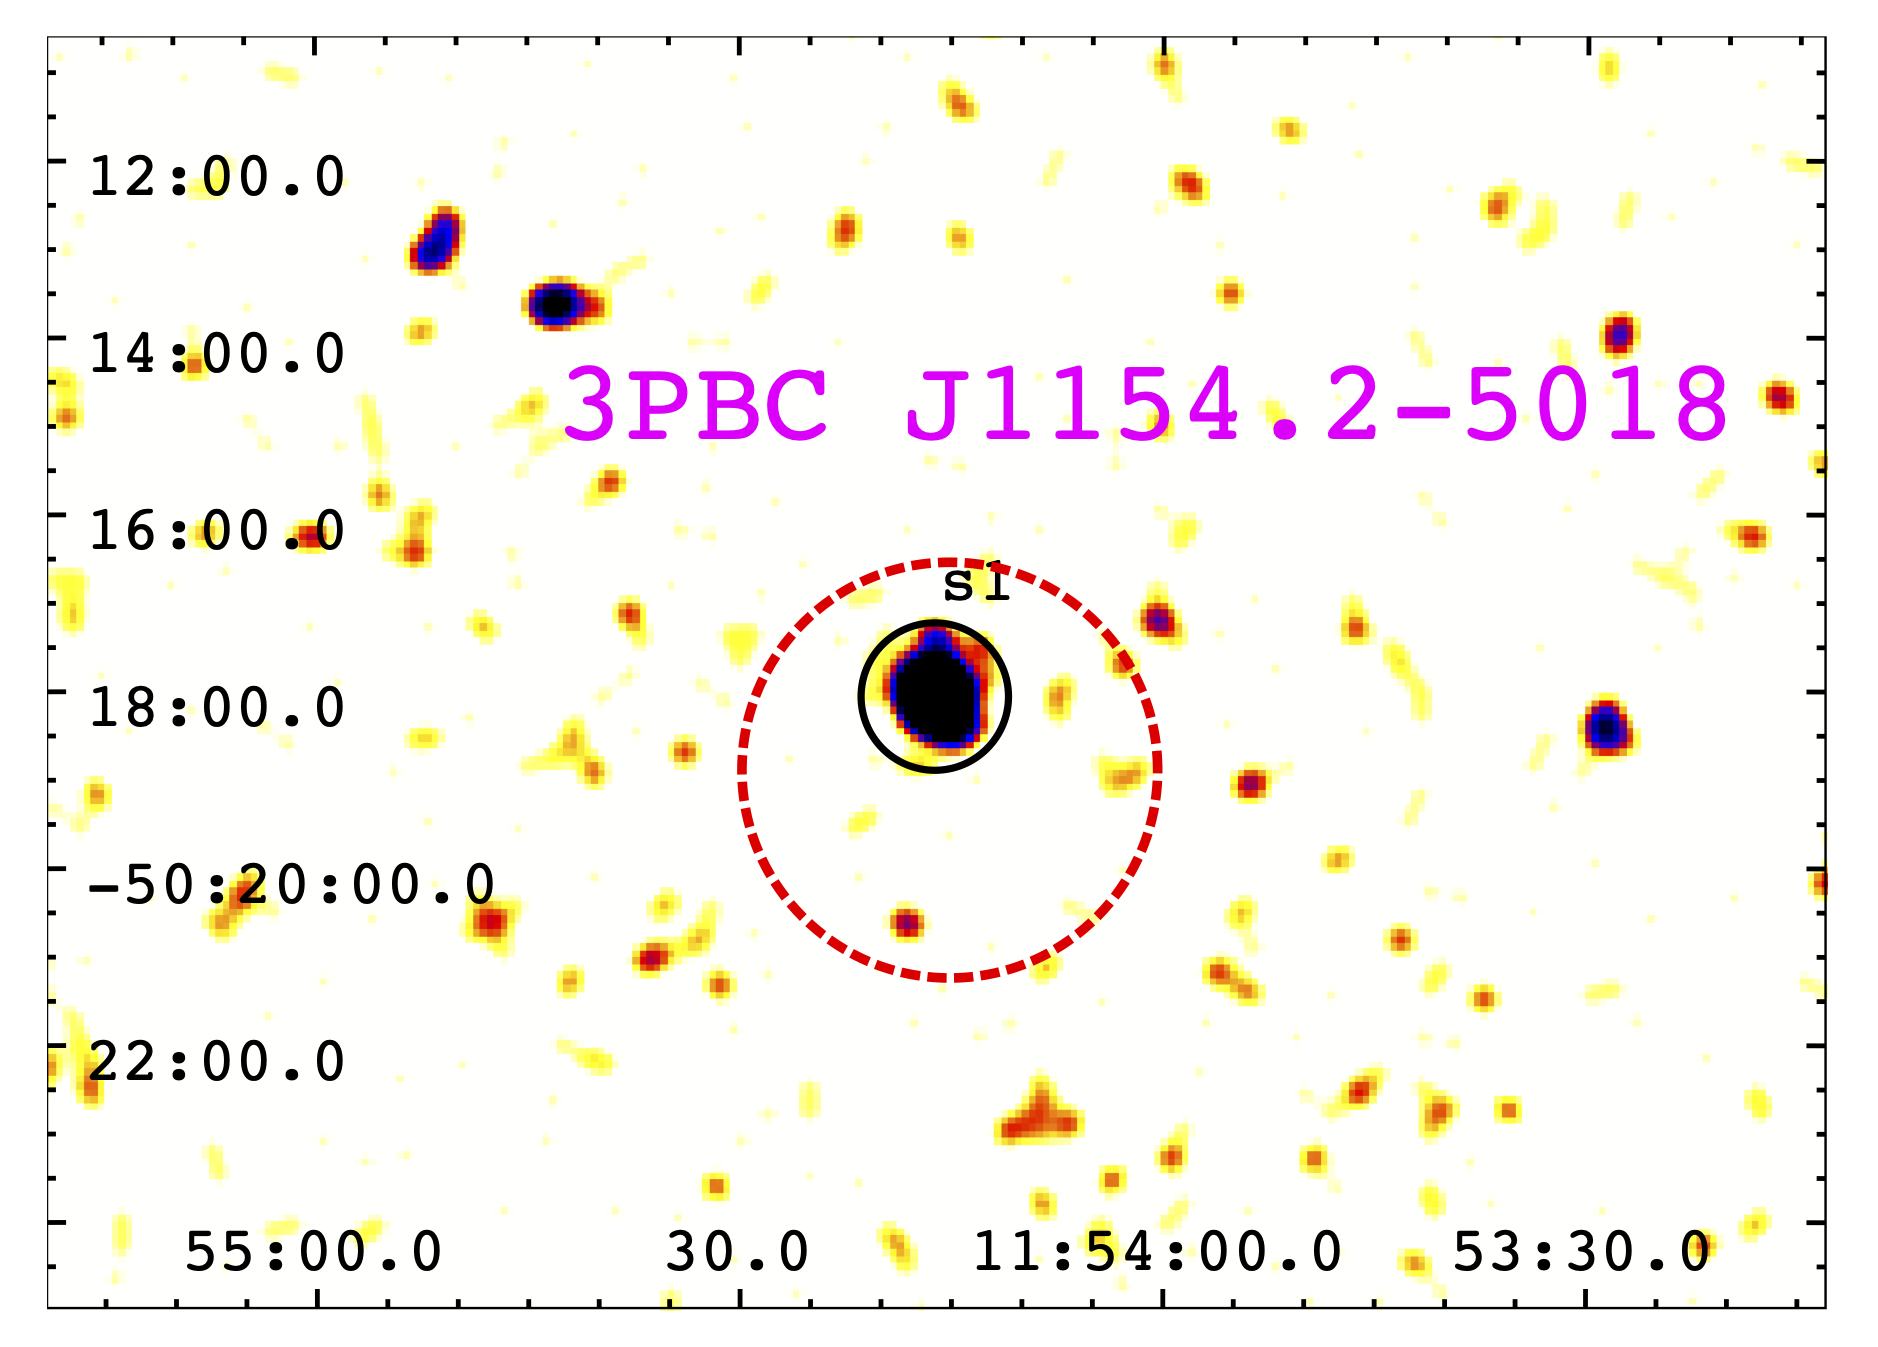
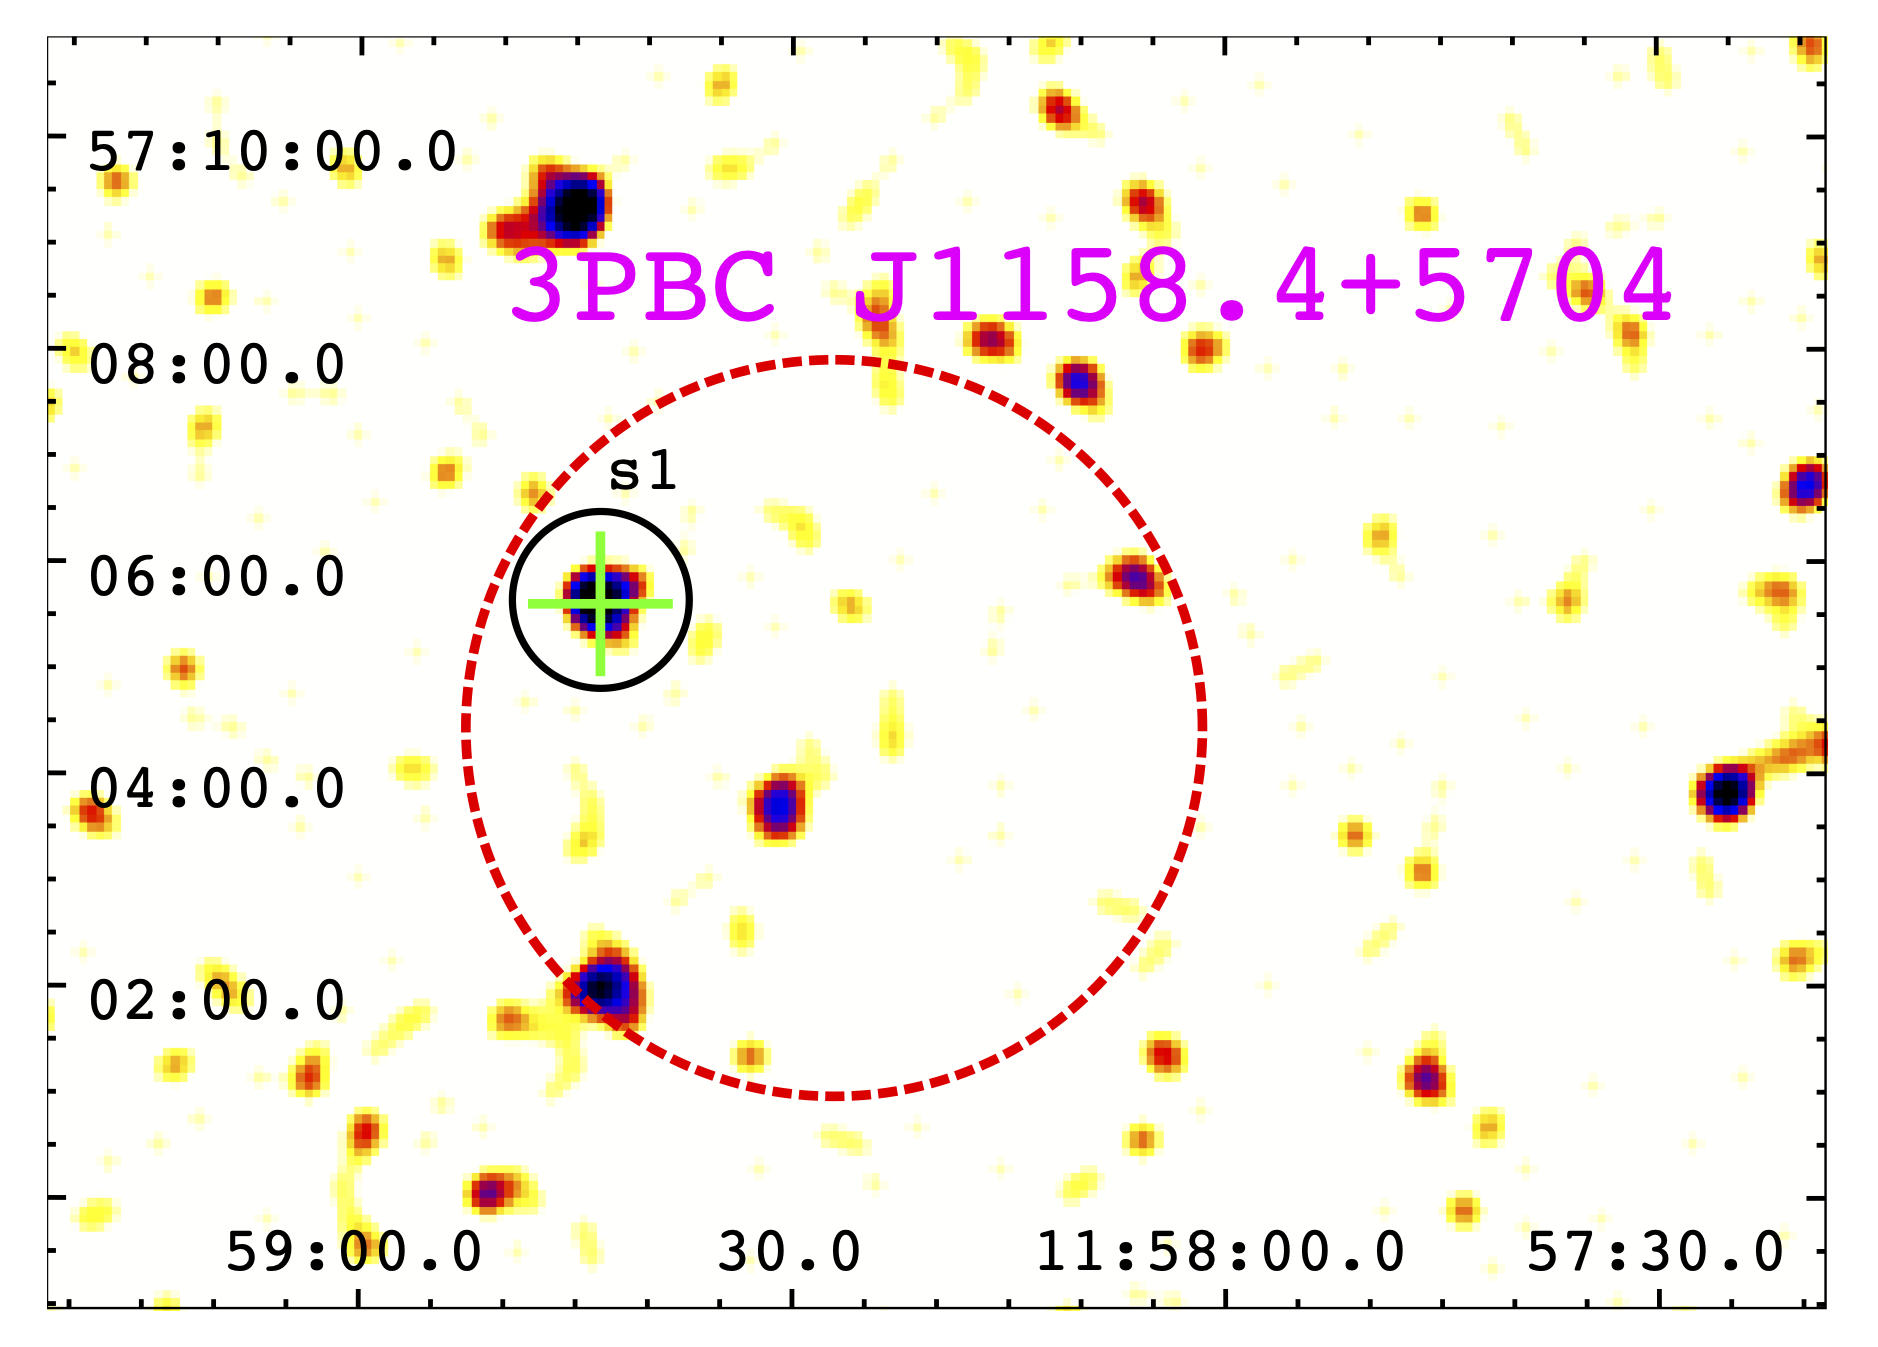
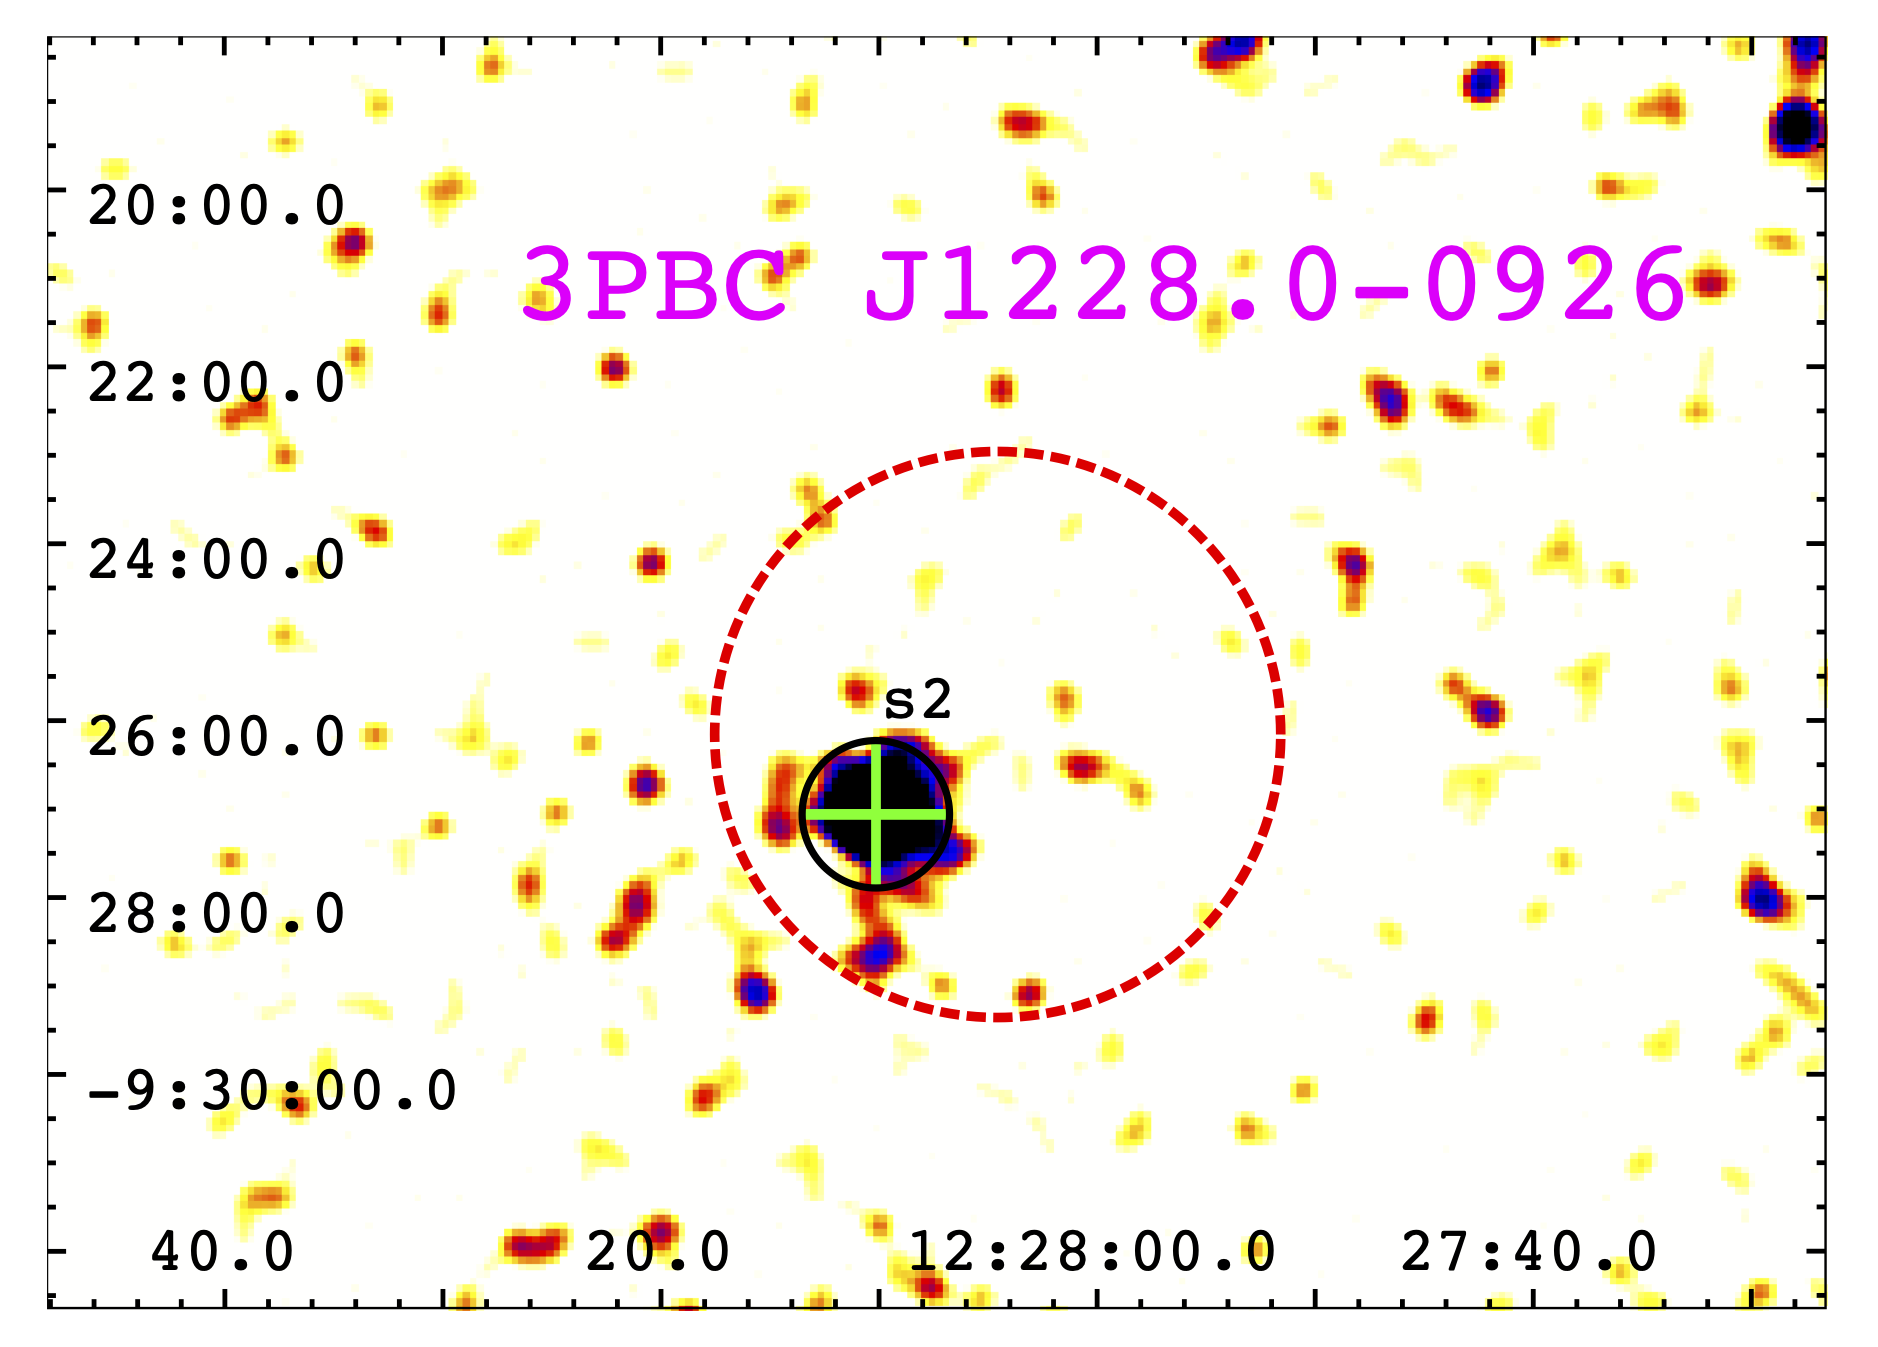
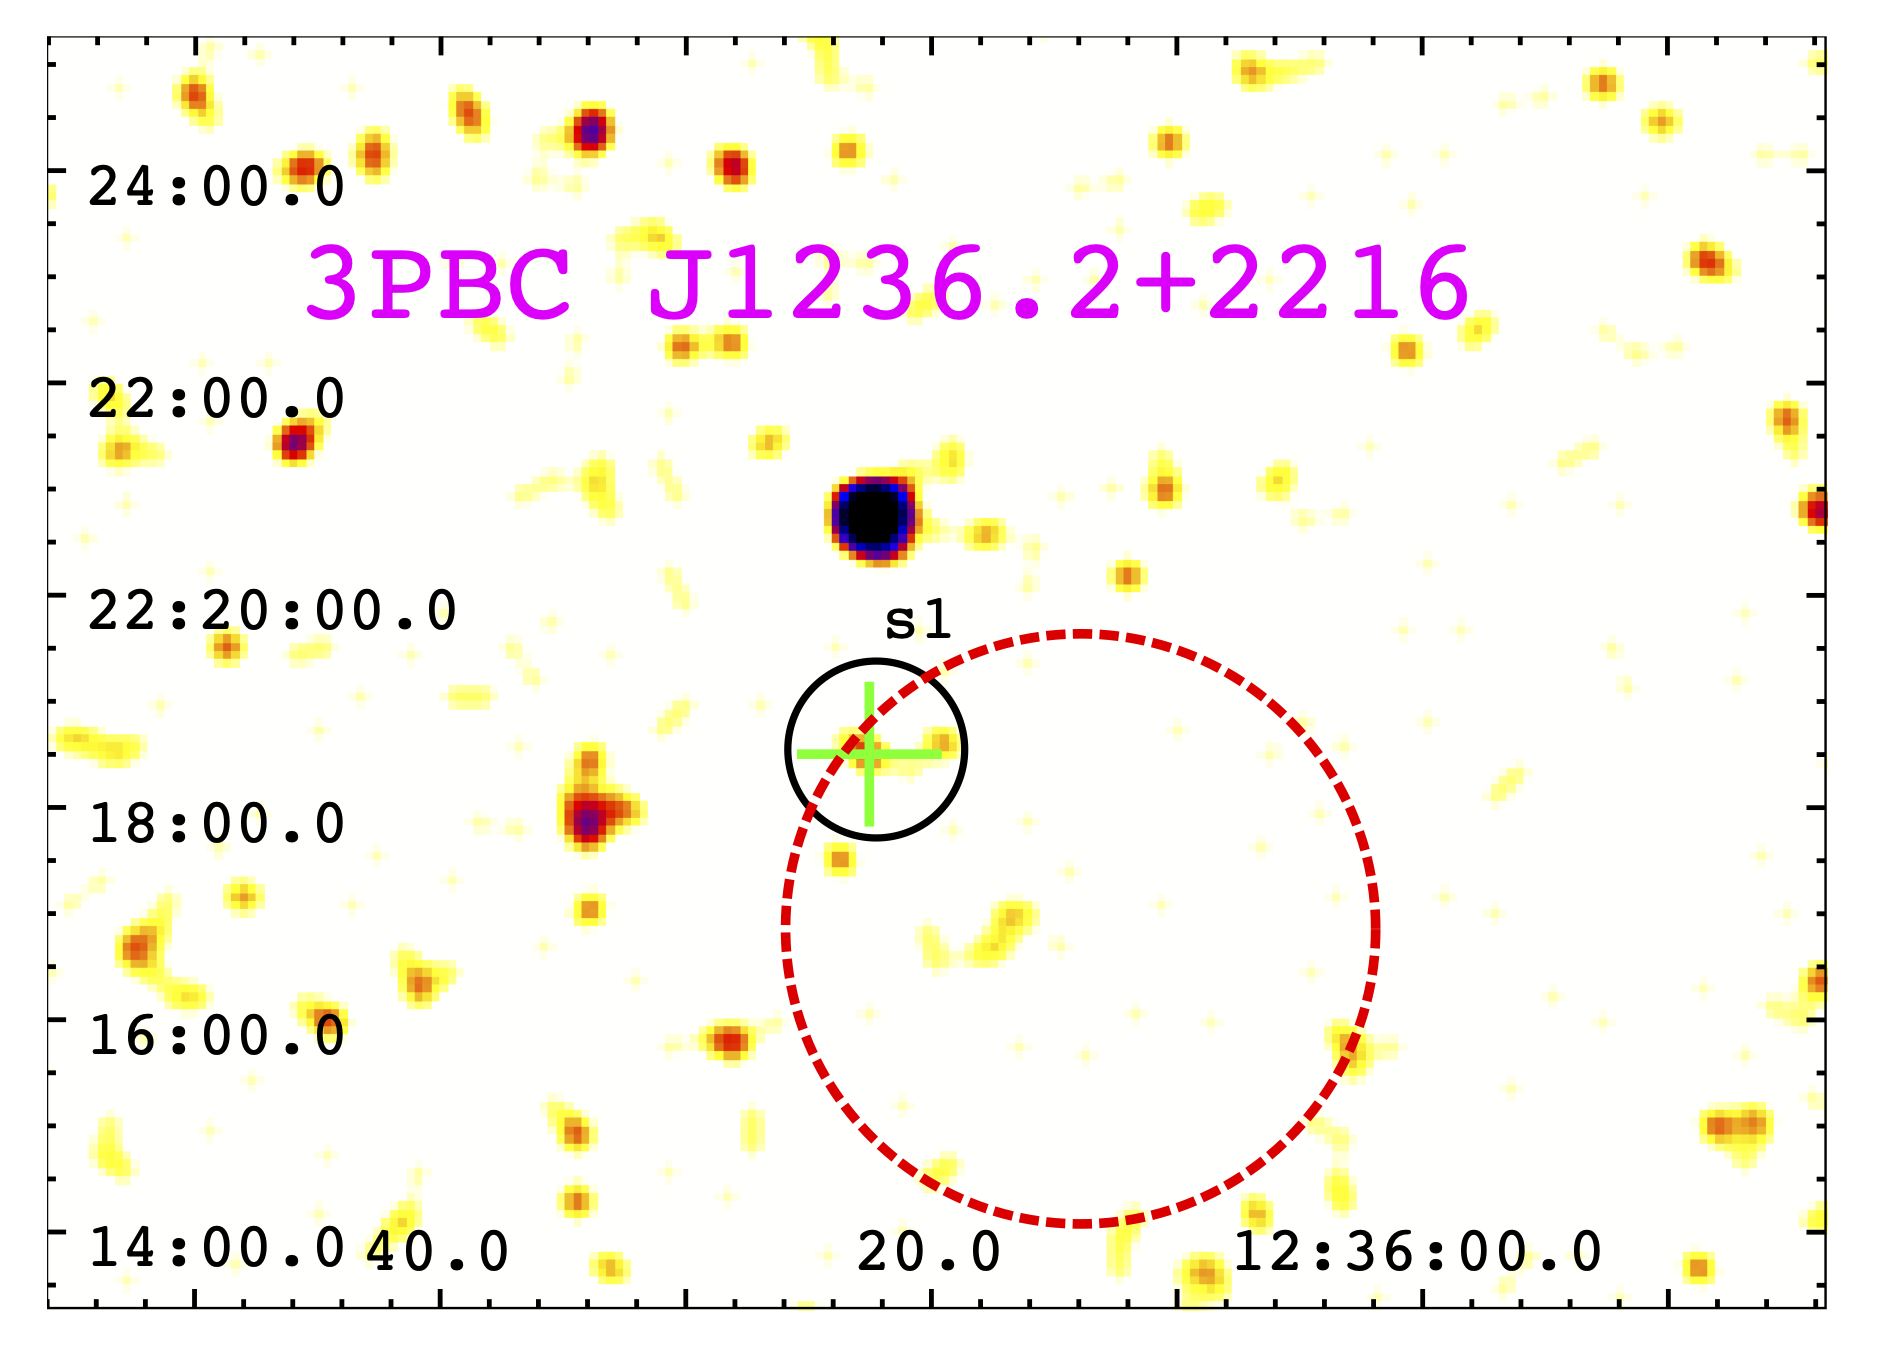
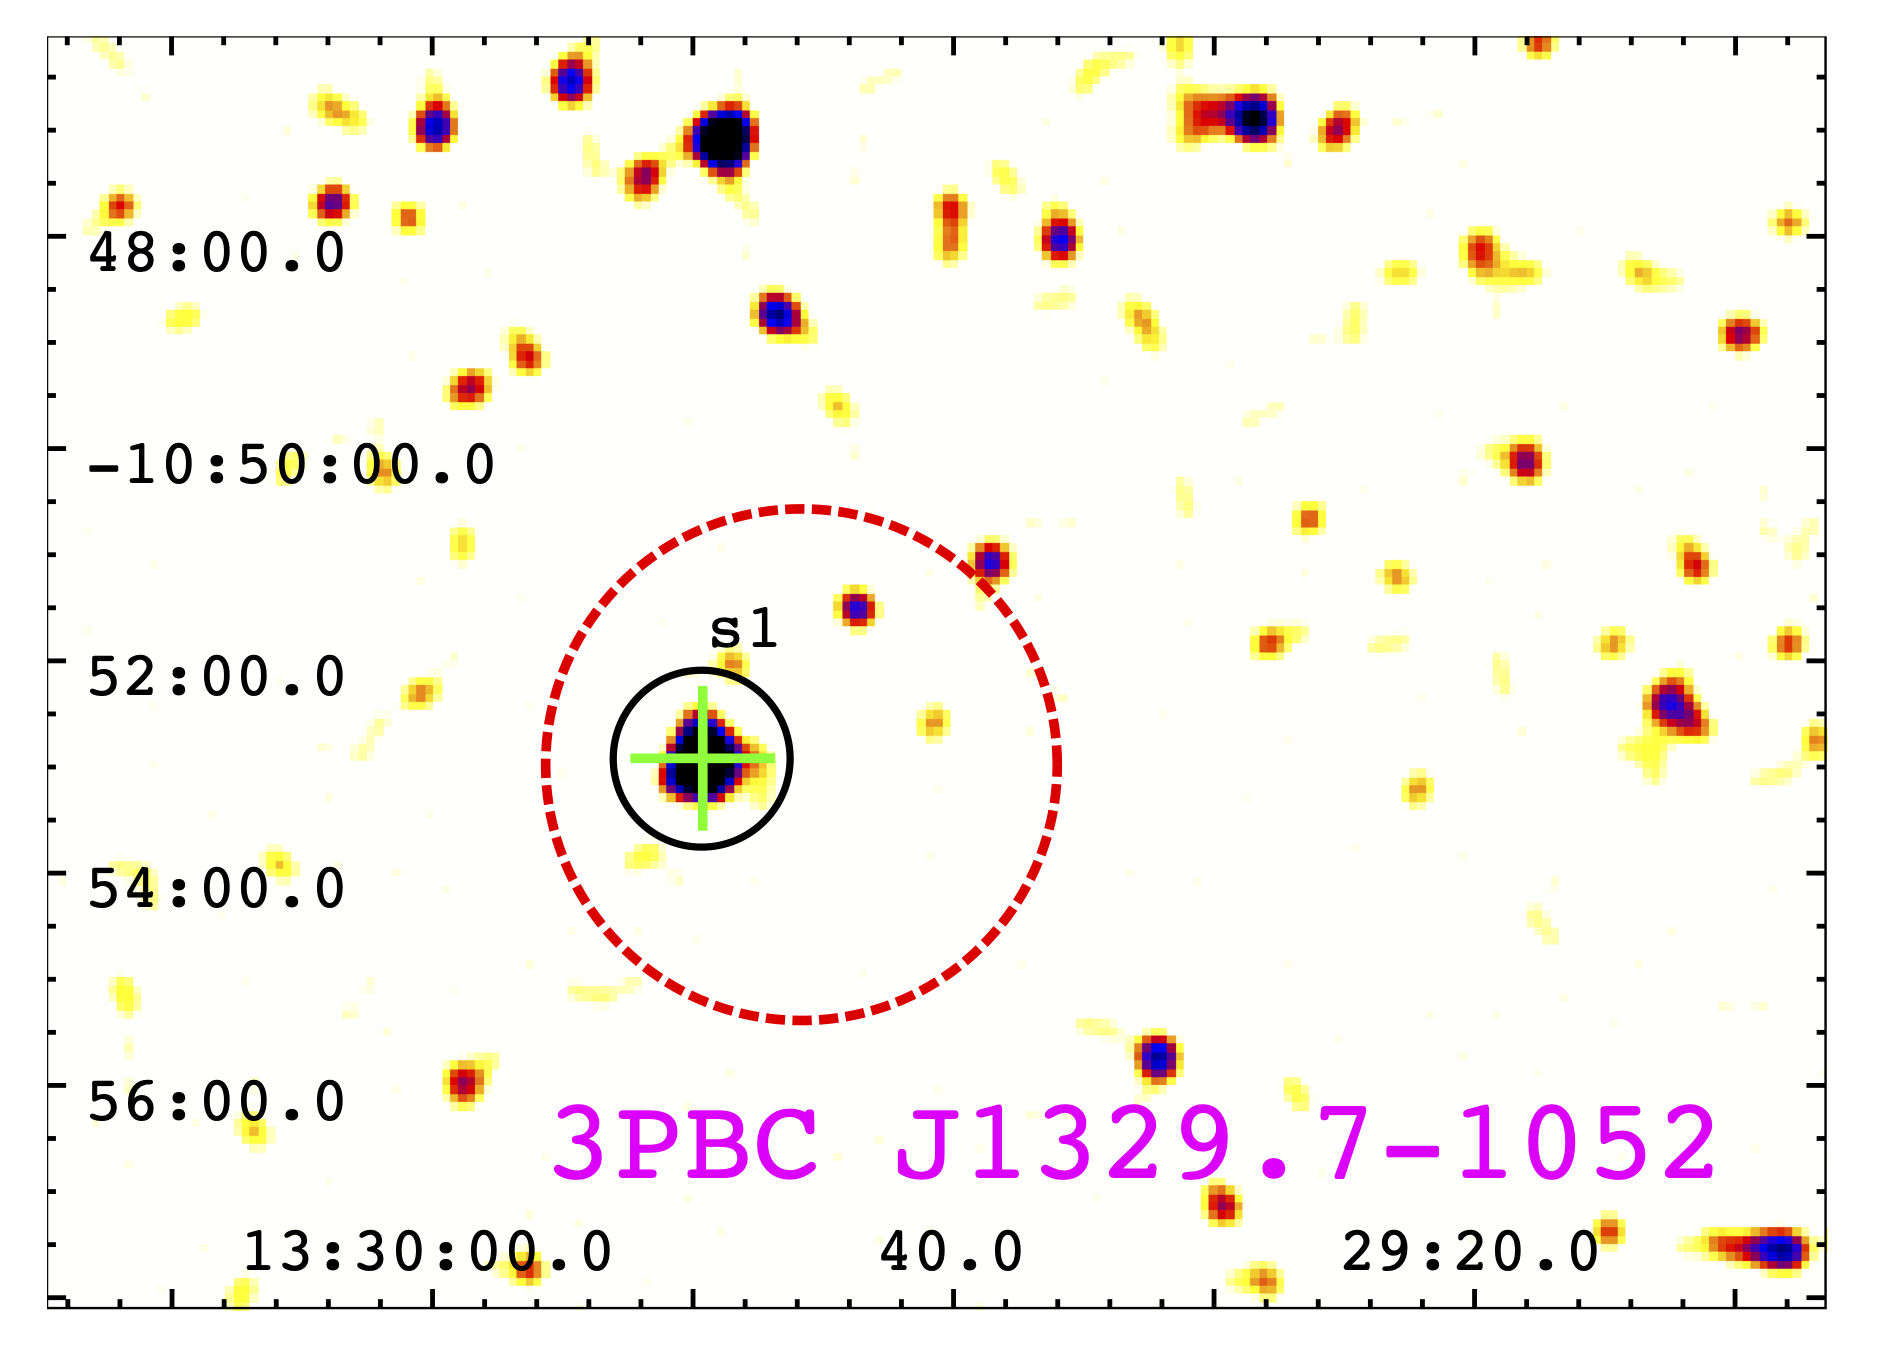
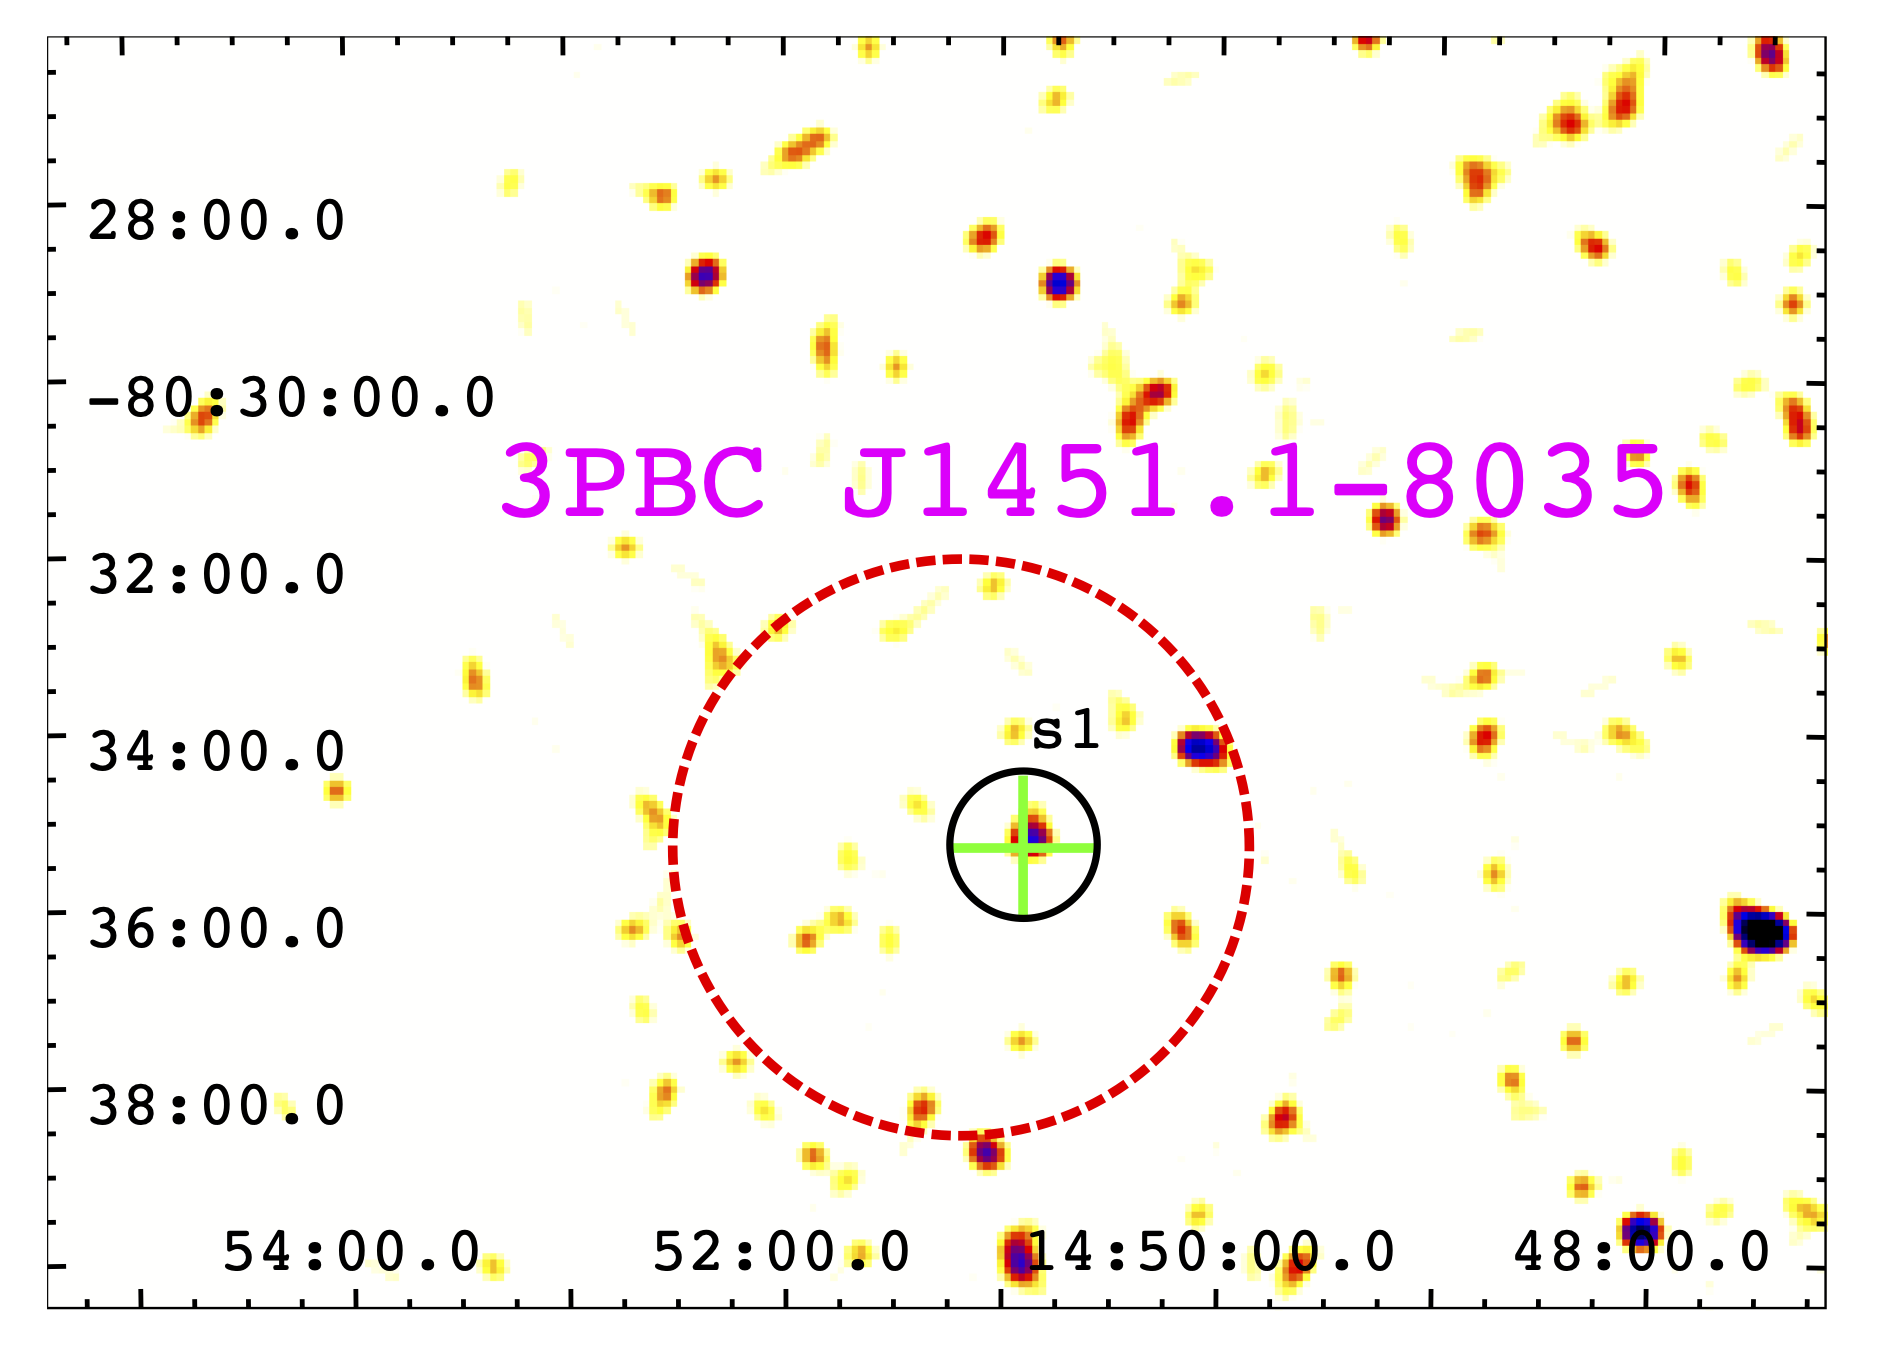
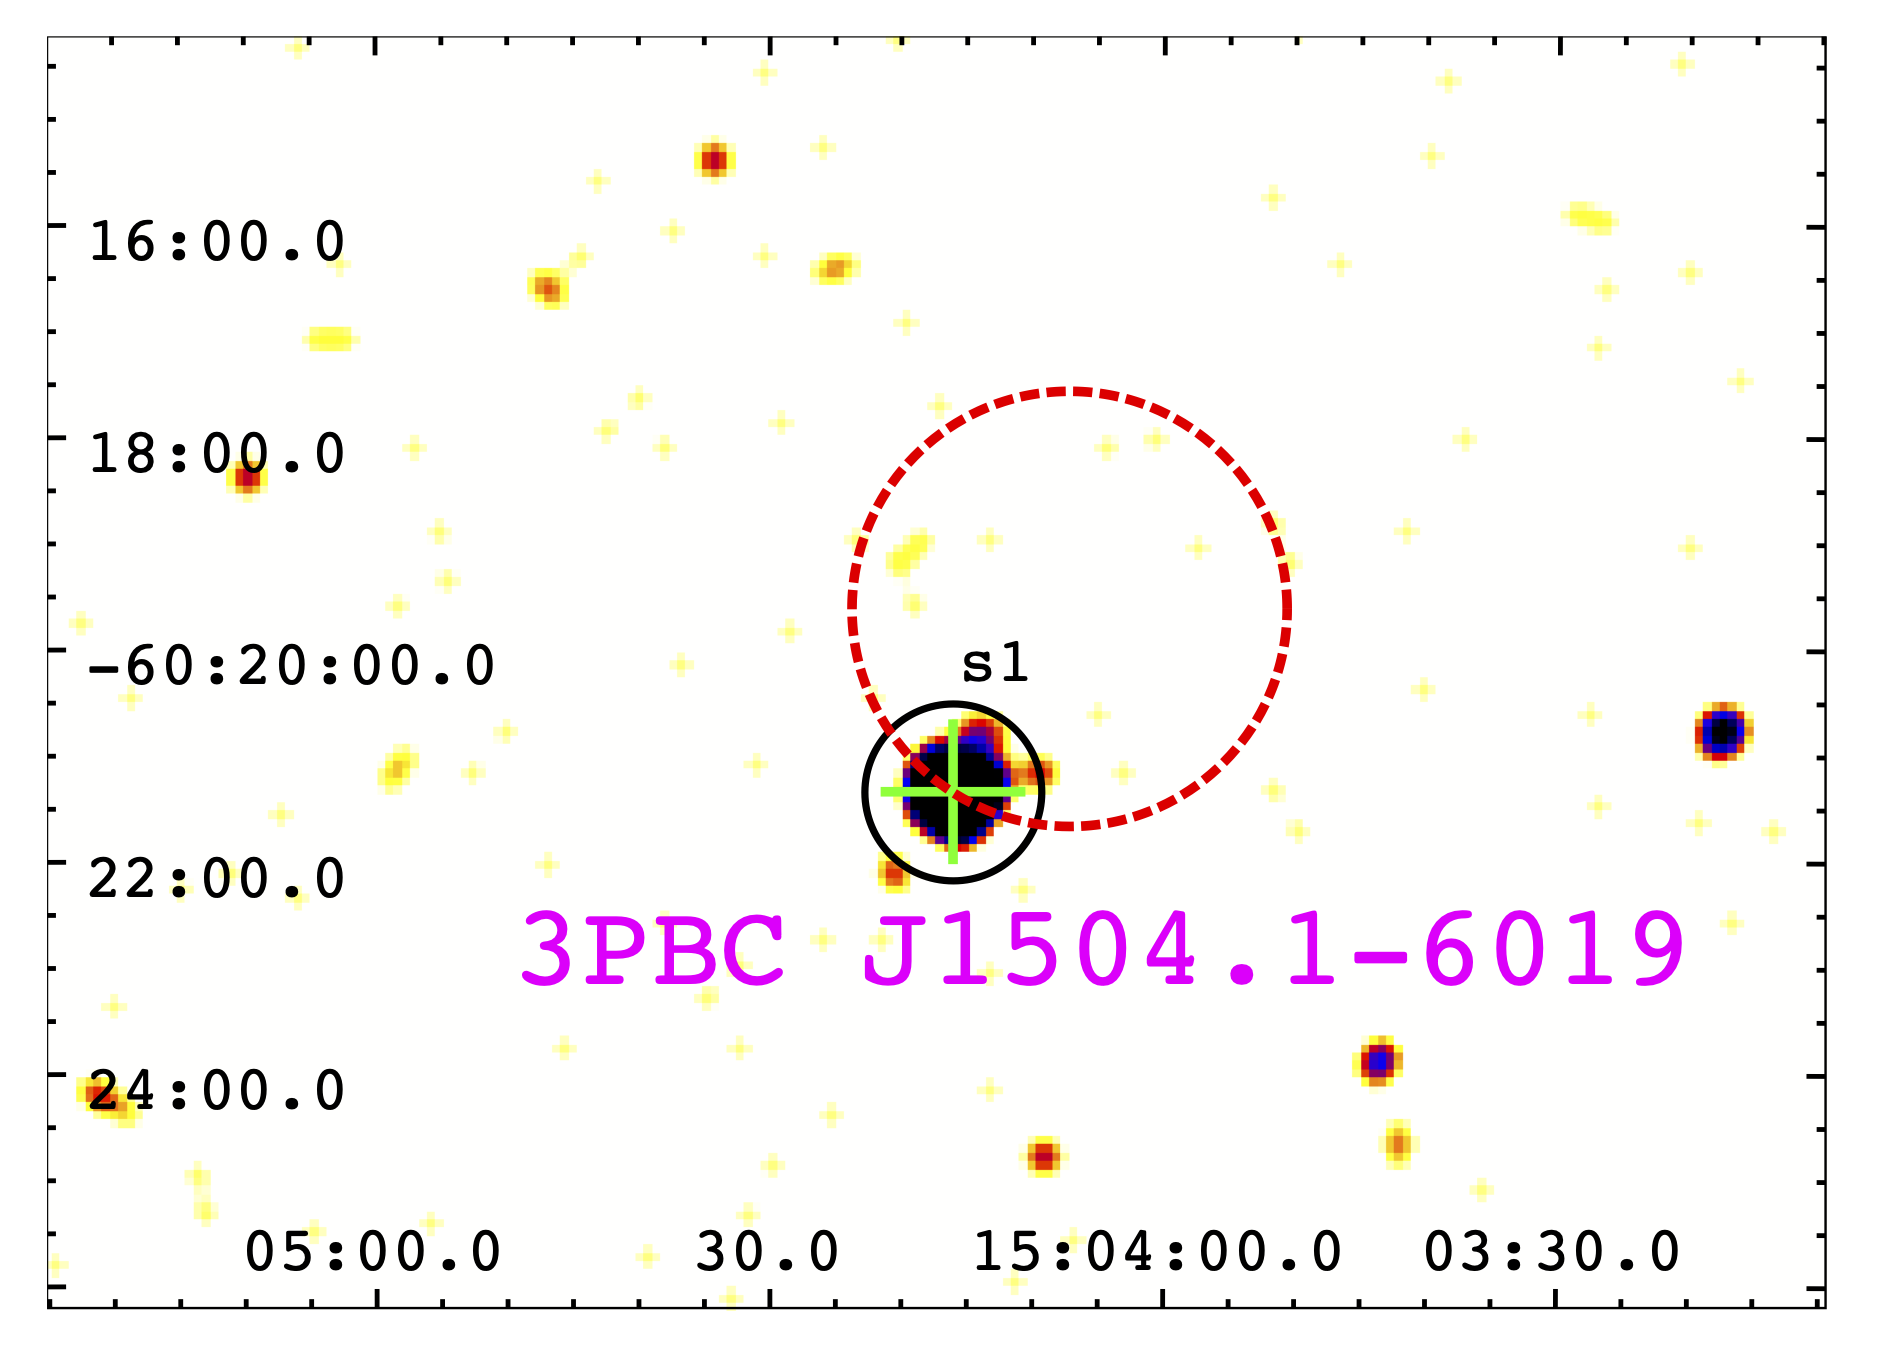
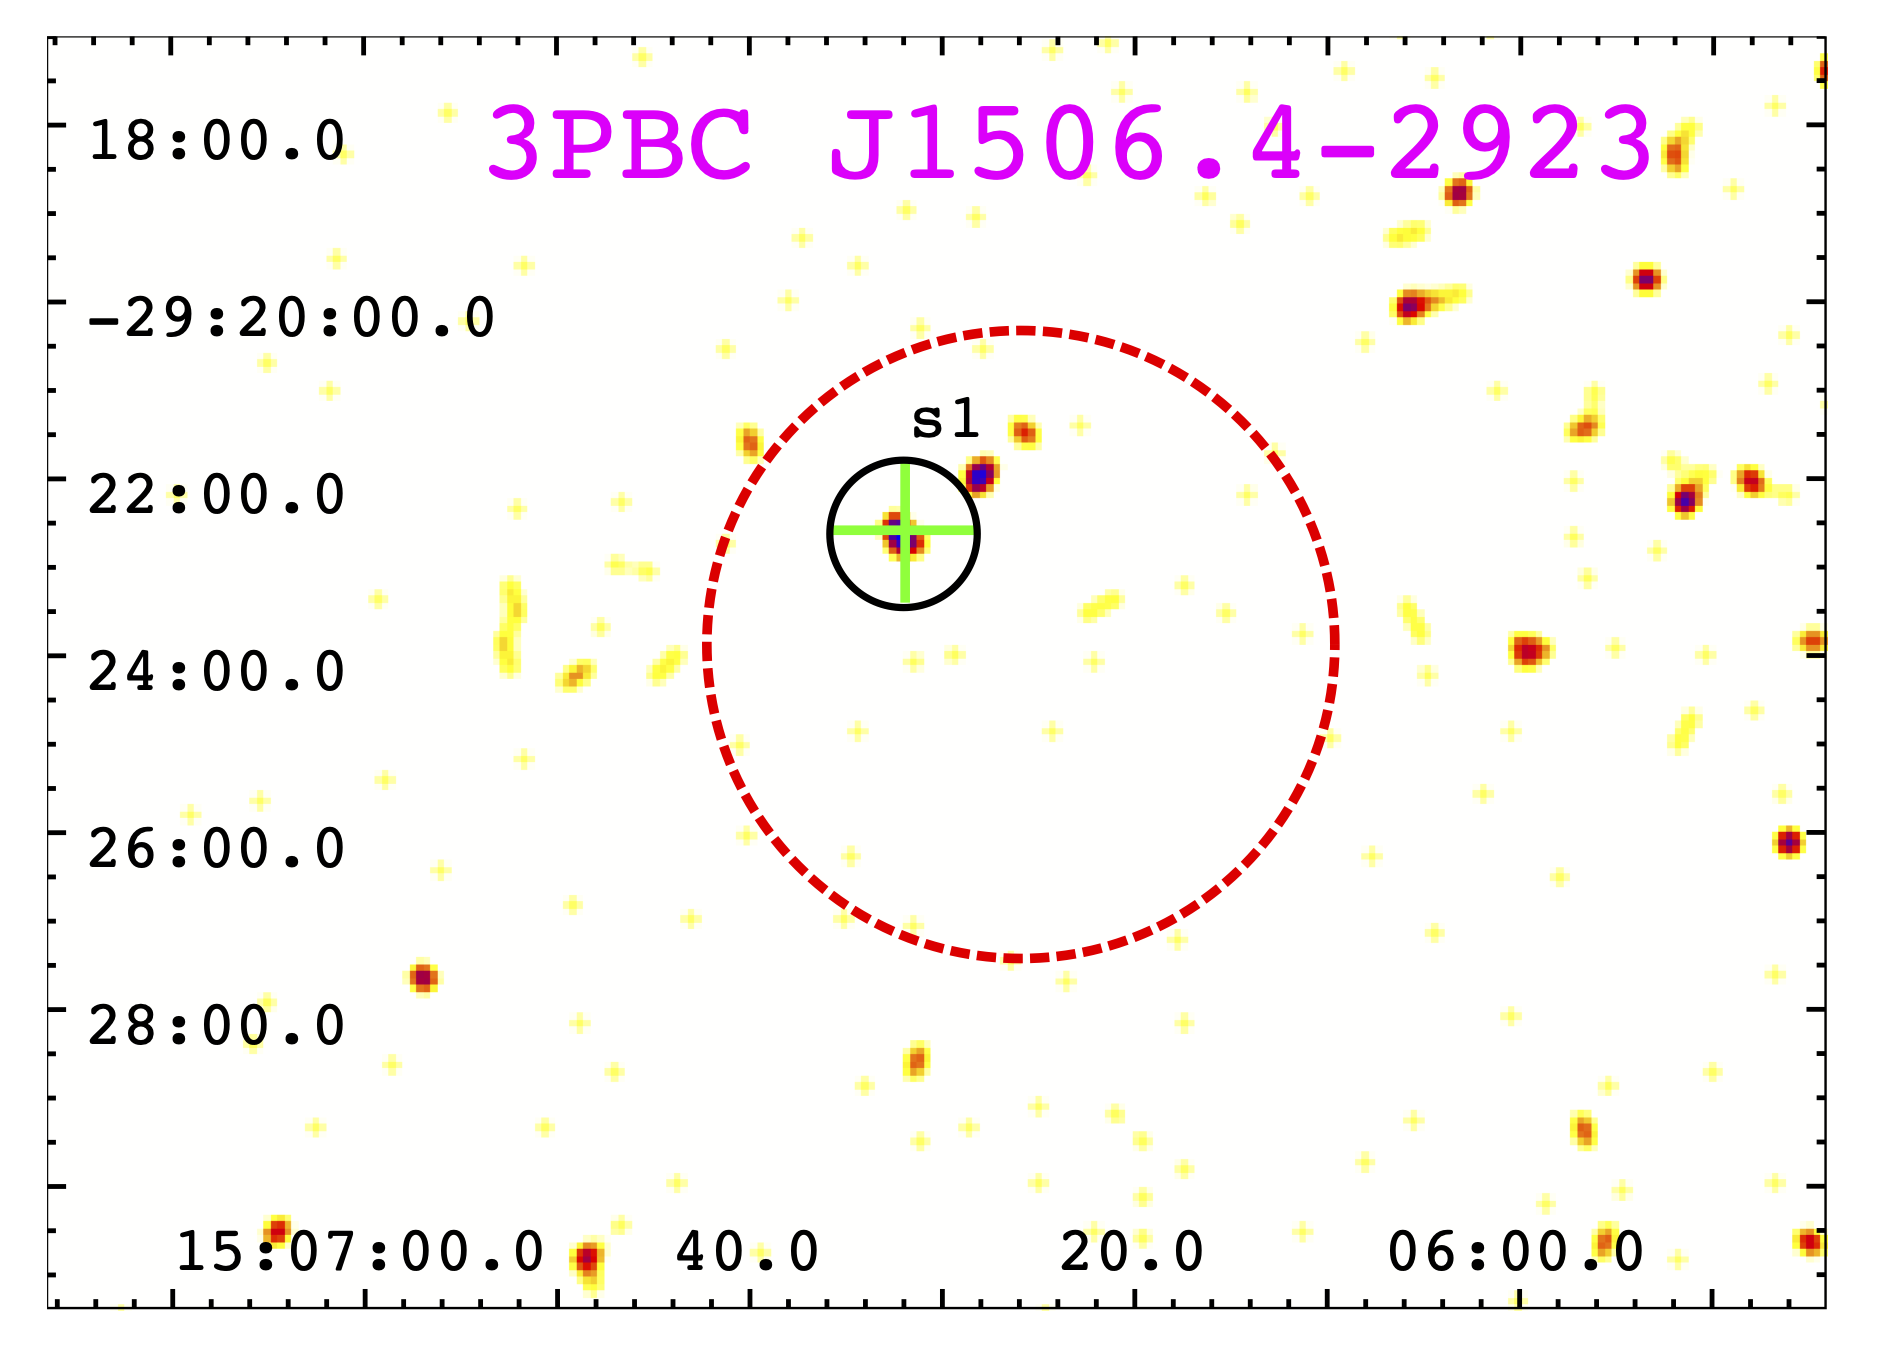
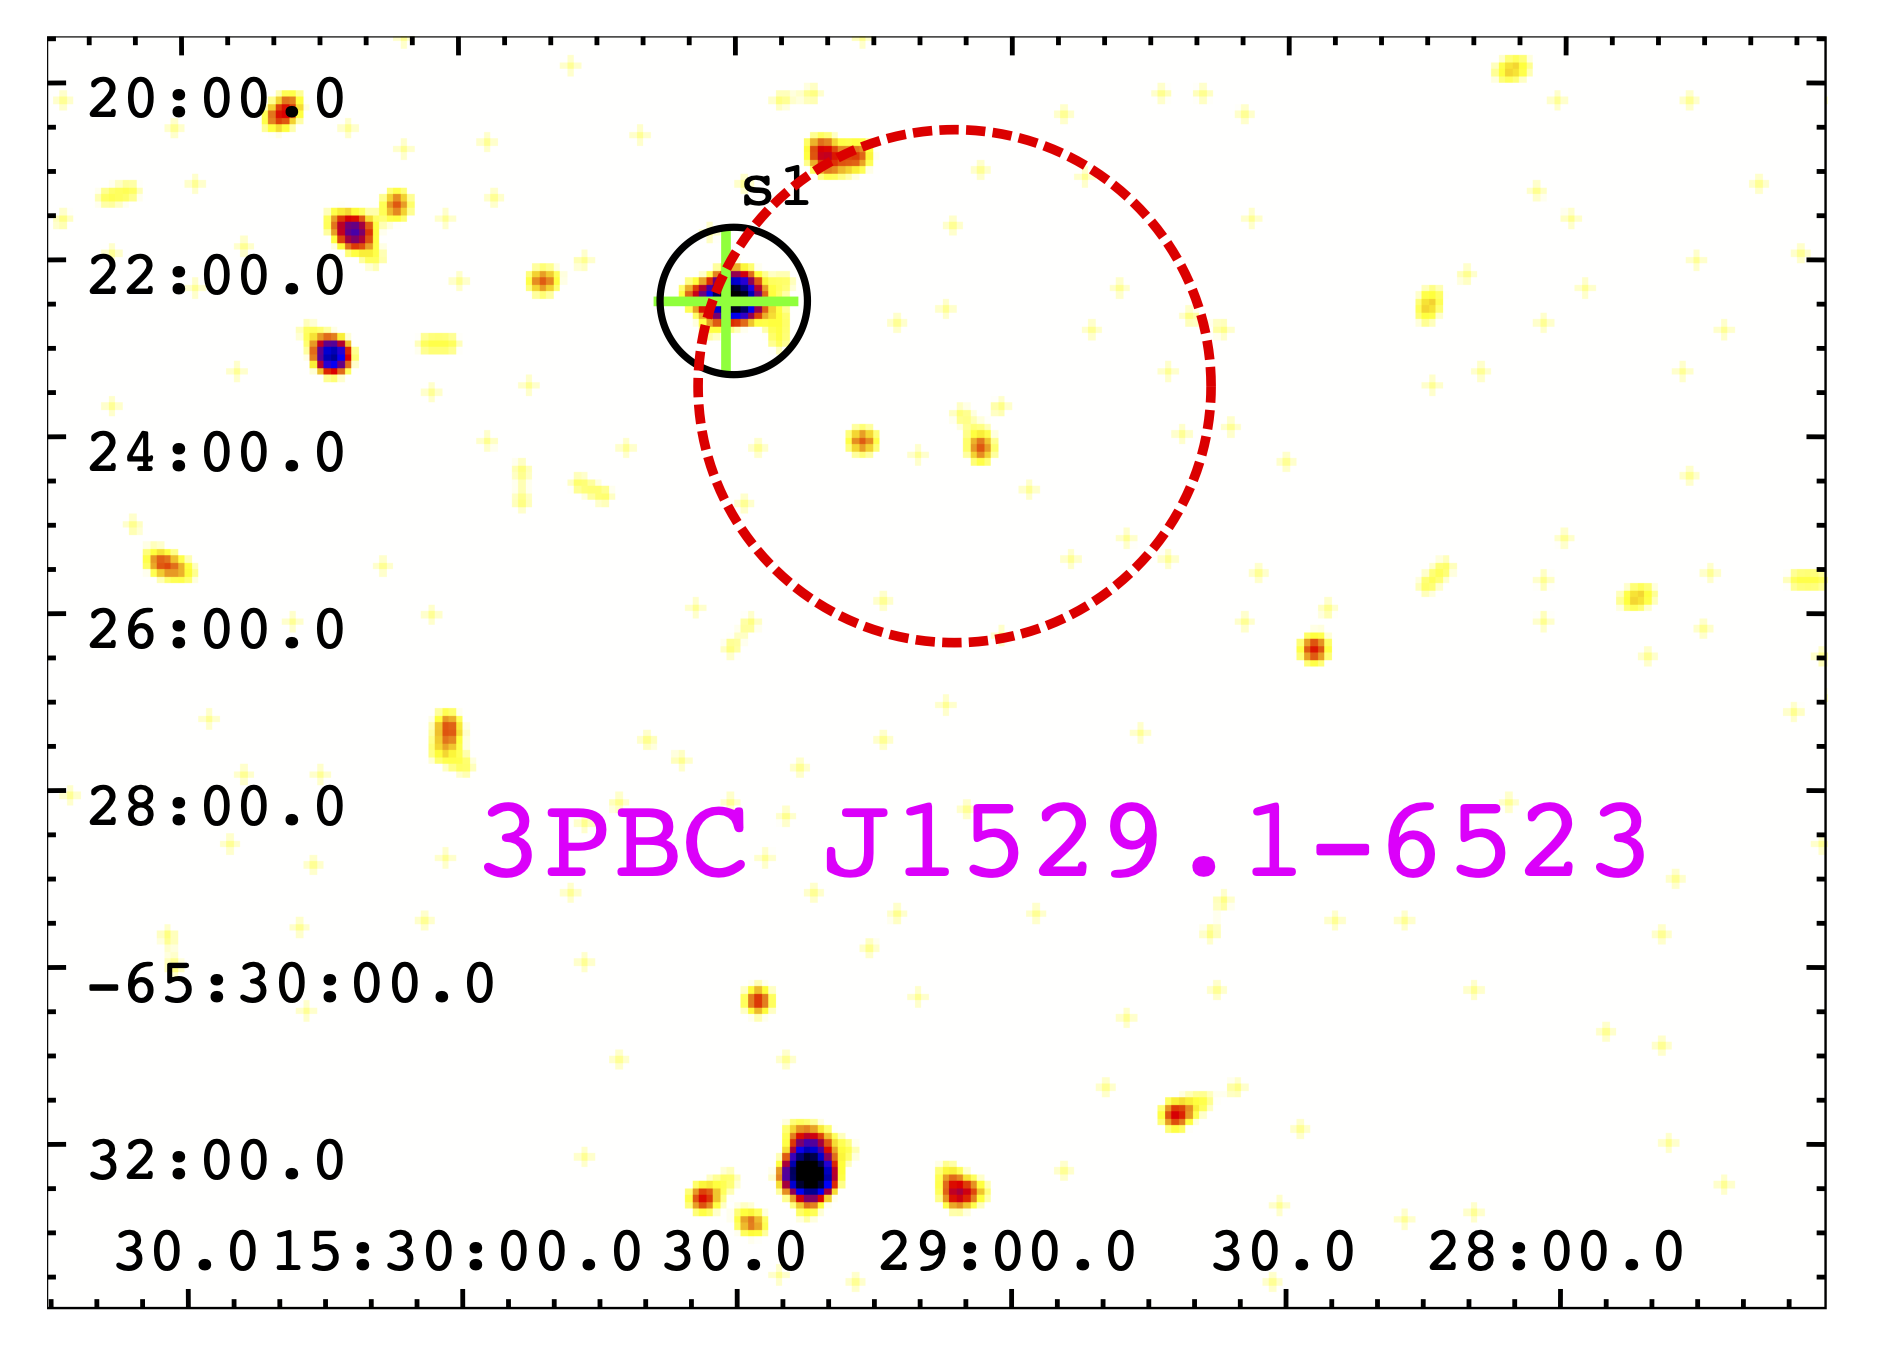
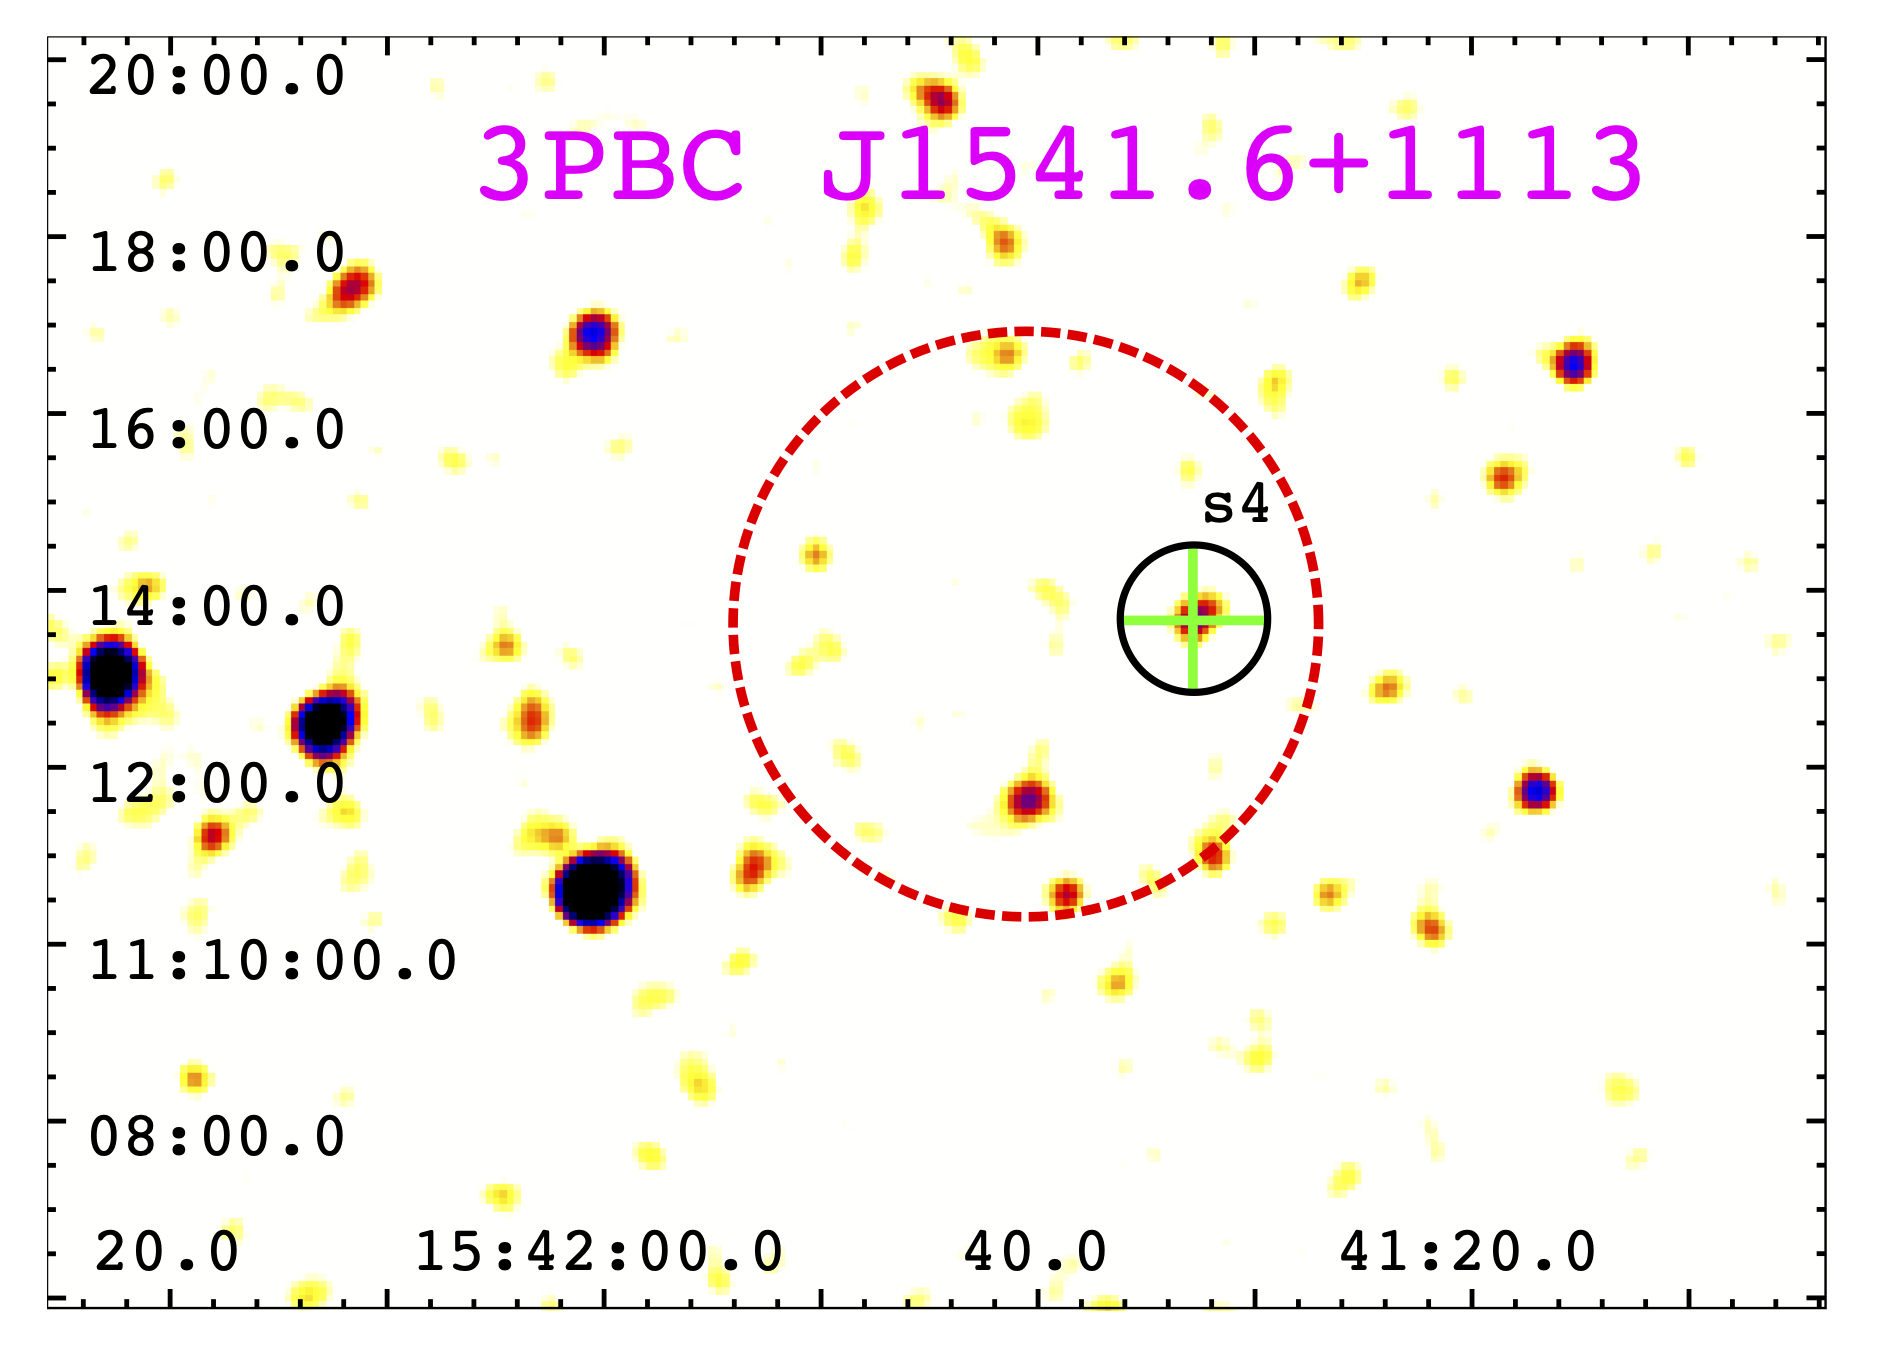
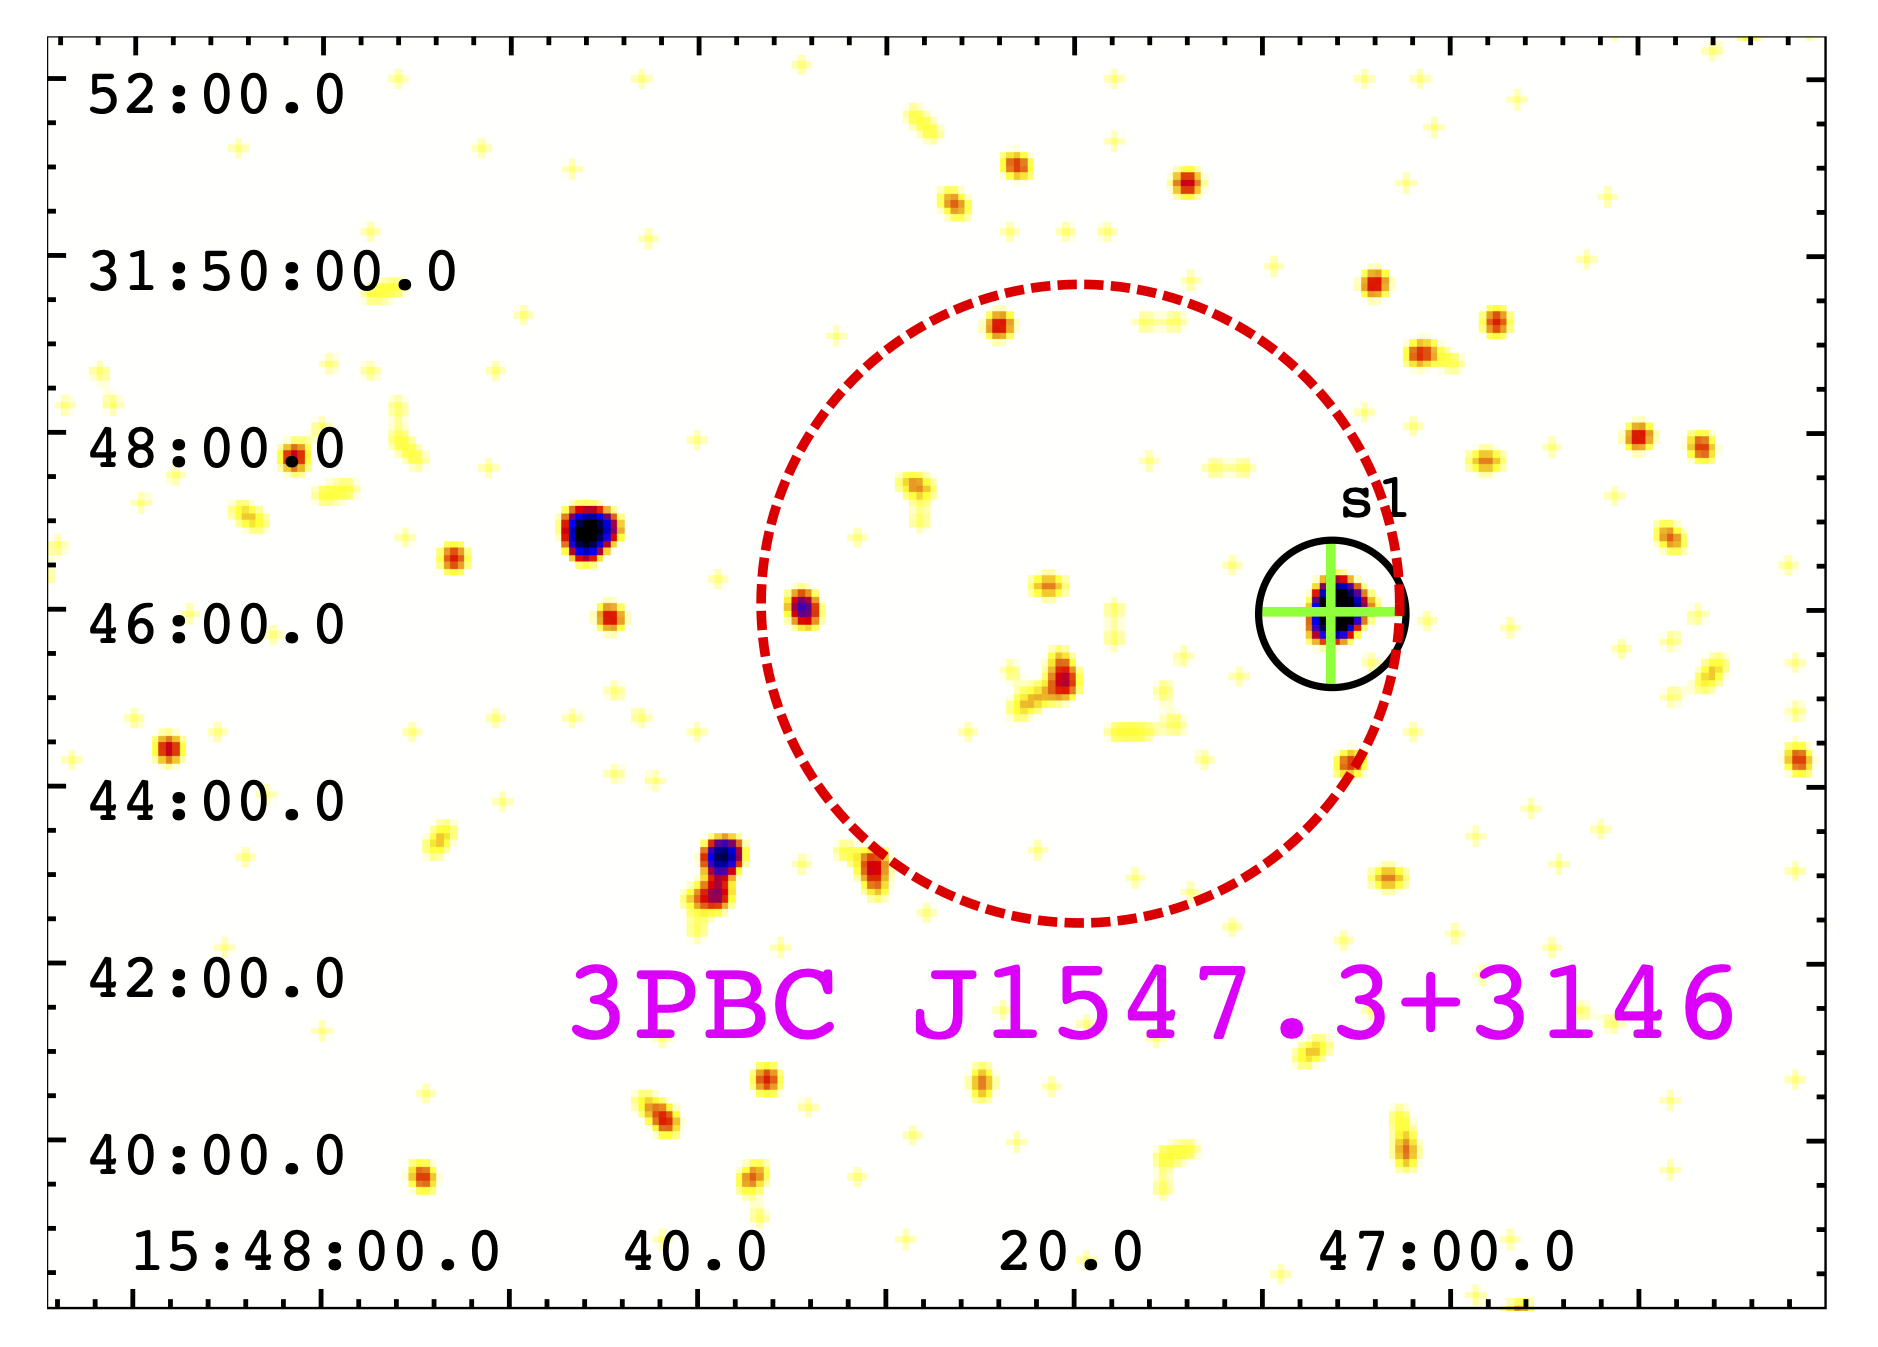
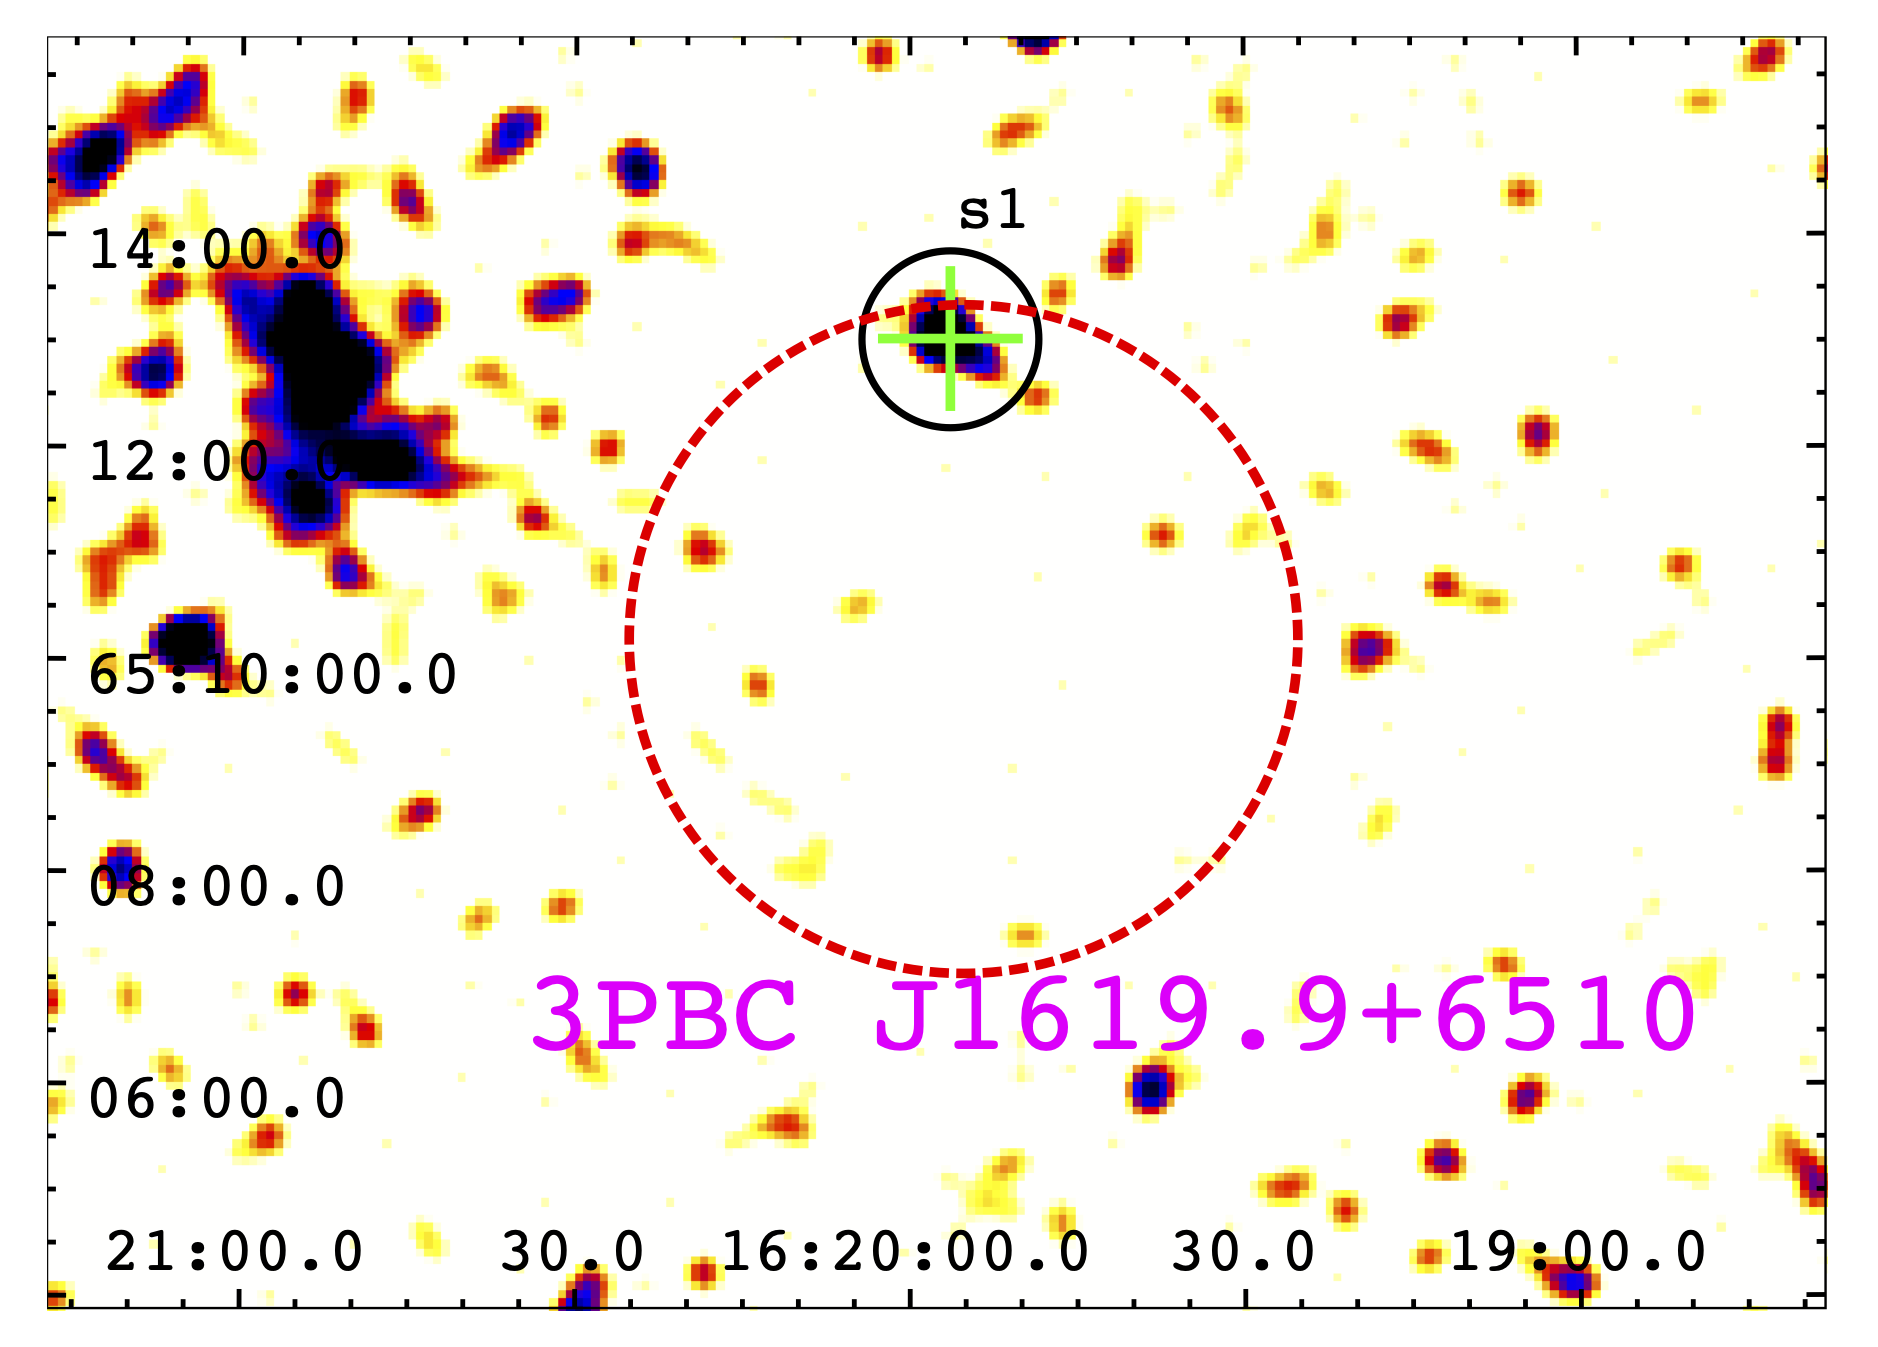
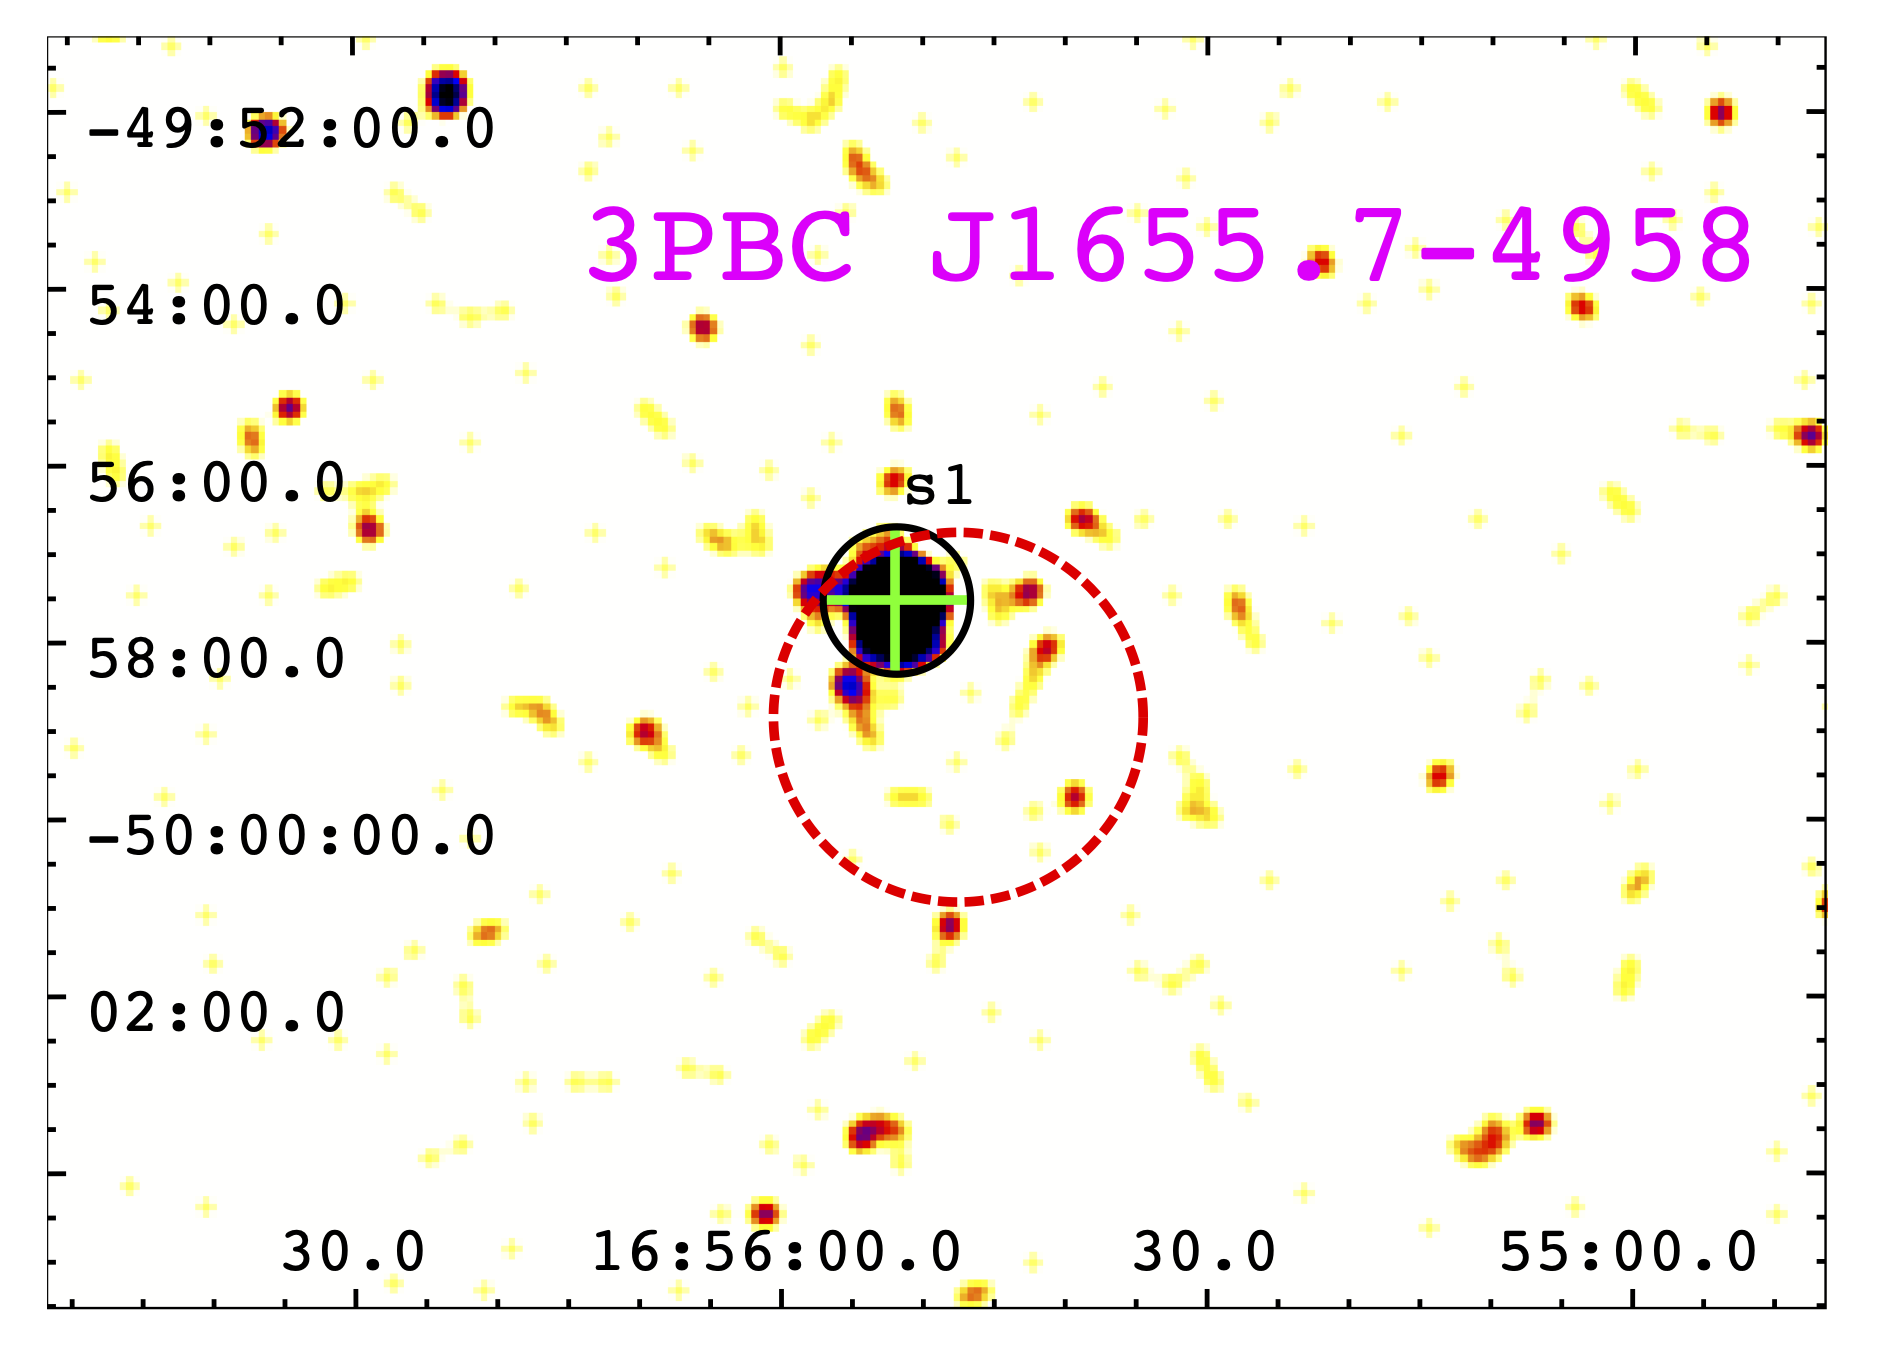
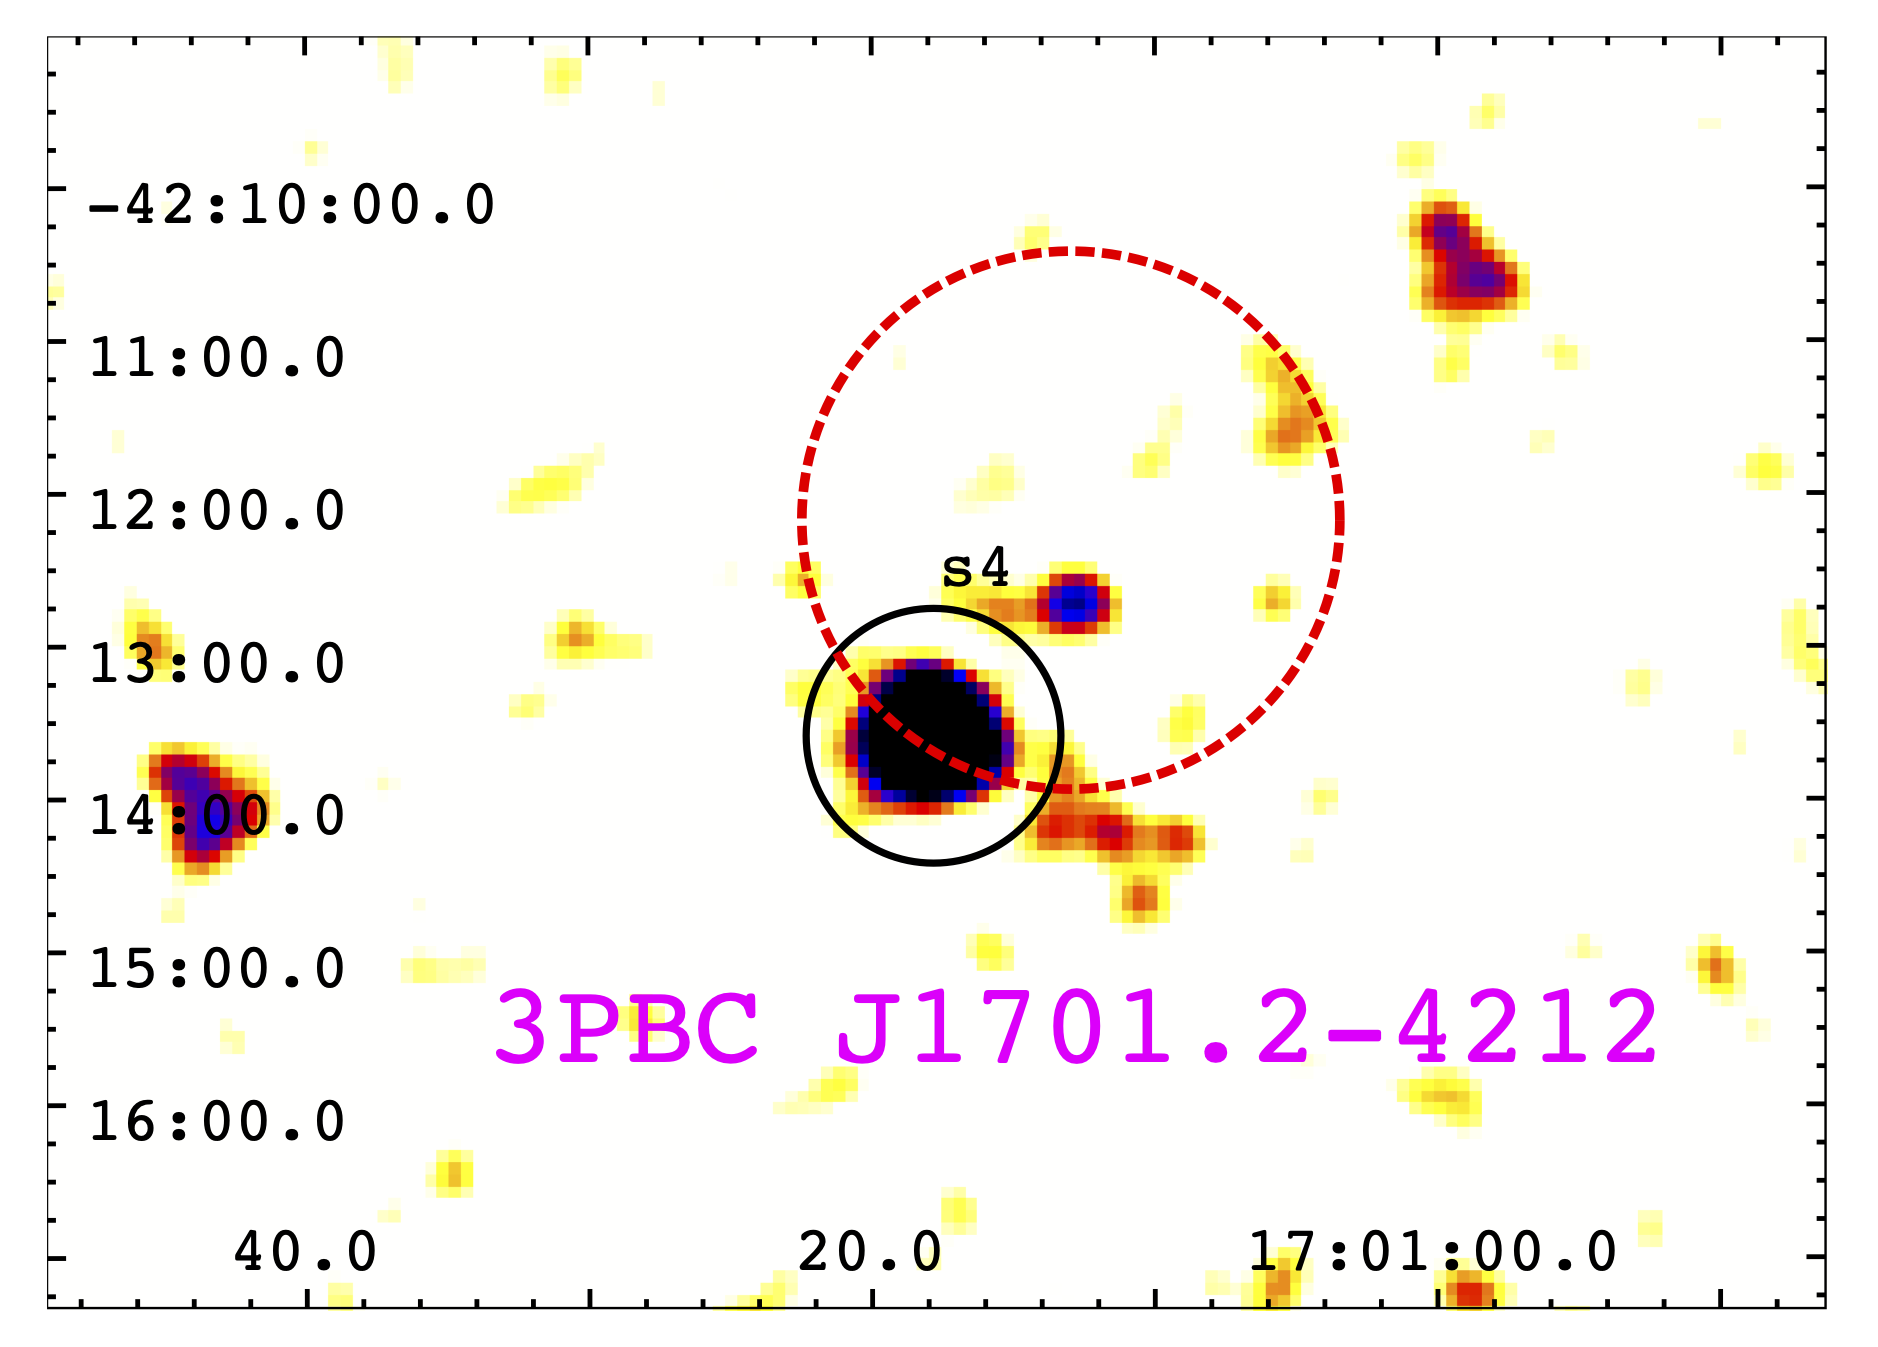
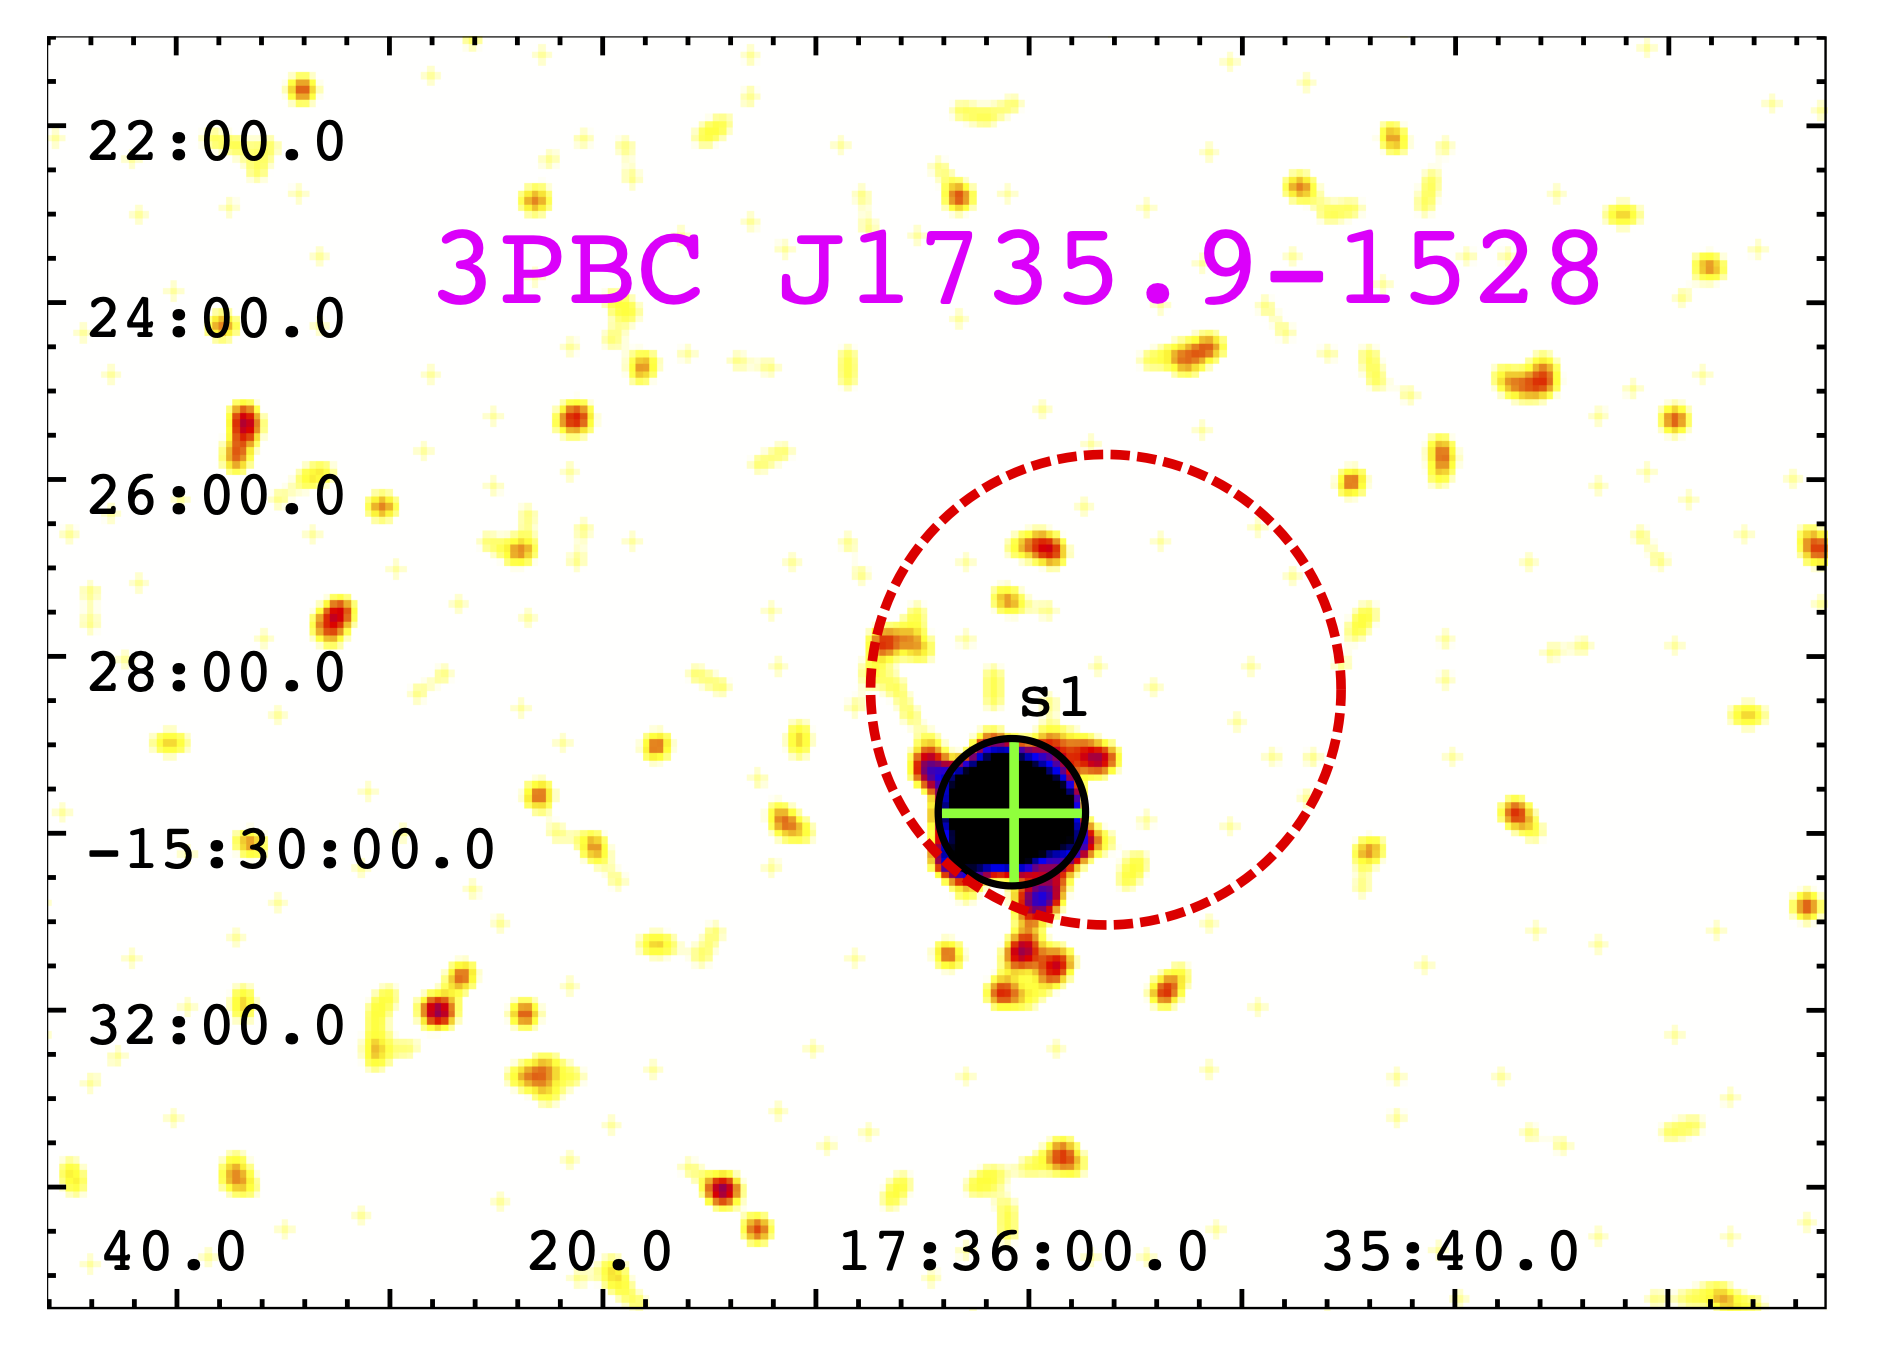
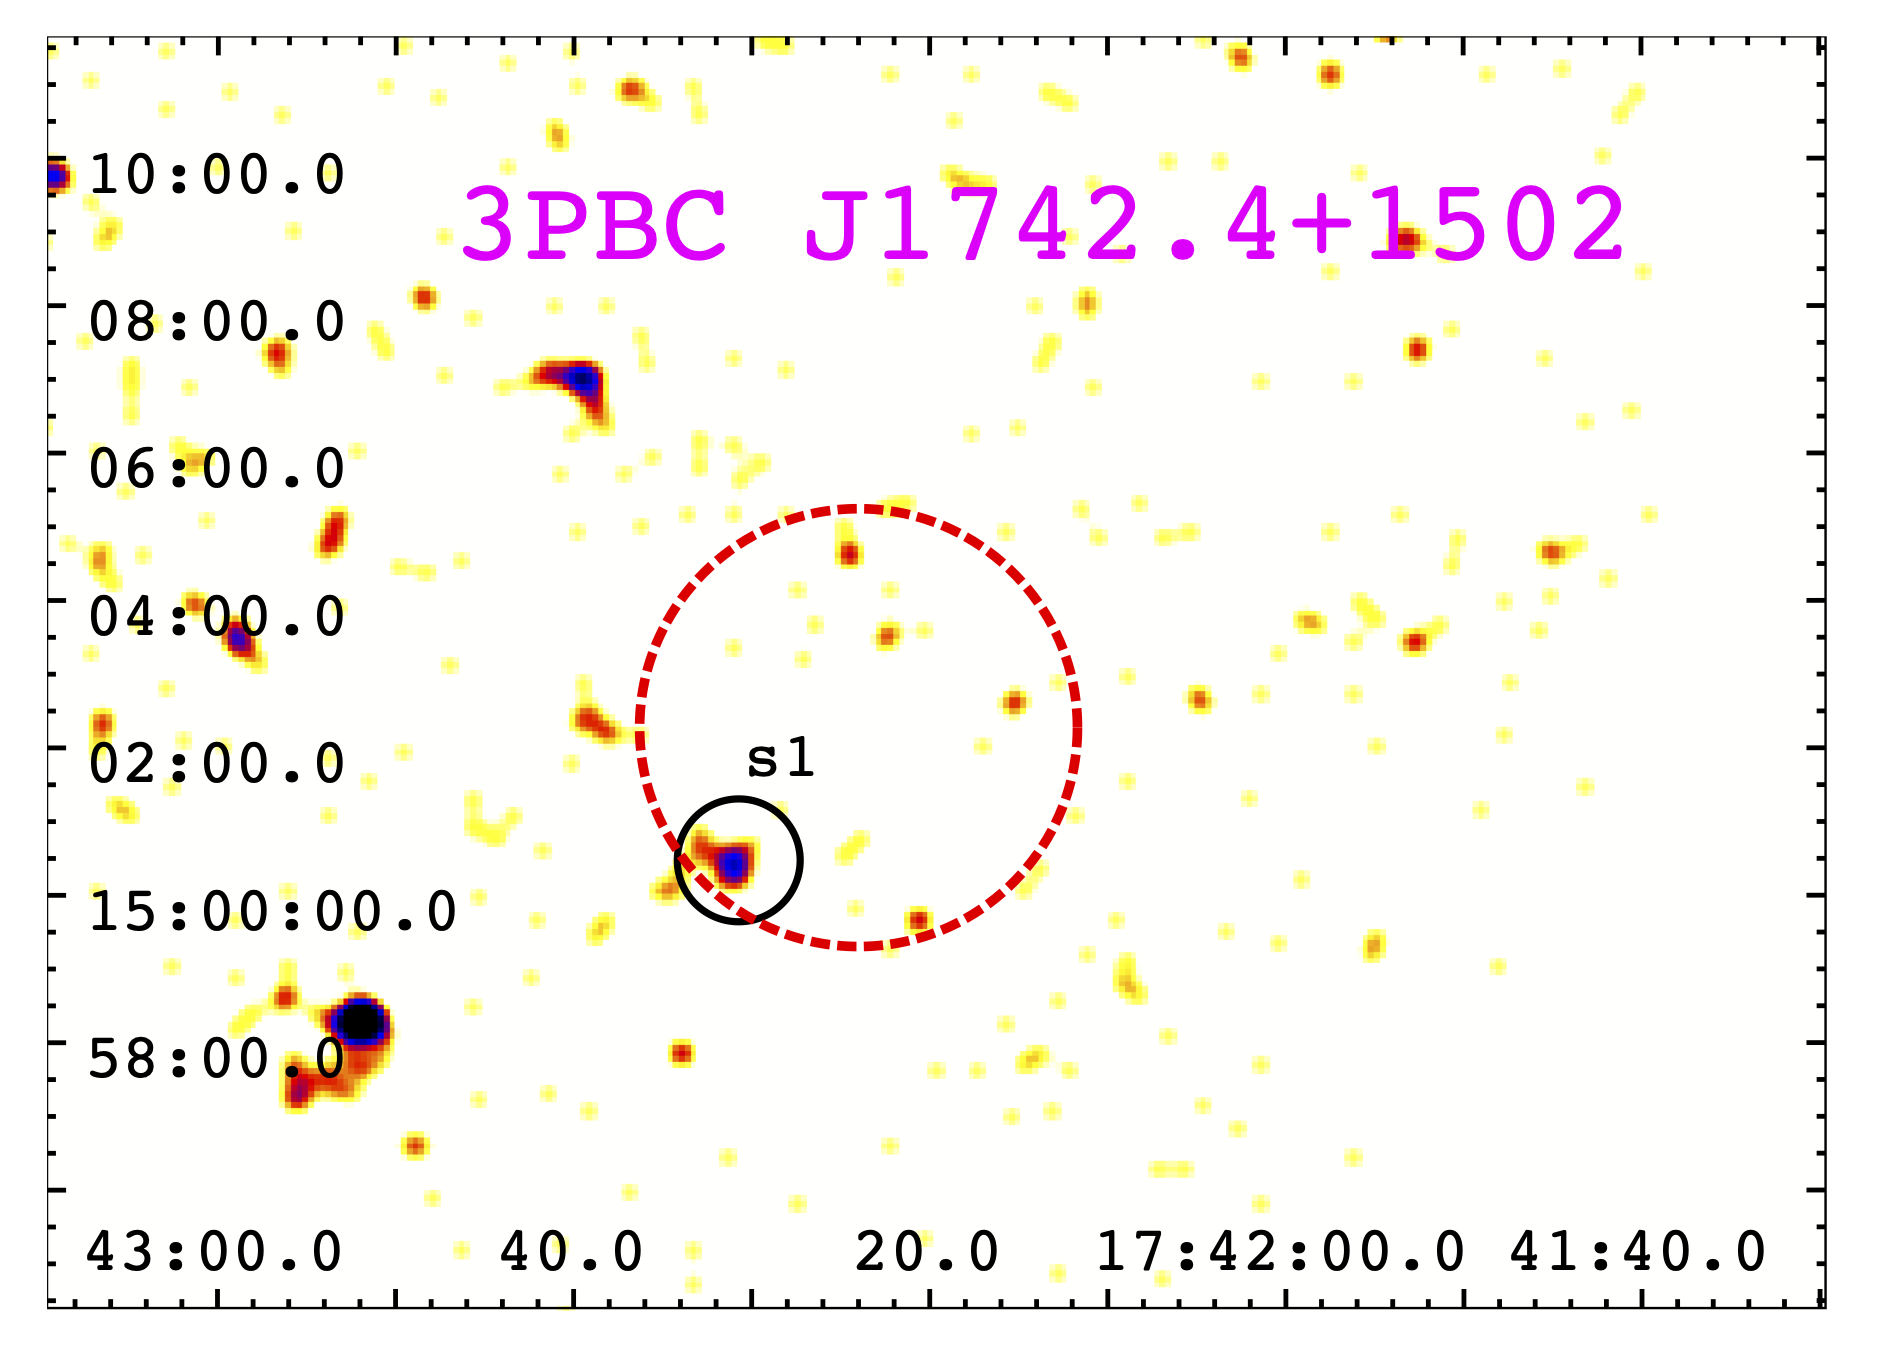
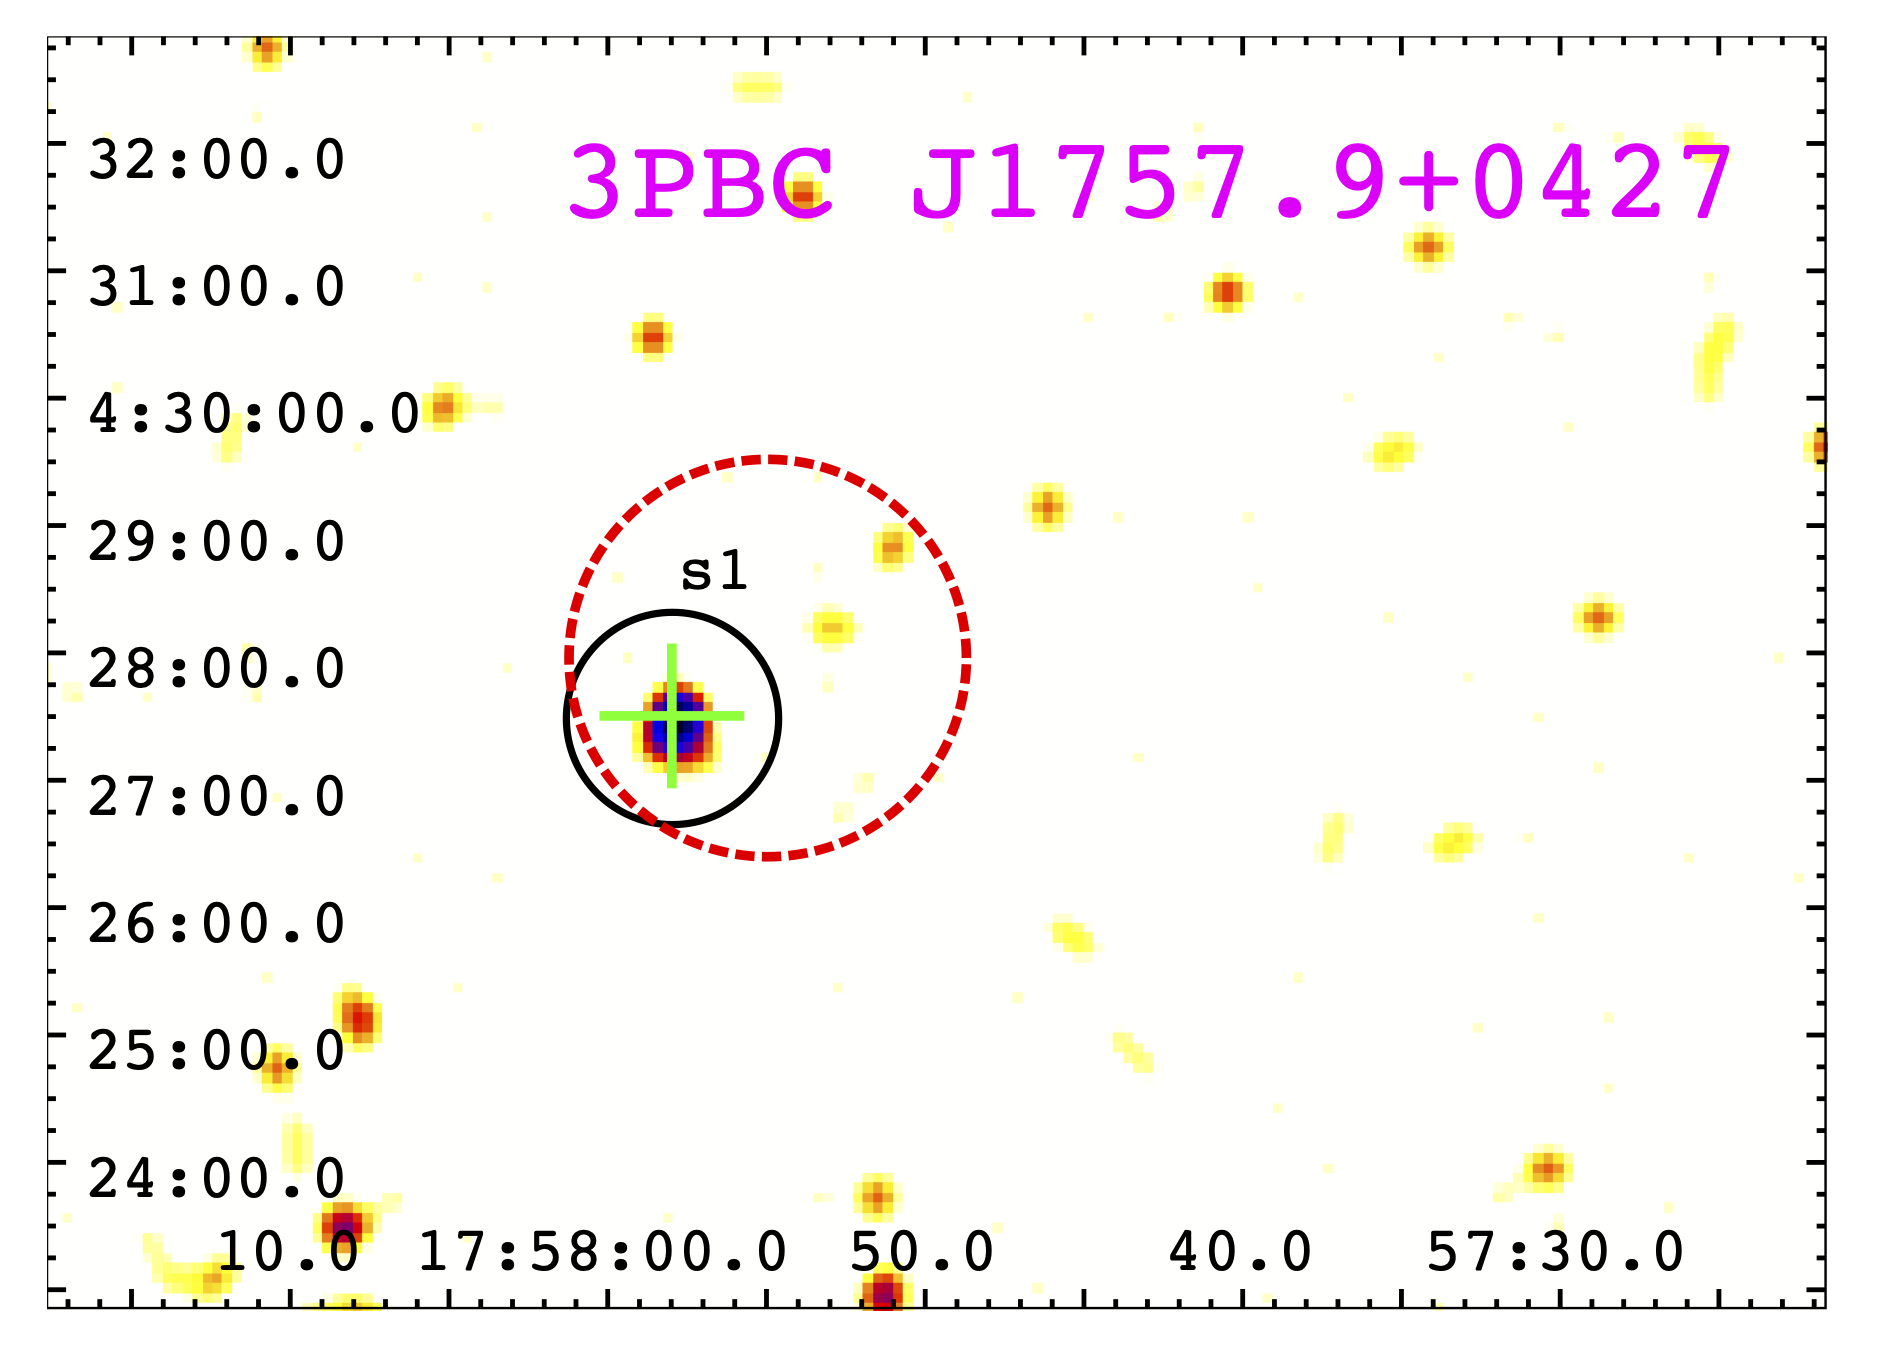
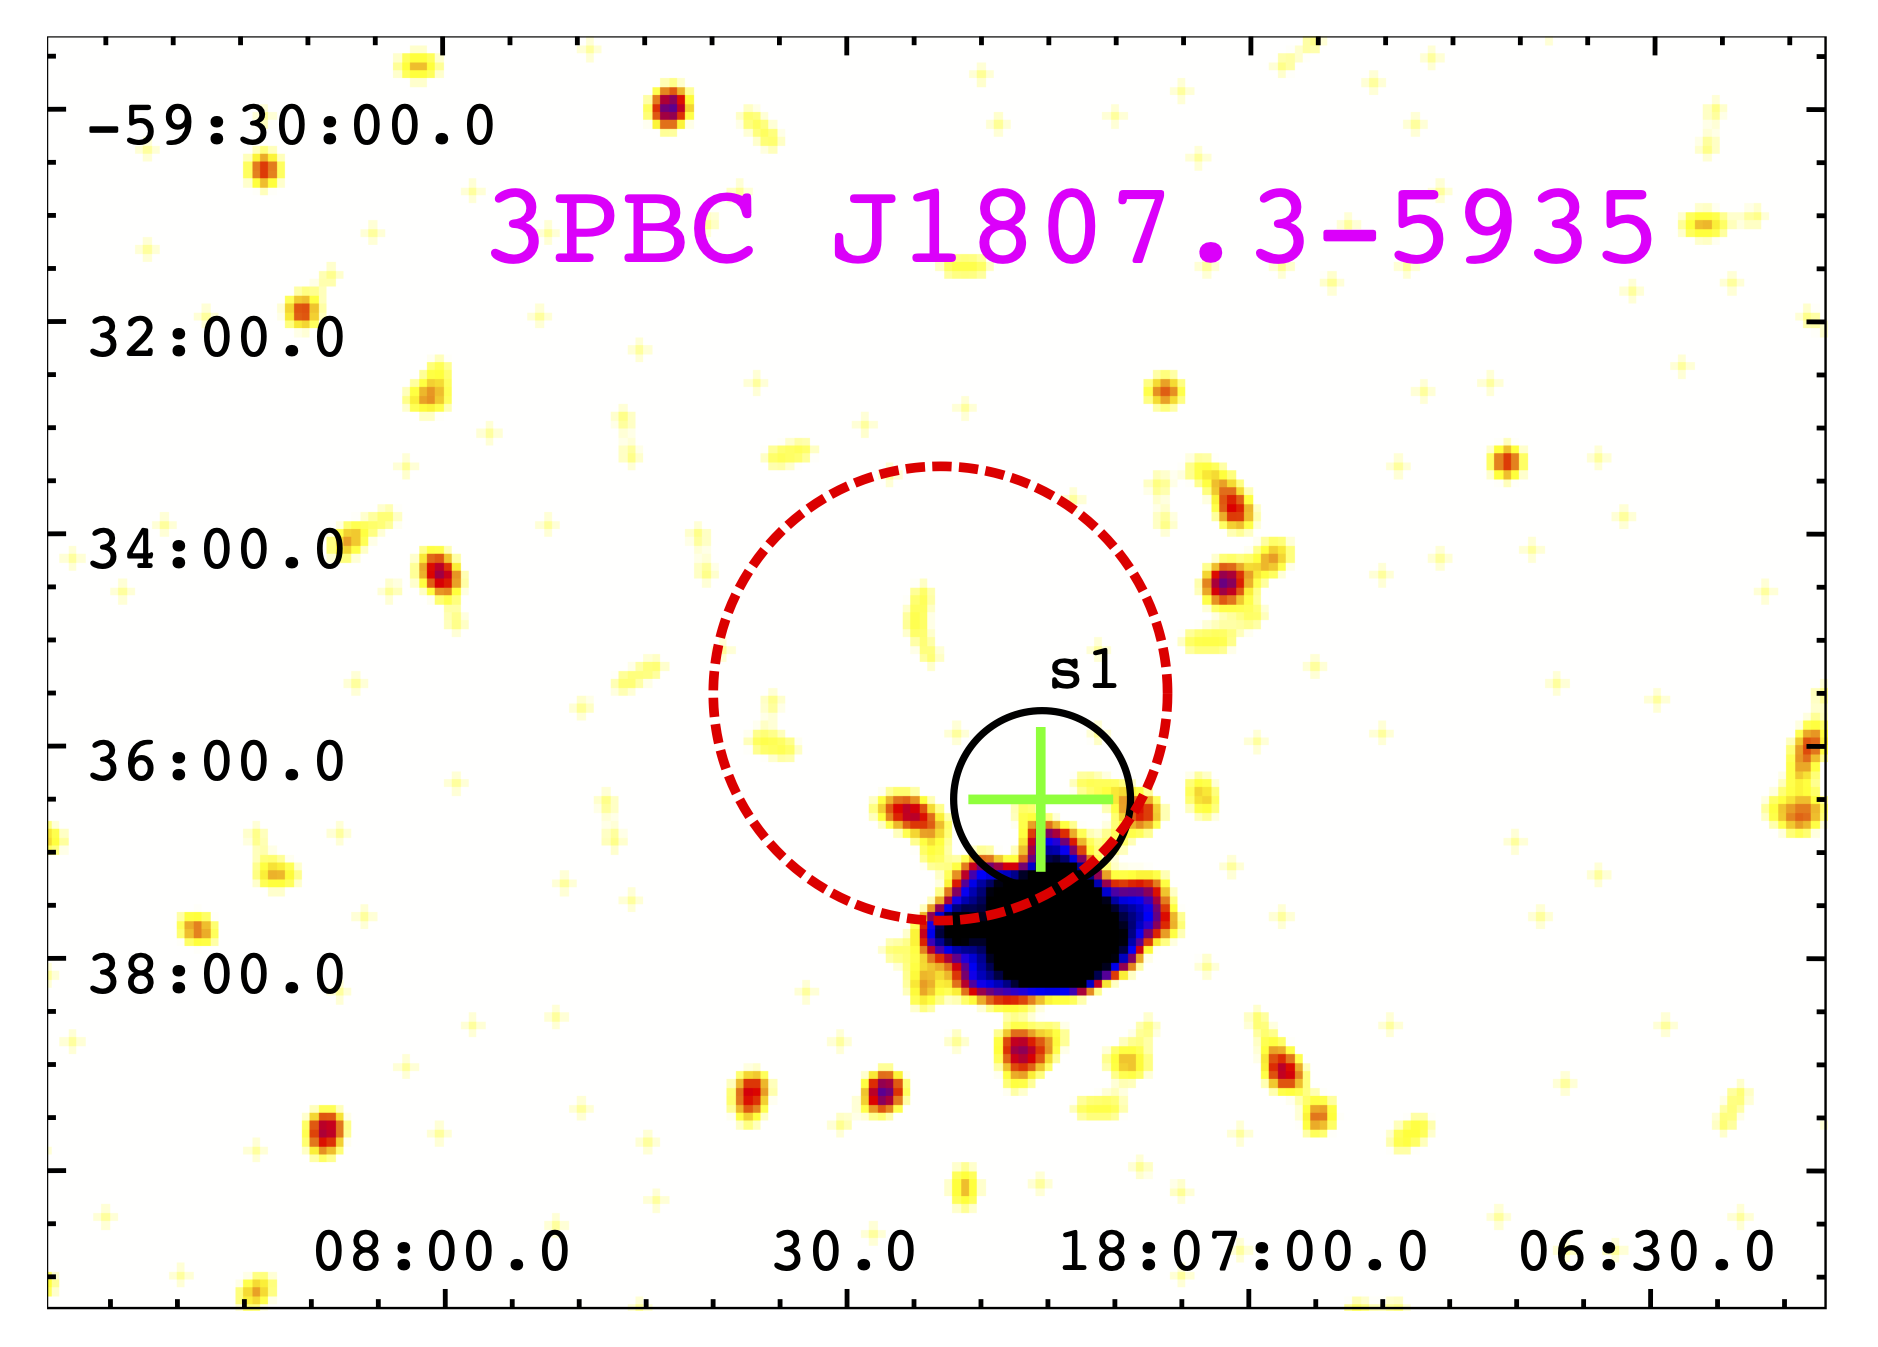
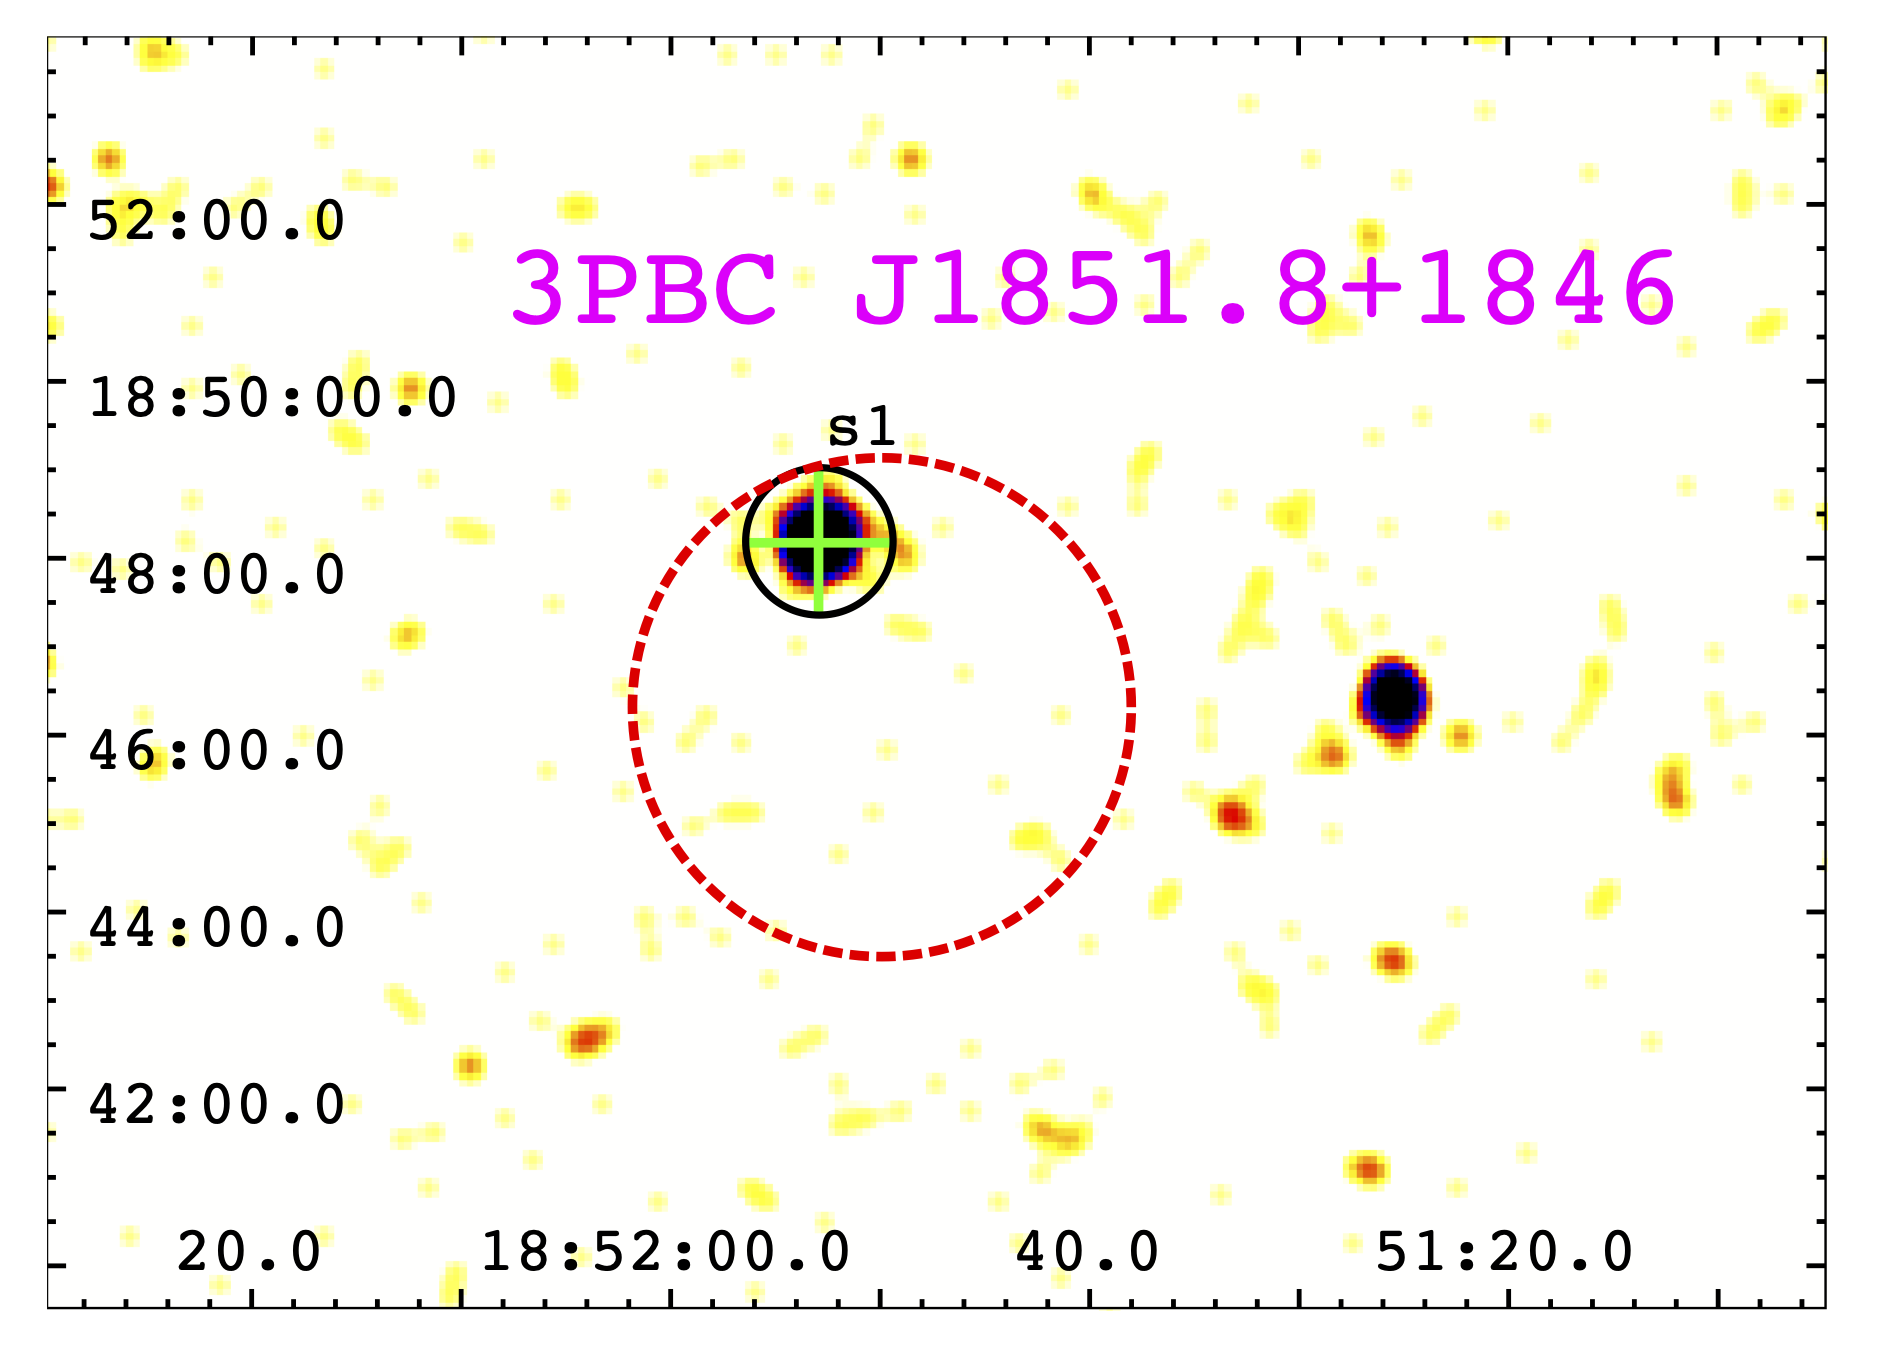
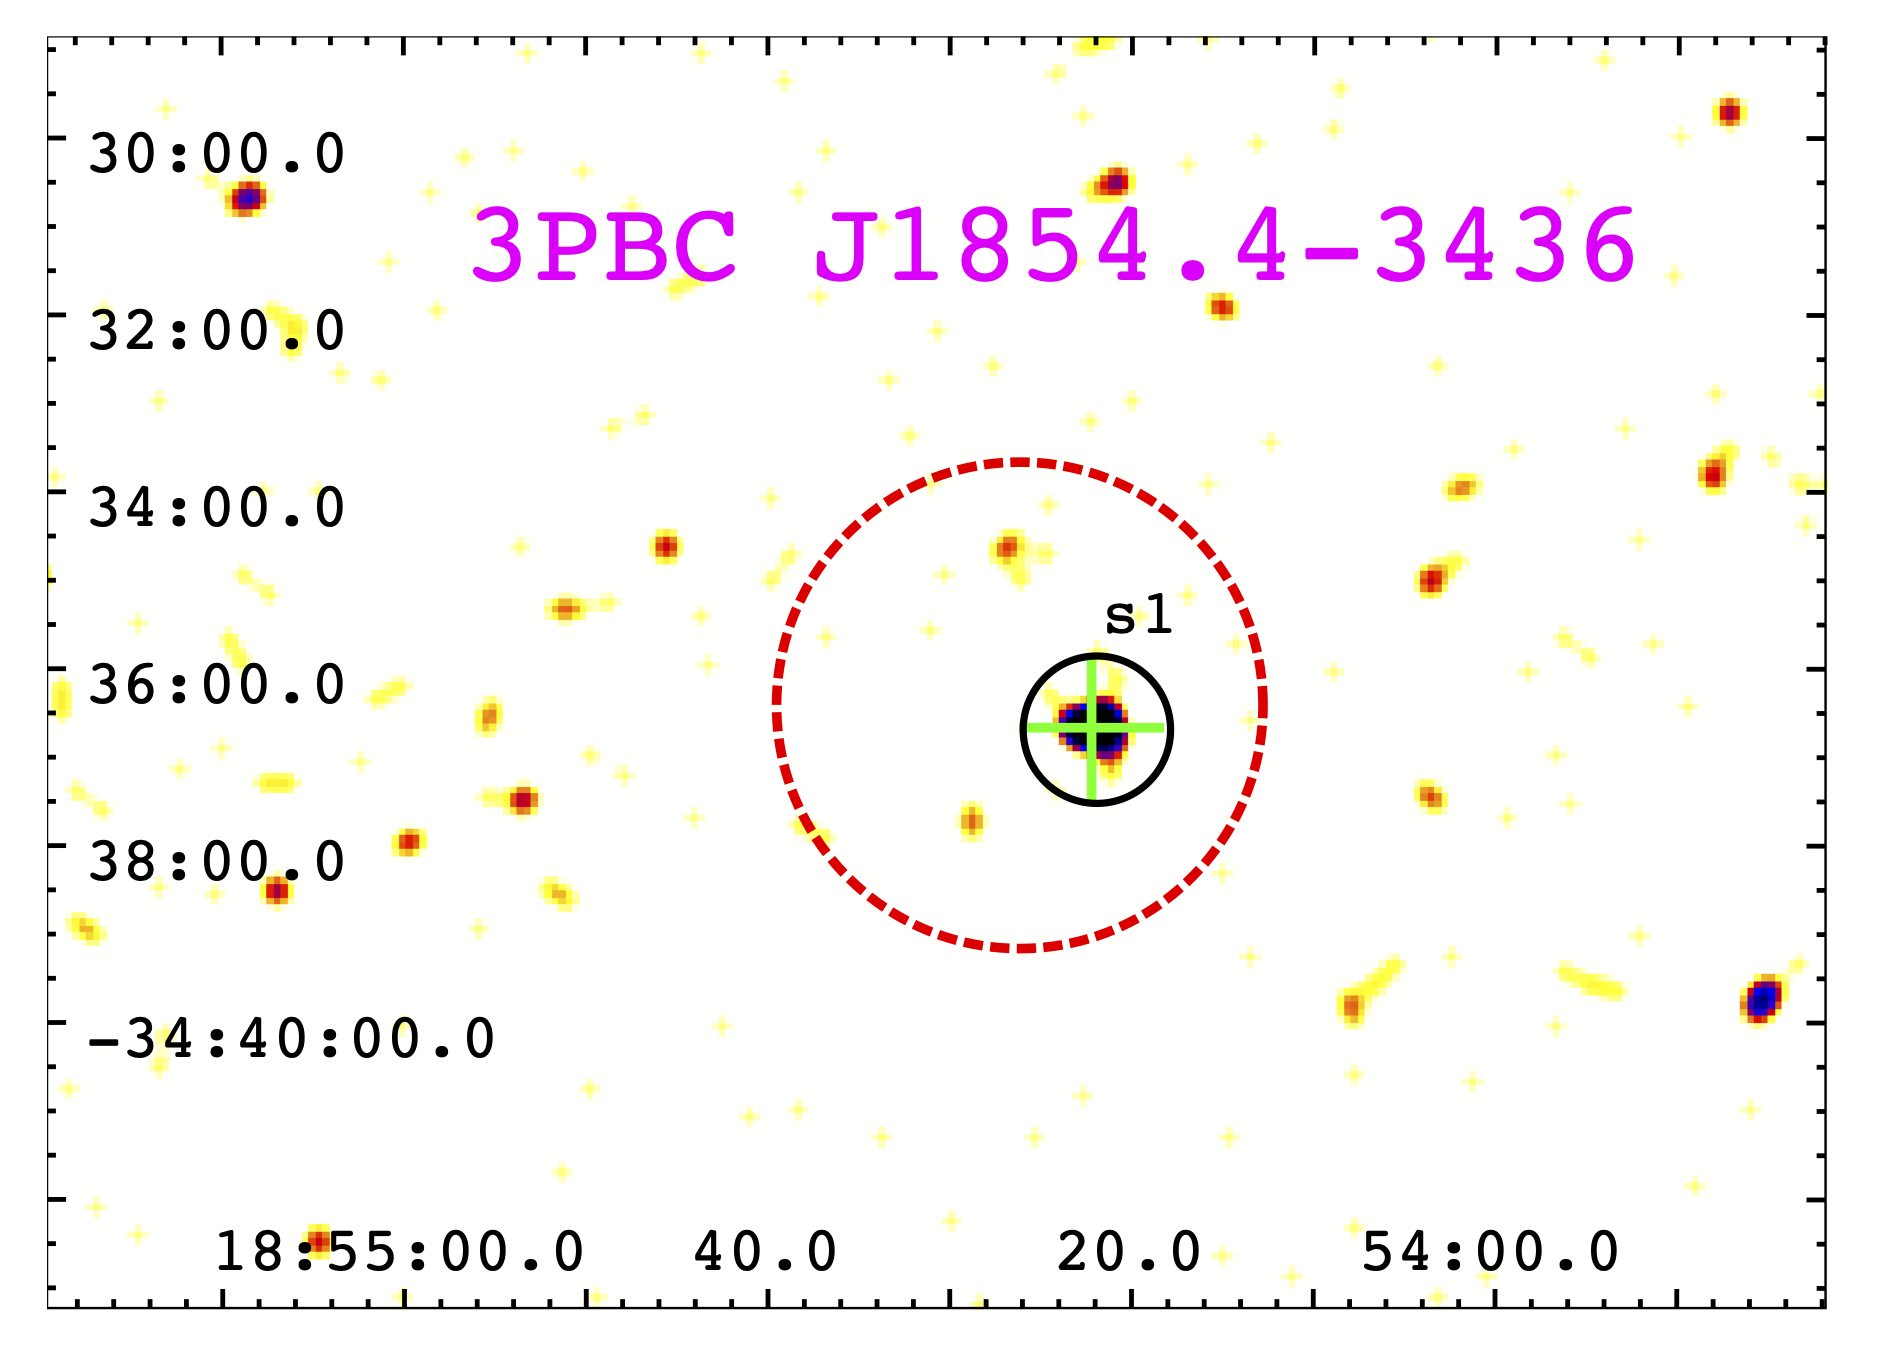
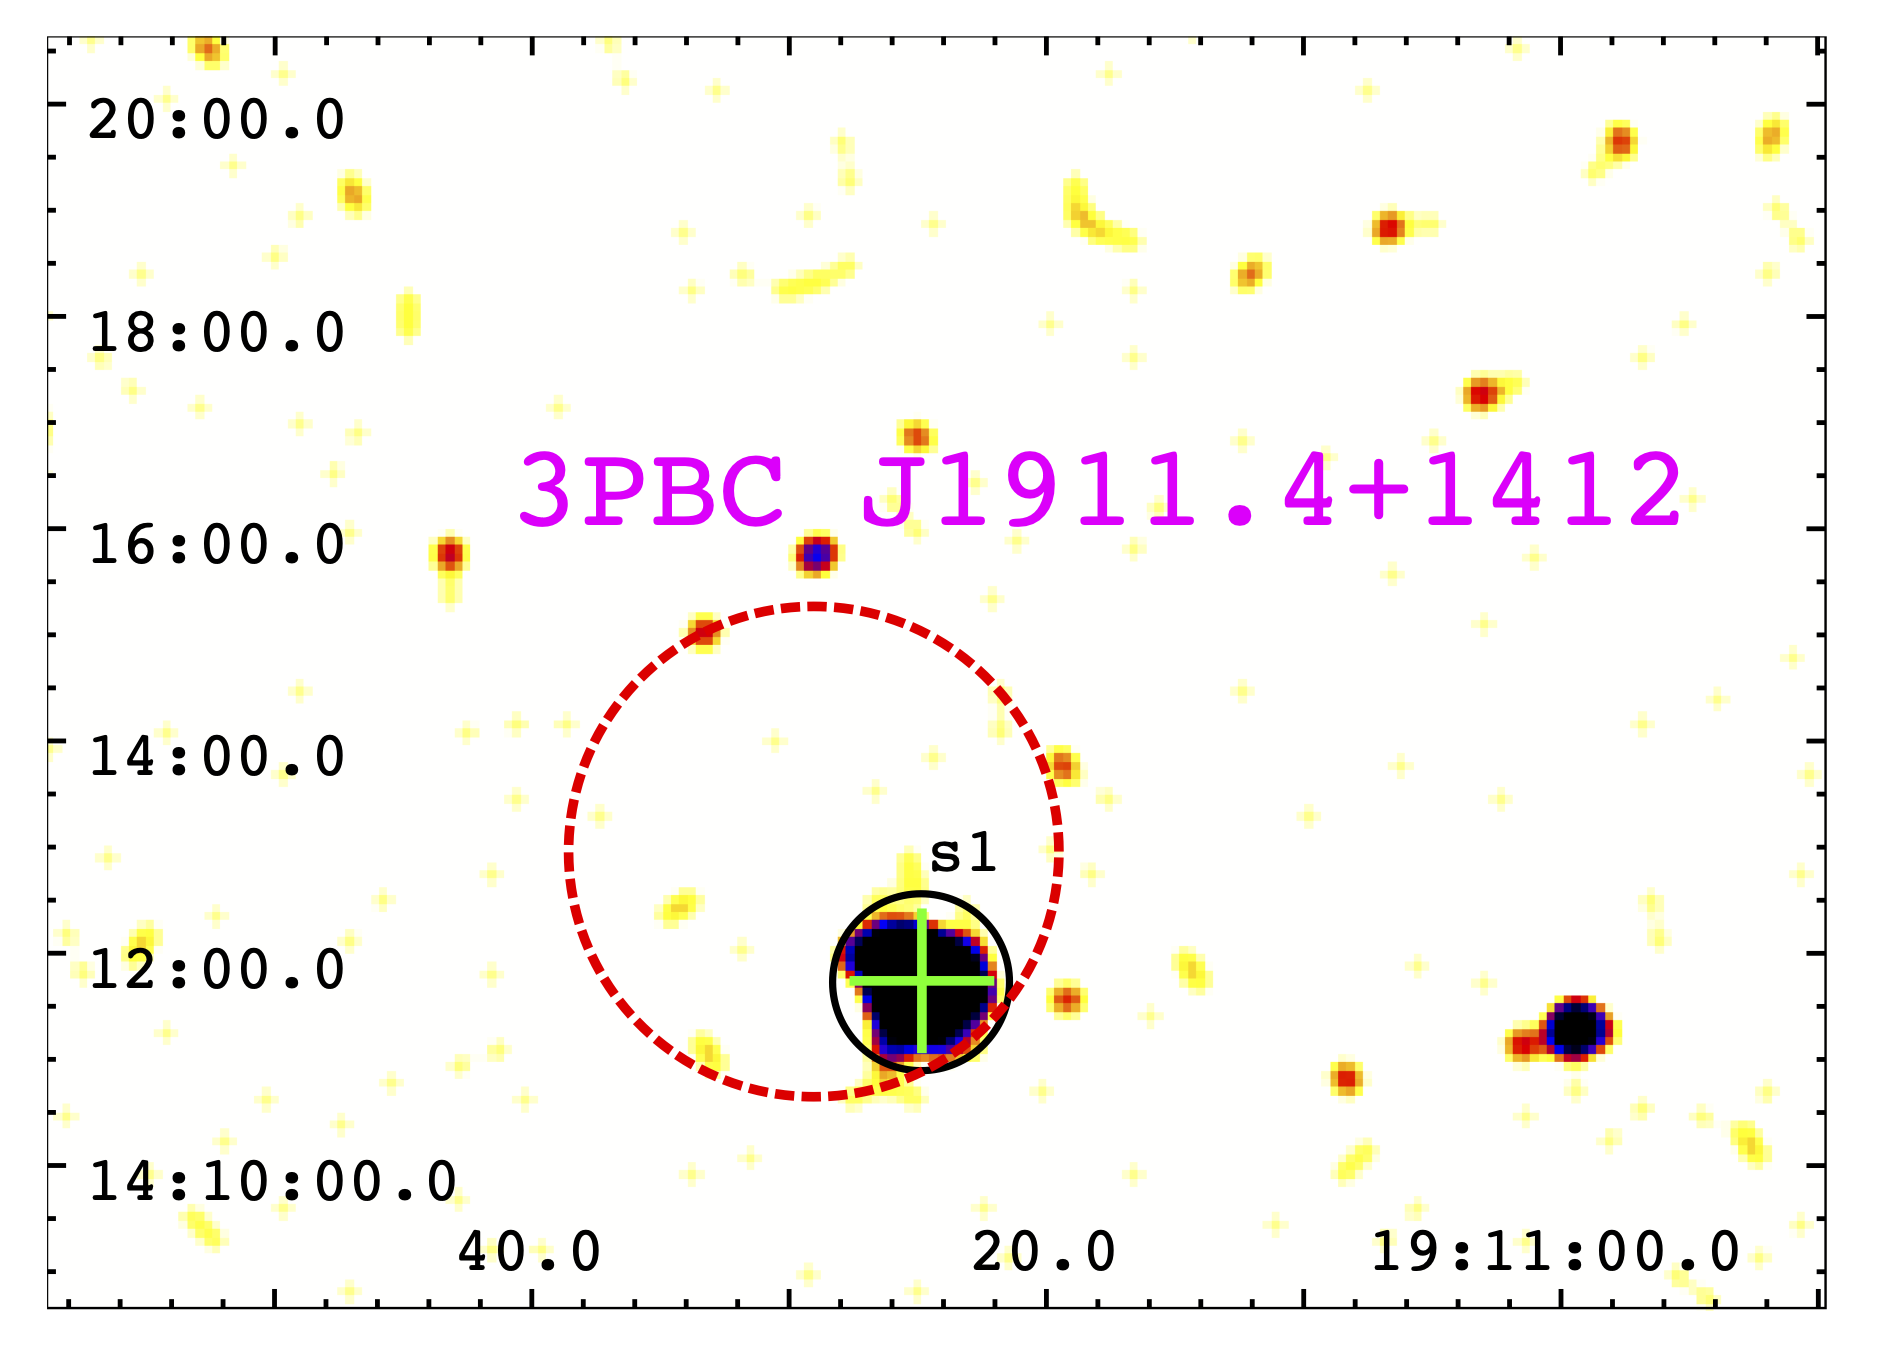
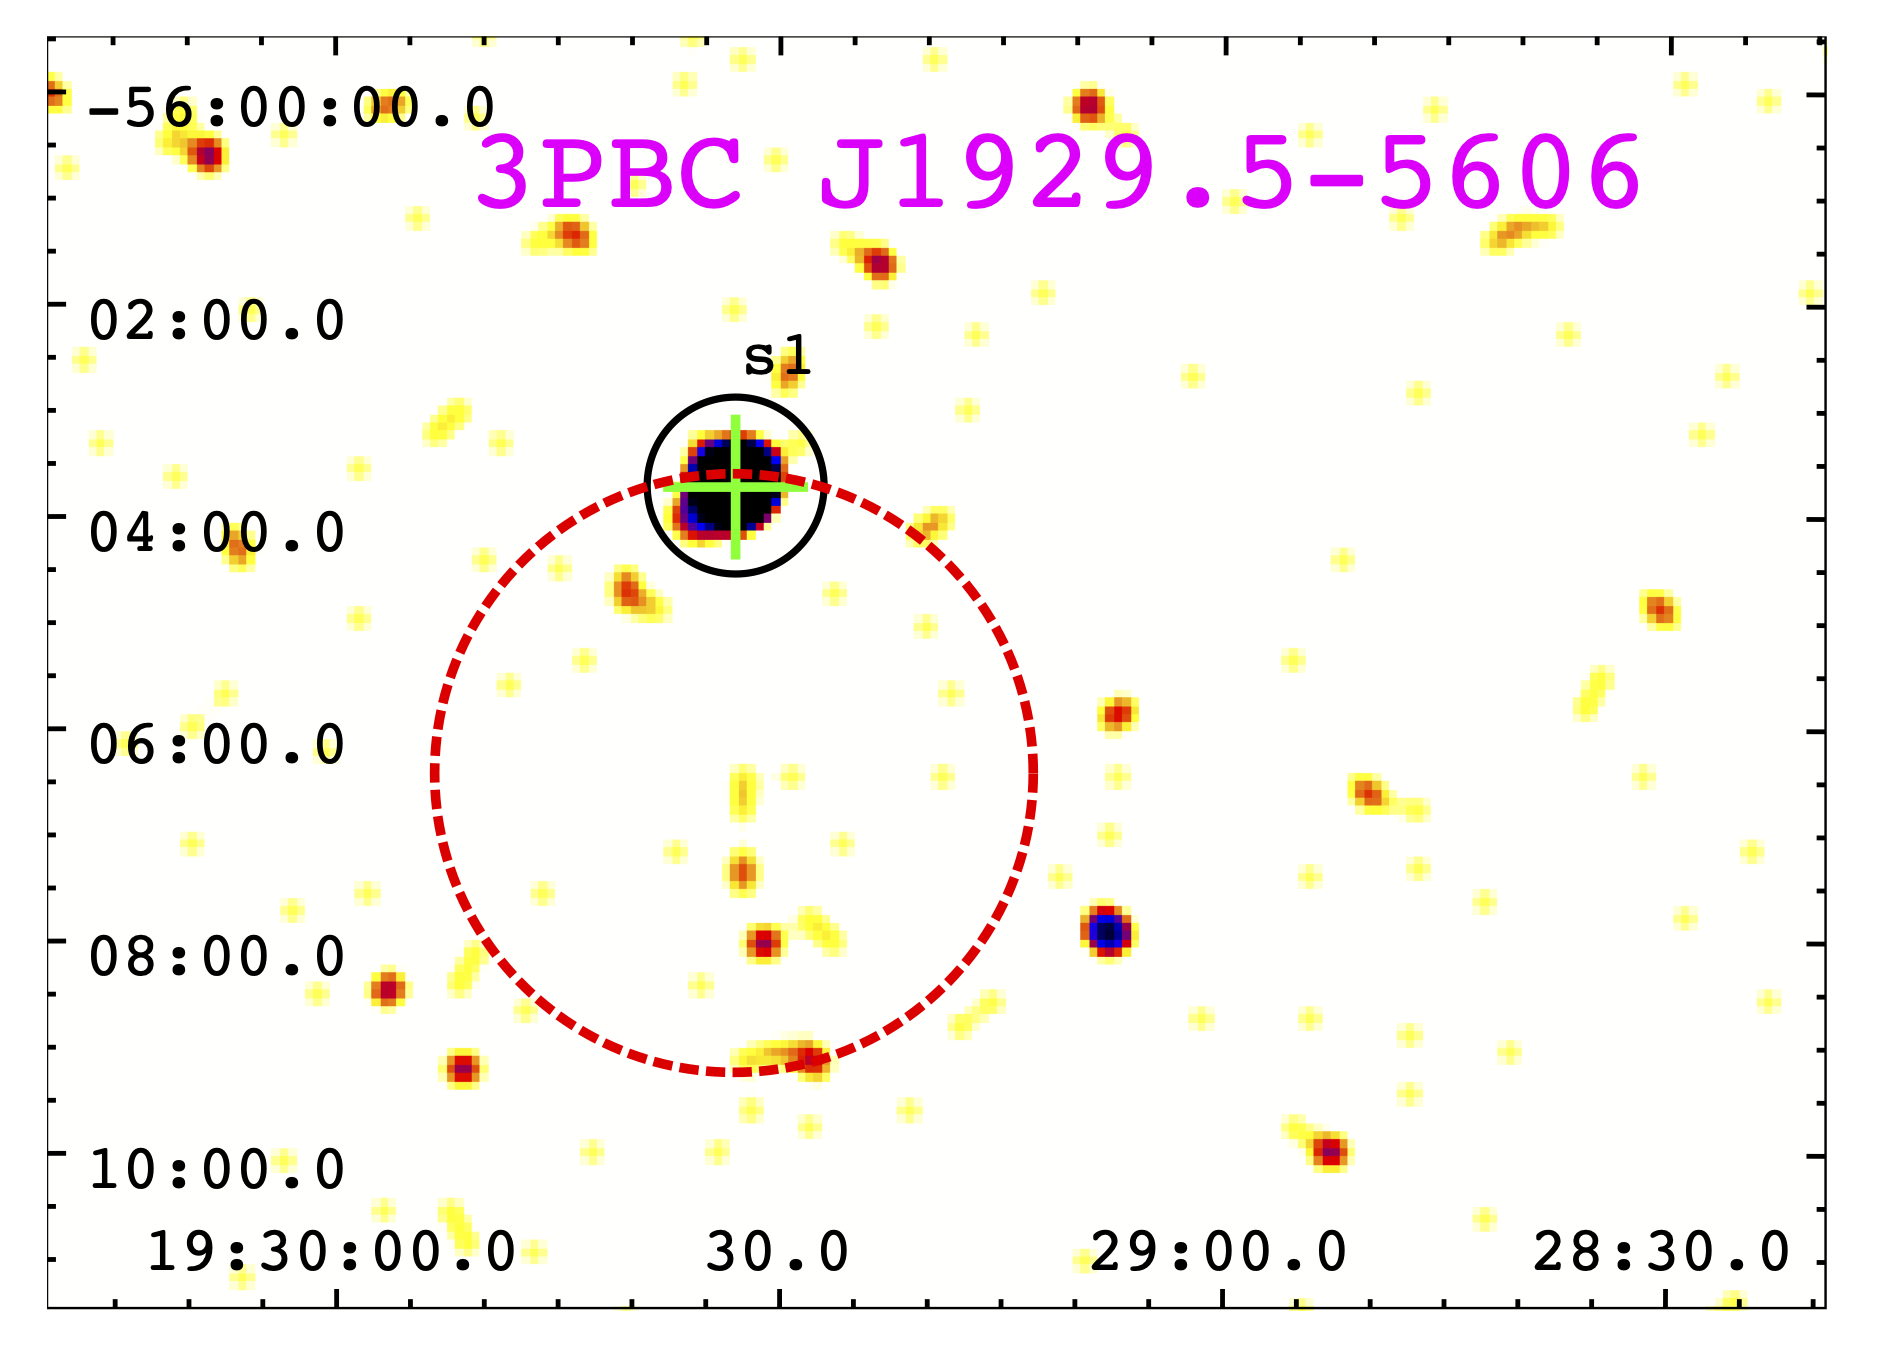
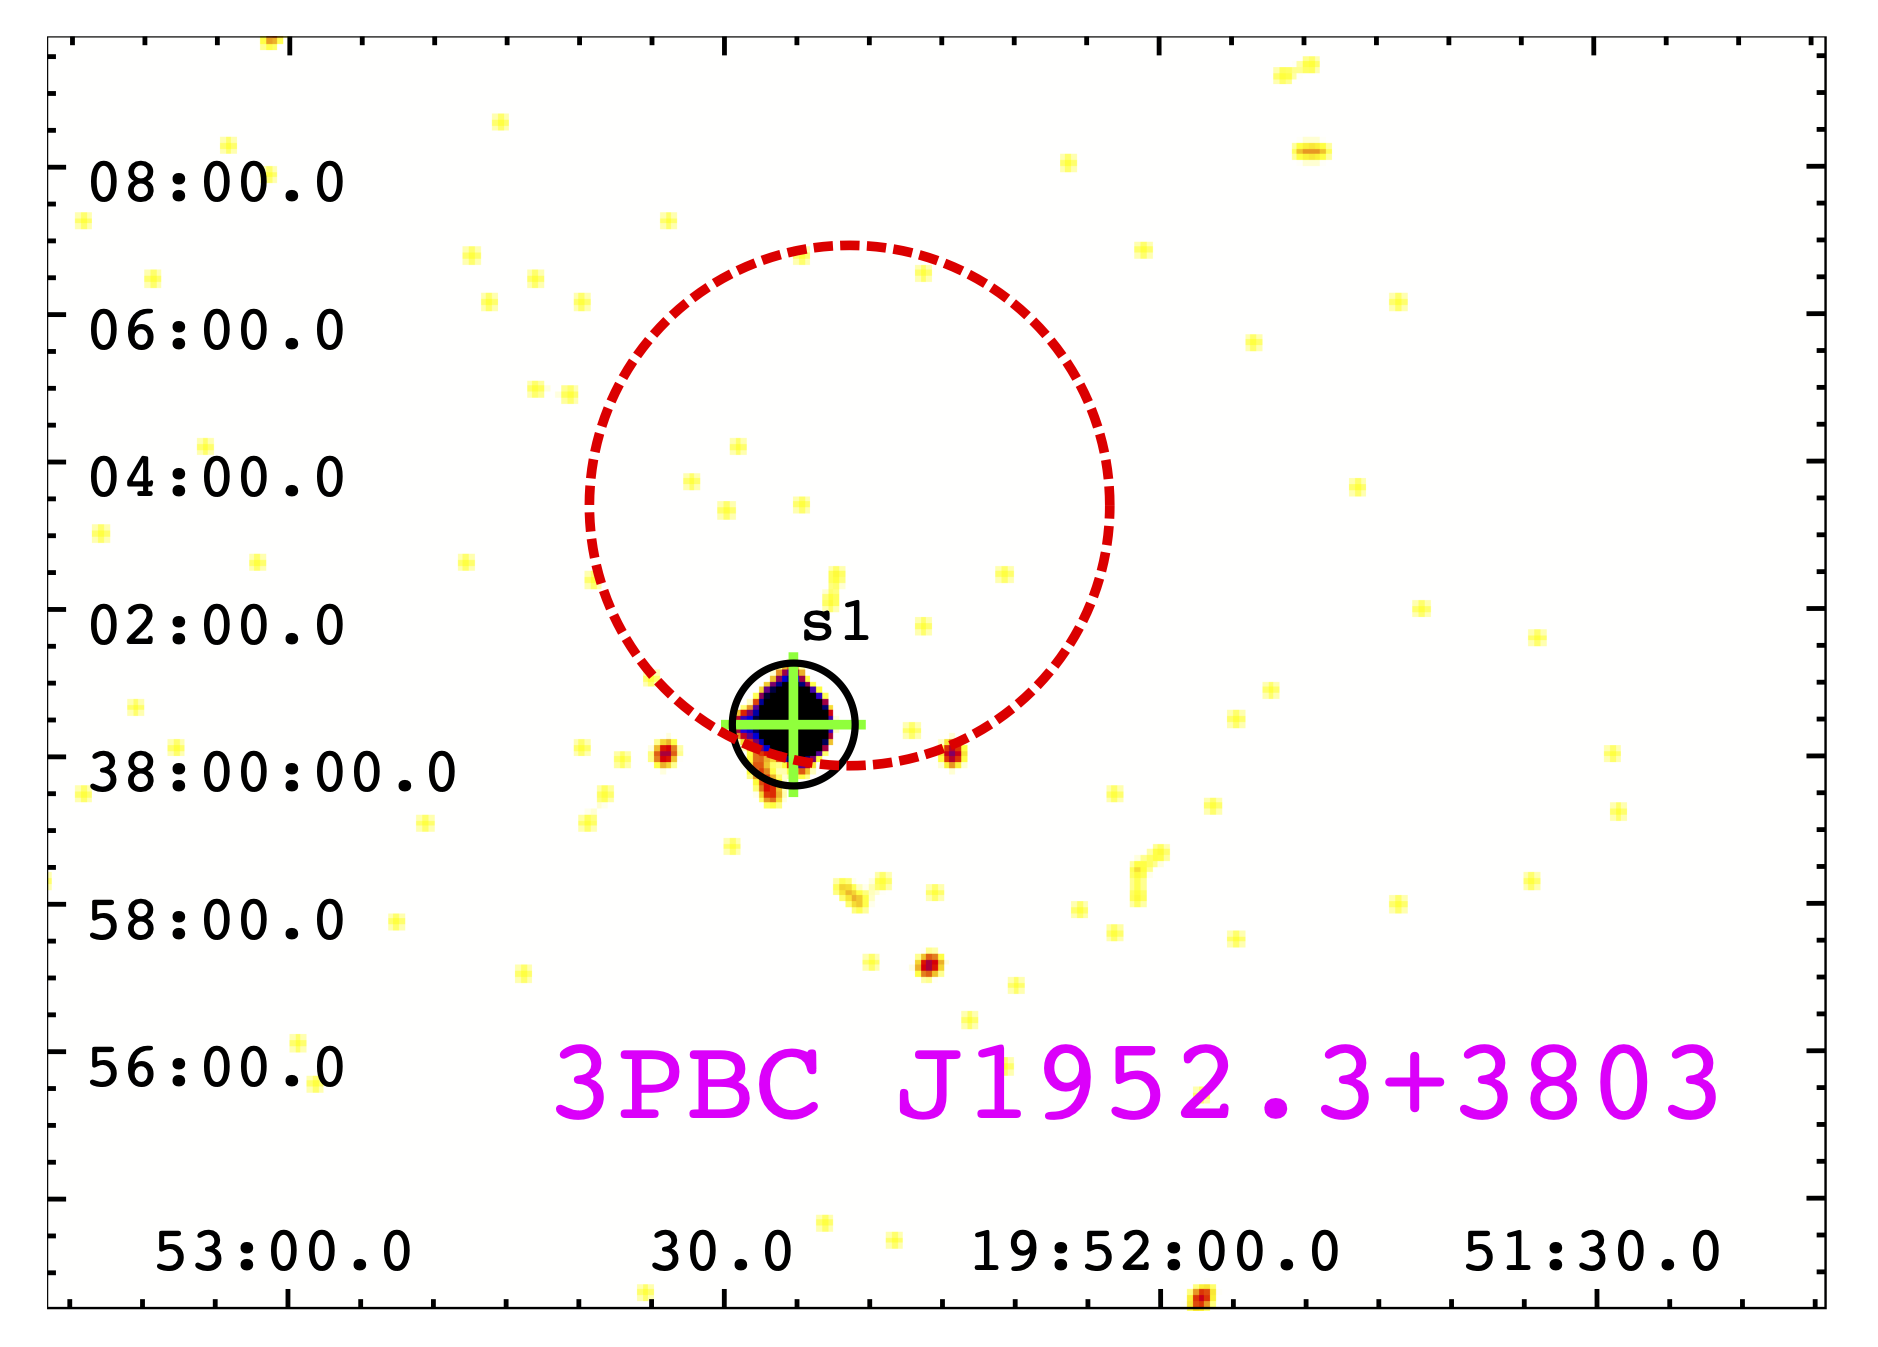
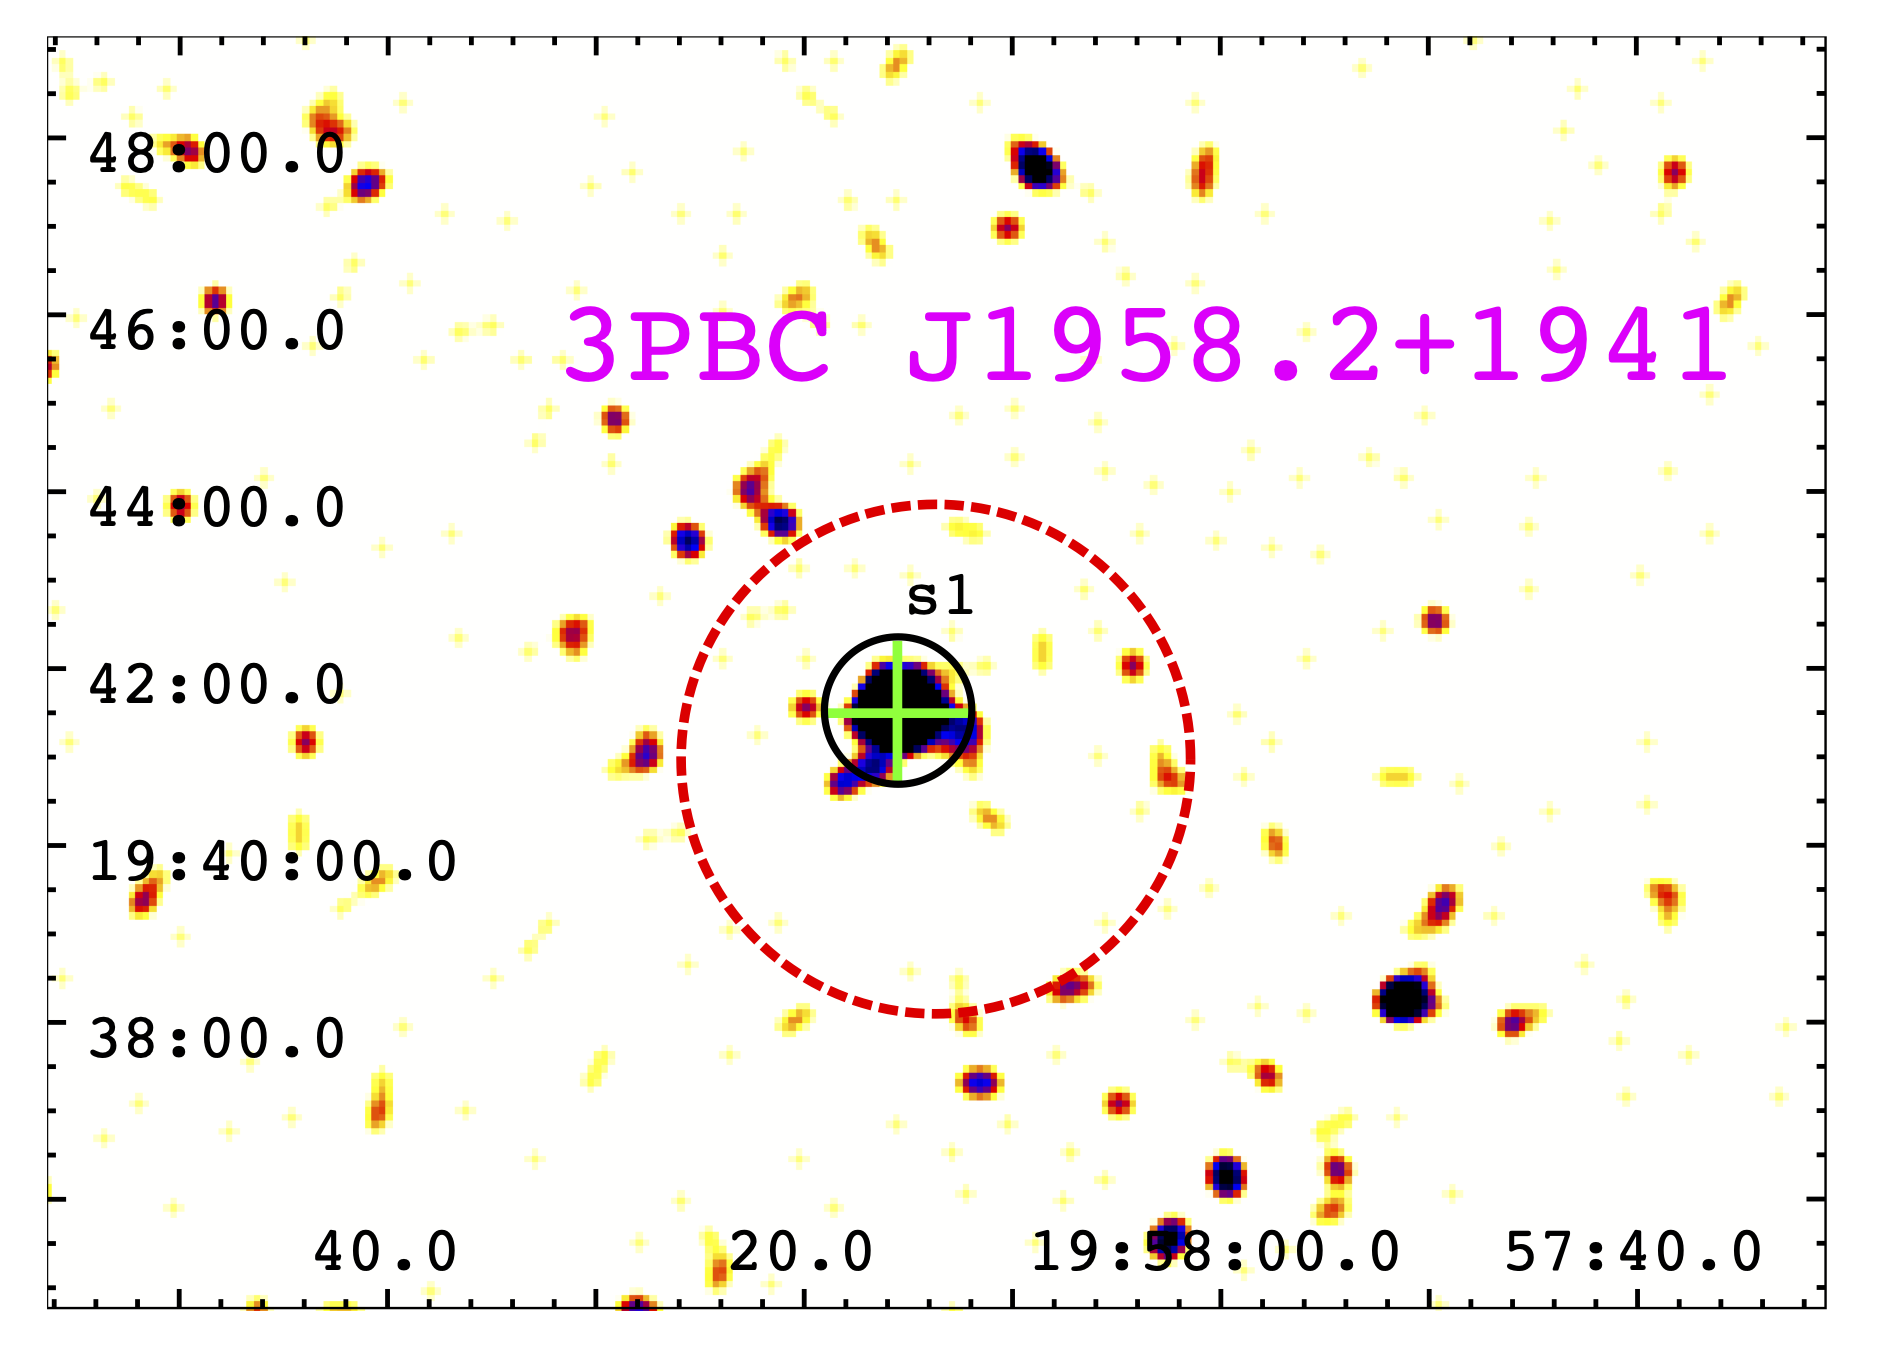
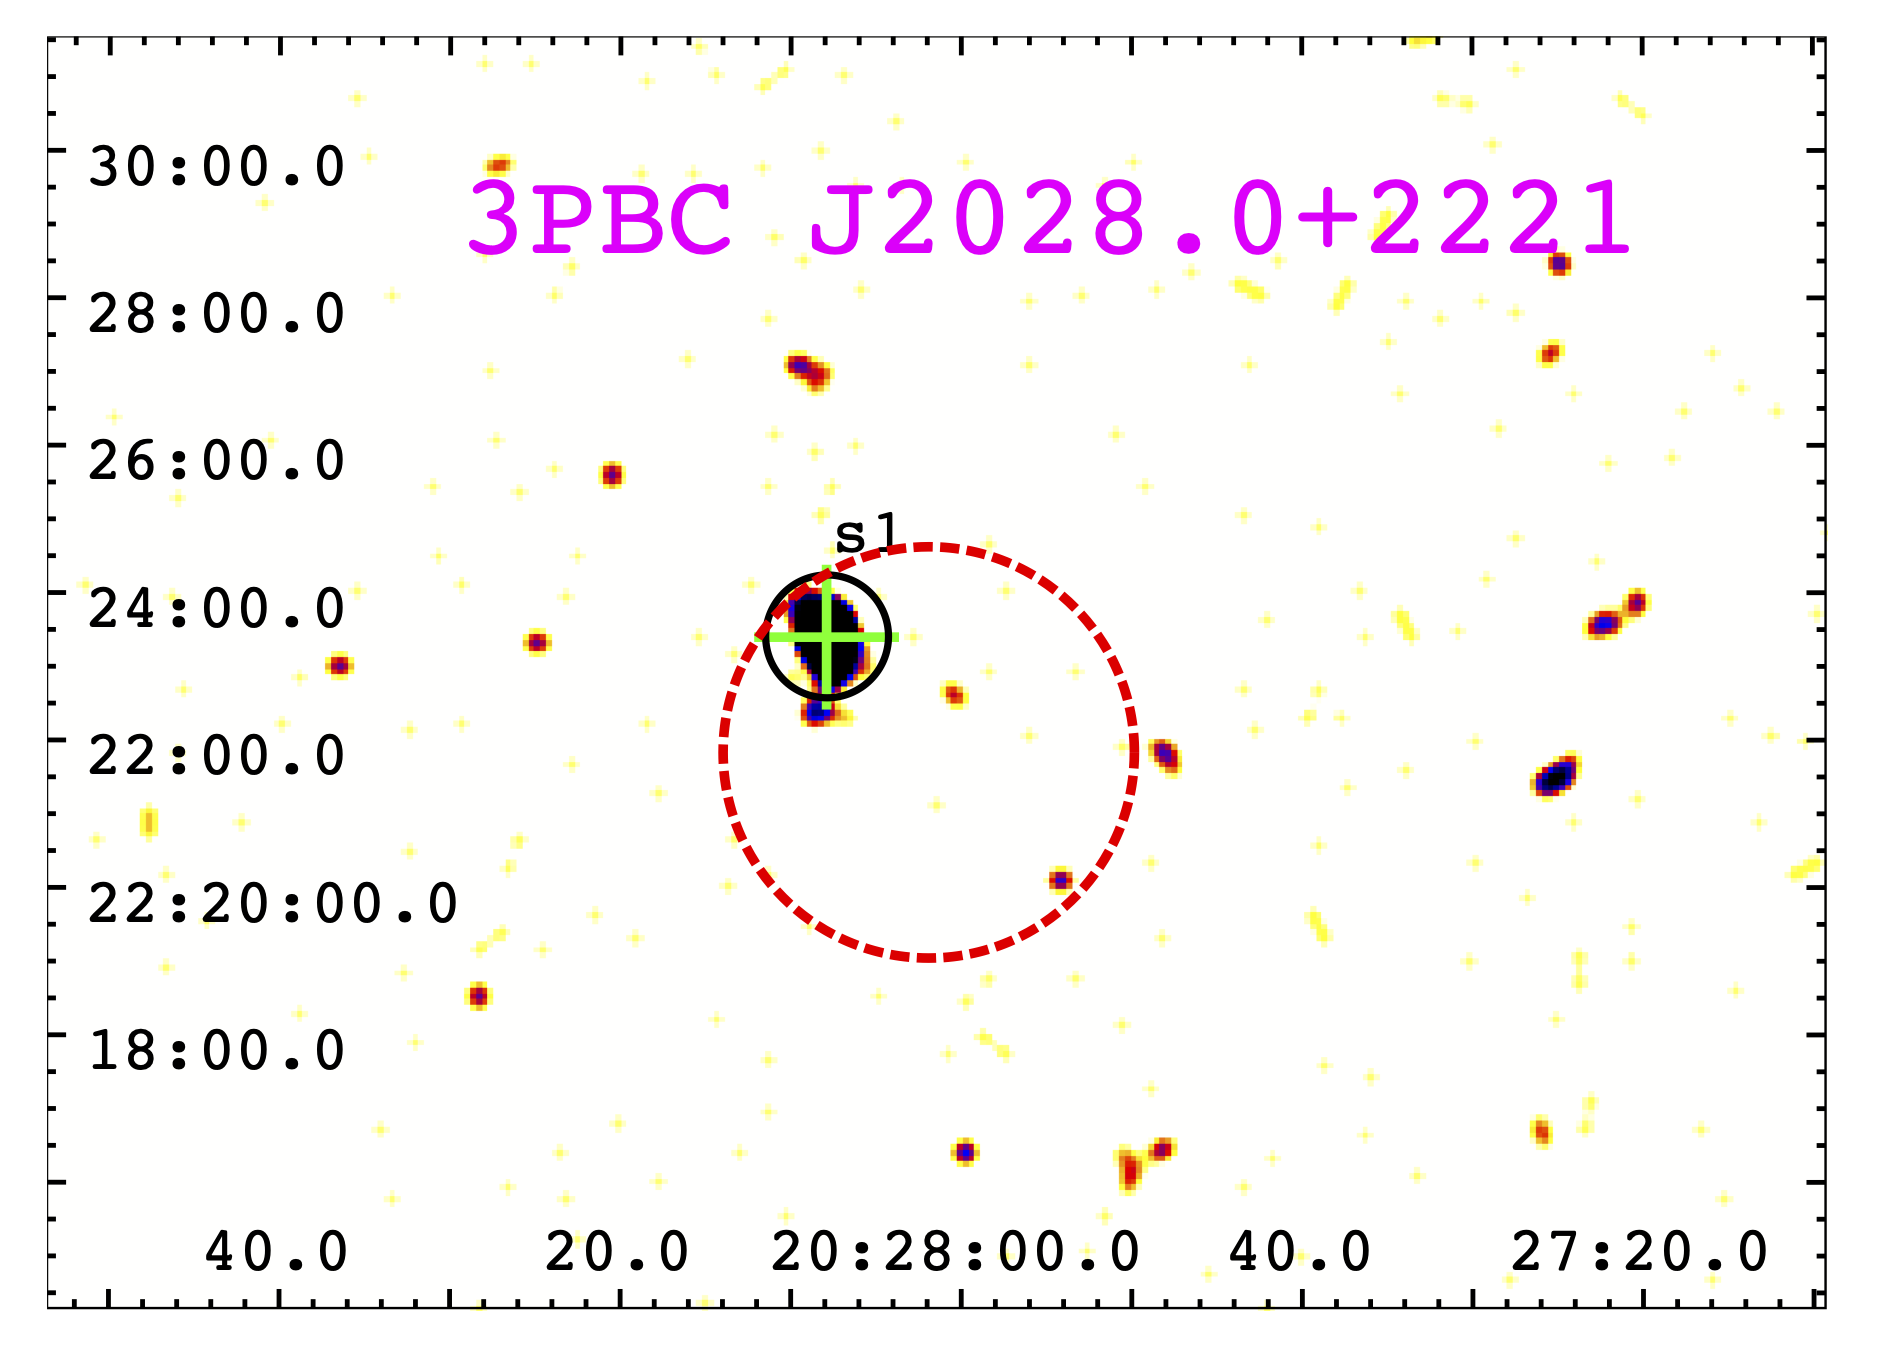
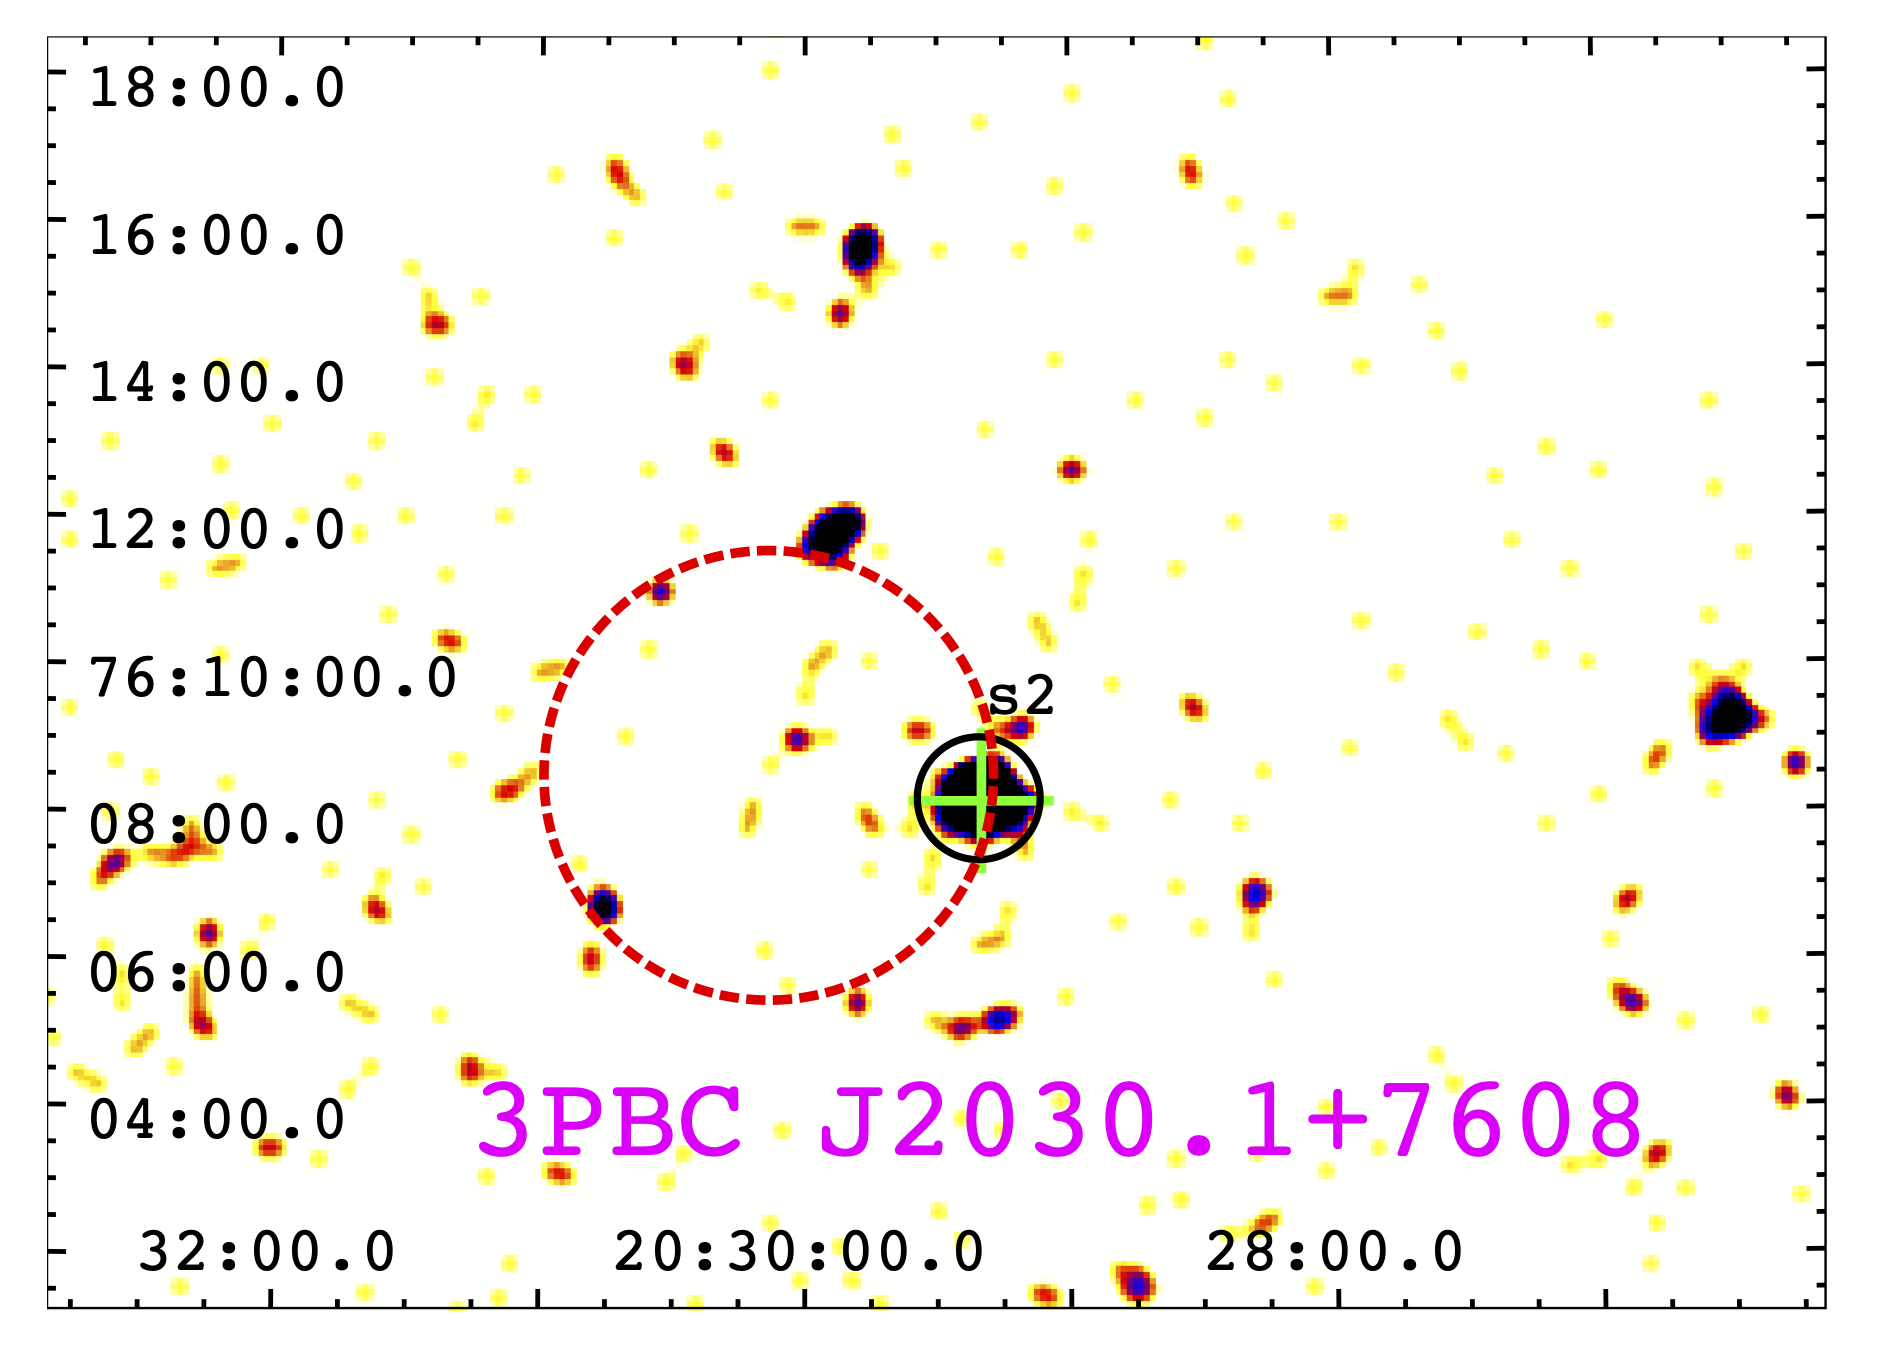
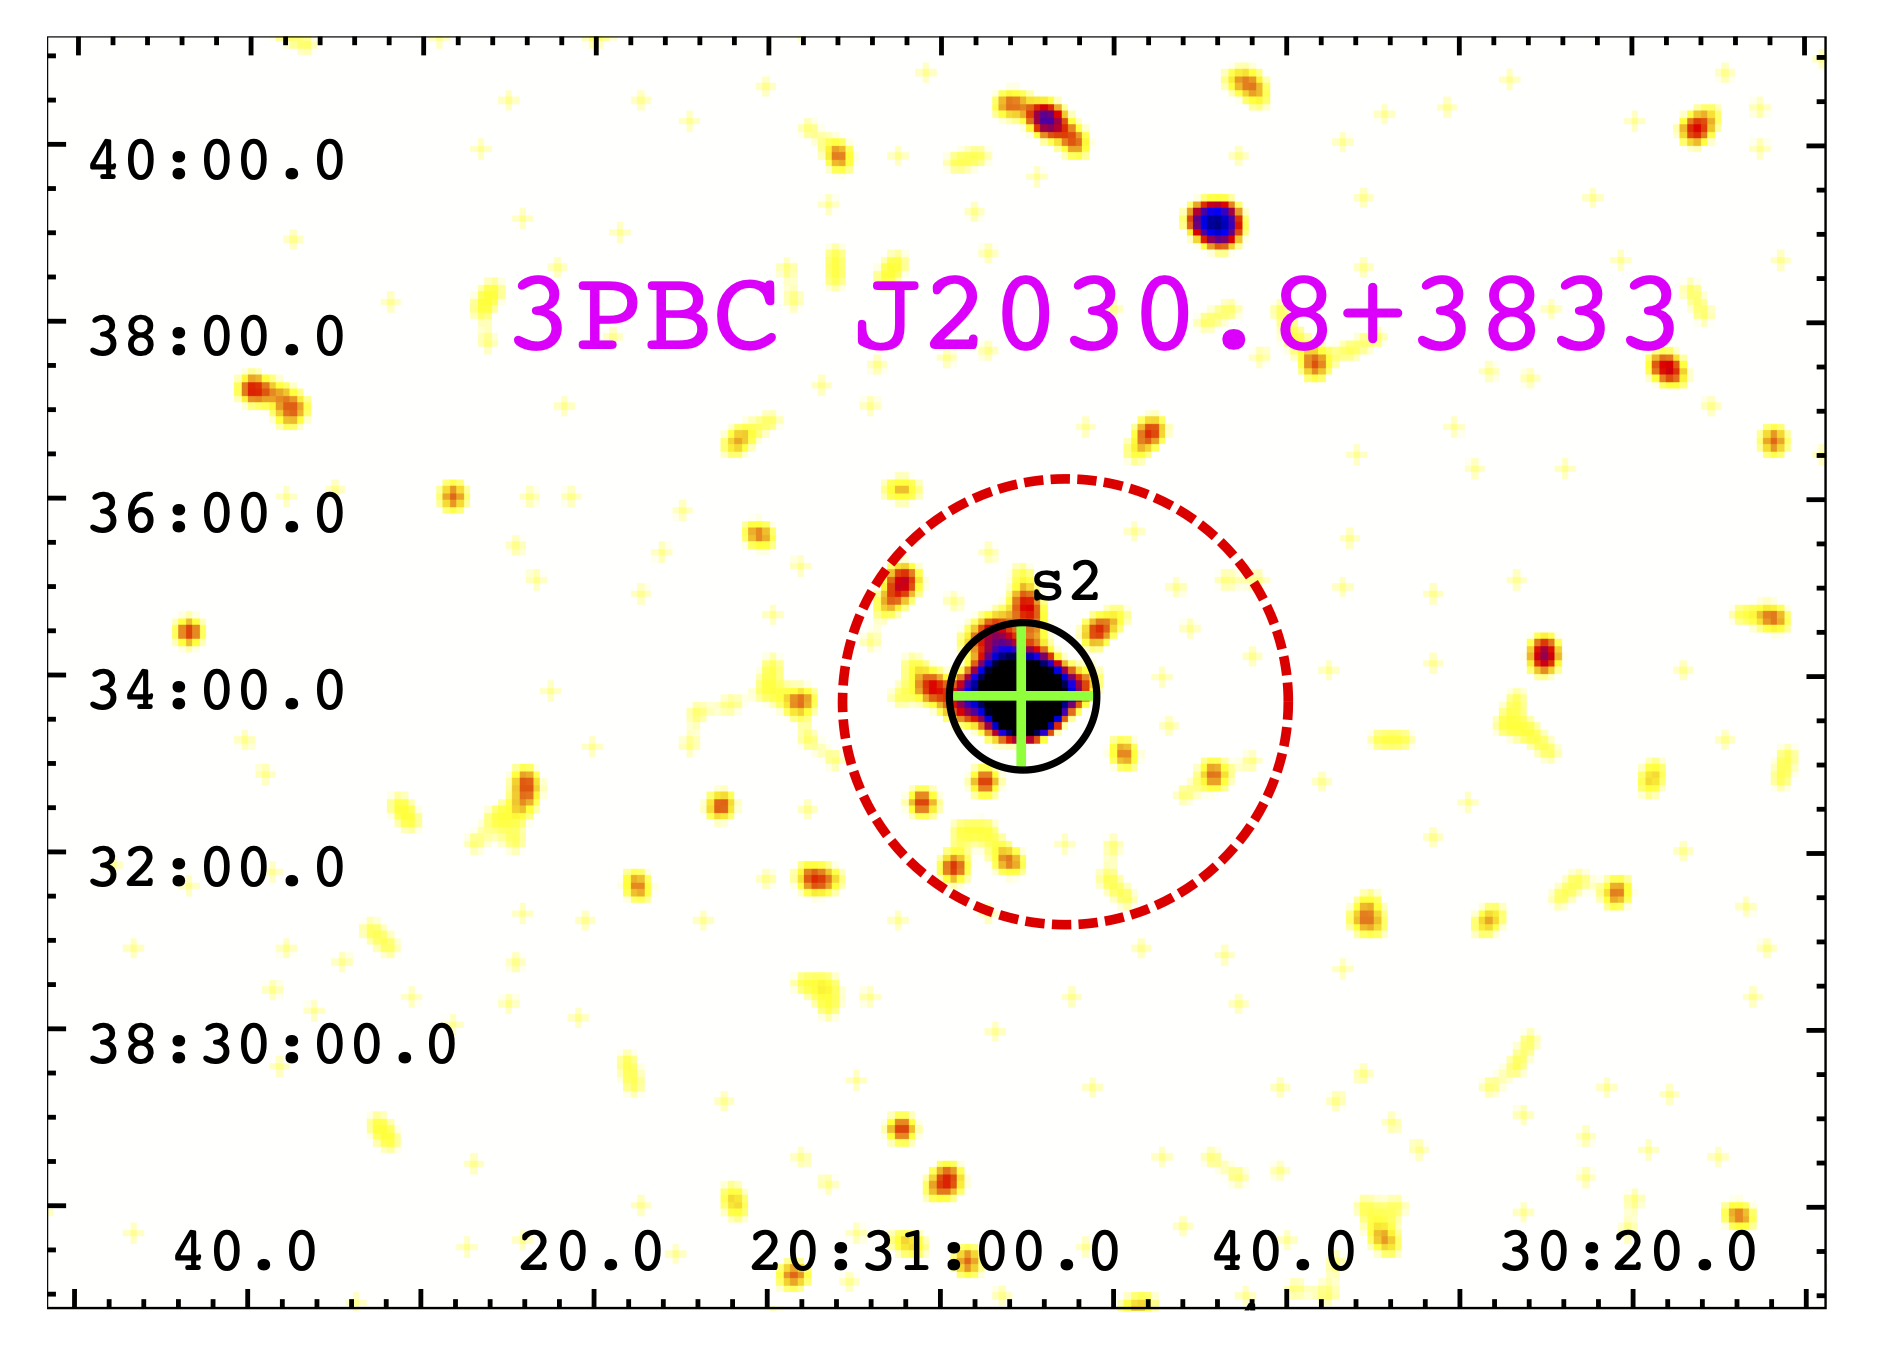
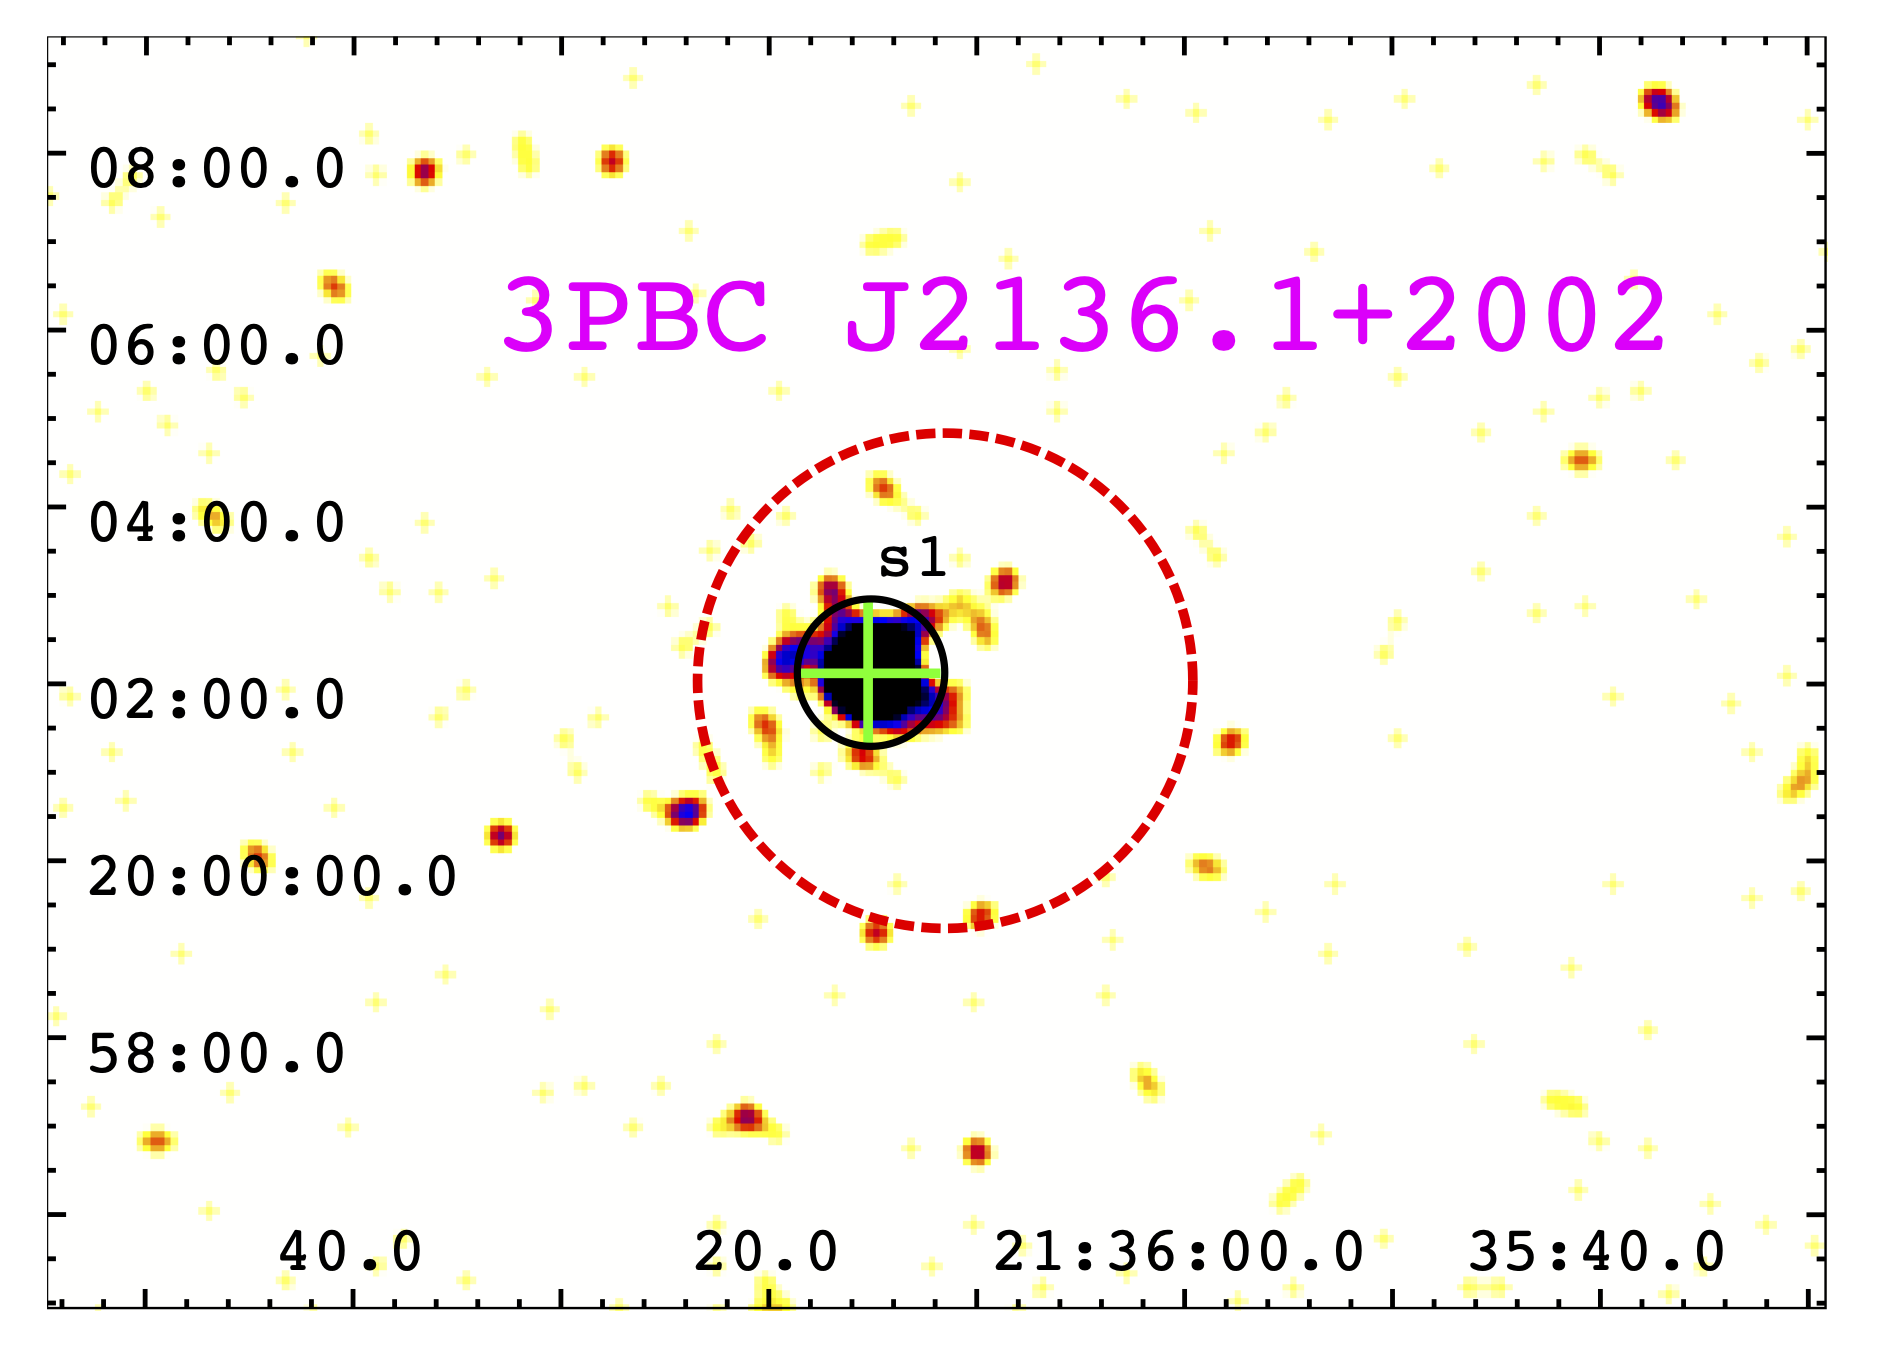
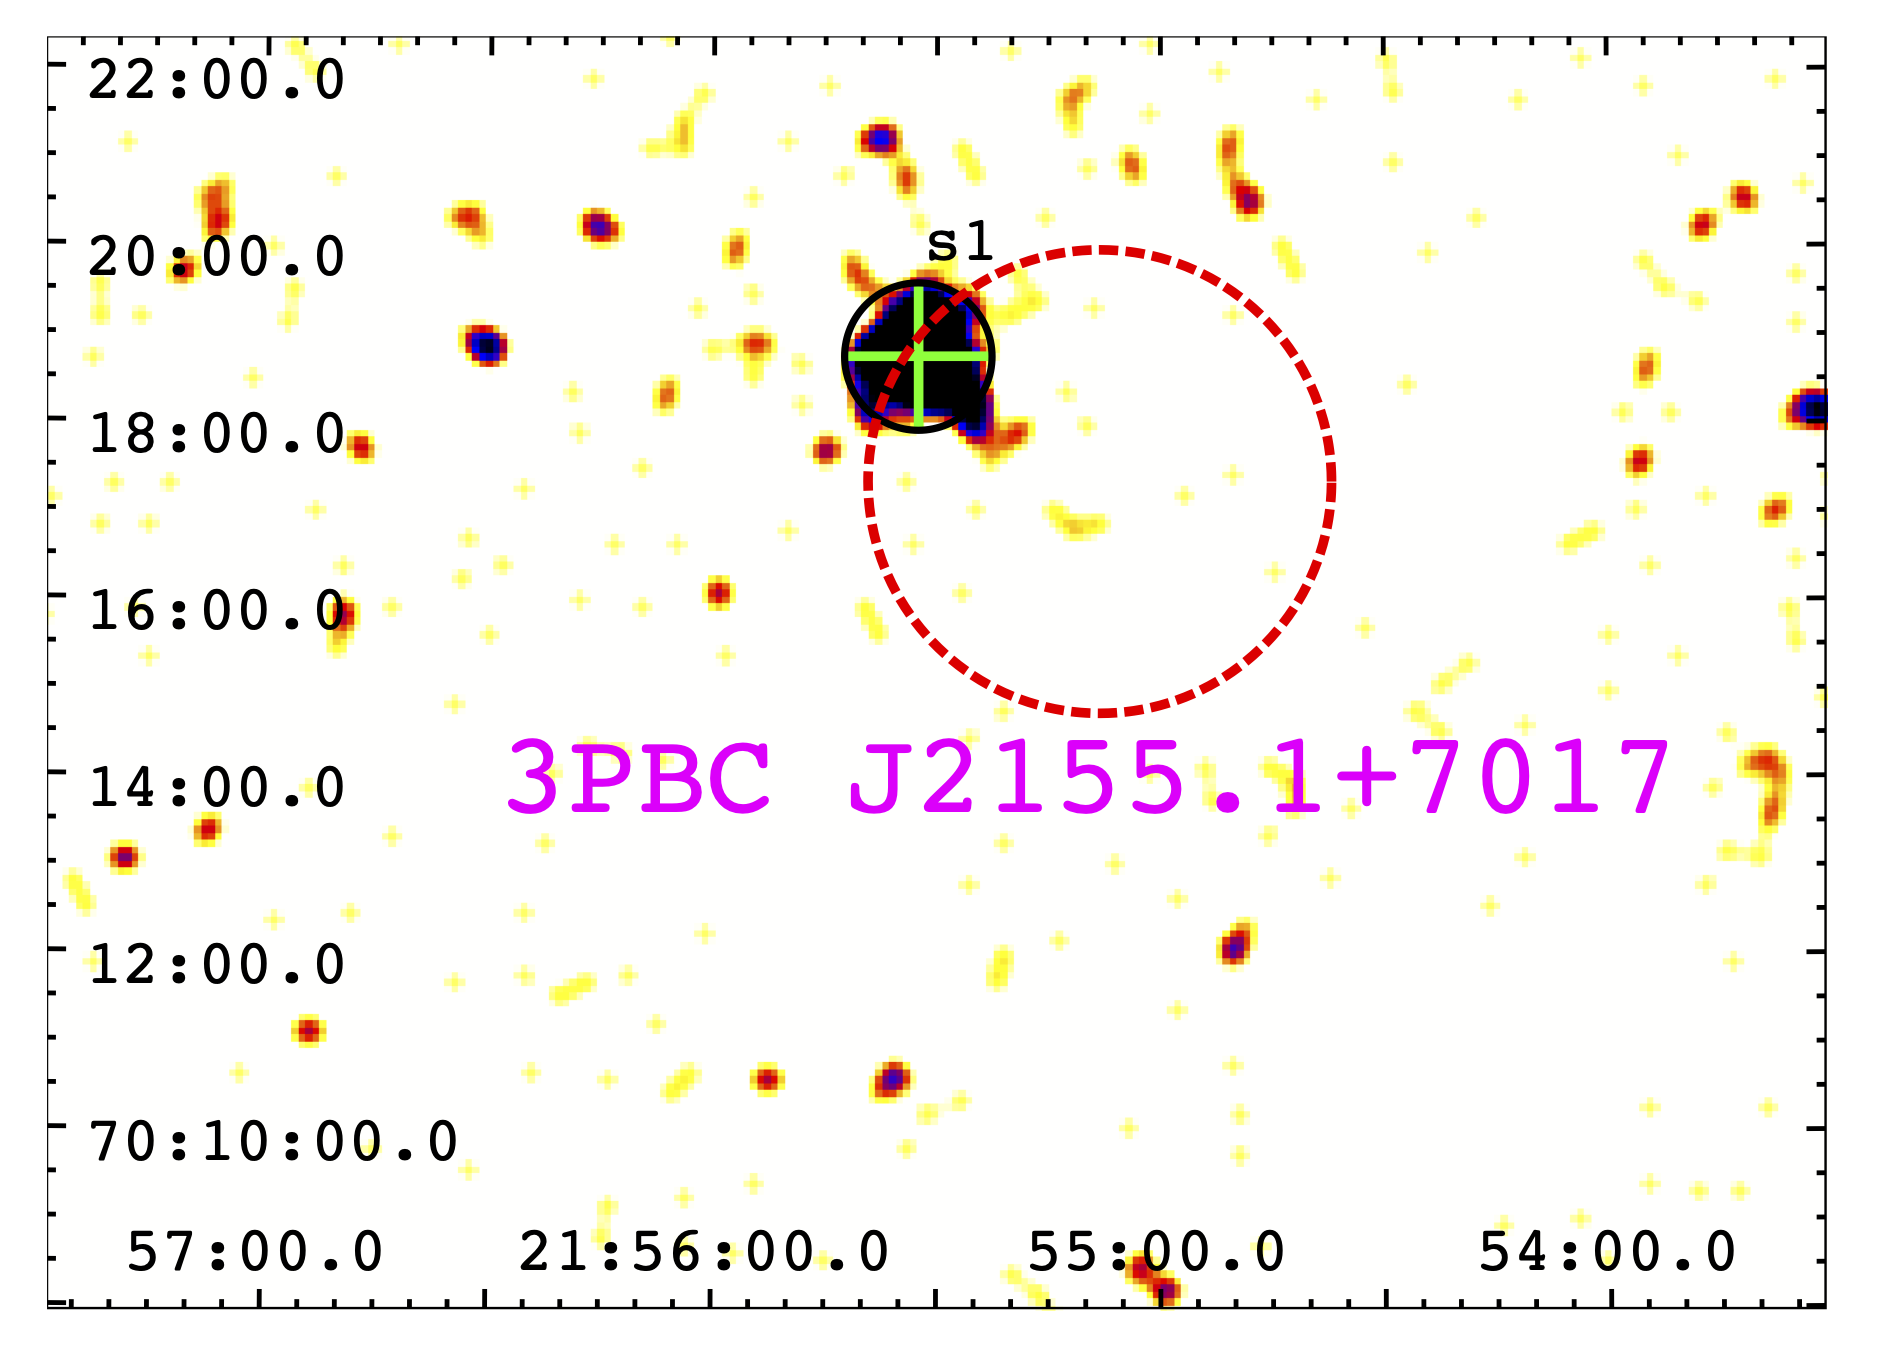
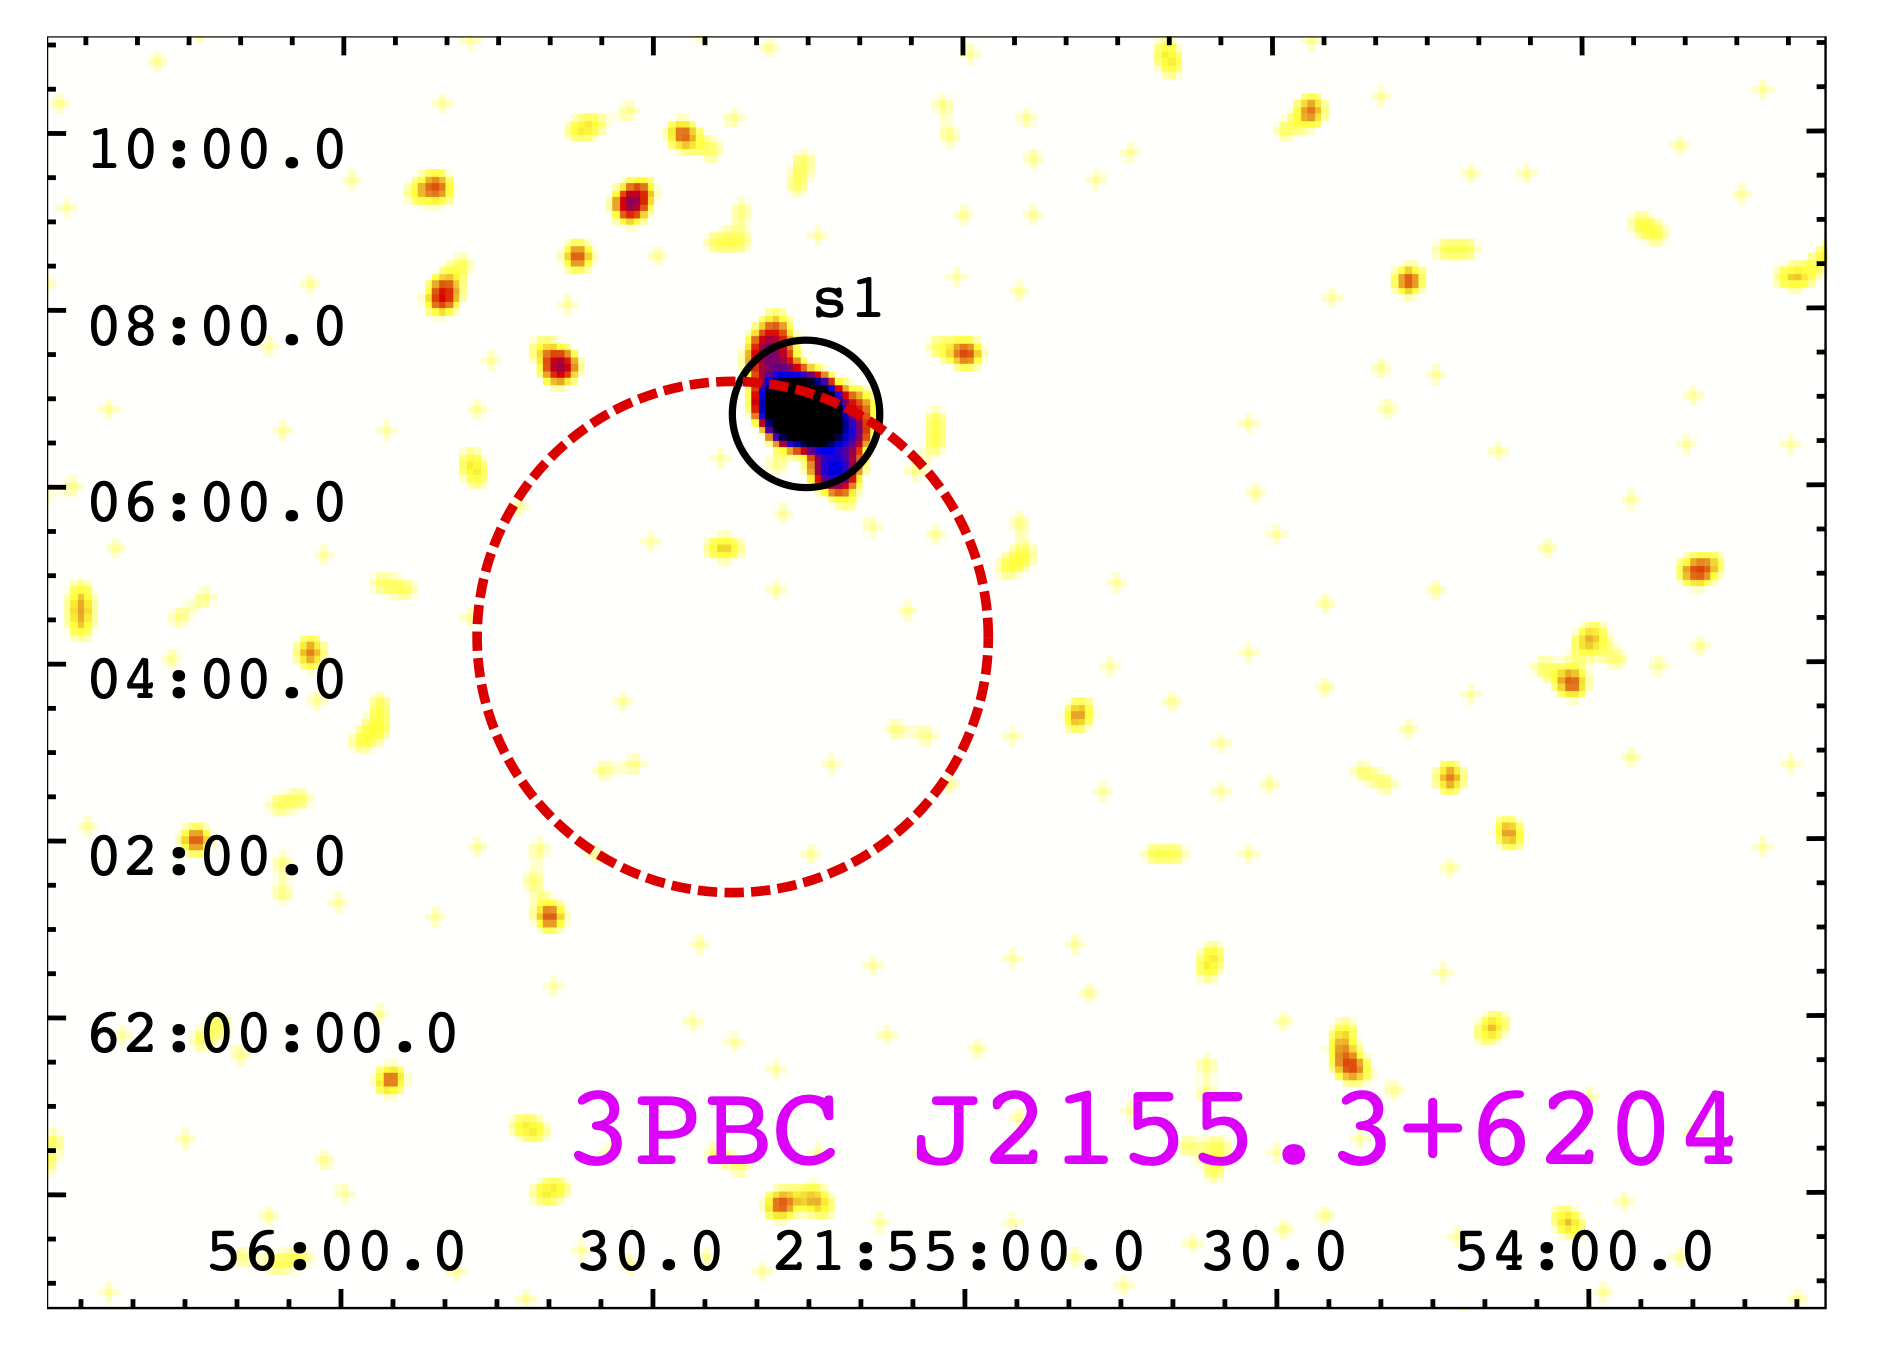
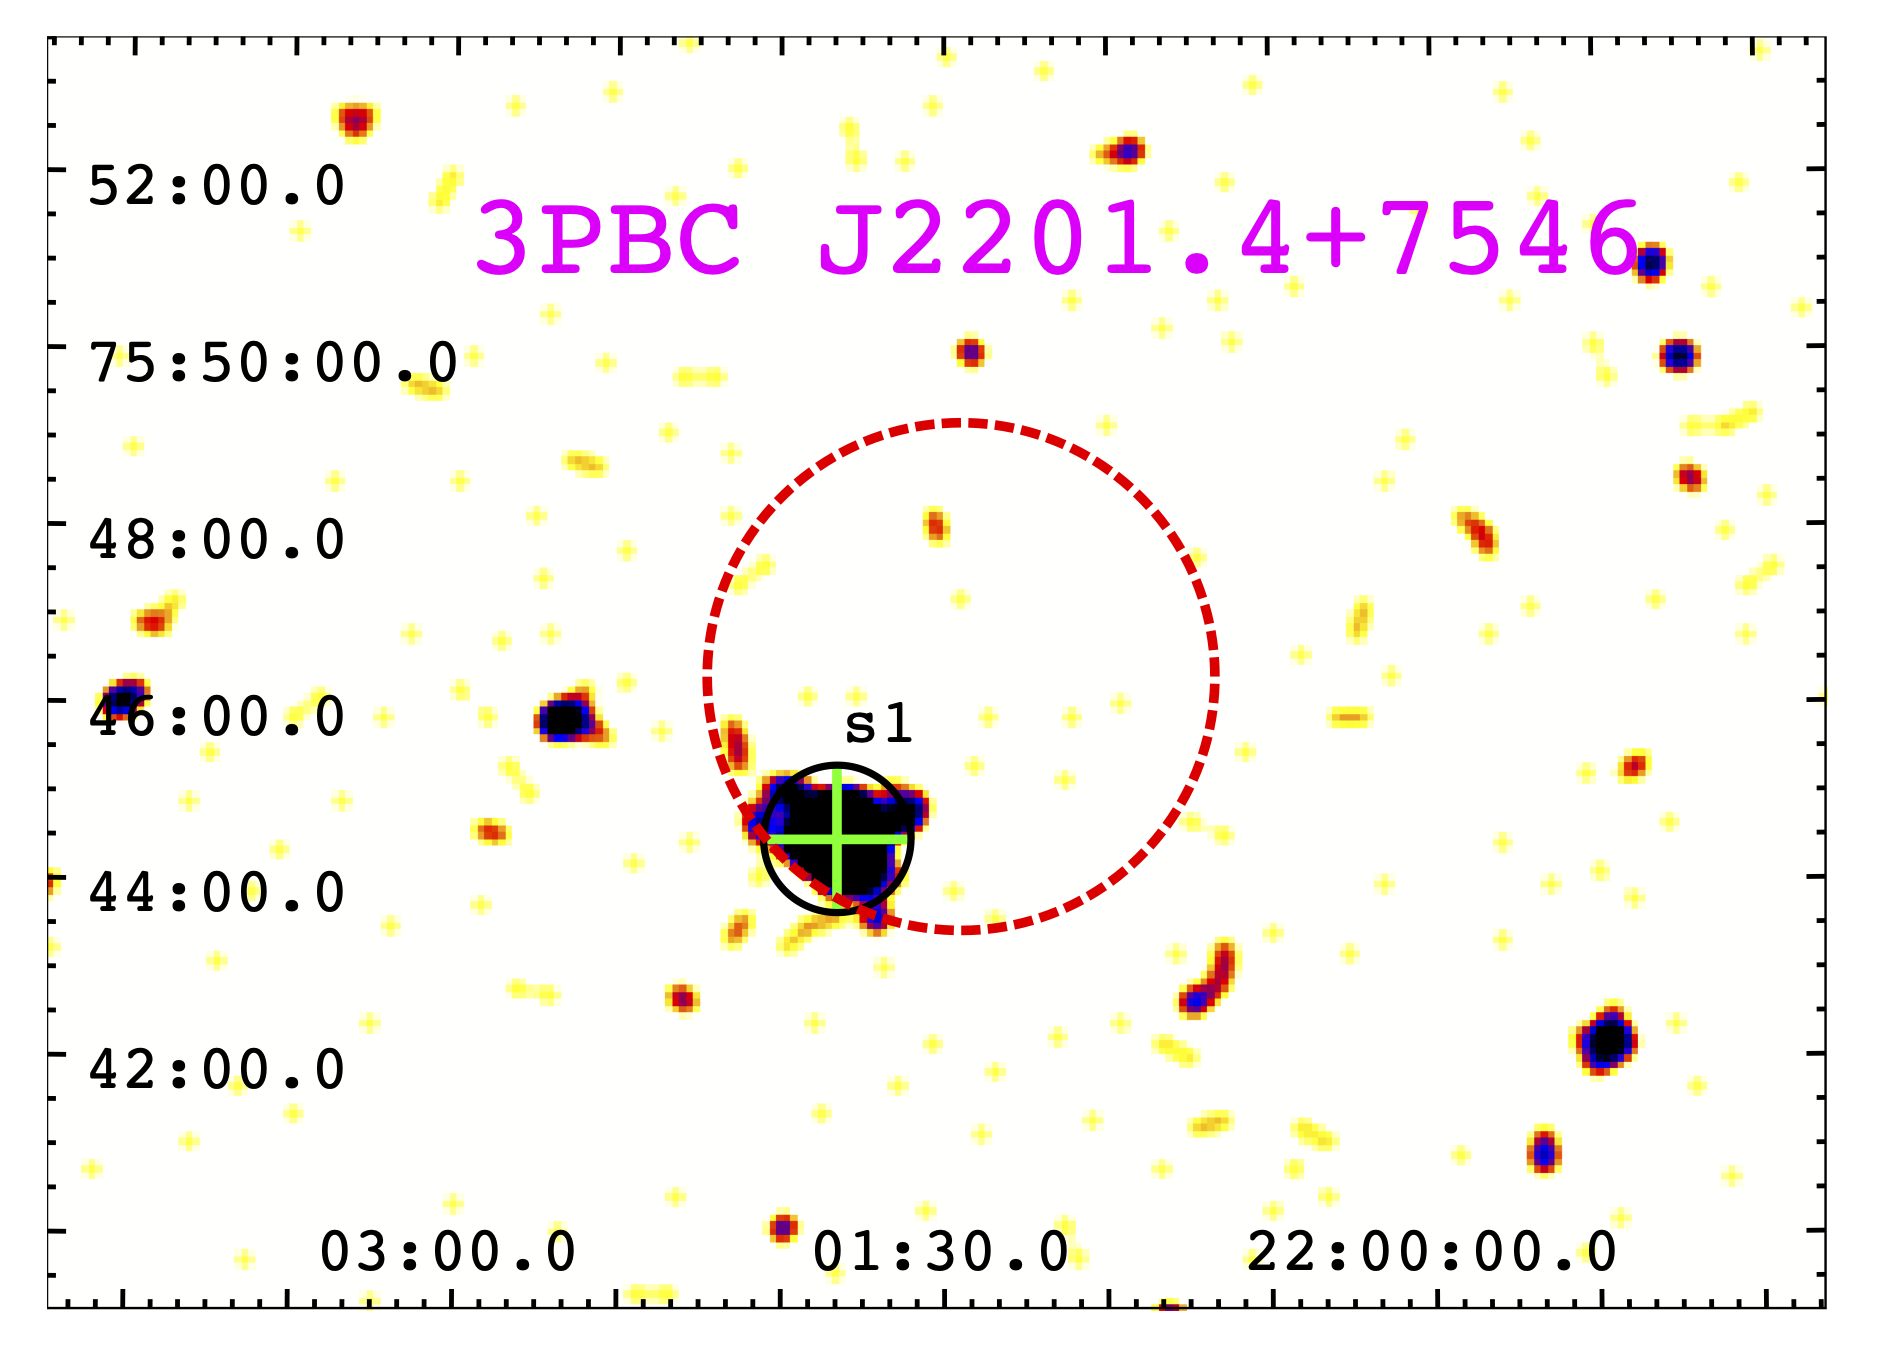
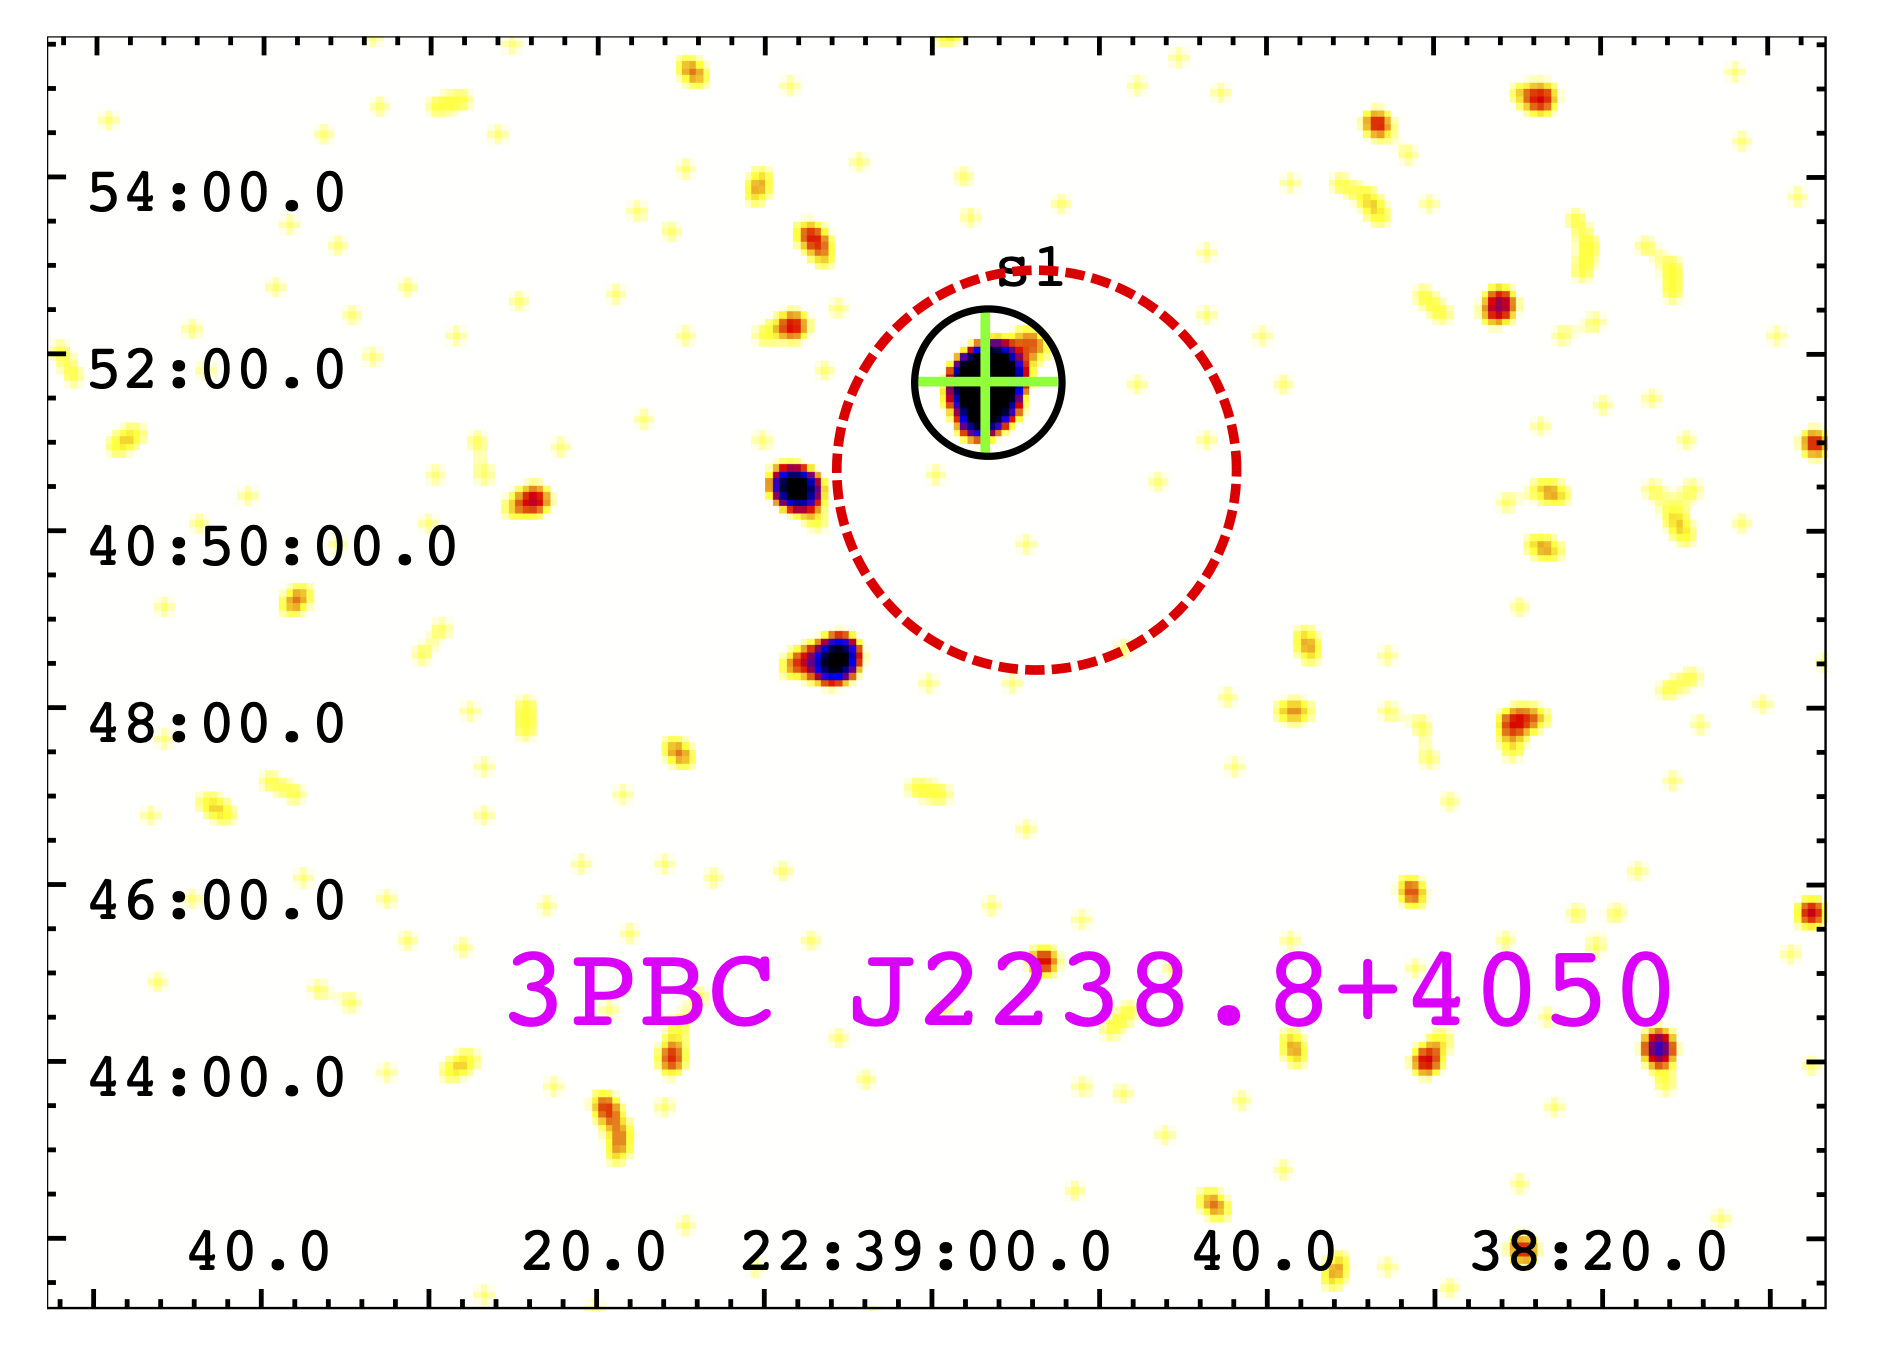
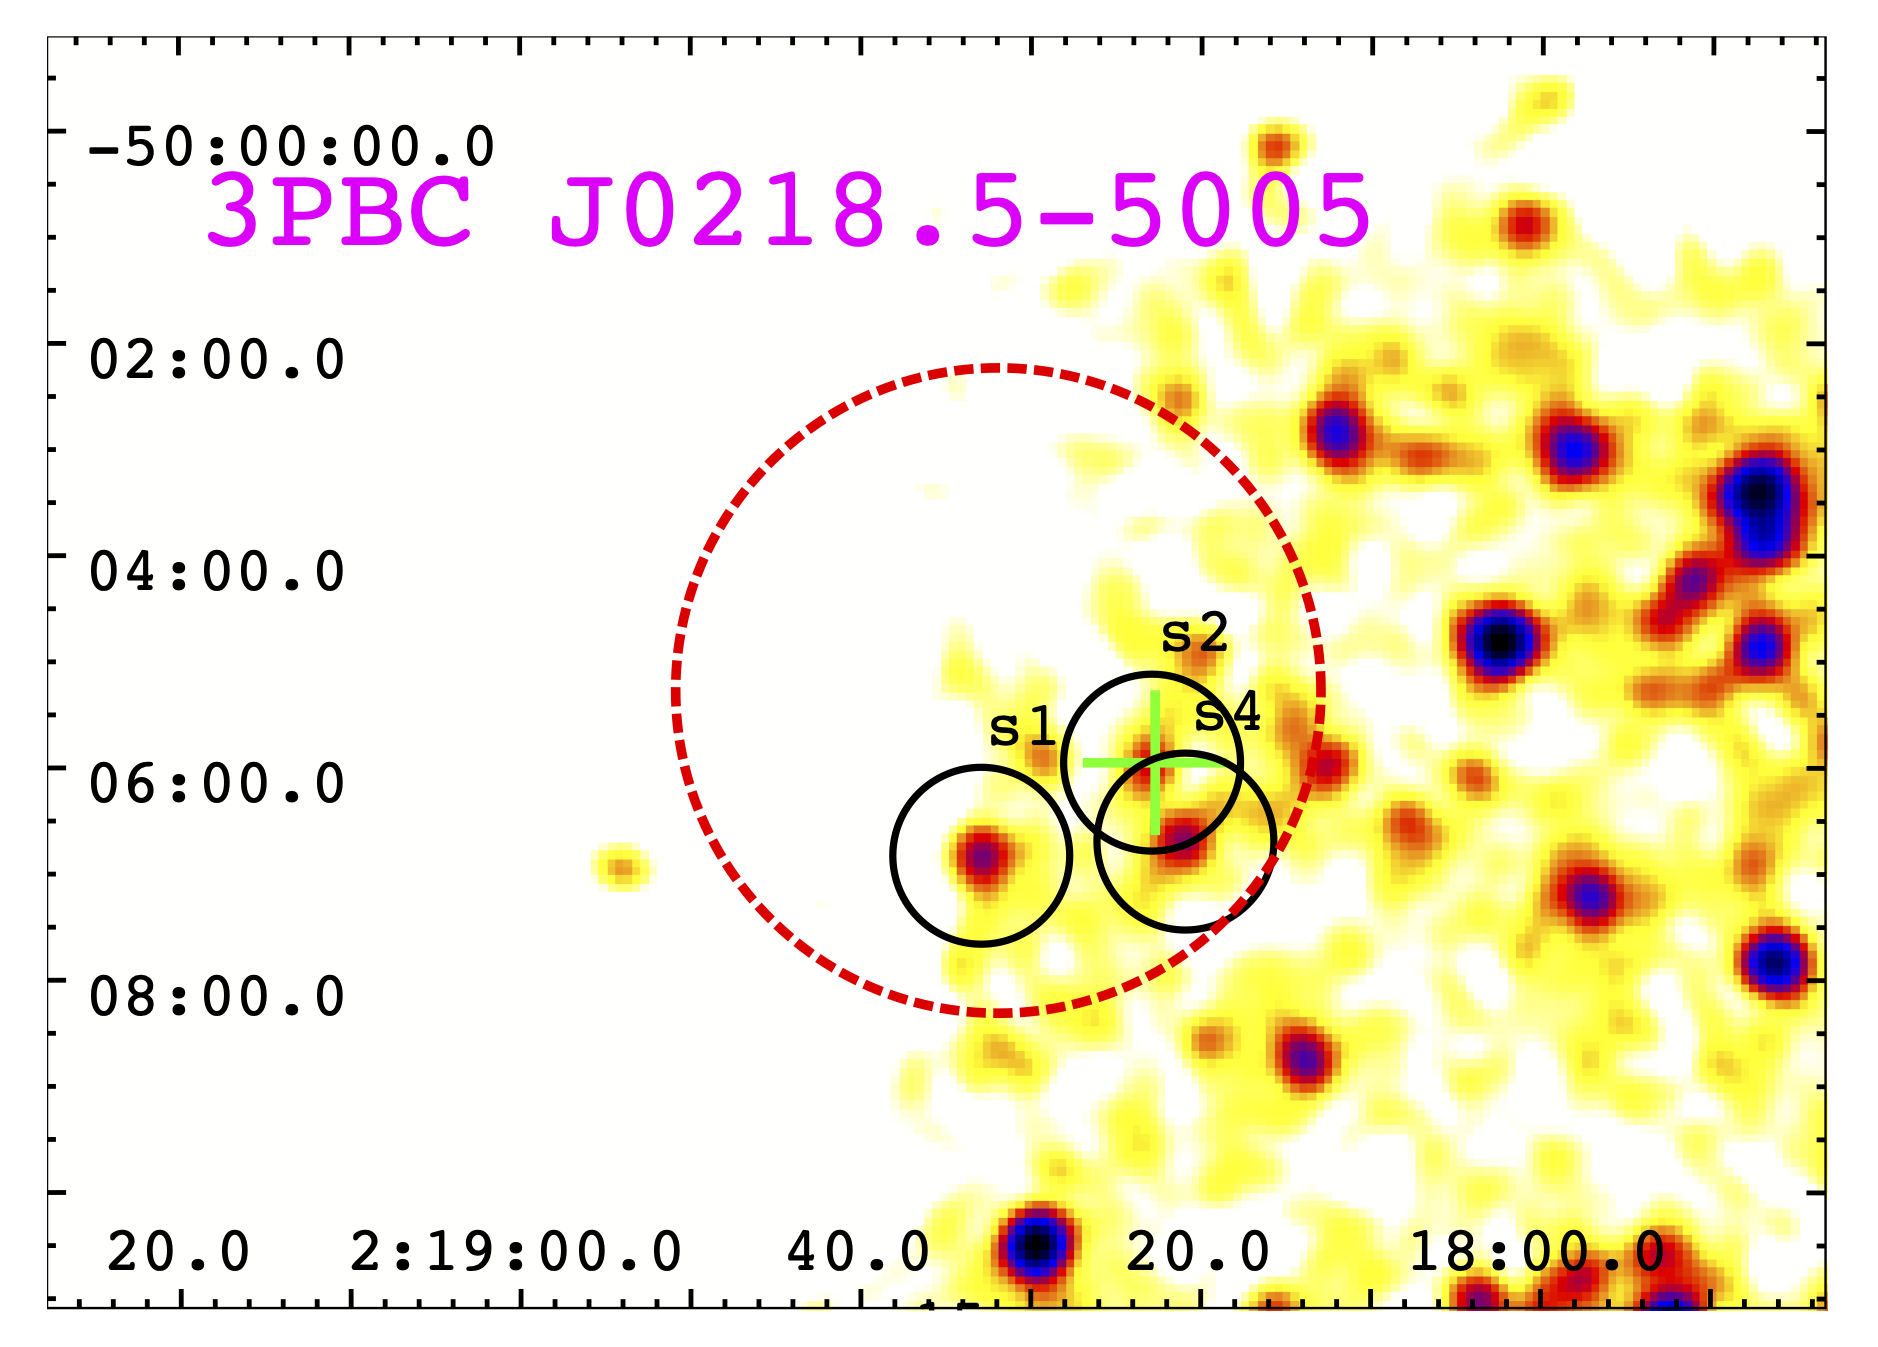
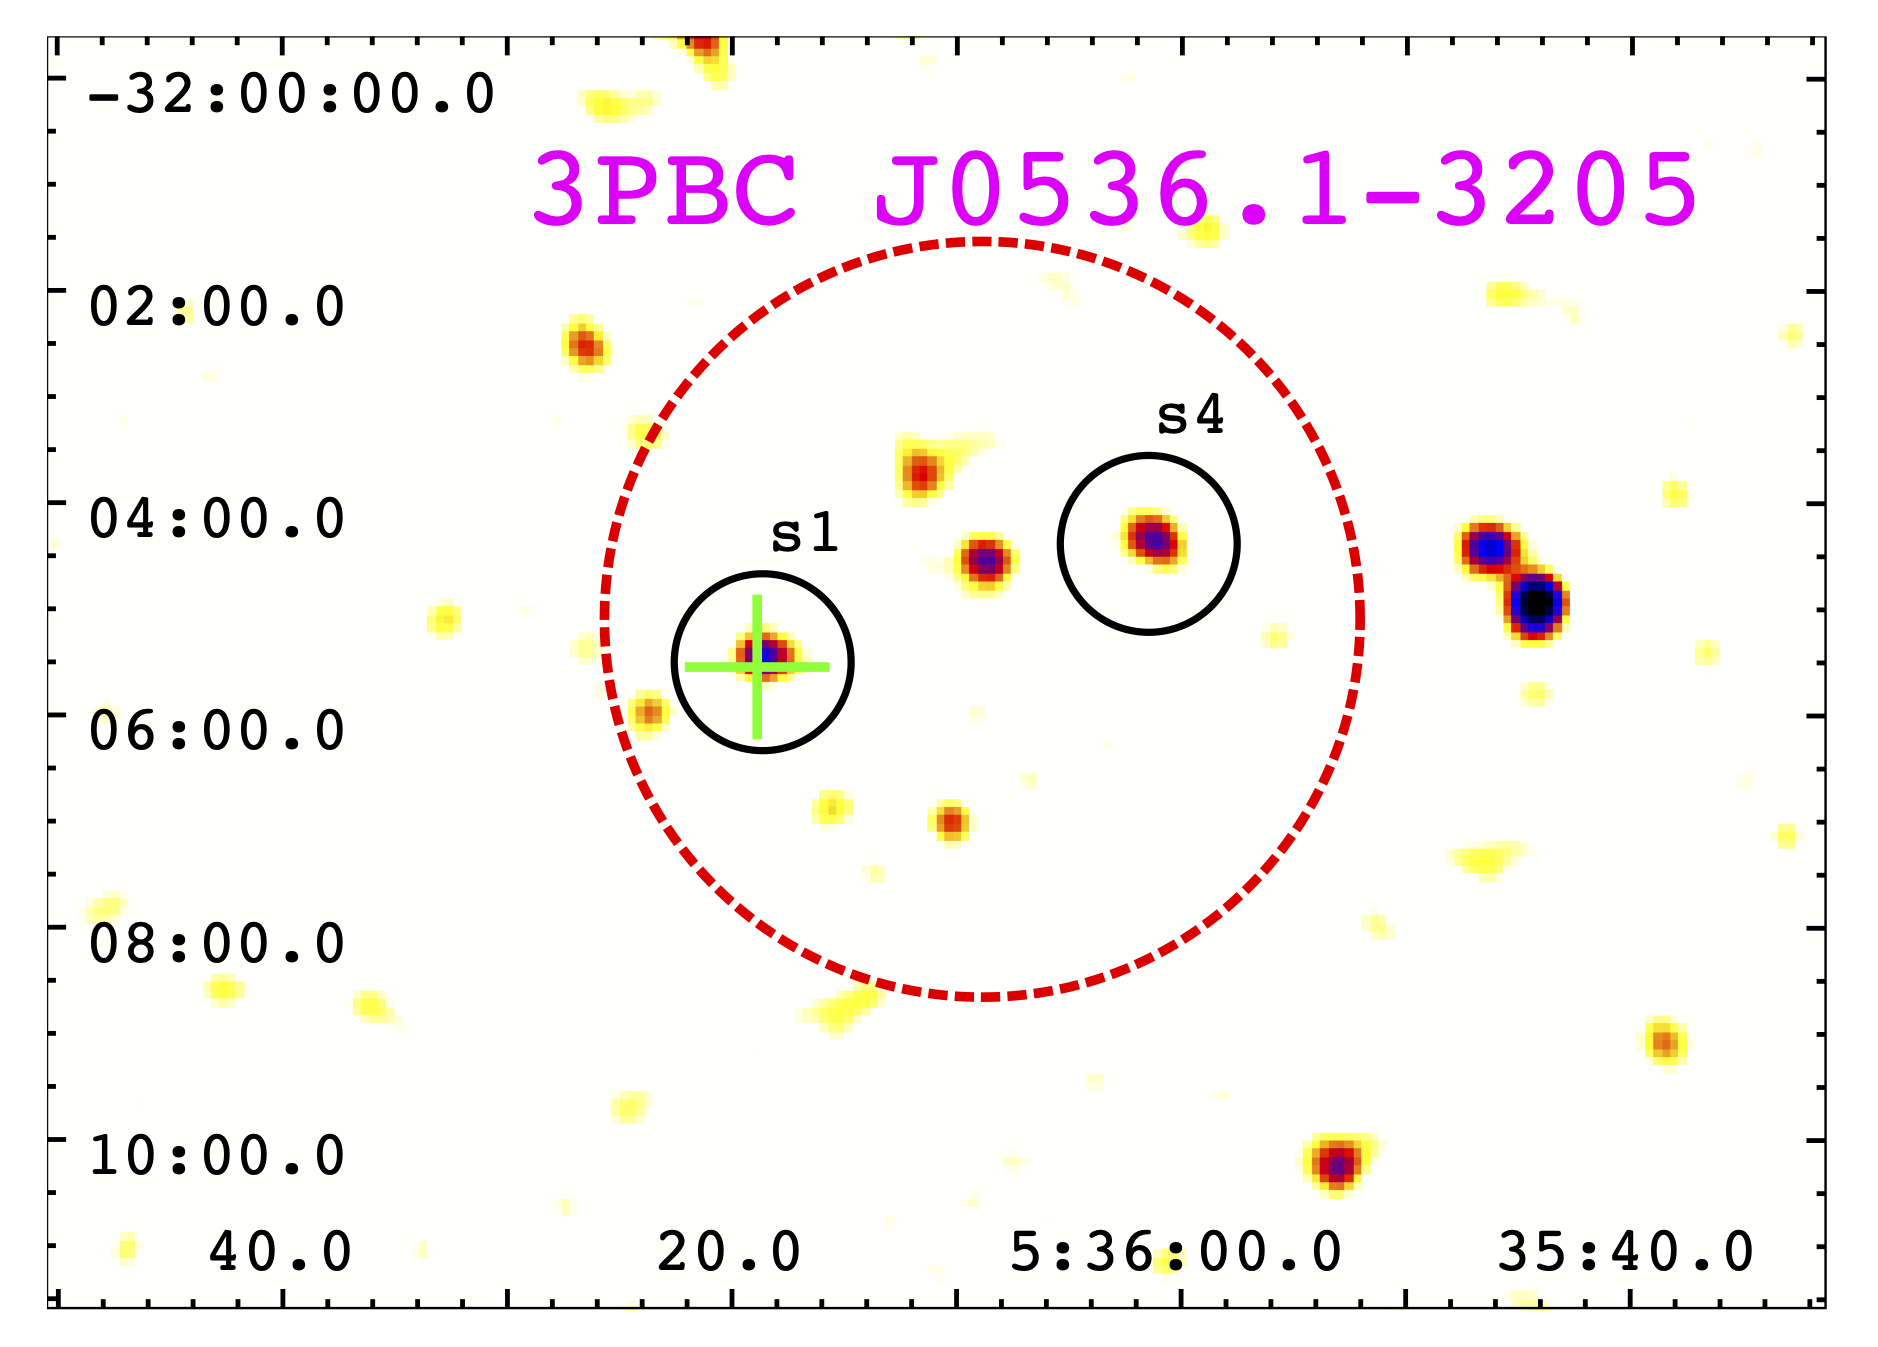
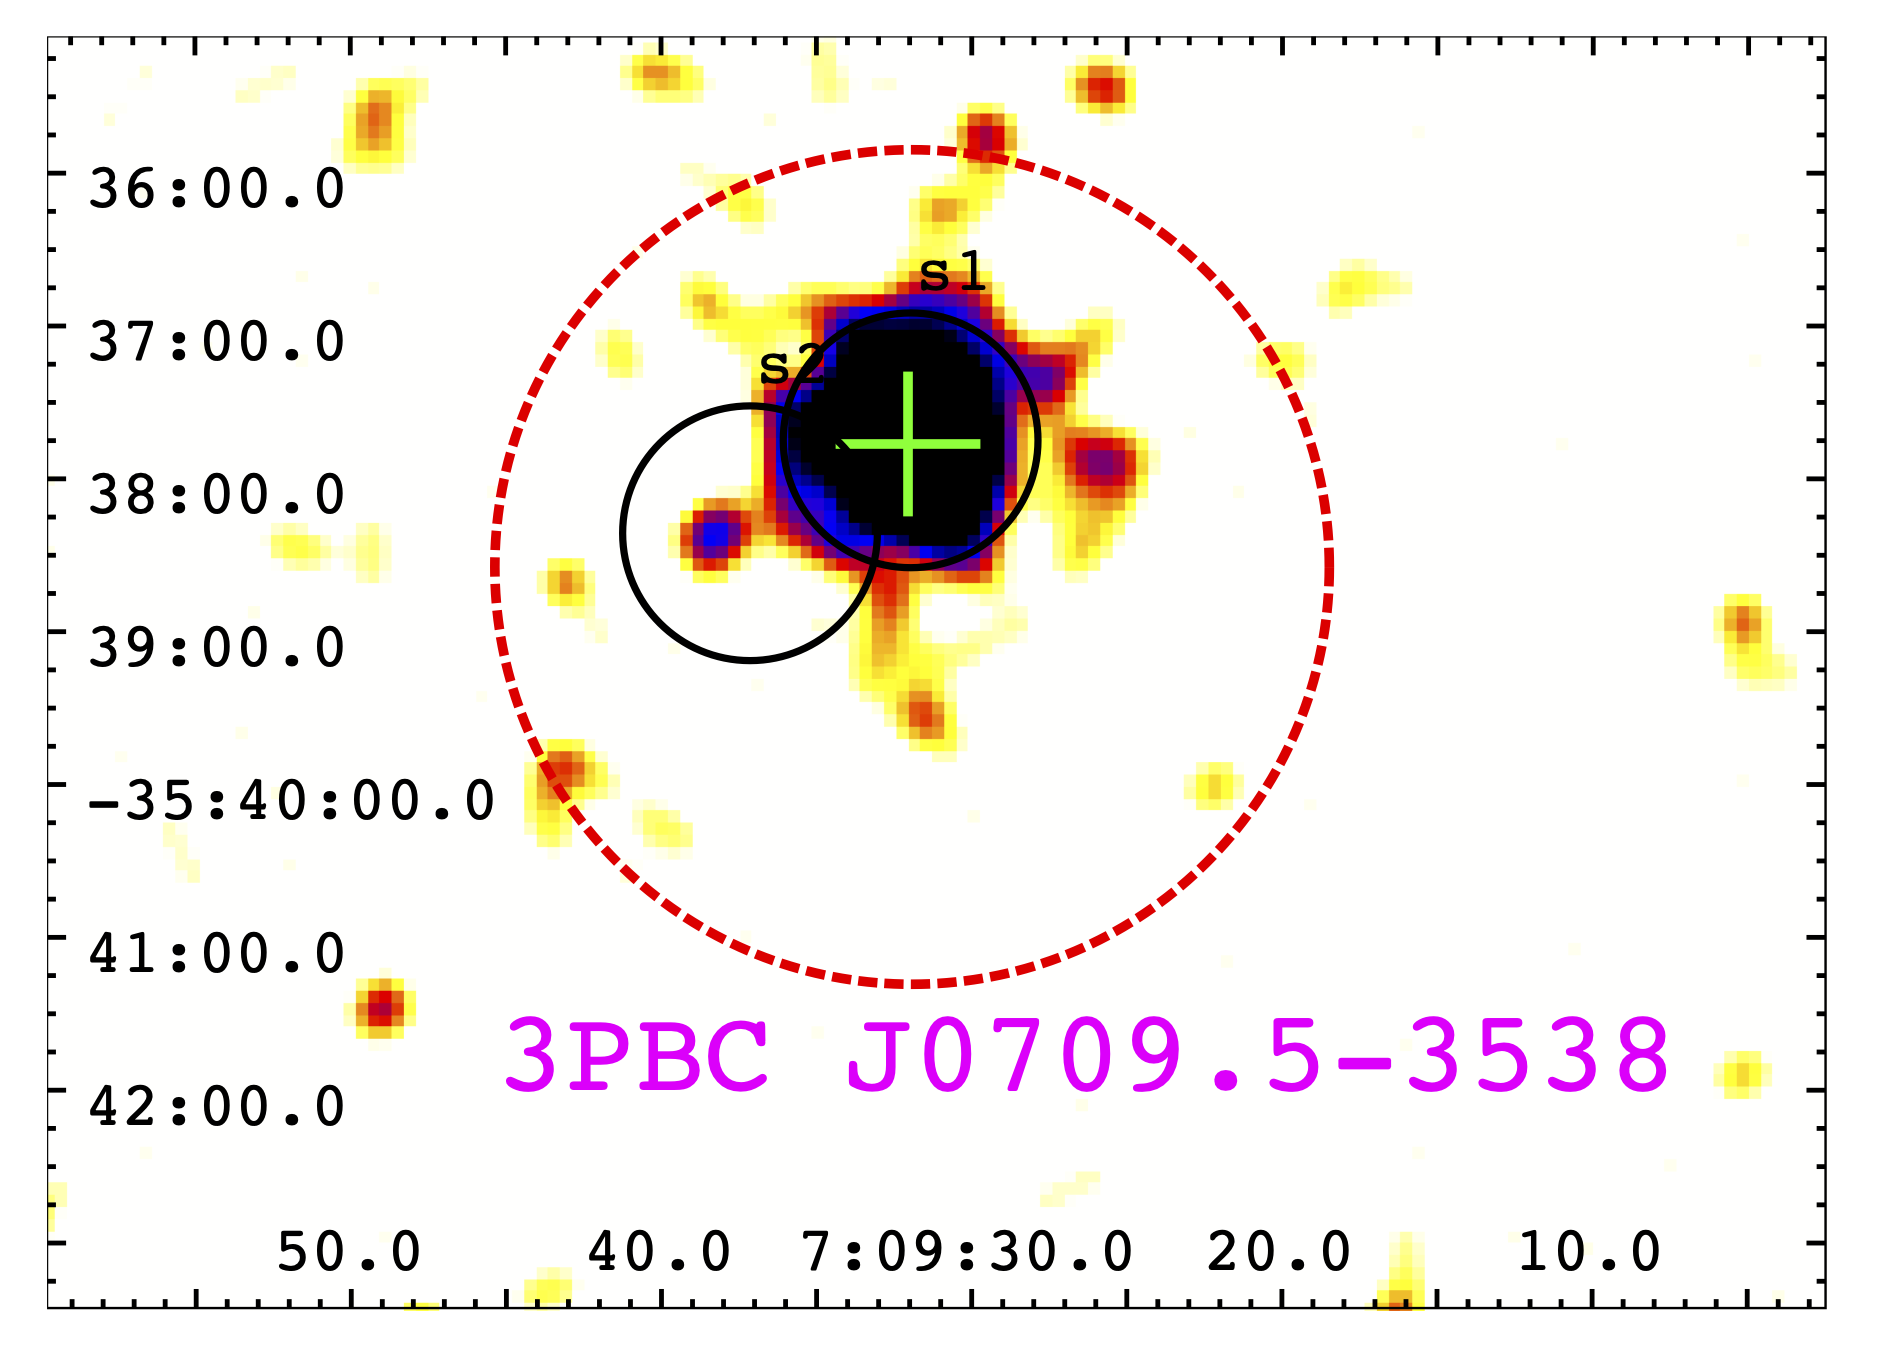
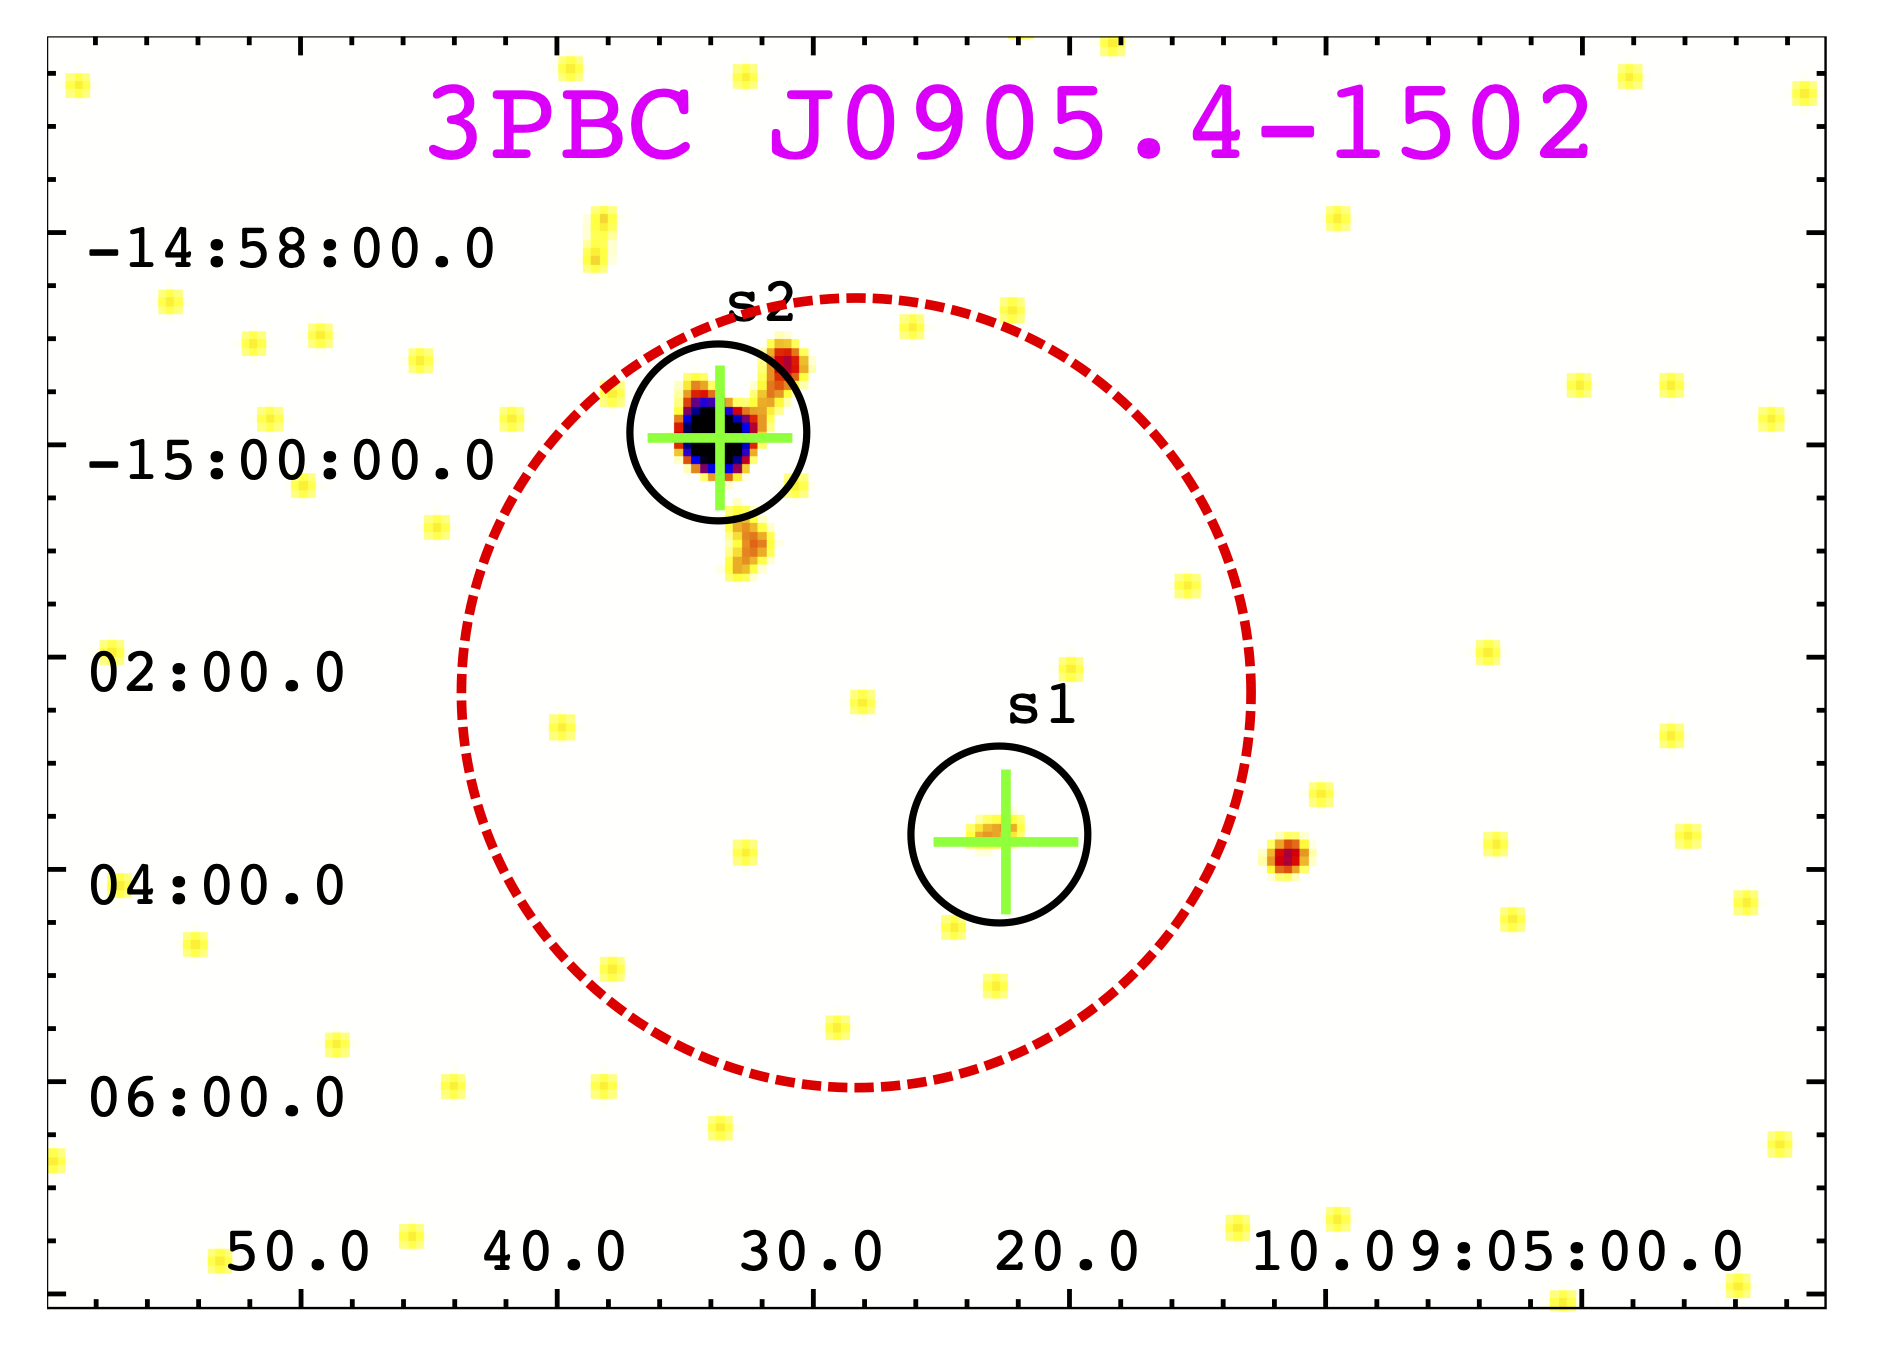
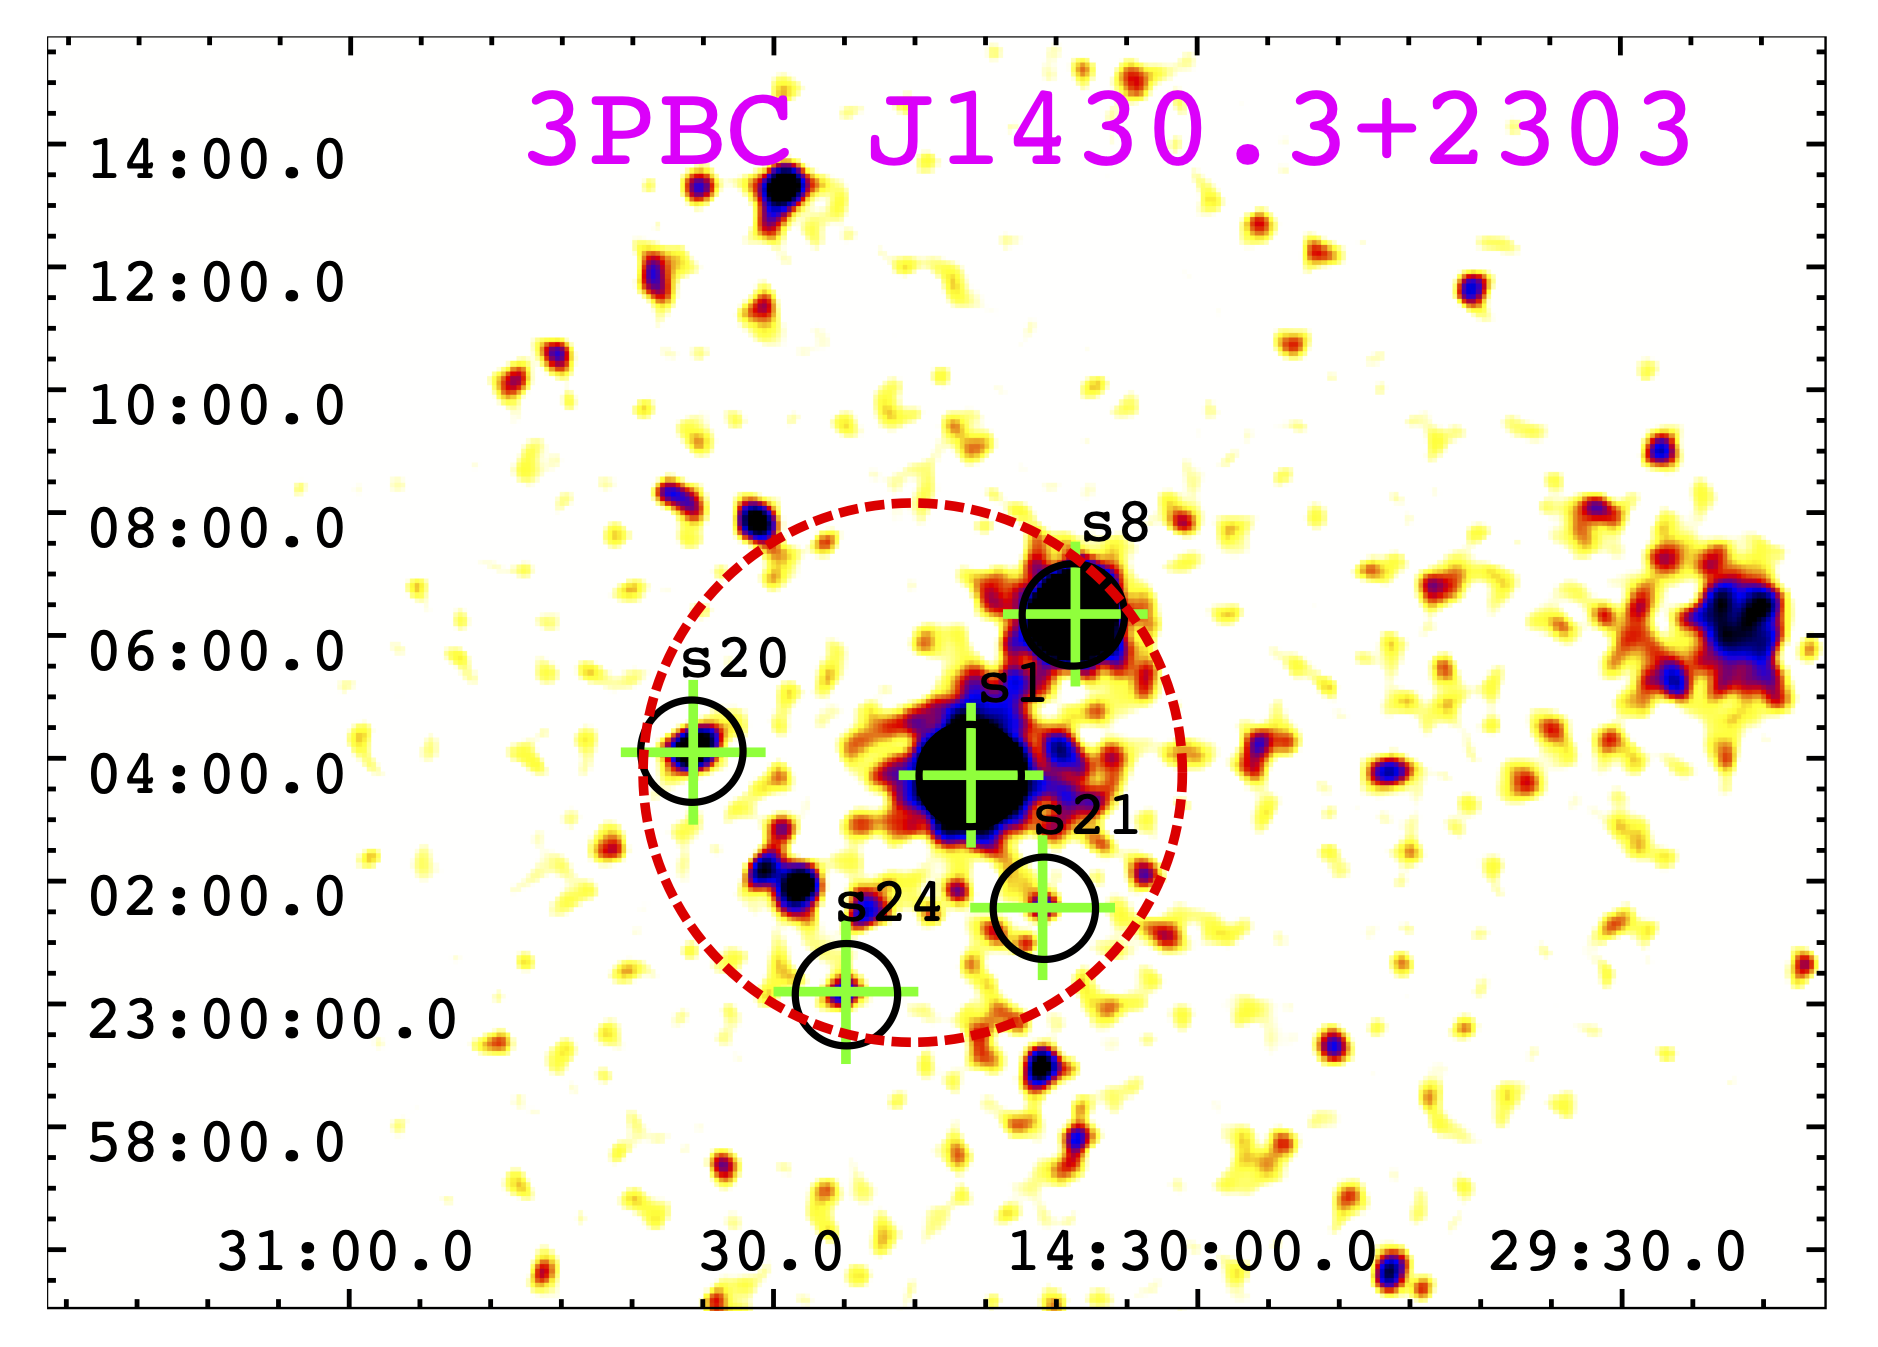
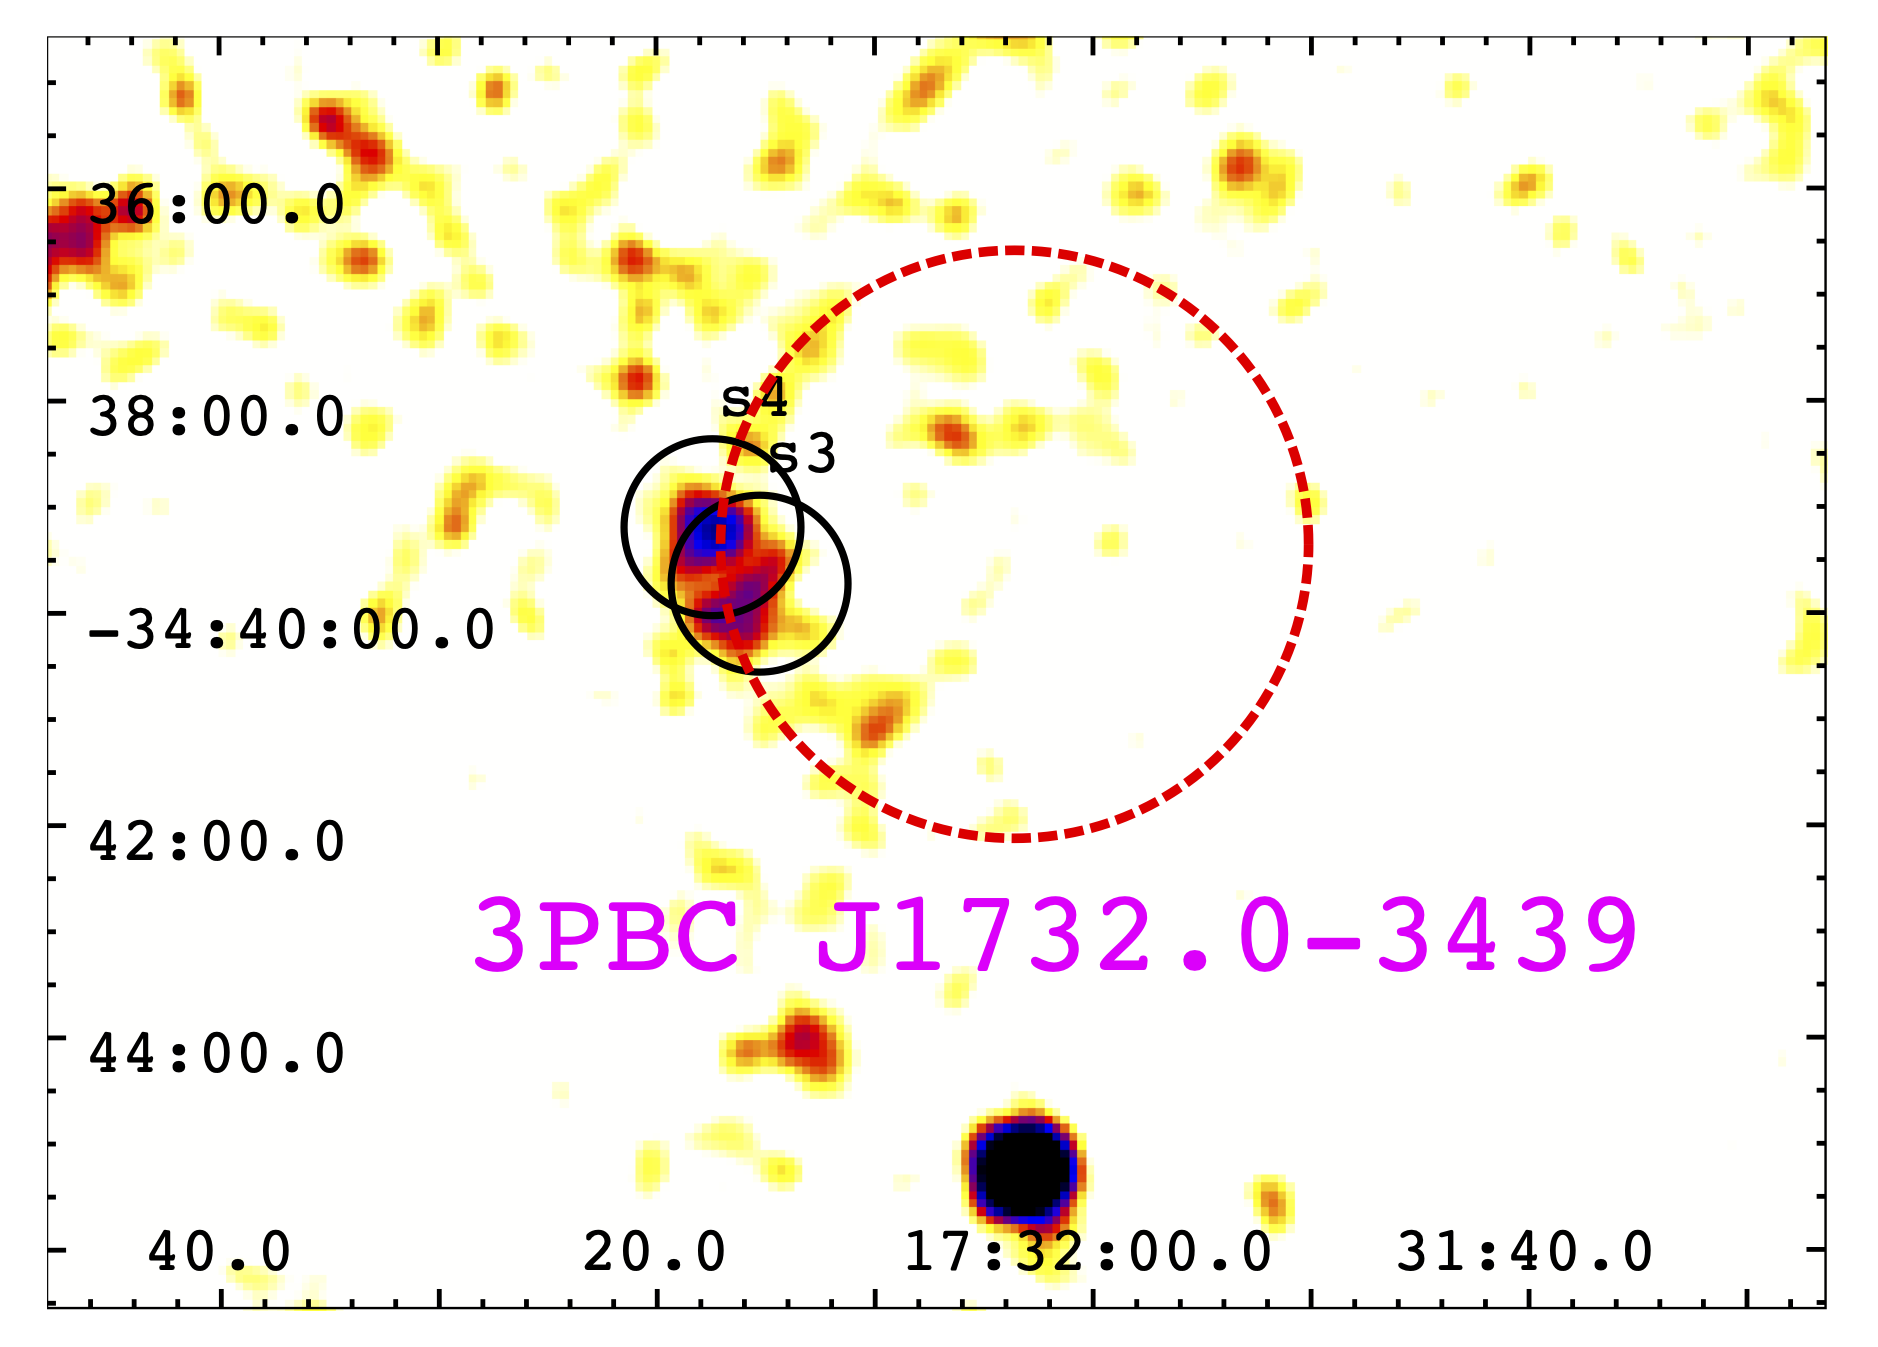
Finally, Appendix B includes all X-ray images obtained from cleaned and merged event files with a red dashed circle showing the BAT positional uncertainty and, when present, black circles indicating all soft X-ray counterparts detected in our Swift-XRT analysis. The green cross marks soft X-ray detections with a WISE counterpart. The WISE counterparts have been searched within a circular region corresponding to the positional uncertainty of the Swift-XRT.
3.3 3PBC sources with multiple candidate counterparts
This section shows images of 3PBC sources with a brief discussion for which we find multiple XRT PC counterparts consistent within the positional uncertainties (m flag).
Three more sources deserve a more detailed description: 3PBC J1430.3+2303 (m flag), 3PBC J1620.1-5001 (x flag), and 3PBC J1730.0-3436 (x flag). All these sources appear to have extended X-ray sources close to the BAT positional uncertainty region. Thus, we adopted the following approach to consider potential X-ray counterparts and avoid spurious detected objects.
For 3PBC J1620.1-5001 and 3PBC J1730.0-3436 (Appendix B), we only indicate in the main table the X-ray detected source having the highest signal-to-noise ratio among those automatically detected. In particular, both sources lie close to the Galactic plane and close to star-forming regions and could be unknown supernova remnants deserving further investigation. However, in the case of 3PBC J1730.0-3436, artifacts in the merged event file prevented us from conducting a detailed analysis. On the other hand, we noticed that for 3PBC J1620.1-5001, the BAT positional uncertainty region is not centered on the extended X-ray source, thus suggesting that it is not the soft X-ray counterpart of the hard X-ray object. A forthcoming paper will present a multifrequency analysis of 3PBC J1620.1-5001 (Kosiba et al., 2023).
Finally, we considered the case of 3PBC1430.3+2303, for which, given the diffuse X-ray emission clearly detected, we only selected as potential counterparts those targets detected as described in the previous section but also having a mid-infrared counterpart, marked with the green cross in Fig. 4. It is worth noting that among them, SWXRTJ143016.094+230343.862 seems to be associated with the galaxy cluster MSPM 05080, thus indicating that the possible origin of this extended X-ray emission is that arising from its intracluster medium.
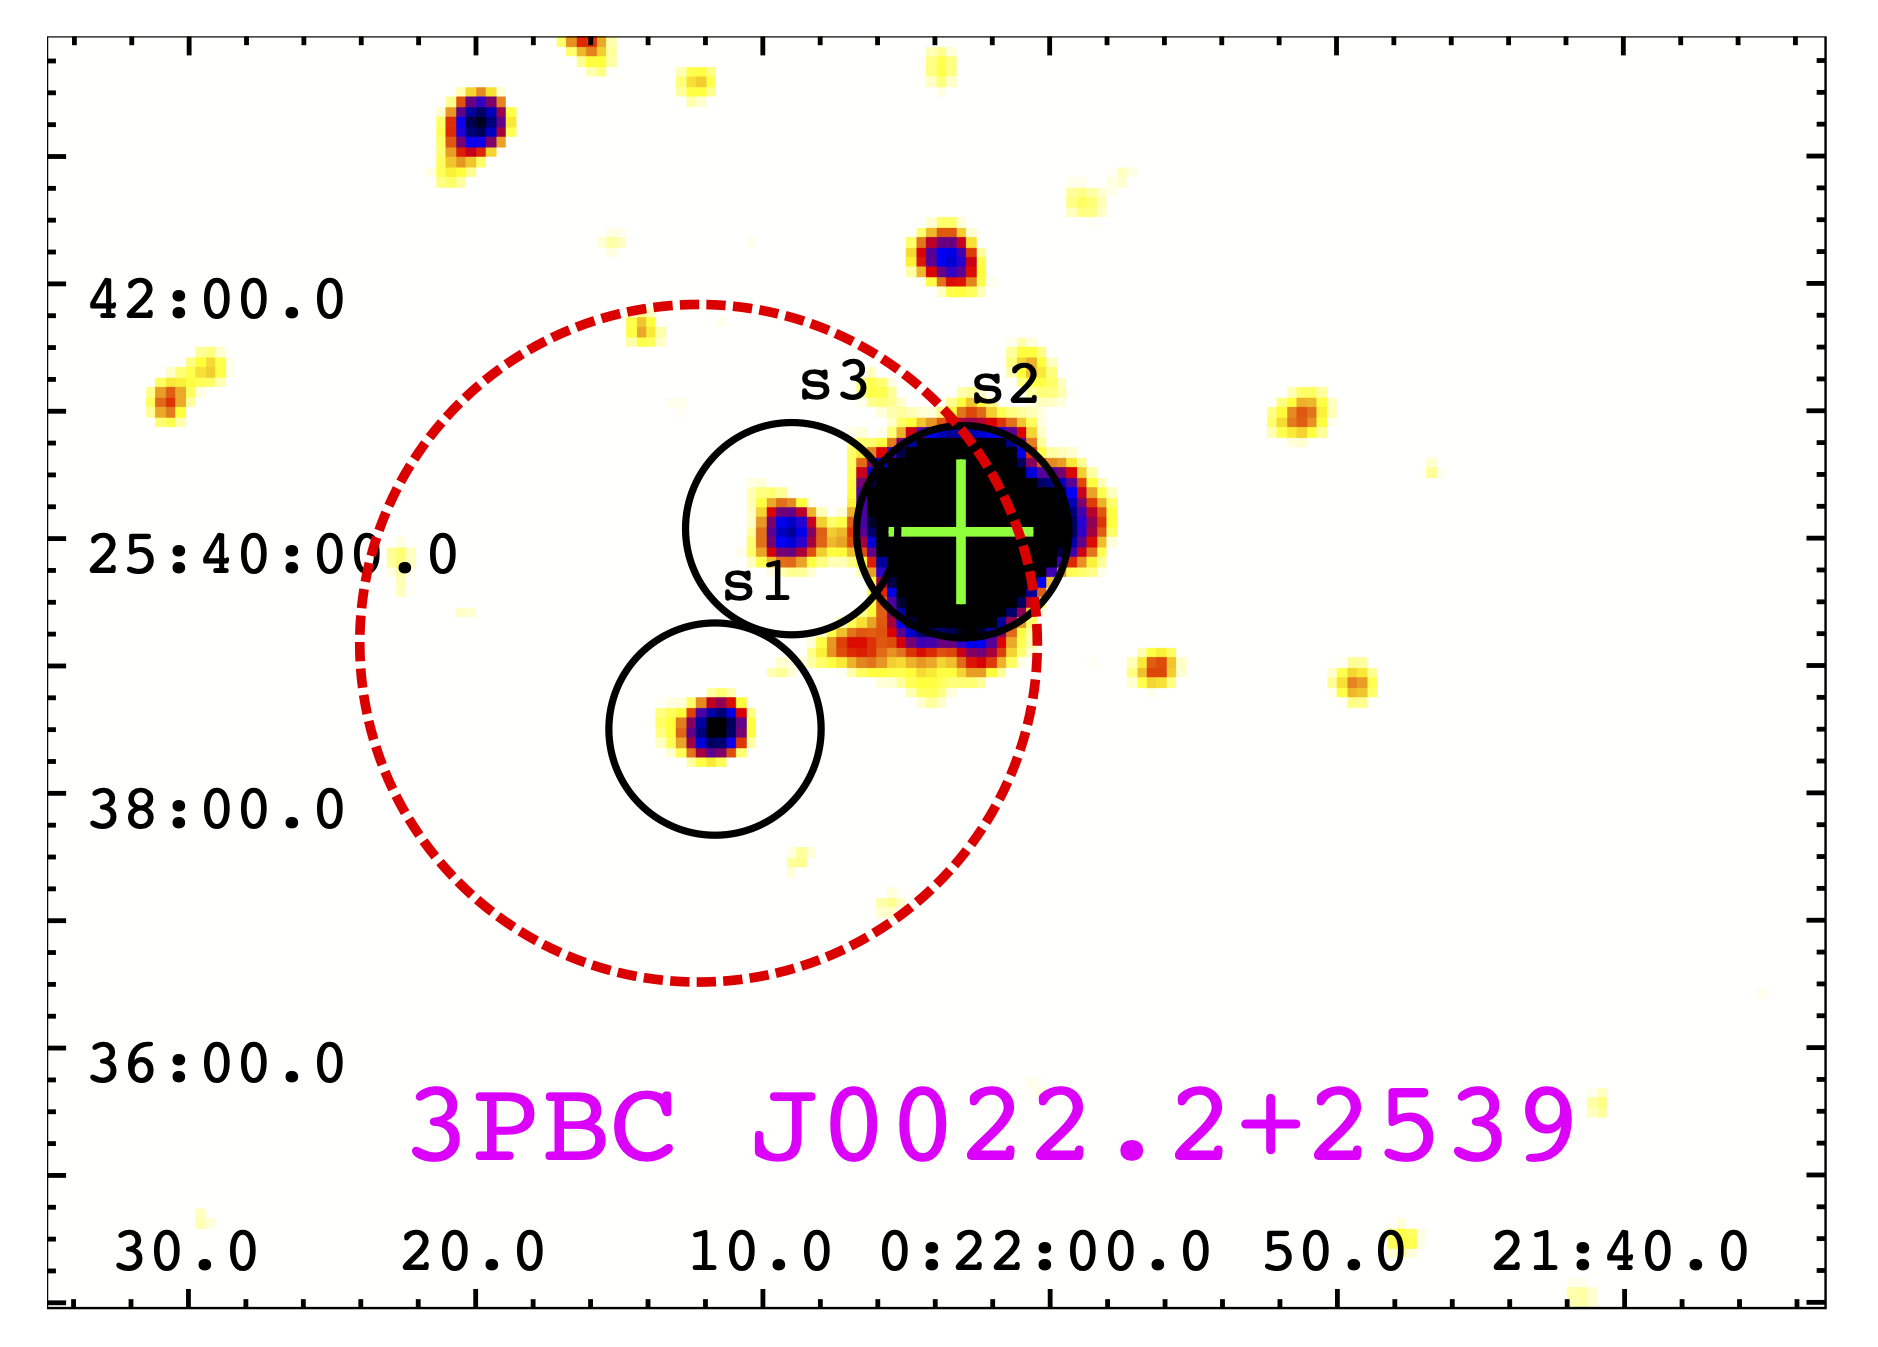


3.3.1 3PBC J0022.2+2539
This source has three XRT PC counterparts Fig. 4. While sources s1 and s3 are faint with S/Ns of and , respectively, source s2 is much brighter with a S/N of and a count rate of . In addition, source s2 is also detected by WISE (J002203.09+254003.2) and in SDSS (J002203.09+254003.1) with magnitude .
3.3.2 3PBC J0218.5-5005
This source has three XRT PC counterparts Fig. 4. The brightest of these is s1 with an S/N of , while the faintest is s2 with an S/N of , also detected by WISE (J021822.70-500557.5).
3.3.3 3PBC J0536.1-3205
This source has two XRT PC counterparts Fig. 4. The brightest being s1 with an S/N of , also detected by WISE (J053618.88-320533.0).
3.3.4 3PBC J0709.5-3538
3.3.5 3PBC J0800.7-4308
This source also has two XRT PC counterparts Fig. 4. The source s1 is the faintest, with a S/N of and a countrate 0f , while s2 has a S/N of and a countrate 0f . Both sources have a WISE counterpart, J080045.83-430939.3, and J080039.96-431107.2, respectively.
3.3.6 3PBC J0819.2-2509
This source has two XRT PC counterparts Fig. 4, with the brightest being s1 with an S/N of and the faintest being s2 with an S/N of . Both sources have a WISE counterpart, J081914.73-251116.6, and J081916.20-250706.4, respectively, with s1 having a redshift of 0.00557 with a spectrum reported in (Strauss et al., 1992).
3.3.7 3PBC J0857.2+6703
For this source Fig. 4, we find two XRT PC counterparts: the brightest being s1 with an S/N of and the faintest being s2 with an S/N of . The source s1 has a WISE counterpart, namely J085656.49+670257.3.
3.3.8 3PBC J0905.4-1502
This source Fig. 4 has two XRT PC counterparts s1 and s2, with similar S/Ns, and , respectively. Both are detected by WISE (J090522.48-150344.6 and J090533.64-145956.2, respectively), with s2 reported in NED with a redshift of .
3.3.9 3PBC J1430.3+2303
For the 3PBCJ1430.3+2303, given the presence of diffuse X-ray emission, the automatic algorithm described in the previous section detected many spurious sources. We thus selected as potential soft X-ray counterparts only the sources with a mid-infrared counterpart, marked with the green cross. It is worth noting that among them, SWXRTJ143016.094+230343.862 seems to be associated with the galaxy cluster MSPM 05080, thus indicating that the possible origin of this extended X-ray emission is that arising from its intracluster medium.
3.3.10 3PBCJ1732.0-3439
This source Fig. 4 has two XRT PC counterparts, s3 and s4, with S/Ns of and , respectively, and count rates of and ct s-1, respectively.
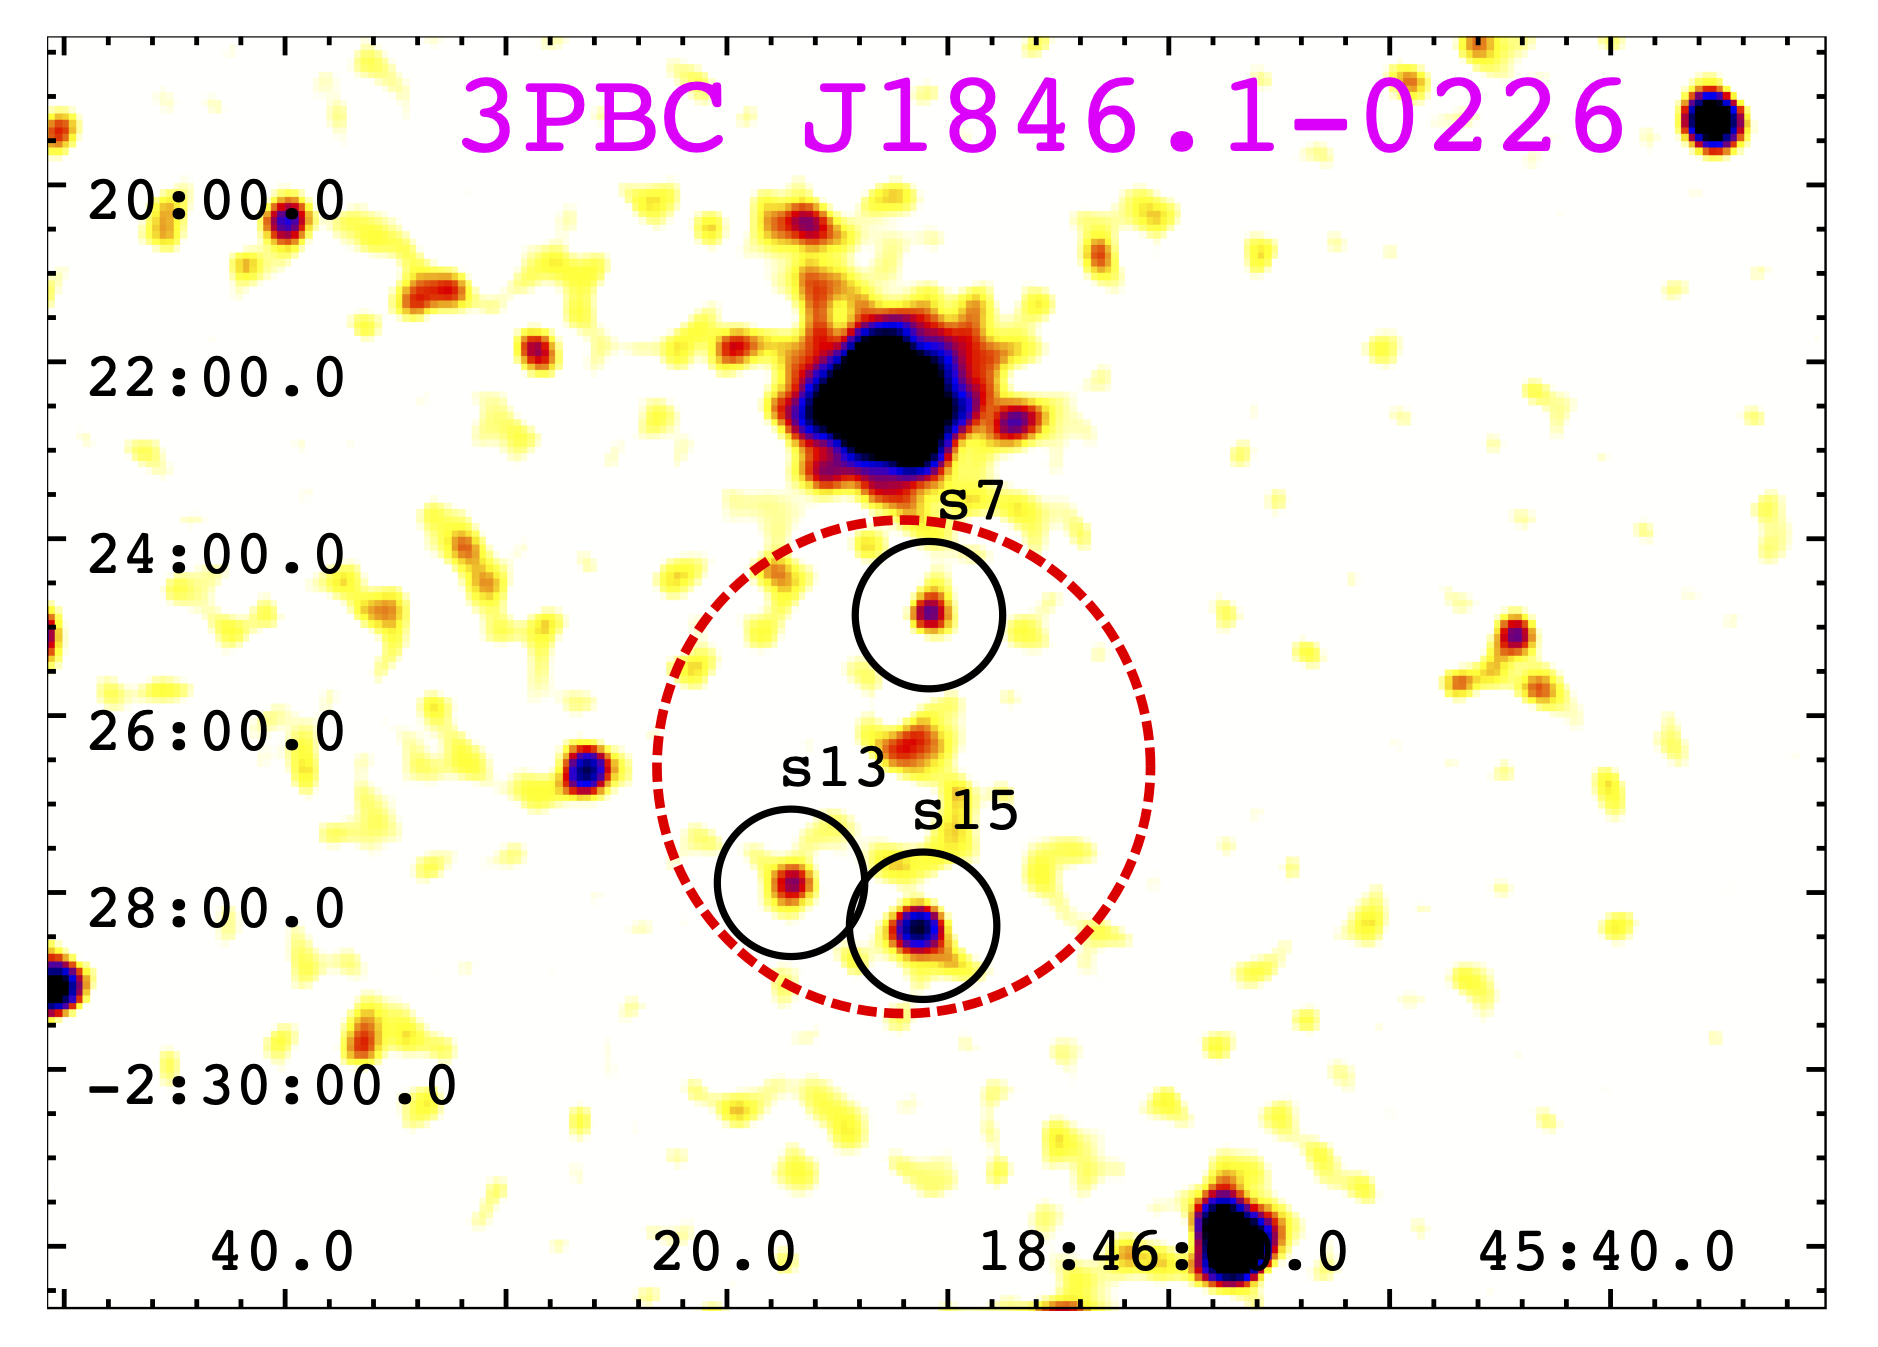
3.3.11 3PBCJ1846.1-0226
This source Fig. 4 has three XRT PC counterparts, s7, s13 and s15, with similar S/Ns of , and , respectively. The source s13 is also detected in SDSS (J184617.13-022753.4) with a magnitude .
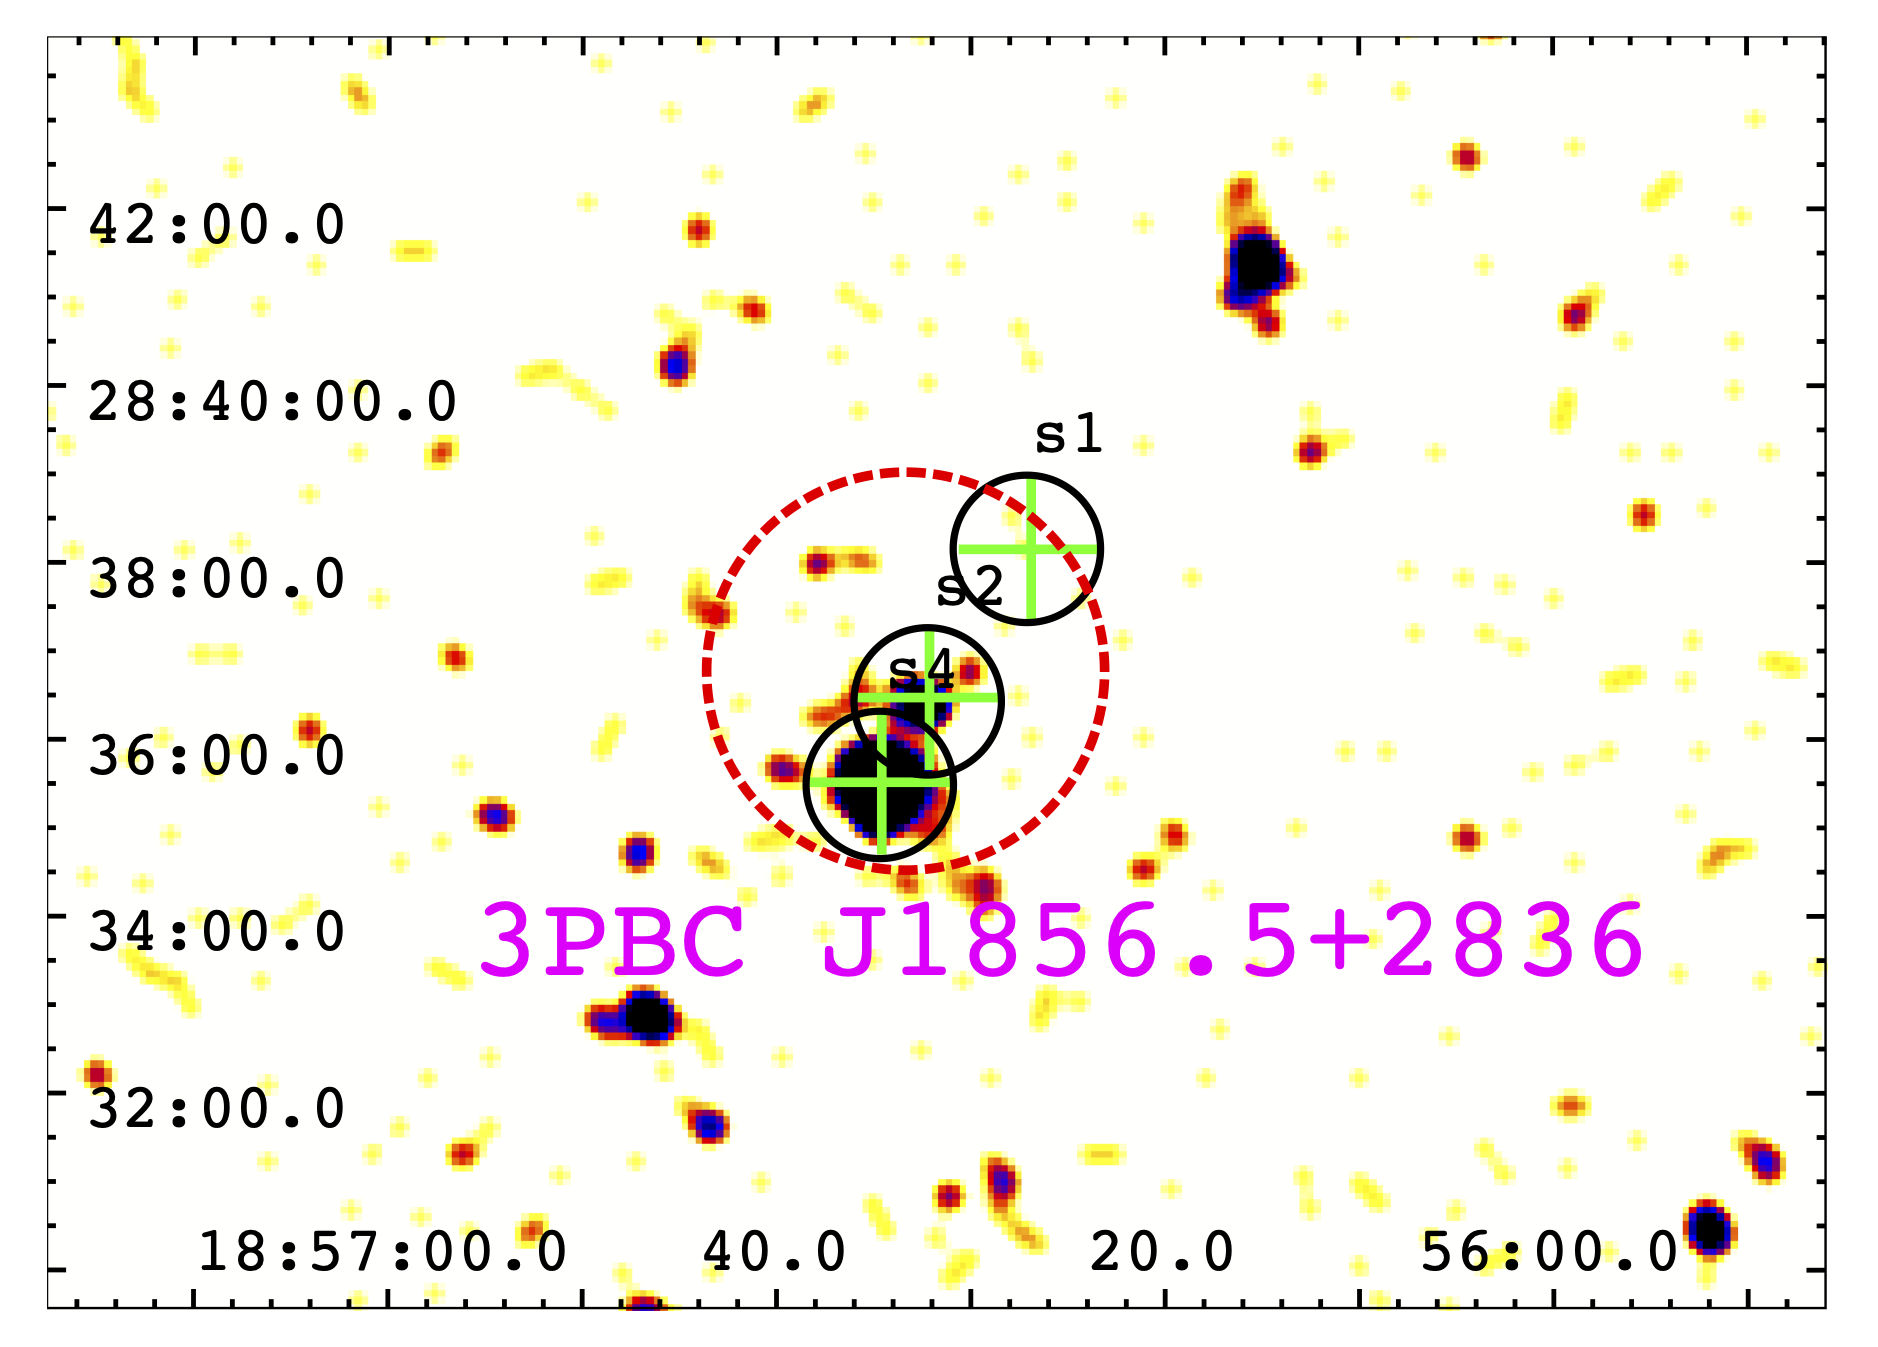
3.3.12 3PBCJ1856.5+2836
This source Fig. 4 has three XRT PC counterparts, s1, s2 and s4, with S/Ns of , and , respectively. The sources are all detected by WISE (J185626.89+283809.3, J185632.13+283628.8, and J185634.58+283531.3), although the faintest s2 only has an upper limit of in band.
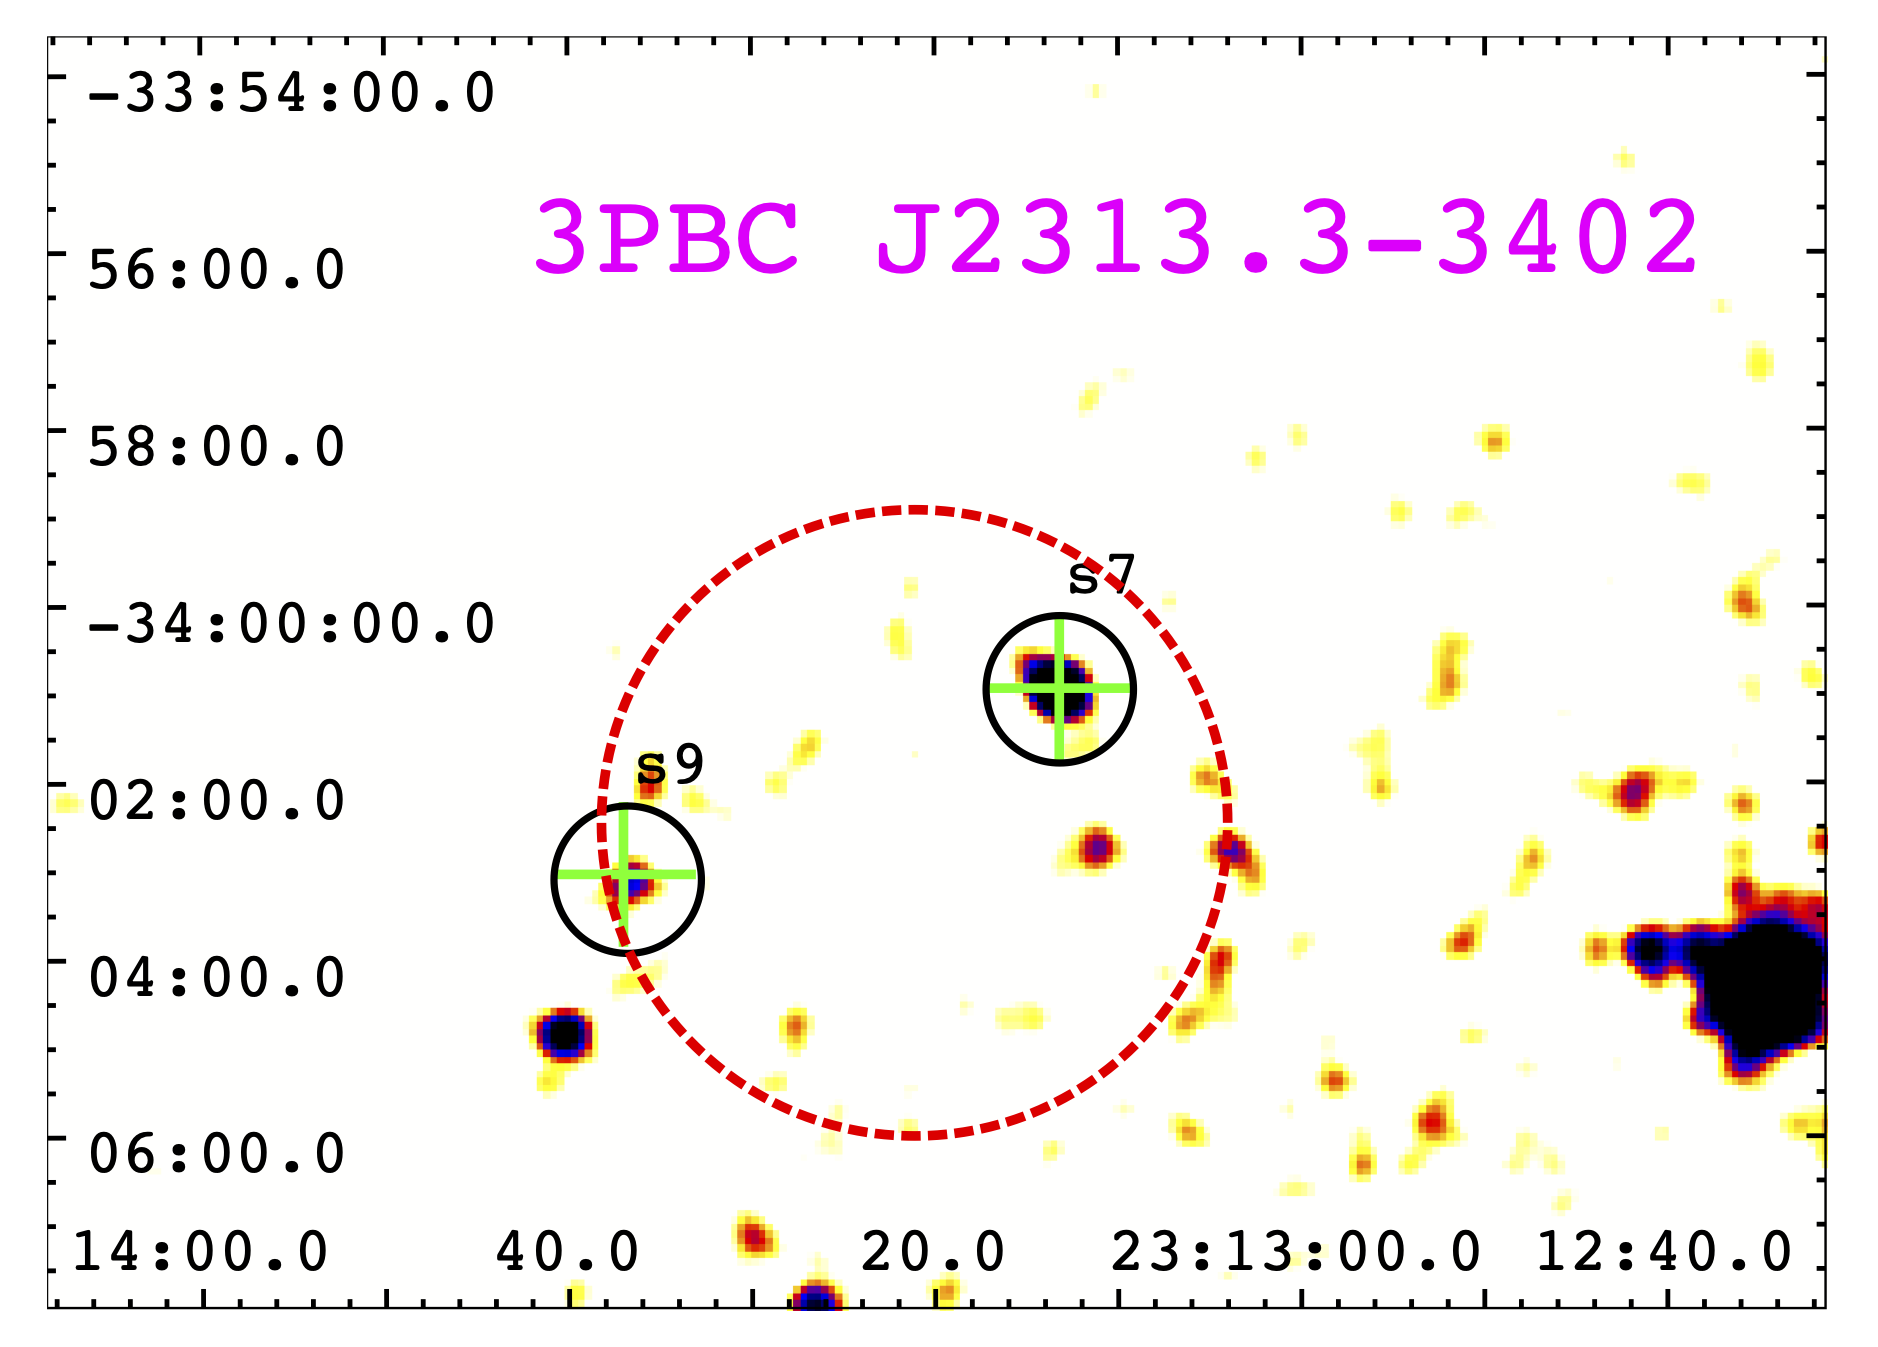
3.3.13 3PBCJ2313.3-3402
This source Fig. 4 has two XRT PC counterparts, s7, and s9, with the brightest being the former, with an S/N of . Both sources are detected by WISE (J231313.21-340056.2 and J231337.01-340302.1), although the fainter s9 only has an upper limit in and bands.
3.4 Comparison with 2SXPS
Finally, we compared our results with those that can be obtained by simply crossmatching all 218 hard X-ray sources listed in the 3PBC with the latest release of the Second Swift-XRT Point Source Catalog555https://heasarc.gsfc.nasa.gov/W3Browse/swift/swift2sxps.html (2SXPS Evans et al., 2020). The 2SXPS catalog has a sky coverage of , listing 206,335 point sources detected by XRT in the keV energy range. Here, we briefly summarize the procedure used to build the 2SXPS.
The 2SXPS was built based on all XRT observations taken between 2005, January 1st, and 2018, August 1st, with an exposure of at least 100 s in PC (photon-counting) mode. Source detection was performed with the sliding-cell technique with a S/N threshold set to , in comparison to our choice of S/N = 3, yielding the final catalog of XRT PC sources listed in the 2SXPS. The catalog contains a “clean” subsample, listing sources without analysis flags (see (Evans et al., 2020) for more details). In the following, we will consider this “clean” subsample.
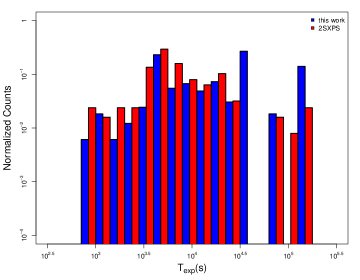
Due to the different dataset and analysis procedures used in the present work and in Evans et al. (2020), we expect differences in the XRT PC source detections. In fact, cross-matching the 2SXPS “clean” sample with the 3PBC sources considered here (see Sect. 2.1), taking into account both BAT and 2SXPS positional uncertainties, we find 126 2SXPS counterparts to 90 3PBC sources, 68 3PBC sources with a single 2SXPS match and 22 3PBC sources with multiple 2SXPS matches. In the left panel of Fig. 5, we compare the exposures of the XRT PC observations used in the present analysis (blue distribution) and in the 2SXPS observations for which we find the 126 2SXPS counterparts to the 3PBC sources considered in this work. We see that 2SXPS datasets and the dataset used in our analysis span a similar exposure range.
In addition, we find XRT PC counterparts to 7 3PBC sources without 2SXPS counterparts, while in the 2SXPS catalog, there are counterparts to 22 3PBC sources for which we did not find XRT PC counterparts. However, we note that the S/Ns for these 22 sources are less than , below the S/N threshold of that we adopted for the present analysis. In addition, we find 78 sources positionally compatible between our sample of 93 XRT PC sources and the 126 2SXPS counterparts to the 3PBC sources.
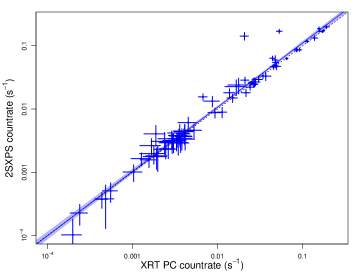
In the right panel of Fig. 5, we compare the count rate evaluated in the present analysis with the count rate reported in the 2SXPS catalog for these 78 common sources. We stress that to account for the different energy bands adopted in the present analysis () and in the 2SXPS catalog (), we rescaled the count rate of the 2SXPS catalog by a factor evaluated via PIMMS666https://cxc.harvard.edu/toolkit/pimms.jsp tool assuming a power-law spectrum with a slope. We see that the two estimates are in good agreement at low count rate values (). In contrast, above , the 2SXPS count rates appear systematically larger than those evaluated in the present analysis. The two-count rate estimates, however, are compatible at level. The maximum deviation below 10-3 cps is 0.34 , while above 10-2 cps this reaches 1.95 . In addition, below 1.8-4 cps, the best-fit line is systematically below the relation, while above 1.8-4 cps, the best-fit line is systematically above the relation.
4 Multifrequency Comparison
To search for additional information regarding all detected soft X-ray candidate counterparts we crossmatched their position, derived with the xrtcentroid task - taking into account their positional uncertainties - with three main catalogs/surveys: (i) the NASA Extragalactic Database (NED)777http://ned.ipac.caltech.edu; (ii) the SIMBAD Astronomical Database888http://simbad.u-strasbg.fr/simbad/ as well as (iii) the ALLWISE catalog (Cutri et al., 2021) based on the all-sky survey performed with WISE telescope (Wright et al., 2010) and (iv) the spectroscopic catalog of the Sloan Digital Sky Survey (SDSS) data release 16 (DR16) (Blanton et al., 2017). We used the positional uncertainty region of the Swift-XRT for all soft X-ray detected sources to search and claim an association with its wise counterpart.
Our crossmatching analysis revealed that 84 of 93 soft X-ray potential counterparts have an identification reported in NED. In addition, 74 of the 93 have photometry available in WISE. We found that 10 out of the 93 have spectra in the SDSS DR16. We classified them according to their spectral characteristics and we report the results in Tab. 5.
4.1 A mid-infrared perspective
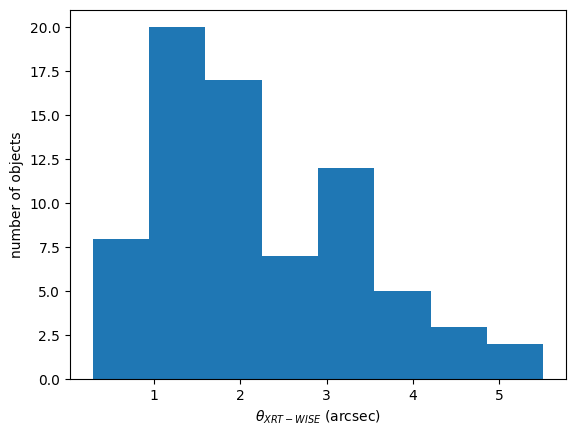
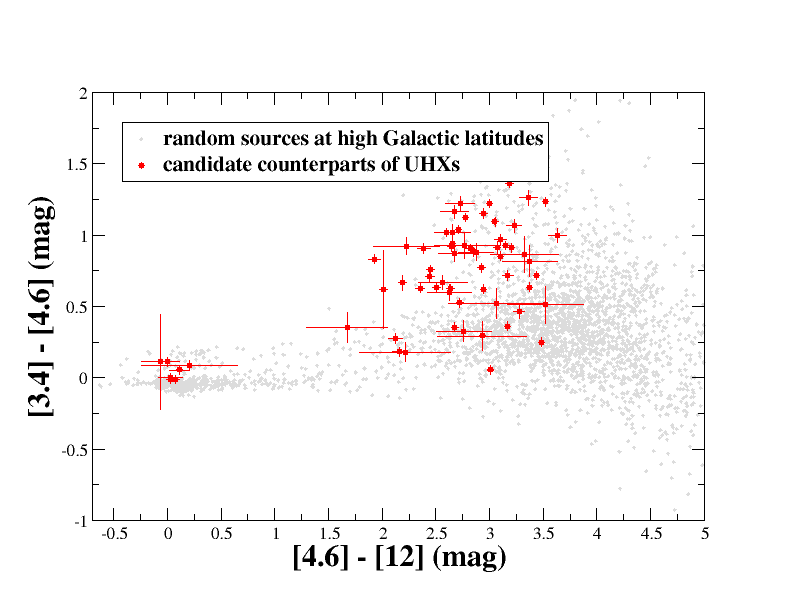
From the 93 detected soft X-ray possible counterparts corresponding to the 73 unique 3PBC sources, 74 sources have been detected in at least one WISE band. There are 74 sources detected in both the W1 and W2 bands, 66 in W3, and 52 in W4. Fig. 6 shows the distribution of the angular separation between the Swift-XRT centroid and the WISE centroid of the 74 counterparts that have the WISE detection. We took all sources that are detected in the W1, W2, and W3 bands, so 66 sources, and plotted them on a color-color diagram (Fig. 7). The gray background sources in Fig. 7 are 3 000 WISE sources in the mid-IR sky selected randomly in a region of 0.5 deg radius around Galactic coordinates (50.411113,-45.668864) and (50.411113,45.668864). The black dots correspond to the 66 Swift-XRT detected sources with reported luminosities in the first three WISE bands. The mid-IR colors of this sample of 66 sources are not in good agreement with the mid-IR colors of stars but are more consistent with AGNs, mainly Seyfert galaxies and QSOs.
4.2 Archival optical spectra
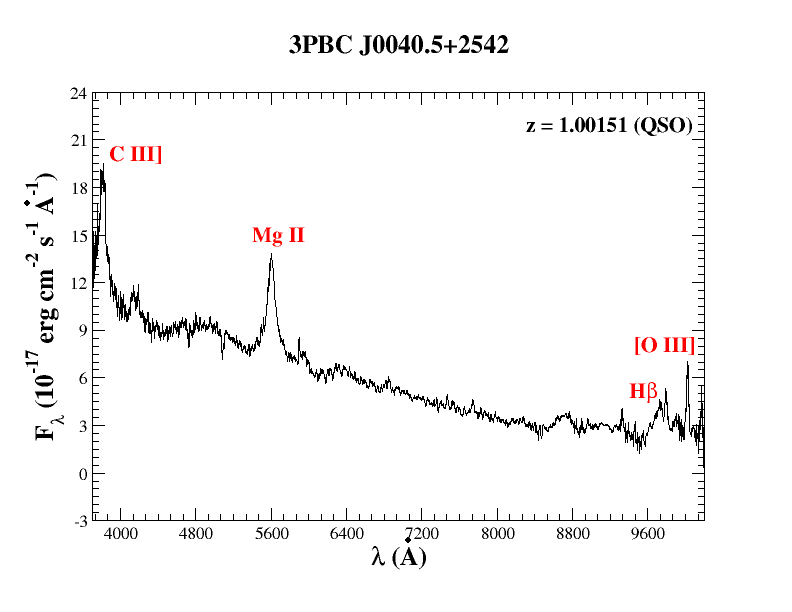
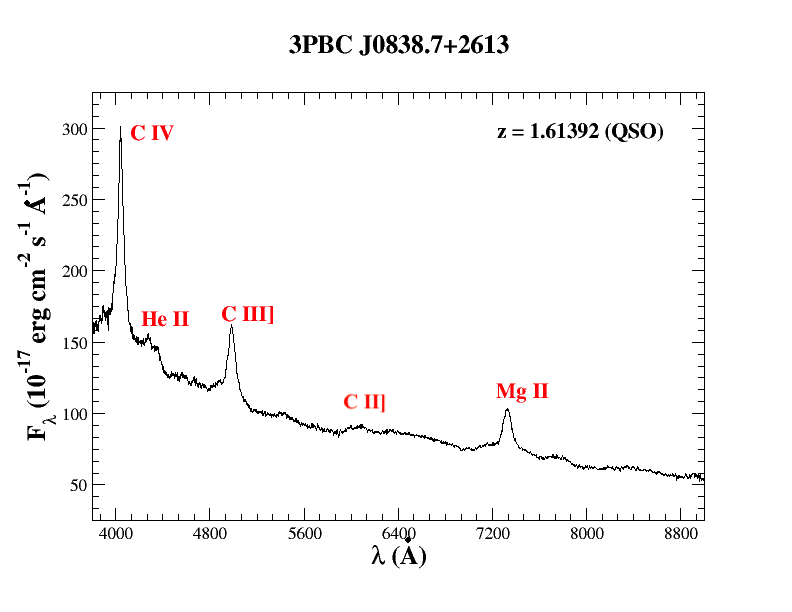
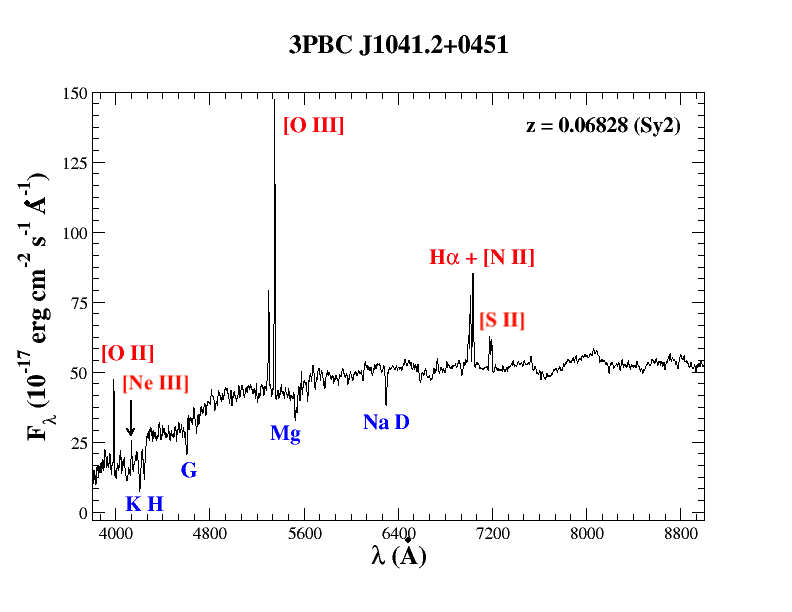
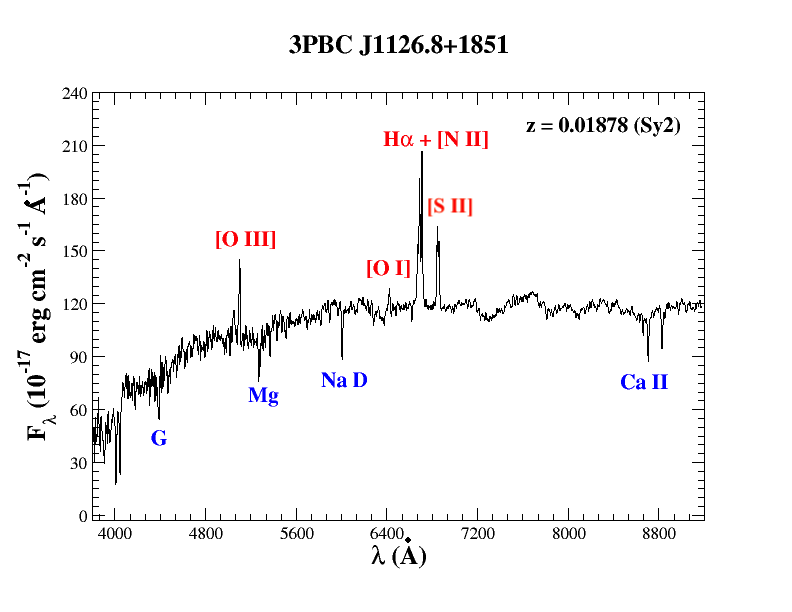
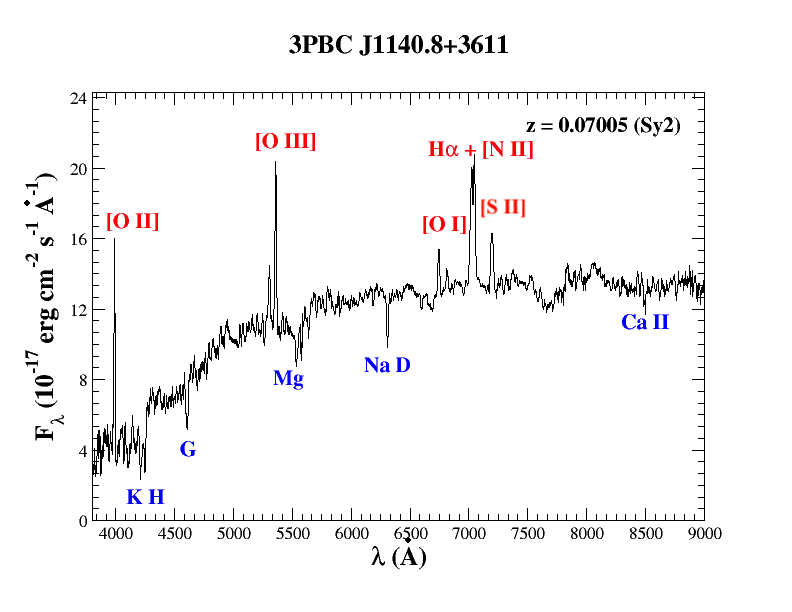
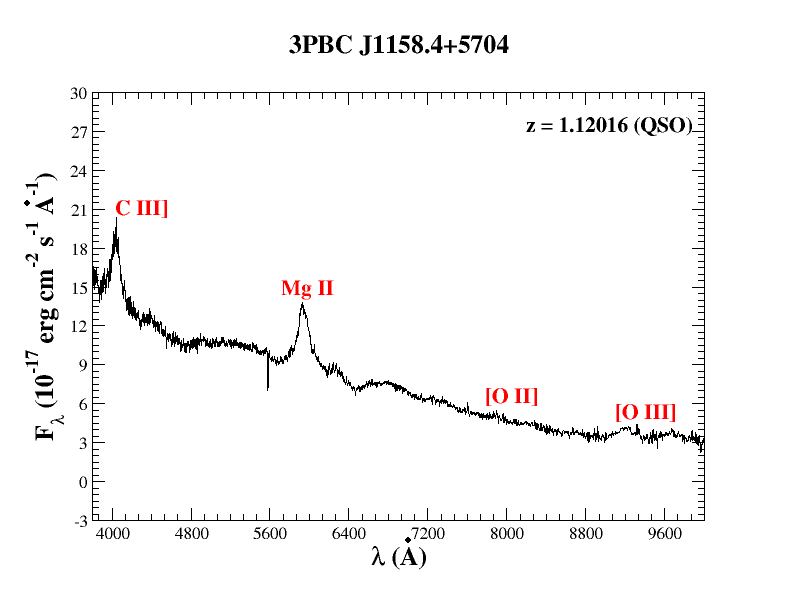
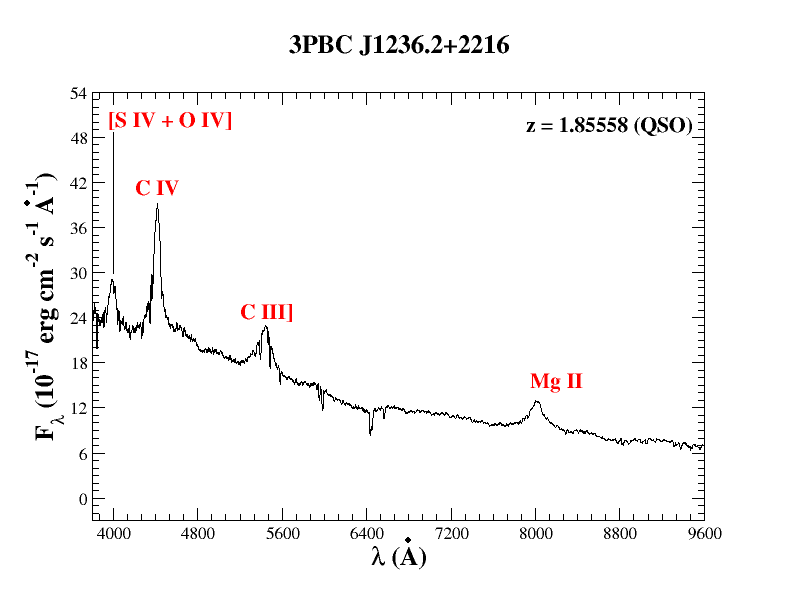
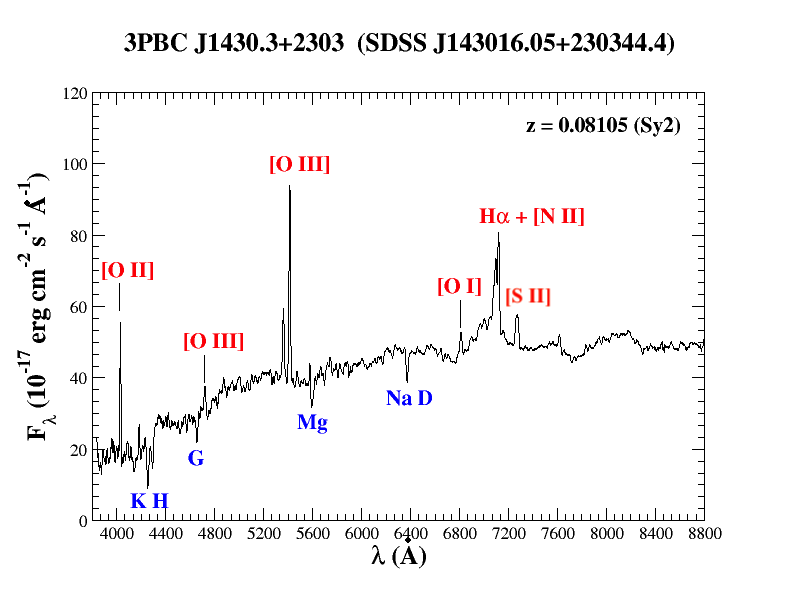
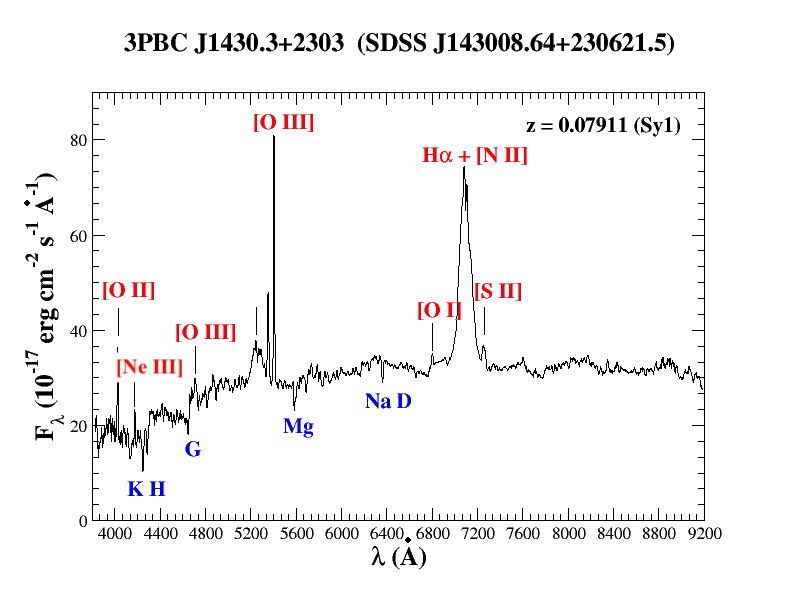
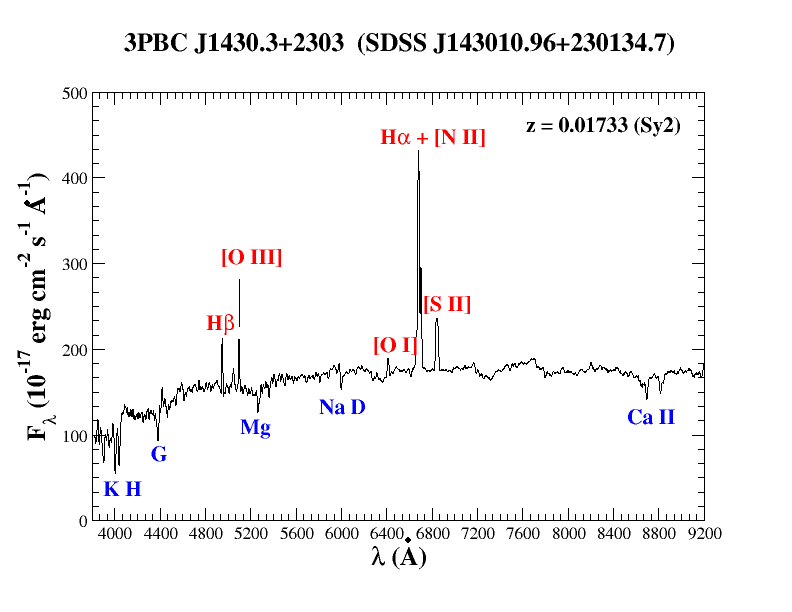
According to previous analyses carried out during past follow-up spectroscopic campaigns (see, e.g., Massaro & D’Abrusco, 2016; Peña-Herazo et al., 2020, 2022; Kosiba et al., 2023), we adopted a conservative criterion to provide spectroscopic identification of selected X-ray counterparts. We adopted the same classification scheme described in paper I, and we only considered reliable redshift measurements, those for which we could verify the presence of a published image of the optical spectrum or a description of the published spectrum with emission and/or absorption lines clearly reported in a table format or the publication manuscript. We found spectra in the SDSS DR16 archive for 10 soft X-ray sources. We show the spectra in Fig. 8 and the classification of those sources in Appendix A. The most prominent spectral lines among their spectra were the H + [N II], [O III], and [O II]. We classified four sources as AGN Type 2, one as AGN Type 1, four as QSOs and one as a star-forming galaxy, which agrees with the WISE colors of all sources and previous results.
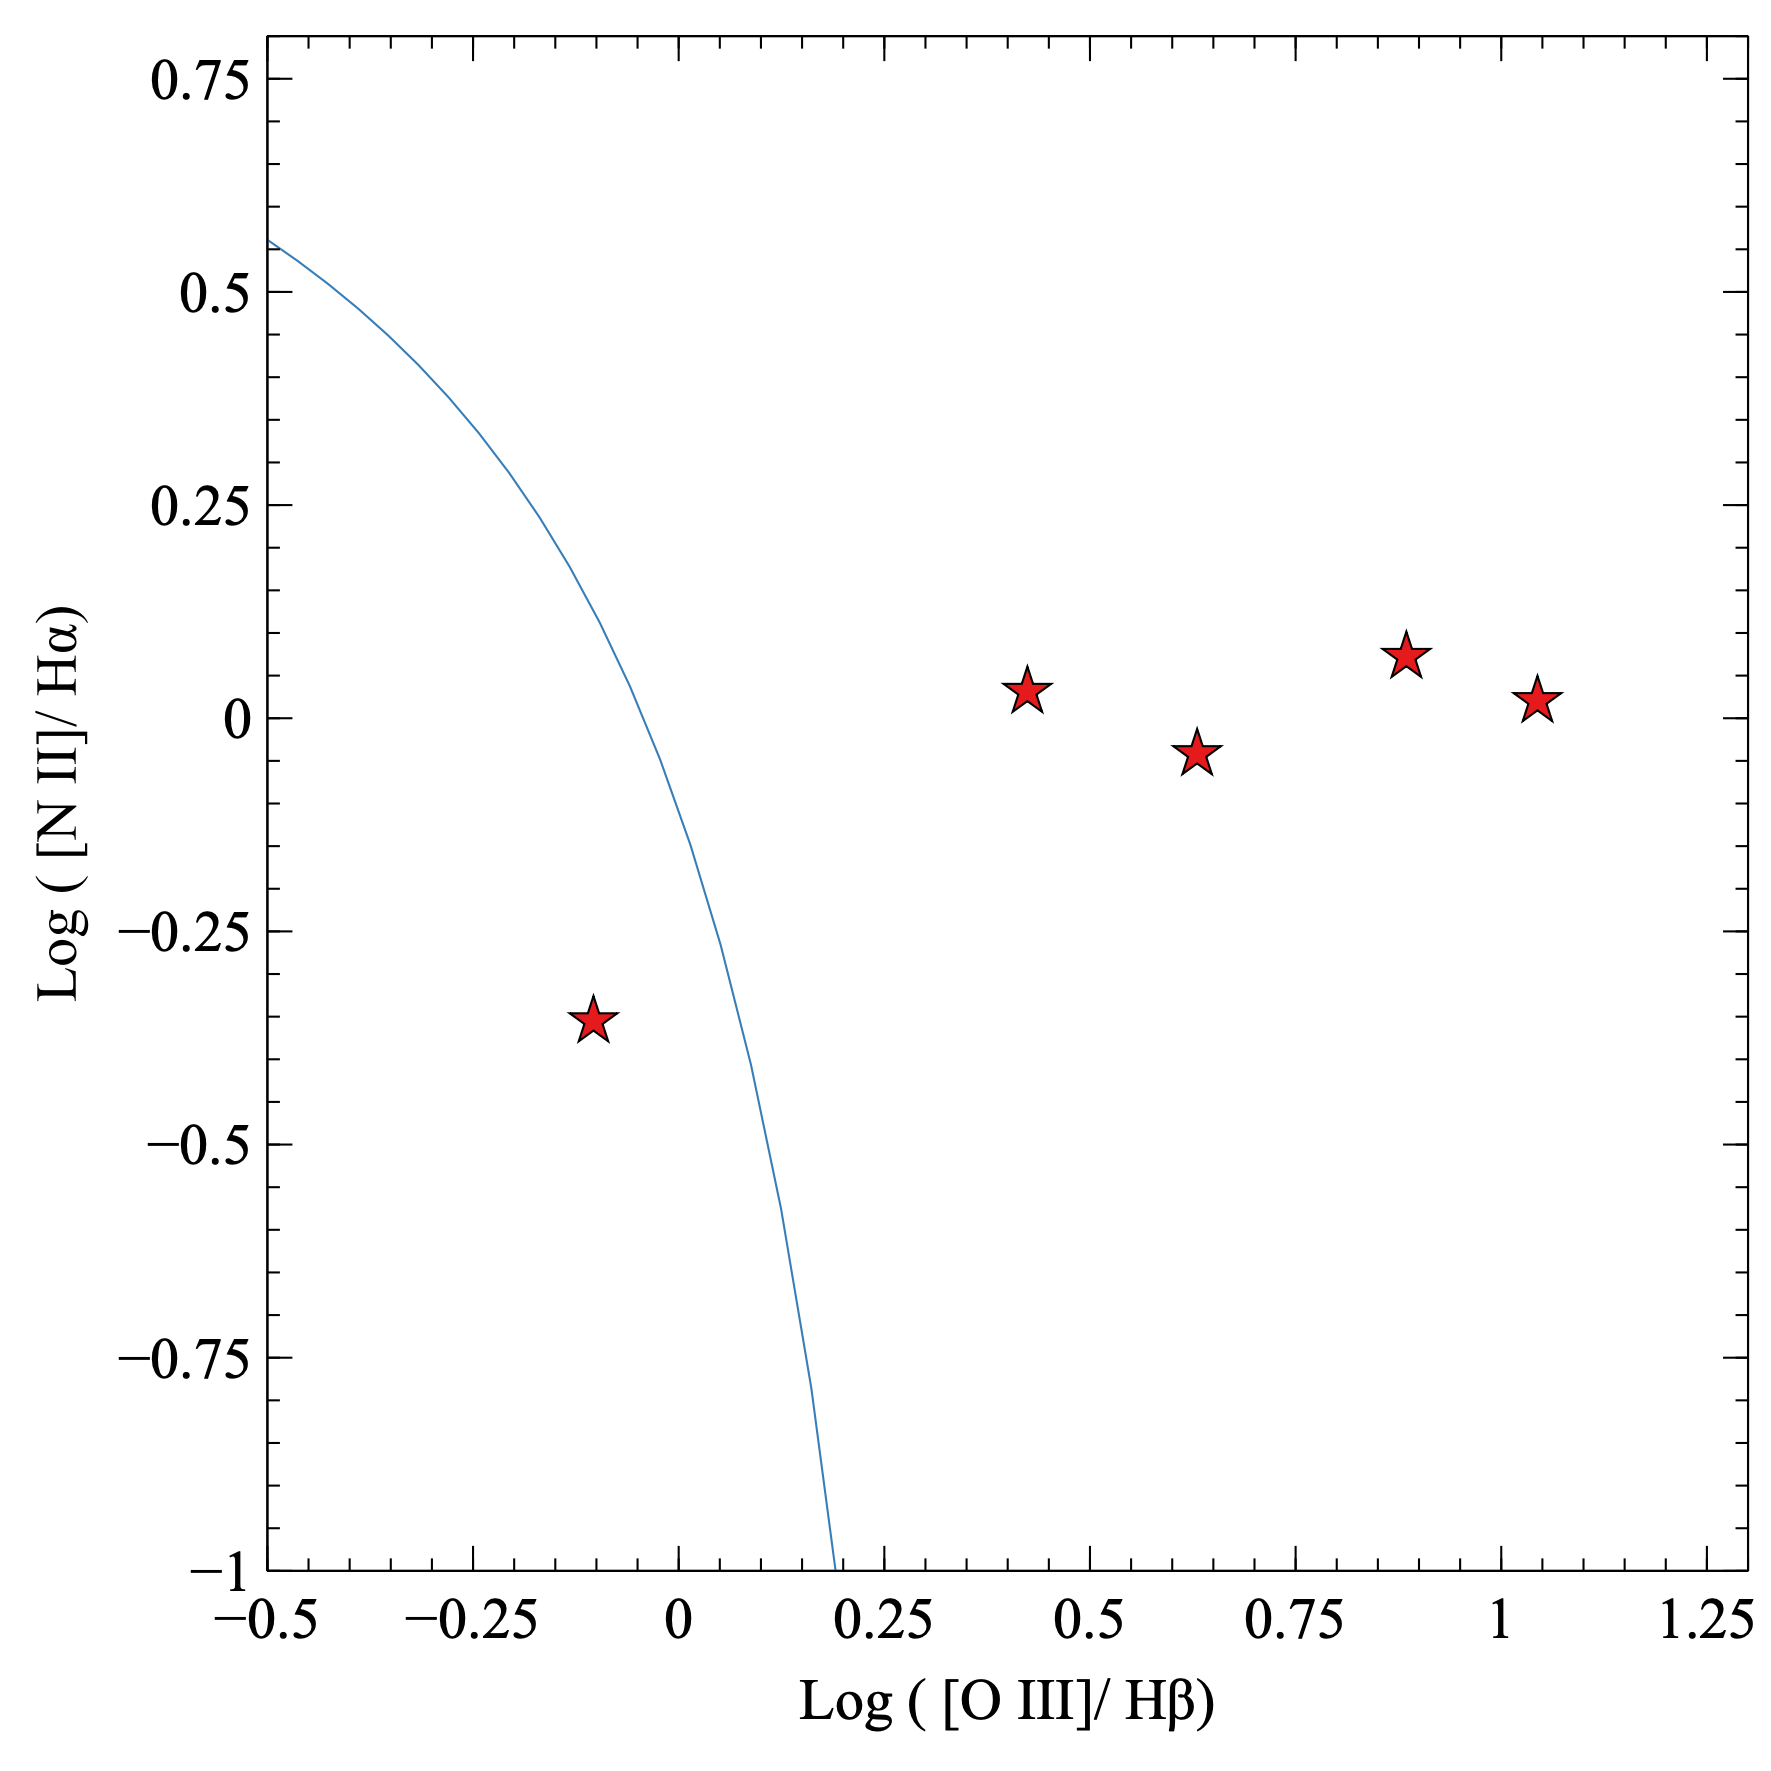
Additionally, we compute the Baldwin, Phillips & Terlevich (BPT) diagrams (Baldwin et al., 1981) for sources with narrow lines with the objective of classifying them as either Seyfert 2 or star-forming galaxies. We present the BPT diagram in Figure 9. Our findings indicate that all narrow-line sources, except for SDSS J143010.96+230134.7, fall outside the region corresponding to star-forming galaxies on the plot. This region is delineated by the theoretical line of (Kewley et al., 2001, 2013). Consequently, we classify these sources as Seyfert 2 galaxies. For 3PBCJ1504.1-6019 and 3PBCJ0800.7-4308, the analysis we carried out is in agreement with that of Landi et al. (2017), since we found the same soft X-ray sources lying within the positional uncertainty of these BAT unidentified objects. Inspecting NED and SIMBAD databases, we found the spectra for the soft X-ray counterparts of the UHXs 3PBCJ1329.7-1052 and 3PBCJ1854.4-3436. These are MCG -02-34-058 and ESO 396- G 007, lying at z=0.021648 and z=0.019483 (Jones et al., 2009), respectively. The Swift-XRT counterparts we assigned for the sources 3PBCJ2136.1+2002, 3PBCJ2155.3+6204, and 3PBCJ2238.8+4050 are the same as previously assigned in the literature at which optical spectroscopic follow-up observations revealed these to be three active galaxies lying at z=0.081 (Sy1), z=0.058 (Sy1) and z=0.055 (LINER), respectively, as reported in (Rojas et al., 2017). The yet unidentified source 3PBCJ0024.1-6823 having the Swift-XRT counterpart SWXRTJ002406.457-682052.549 could also be associated with the radio source PKS 0021-686, a gamma-ray blazar candidate selected based on its mid-IR colors (D’Abrusco et al., 2012, 2014, 2019).
5 Summary and Conclusions
The main goal of the present analysis is to prepare a catalog of candidate soft X-ray Swift-XRT counterparts detected in the 0.5–10 keV energy range to list potential targets for the optical spectroscopic campaign, aiming at the classification of the yet unknown sources in the hard X-ray sky so we could obtain a more complete overview of it. We found archival Swift-XRT observations for 192 of the 218 3PBC sources marked as unidentified in our previous analyses. Those were the hard X-ray sources lacking an assigned low-energy counterpart. In this work, we searched for possible counterparts at soft X-ray energies for those 192 3PBC sources. If found, we carried out the literature search and multiwavelength analyses as done in paper I.
We found that only in 172 out of 192 sources, there is at least one soft X-ray detected source above our S/N threshold of 3 present in the cleaned and merged event file, and only in 73 of the 3PBC sources we find at least one soft X-ray candidate counterpart detected within the BAT positional uncertainty region. In particular, for 13 3PBC sources, there are multiple detected soft X-ray objects, while all remaining 60 3PBC sources have only a single Swift-XRT detected object. Thus, including multiple matches, the total number of Swift-XRT detected possible counterparts inside the BAT positional uncertainty, listed in our final catalog, is 93, sampling 73 3PBC hard X-ray sources.
Our X-ray results are in agreement with those achieved simply crossmatching the catalog of 3PBC unidentified sources with the 2SXPS, with only marginal differences, as reported in Section 3 mainly due to (i) longer exposure times and new observations collected after its release that were considered in our analysis and (ii) a small difference in the detection threshold chosen between the two analyses.
We found available spectra in the literature for 10 detected counterparts. For those, we carried the same multifrequency analyses as in paper I. We found four sources to be quasars, four sources to be Type 2 AGN, and one source to be Type 1 AGN, and one star-forming galaxy. The present analyses thus decreased the 218 3PBC unidentified hard X-ray sources sample to 143, which remain unidentified, lacking any low-frequency counterpart. This corresponds to a decrease by a factor of 34 %. From the 73 3PBC sources for which we found at least one assigned candidate counterpart, 10 were classified according to our multifrequency criteria, becoming identified. The remaining 65 sources are left as unclassified, indicating that they lack spectroscopic information for their classification and are thus excellent candidates for future spectroscopic follow-up observations.
Along with this publication, we provide a catalog table of all 93 soft X-ray detections and a short table with our classification of the sources with spectra. The soft X-ray sources we found in this analysis can be targets of future spectroscopic campaigns aimed at classifying them to obtain redshift values and confirm that most of those having mid-IR detection are AGNs, as expected by the mid-IR plot.
Acknowledgements.
M. K. and N. W. are supported by the GACR grant 21-13491X. E. B. acknowledges NASA grant 80NSSC21K0653. M. K. was supported by the Italian Government Scholarship issued by the Italian MAECI. This work was partially supported by CONACyT (National Council of Science and Technology) research grants 280789 (Mexico) Funding for the Sloan Digital Sky Survey V has been provided by the Alfred P. Sloan Foundation, the Heising-Simons Foundation, the National Science Foundation, and the Participating Institutions. SDSS acknowledges support and resources from the Center for High-Performance Computing at the University of Utah. The SDSS web site is www.sdss.org. SDSS is managed by the Astrophysical Research Consortium for the Participating Institutions of the SDSS Collaboration including the Brazilian Participation Group, the Carnegie Institution for Science, Carnegie Mellon University, Center for Astrophysics — Harvard & Smithsonian (CfA), the Chilean Participation Group, the French Participation Group, Instituto de Astrofísica de Canarias, The Johns Hopkins University, Kavli Institute for the Physics and Mathematics of the Universe (IPMU) / University of Tokyo, the Korean Participation Group, Lawrence Berkeley National Laboratory, Leibniz Institut für Astrophysik Potsdam (AIP), Max-Planck-Institut für Astronomie (MPIA Heidelberg), Max-Planck-Institut für Astrophysik (MPA Garching), Max-Planck-Institut für Extraterrestrische Physik (MPE), National Astronomical Observatories of China, New Mexico State University, New York University, University of Notre Dame, Observatório Nacional / MCTI, The Ohio State University, Pennsylvania State University, Shanghai Astronomical Observatory, United Kingdom Participation Group, Universidad Nacional Autónoma de México, University of Arizona, University of Colorado Boulder, University of Oxford, University of Portsmouth, University of Utah, University of Virginia, University of Washington, University of Wisconsin, Vanderbilt University, and Yale University.References
- Baldwin et al. (1981) Baldwin, J. A., Phillips, M. M., & Terlevich, R. 1981, PASP, 93, 5
- Bär et al. (2019) Bär, R. E., Trakhtenbrot, B., Oh, K., et al. 2019, MNRAS, 489, 3073
- Barthelmy (2004) Barthelmy, S. D. 2004, in Society of Photo-Optical Instrumentation Engineers (SPIE) Conference Series, Vol. 5165, X-Ray and Gamma-Ray Instrumentation for Astronomy XIII, ed. K. A. Flanagan & O. H. W. Siegmund, 175–189
- Beckmann et al. (2006) Beckmann, V., Soldi, S., Shrader, C. R., Gehrels, N., & Produit, N. 2006, ApJ, 652, 126
- Bennett et al. (2014) Bennett, C. L., Larson, D., Weiland, J. L., & Hinshaw, G. 2014, ApJ, 794, 135
- Bird et al. (2016) Bird, A. J., Bazzano, A., Malizia, A., et al. 2016, ApJS, 223, 15
- Blanton et al. (2017) Blanton, M. R., Bershady, M. A., Abolfathi, B., et al. 2017, AJ, 154, 28
- Bottacini et al. (2012) Bottacini, E., Ajello, M., & Greiner, J. 2012, ApJS, 201, 34
- Burrows et al. (2005) Burrows, D. N., Hill, J. E., Nousek, J. A., et al. 2005, Space Sci. Rev., 120, 165
- Churazov et al. (2007) Churazov, E., Sunyaev, R., Revnivtsev, M., et al. 2007, A&A, 467, 529
- Cusumano et al. (2010) Cusumano, G., La Parola, V., Segreto, A., et al. 2010, A&A, 524, A64
- Cutri et al. (2021) Cutri, R. M., Wright, E. L., Conrow, T., et al. 2021, VizieR Online Data Catalog, II/328
- D’Abrusco et al. (2019) D’Abrusco, R., Álvarez Crespo, N., Massaro, F., et al. 2019, ApJS, 242, 4
- D’Abrusco et al. (2012) D’Abrusco, R., Massaro, F., Ajello, M., et al. 2012, ApJ, 748, 68
- D’Abrusco et al. (2014) D’Abrusco, R., Massaro, F., Paggi, A., et al. 2014, ApJS, 215, 14
- D’Elia et al. (2013) D’Elia, V., Perri, M., Puccetti, S., et al. 2013, A&A, 551, A142
- Evans et al. (2014) Evans, P. A., Osborne, J. P., Beardmore, A. P., et al. 2014, ApJS, 210, 8
- Evans et al. (2020) Evans, P. A., Page, K. L., Osborne, J. P., et al. 2020, ApJS, 247, 54
- Forman et al. (1978) Forman, W., Jones, C., Cominsky, L., et al. 1978, ApJS, 38, 357
- Gehrels et al. (2004) Gehrels, N., Chincarini, G., Giommi, P., et al. 2004, ApJ, 611, 1005
- Giacconi et al. (1979) Giacconi, R., Branduardi, G., Briel, U., et al. 1979, ApJ, 230, 540
- Giacconi et al. (1971) Giacconi, R., Kellogg, E., Gorenstein, P., Gursky, H., & Tananbaum, H. 1971, ApJ, 165, L27
- Giommi et al. (1992a) Giommi, P., Angelini, L., Jacobs, P., & Tagliaferri, G. 1992a, in Astronomical Society of the Pacific Conference Series, Vol. 25, Astronomical Data Analysis Software and Systems I, ed. D. M. Worrall, C. Biemesderfer, & J. Barnes, 100
- Giommi et al. (1992b) Giommi, P., Angelini, L., Jacobs, P., & Tagliaferri, G. 1992b, in Astronomical Society of the Pacific Conference Series, Vol. 25, Astronomical Data Analysis Software and Systems I, ed. D. M. Worrall, C. Biemesderfer, & J. Barnes, 100
- Hasinger et al. (1999) Hasinger, G., Lehmann, I., Giacconi, R., et al. 1999, in Highlights in X-ray Astronomy, ed. B. Aschenbach & M. J. Freyberg, Vol. 272, 199
- Jansen et al. (2001) Jansen, F., Lumb, D., Altieri, B., et al. 2001, A&A, 365, L1
- Jones et al. (2009) Jones, D. H., Read, M. A., Saunders, W., et al. 2009, MNRAS, 399, 683
- Kewley et al. (2001) Kewley, L. J., Dopita, M. A., Sutherland, R. S., Heisler, C. A., & Trevena, J. 2001, ApJ, 556, 121
- Kewley et al. (2013) Kewley, L. J., Maier, C., Yabe, K., et al. 2013, ApJ, 774, L10
- Kosiba et al. (2023) Kosiba, M., Peña-Herazo, H. A., Massaro, F., et al. 2023, A&A, 670, A171
- Koss et al. (2017) Koss, M., Trakhtenbrot, B., Ricci, C., et al. 2017, ApJ, 850, 74
- Koss et al. (2019) Koss, M., Trakhtenbrot, B., Ricci, C., et al. 2019, in American Astronomical Society Meeting Abstracts, Vol. 233, American Astronomical Society Meeting Abstracts #233, 431.04
- Koss et al. (2022) Koss, M. J., Ricci, C., Trakhtenbrot, B., et al. 2022, ApJS, 261, 2
- Krivonos et al. (2007) Krivonos, R., Revnivtsev, M., Lutovinov, A., et al. 2007, A&A, 475, 775
- Krivonos et al. (2015) Krivonos, R., Tsygankov, S., Lutovinov, A., et al. 2015, MNRAS, 448, 3766
- Krivonos et al. (2021) Krivonos, R. A., Bird, A. J., Churazov, E. M., et al. 2021, New A Rev., 92, 101612
- Krivonos et al. (2022) Krivonos, R. A., Sazonov, S. Y., Kuznetsova, E. A., et al. 2022, MNRAS, 510, 4796
- Krivonos et al. (2017) Krivonos, R. A., Tsygankov, S. S., Mereminskiy, I. A., et al. 2017, MNRAS, 470, 512
- Landi et al. (2017) Landi, R., Bassani, L., Bazzano, A., et al. 2017, MNRAS, 470, 1107
- Levine et al. (1984) Levine, A. M., Lang, F. L., Lewin, W. H. G., et al. 1984, ApJS, 54, 581
- Lien et al. (2023) Lien, A., Krimm, H., Markwardt, C., et al. 2023, in American Astronomical Society Meeting Abstracts, Vol. 55, American Astronomical Society Meeting Abstracts, 254.07
- Malizia et al. (2010) Malizia, A., Bassani, L., Sguera, V., et al. 2010, MNRAS, 408, 975
- Marchesini et al. (2019a) Marchesini, E. J., Masetti, N., Palazzi, E., et al. 2019a, Ap&SS, 364, 153
- Marchesini et al. (2020) Marchesini, E. J., Paggi, A., Massaro, F., et al. 2020, A&A, 638, A128
- Marchesini et al. (2019b) Marchesini, E. J., Paggi, A., Massaro, F., et al. 2019b, A&A, 631, A150
- Markwardt et al. (2005) Markwardt, C. B., Tueller, J., Skinner, G. K., et al. 2005, ApJ, 633, L77
- Marscher & Gear (1985) Marscher, A. P. & Gear, W. K. 1985, ApJ, 298, 114
- Marscher & Travis (1996) Marscher, A. P. & Travis, J. P. 1996, A&AS, 120, 537
- Masetti et al. (2006a) Masetti, N., Mason, E., Bassani, L., et al. 2006a, A&A, 448, 547
- Masetti et al. (2008) Masetti, N., Mason, E., Morelli, L., et al. 2008, A&A, 482, 113
- Masetti et al. (2006b) Masetti, N., Morelli, L., Palazzi, E., et al. 2006b, A&A, 459, 21
- Masetti et al. (2012) Masetti, N., Parisi, P., Jiménez-Bailón, E., et al. 2012, A&A, 538, A123
- Masetti et al. (2013) Masetti, N., Parisi, P., Palazzi, E., et al. 2013, A&A, 556, A120
- Massaro et al. (2006) Massaro, E., Tramacere, A., Perri, M., Giommi, P., & Tosti, G. 2006, A&A, 448, 861
- Massaro & D’Abrusco (2016) Massaro, F. & D’Abrusco, R. 2016, ApJ, 827, 67
- Massaro et al. (2008a) Massaro, F., Giommi, P., Tosti, G., et al. 2008a, A&A, 489, 1047
- Massaro et al. (2008b) Massaro, F., Tramacere, A., Cavaliere, A., Perri, M., & Giommi, P. 2008b, A&A, 478, 395
- Massaro et al. (2023a) Massaro, F., White, S. V., García-Pérez, A., et al. 2023a, ApJS, 265, 32
- Massaro et al. (2023b) Massaro, F., White, S. V., Paggi, A., et al. 2023b, ApJS, 268, 32
- Mereminskiy et al. (2016) Mereminskiy, I. A., Krivonos, R. A., Lutovinov, A. A., et al. 2016, MNRAS, 459, 140
- Nasa High Energy Astrophysics Science Archive Research Center (2014) (Heasarc) Nasa High Energy Astrophysics Science Archive Research Center (Heasarc). 2014, HEAsoft: Unified Release of FTOOLS and XANADU, Astrophysics Source Code Library, record ascl:1408.004
- Oh et al. (2018) Oh, K., Koss, M., Markwardt, C. B., et al. 2018, ApJS, 235, 4
- Paggi et al. (2013) Paggi, A., Massaro, F., D’Abrusco, R., et al. 2013, ApJS, 209, 9
- Parisi et al. (2014) Parisi, P., Masetti, N., Rojas, A. F., et al. 2014, A&A, 561, A67
- Peña-Herazo et al. (2020) Peña-Herazo, H. A., Amaya-Almazán, R. A., Massaro, F., et al. 2020, A&A, 643, A103
- Peña-Herazo et al. (2022) Peña-Herazo, H. A., Massaro, F., Chavushyan, V., et al. 2022, A&A, 659, A32
- Rojas et al. (2017) Rojas, A. F., Masetti, N., Minniti, D., et al. 2017, A&A, 602, A124
- Rothschild et al. (1979) Rothschild, R., Boldt, E., Holt, S., et al. 1979, Space Science Instrumentation, 4, 269
- Sazonov et al. (2007) Sazonov, S., Revnivtsev, M., Krivonos, R., Churazov, E., & Sunyaev, R. 2007, A&A, 462, 57
- Smith et al. (2020) Smith, K. L., Mushotzky, R. F., Koss, M., et al. 2020, MNRAS, 492, 4216
- Strauss et al. (1992) Strauss, M. A., Huchra, J. P., Davis, M., et al. 1992, ApJS, 83, 29
- Tomsick et al. (2020) Tomsick, J. A., Bodaghee, A., Chaty, S., et al. 2020, The Astrophysical Journal, 889, 53
- Tueller et al. (2008) Tueller, J., Mushotzky, R. F., Barthelmy, S., et al. 2008, ApJ, 681, 113
- Ubertini et al. (2003) Ubertini, P., Lebrun, F., Di Cocco, G., et al. 2003, A&A, 411, L131
- Weisskopf et al. (2000) Weisskopf, M. C., Tananbaum, H. D., Van Speybroeck, L. P., & O’Dell, S. L. 2000, in Society of Photo-Optical Instrumentation Engineers (SPIE) Conference Series, Vol. 4012, X-Ray Optics, Instruments, and Missions III, ed. J. E. Truemper & B. Aschenbach, 2–16
- Winkler et al. (2003) Winkler, C., Courvoisier, T. J. L., Di Cocco, G., et al. 2003, A&A, 411, L1
- Wright et al. (2010) Wright, E. L., Eisenhardt, P. R. M., Mainzer, A. K., et al. 2010, AJ, 140, 1868
Appendix A 1. Catalog of soft Swift-XRT candidate counterparts of the UHXs
Here we report the first 10 lines of the two main tables, showing parameters derived from our analysis, for soft X-ray sources detected by Swift-XRT that could be candidate counterparts of the sample of unidentified 3PBC hard X-ray sources,
Here, we report our final catalog table, showing parameters derived from our analysis for 93 soft X-ray sources detected by Swift-XRT that could be candidate counterparts of the sample of unidentified 3PBC hard X-ray sources we analyzed in our study. The catalog table is split into 4 tables due to its size. Tab. 1 lists the first 7 columns of the first 50 rows, the Tab. 2 lists the first 7 columns of the second half, the last 43 rows. Tab. 3 lists the last 8 columns of the first 50 rows, and the Tab. 4 lists the remaining 43 rows of the last 8 columns. Together, the catalog table contains 15 columns and 93 rows.
Complementary to the Fig. 8 and Sec. 4.2, we provide here a table of our spectral classification of the 10 sources for which we found available spectra in the SDSS archive (Tab. 5).
| 3PBC name | XRT detection | XDF | RA centroid | DEC centroid | ||
|---|---|---|---|---|---|---|
| hh:mm:ss.ss | dd:mm:ss.ss | arcsec | arcsec | |||
| J0016.7-2611 | J001637.005-261425.118 | x | 00:16:37.14 | -26:14:26.22 | 4.8 | 193.5 |
| J0022.2+2539 | J002203.037+254003.324 | m | 00:22:03.09 | 25:40:02.51 | 3.6 | 134.1 |
| J0022.2+2539 | J002208.994+254004.792 | m | 00:22:09.44 | 25:39:57.24 | 4.3 | 59.9 |
| J0022.2+2539 | J002211.671+253830.384 | m | 00:22:11.73 | 25:38:31.64 | 5.0 | 39.8 |
| J0024.1-6823 | J002406.457-682052.549 | x | 00:24:06.47 | -68:20:52.42 | 3.8 | 141.1 |
| J0040.5+2542 | J004024.511+254302.390 | x | 00:40:24.5 | 25:43:03.91 | 5.6 | 133.0 |
| J0122.0-6105 | J012204.938-610706.365 | x | 01:22:05.08 | -61:07:07.16 | 4.0 | 103.4 |
| J0132.5-7426 | J013251.760-742547.319 | x | 01:32:52.0 | -74:25:47.2 | 3.7 | 102.6 |
| J0154.1-5034 | J015422.390-503235.190 | x | 01:54:22.34 | -50:32:41.76 | 5.4 | 166.4 |
| J0158.9+2644 | J015848.911+264247.120 | x | 01:58:48.68 | 26:42:47.38 | 5.8 | 115.1 |
| J0208.0-2904 | J020803.559-290409.558 | x | 02:08:03.71 | -29:04:07.11 | 5.4 | 30.3 |
| J0218.5-5005 | J021820.926-500642.137 | m | 02:18:21.06 | -50:06:43.34 | 3.8 | 135.7 |
| J0218.5-5005 | J021822.887-500557.535 | m | 02:18:23.02 | -50:05:58.82 | 3.8 | 95.4 |
| J0218.5-5005 | J021832.929-500650.270 | m | 02:18:32.95 | -50:06:51.49 | 3.9 | 95.2 |
| J0224.8+4525 | J022454.536+452747.735 | x | 02:24:54.54 | 45:27:47.14 | 3.7 | 132.0 |
| J0251.6+4335 | J025150.892+433654.523 | x | 02:51:50.83 | 43:36:53.45 | 4.9 | 146.6 |
| J0258.8+3545 | J025846.635+354358.068 | x | 02:58:46.87 | 35:43:59.08 | 5.6 | 115.1 |
| J0334.2-5201 | J033423.045-520421.808 | x | 03:34:23.01 | -52:04:20.45 | 5.5 | 173.0 |
| J0408.0-7912 | J040847.166-791404.530 | x | 04:08:47.44 | -79:14:05.3 | 3.8 | 149.5 |
| J0412.2+3051 | J041222.483+305236.417 | x | 04:12:22.48 | 30:52:35.48 | 4.3 | 152.9 |
| J0421.1+2603 | J042113.182+260356.044 | x | 04:21:13.26 | 26:03:53.29 | 5.4 | 87.4 |
| J0433.2-5107 | J043335.935-510604.141 | x | 04:33:35.84 | -51:06:05.82 | 5.8 | 195.8 |
| J0536.1-3205 | J053601.472-320423.246 | m | 05:36:01.33 | -32:04:23.66 | 4.6 | 104.9 |
| J0536.1-3205 | J053618.640-320530.341 | m | 05:36:18.7 | -32:05:30.4 | 4.7 | 127.1 |
| J0606.8+5651 | J060653.591+565203.444 | x | 06:06:53.36 | 56:52:03.08 | 4.8 | 60.3 |
| J0709.5-3538 | J070931.970-353745.100 | m | 07:09:31.99 | -35:37:45.25 | 3.6 | 49.6 |
| J0709.5-3538 | J070937.139-353821.510 | m | 07:09:35.92 | -35:38:18.84 | 3.6 | 51.3 |
| J0712.1+1541 | J071215.621+153930.156 | x | 07:12:15.71 | 15:39:30.07 | 3.6 | 157.7 |
| J0741.6-6724 | J074122.480-672350.269 | x | 07:41:22.24 | -67:23:51.38 | 5.4 | 103.7 |
| J0751.7+6449 | J075145.091+644901.618 | x | 07:51:45.14 | 64:49:01.89 | 4.0 | 14.1 |
| J0800.7-4308 | J080040.137-431105.341 | m | 08:00:40.16 | -43:11:07.73 | 3.6 | 169.4 |
| J0800.7-4308 | J080045.827-430937.585 | m | 08:00:45.86 | -43:09:39.1 | 4.3 | 68.0 |
| J0819.2-2509 | J081914.849-251116.953 | m | 08:19:14.91 | -25:11:16.67 | 3.8 | 84.3 |
| J0819.2-2509 | J081916.504-250706.396 | m | 08:19:16.51 | -25:07:06.23 | 4.4 | 172.1 |
| J0838.7+2613 | J083849.833+261106.829 | x | 08:38:50.05 | 26:11:08.05 | 5.4 | 120.0 |
| J0857.2+6703 | J085656.215+670256.800 | m | 08:56:56.35 | 67:02:56.11 | 3.7 | 111.6 |
| J0857.2+6703 | J085655.487+670154.512 | m | 08:56:57.42 | 67:01:53.1 | 4.3 | 140.4 |
| J0900.4-3333 | J090036.271-333420.119 | x | 09:00:36.35 | -33:34:15.99 | 5.4 | 153.0 |
| J0905.4-1502 | J090522.736-150340.357 | m | 09:05:22.53 | -15:03:40.63 | 6.6 | 116.0 |
| J0905.4-1502 | J090533.705-145953.170 | m | 09:05:33.88 | -14:59:55.68 | 6.2 | 165.7 |
| J0910.9+1033 | J091038.484+103448.245 | x | 09:10:38.48 | 10:34:51.52 | 5.1 | 274.3 |
| J1039.4-4903 | J103915.366-490302.019 | x | 10:39:15.35 | -49:03:02.23 | 3.7 | 101.9 |
| J1041.2+0451 | J104115.614+045314.284 | x | 10:41:15.74 | 04:53:15.52 | 5.4 | 88.2 |
| J1057.1-0323 | J105656.786-032141.218 | x | 10:56:56.76 | -03:21:43.11 | 5.2 | 188.2 |
| J1126.8+1851 | J112654.918+184956.112 | x | 11:26:54.87 | 18:49:54.97 | 4.3 | 105.4 |
| J1140.8+3611 | J114054.585+360956.220 | x | 11:40:54.62 | 36:09:56.37 | 4.6 | 100.0 |
| J1154.2-5018 | J115416.180-501804.204 | x | 11:54:16.23 | -50:18:04.95 | 3.9 | 50.2 |
| J1158.4+5704 | J115843.318+570538.699 | x | 11:58:43.38 | 57:05:39.5 | 4.8 | 151.3 |
| J1228.0-0926 | J122810.146-092703.684 | x | 12:28:10.2 | -09:27:04.36 | 3.8 | 99.8 |
| J1236.2+2216 | J123622.249+221833.024 | x | 12:36:22.36 | 22:18:31.42 | 5.4 | 153.9 |
| 3PBC name | XRT detection | XDF | RA centroid | DEC centroid | ||
|---|---|---|---|---|---|---|
| hh:mm:ss.ss | dd:mm:ss.ss | arcsec | arcsec | |||
| J1329.7-1052 | J132949.669-105255.343 | x | 13:29:49.47 | -10:52:54.64 | 5.2 | 53.6 |
| J1430.3+2303 | J143008.784+230620.768 | m | 14:30:08.81 | 23:06:20.16 | 3.5 | 219.2 |
| J1430.3+2303 | J143010.838+230134.277 | m | 14:30:10.86 | 23:01:33.84 | 3.7 | 184.8 |
| J1430.3+2303 | J143016.094+230343.862 | m | 14:30:16.1 | 23:03:42.97 | 3.5 | 56.1 |
| J1430.3+2303 | J143024.841+230009.905 | m | 14:30:24.76 | 23:00:09.77 | 3.7 | 226.1 |
| J1430.3+2303 | J143035.788+230407.712 | m | 14:30:35.82 | 23:04:06.32 | 3.6 | 217.0 |
| J1451.1-8035 | J145054.047-803518.532 | x | 14:50:54.84 | -80:35:21.85 | 4.7 | 40.4 |
| J1504.1-6019 | J150416.037-602121.037 | x | 15:04:16.02 | -60:21:21.44 | 4.6 | 123.1 |
| J1506.4-2923 | J150632.003-292237.960 | x | 15:06:32.14 | -29:22:35.8 | 6.0 | 112.0 |
| J1529.1-6523 | J152930.220-652229.724 | x | 15:29:30.55 | -65:22:29.86 | 5.0 | 162.5 |
| J1541.6+1113 | J154132.811+111340.924 | x | 15:41:32.8 | 11:13:40.28 | 4.4 | 114.2 |
| J1547.3+3146 | J154706.288+314557.923 | x | 15:47:06.24 | 31:45:57.8 | 5.6 | 171.6 |
| J1619.9+6510 | J161956.364+651301.448 | x | 16:19:56.37 | 65:12:59.97 | 5.2 | 168.1 |
| J1655.7-4958 | J165551.841-495732.542 | x | 16:55:51.93 | -49:57:32.35 | 4.1 | 90.0 |
| J1701.2-4212 | J170117.822-421335.370 | x | 17:01:17.96 | -42:13:35.62 | 4.1 | 101.4 |
| J1732.0-3439 | J173215.277-343943.796 | m | 17:32:15.44 | -34:39:46.06 | 4.1 | 148.1 |
| J1732.0-3439 | J173217.430-343911.830 | m | 17:32:17.34 | -34:39:13.7 | 4.1 | 169.6 |
| J1735.9-1528 | J173600.799-152945.813 | x | 17:36:00.8 | -15:29:46.09 | 3.6 | 104.9 |
| J1742.4+1502 | J174230.735+150028.760 | x | 17:42:30.83 | 15:00:27.12 | 5.1 | 147.7 |
| J1757.9+0427 | J175757.964+042729.167 | x | 17:57:57.89 | 04:27:31.13 | 6.0 | 51.1 |
| J1807.3-5935 | J180715.465-593630.848 | x | 18:07:15.54 | -59:36:32.54 | 4.3 | 83.7 |
| J1846.1-0226 | J184610.858-022451.834 | m | 18:46:10.91 | -02:24:53.32 | 3.8 | 102.8 |
| J1846.1-0226 | J184611.124-022822.595 | m | 18:46:11.35 | -02:28:24.34 | 3.8 | 110.0 |
| J1846.1-0226 | J184617.093-022753.462 | m | 18:46:17.09 | -02:27:53.39 | 3.8 | 109.5 |
| J1851.8+1846 | J185152.906+184811.717 | x | 18:51:52.96 | 18:48:11.34 | 4.2 | 120.2 |
| J1854.4-3436 | J185421.922-343641.701 | x | 18:54:21.88 | -34:36:38.85 | 5.8 | 54.6 |
| J1856.5+2836 | J185627.117+283809.639 | m | 18:56:27.06 | 28:38:09.47 | 6.2 | 117.1 |
| J1856.5+2836 | J185632.226+283626.262 | m | 18:56:32.15 | 28:36:27.37 | 4.4 | 25.2 |
| J1856.5+2836 | J185634.697+283529.554 | m | 18:56:34.74 | 28:35:29.05 | 4.1 | 79.8 |
| J1911.4+1412 | J191124.874+141143.793 | x | 19:11:24.9 | 14:11:43.93 | 3.9 | 95.2 |
| J1929.5-5606 | J192933.020-560342.697 | x | 19:29:33.02 | -56:03:43.43 | 4.3 | 161.8 |
| J1952.3+3803 | J195225.218+380027.051 | x | 19:52:25.27 | 38:00:26.57 | 4.0 | 184.5 |
| J1958.2+1941 | J195815.495+194131.811 | x | 19:58:15.57 | 19:41:31.17 | 4.4 | 41.9 |
| J2028.0+2221 | J202807.882+222324.863 | x | 20:28:07.87 | 22:23:24.23 | 4.2 | 124.9 |
| J2030.1+7608 | J202920.605+760812.618 | x | 20:29:20.78 | 76:08:12.69 | 3.9 | 171.3 |
| J2030.8+3833 | J203055.241+383346.714 | x | 20:30:55.21 | 38:33:45.56 | 4.2 | 28.3 |
| J2136.1+2002 | J213615.094+200208.011 | x | 21:36:15.16 | 20:02:07.27 | 3.8 | 51.5 |
| J2155.3+6204 | J215515.232+620650.707 | x | 21:55:15.39 | 62:06:51.22 | 4.2 | 159.6 |
| J2155.1+7017 | J215532.508+701845.088 | x | 21:55:32.58 | 70:18:44.61 | 3.7 | 149.5 |
| J2201.4+7546 | J220149.675+754429.190 | x | 22:01:49.87 | 75:44:29.72 | 3.9 | 138.5 |
| J2238.8+4050 | J223856.644+405141.294 | x | 22:38:56.86 | 40:51:42.62 | 4.7 | 70.1 |
| J2313.3-3402 | J231313.188-340056.922 | m | 23:13:13.24 | -34:00:57.52 | 4.1 | 133.1 |
| J2313.3-3402 | J231336.783-340305.733 | m | 23:13:36.79 | -34:03:03.43 | 4.8 | 198.0 |
| count rate | S/N full | S/N hard | S/N soft | Nobs | Texp | WISE Name | |
|---|---|---|---|---|---|---|---|
| [0.5, 10] keV | [2, 10] keV | [0.5, 2] keV | s | ||||
| 3.33e-03 | 7.10e-04 | 4.7 | 3.9 | 4 | 8718 | J001637.05-261426.7 | |
| 1.58e-01 | 4.30e-03 | 37.1 | 22.4 | 31.4 | 6 | 12211 | J002203.09+254003.2 |
| 1.35e-03 | 4.30e-04 | 3.1 | 2.4 | 6 | 12211 | ||
| 2.63e-03 | 5.60e-04 | 4.7 | 2.4 | 3.8 | 6 | 12211 | |
| 4.77e-02 | 3.50e-03 | 13.8 | 7.6 | 11.9 | 5 | 5326 | J002406.72-682054.5 |
| 2.89e-03 | 9.00e-04 | 3.2 | 3.0 | 5 | 4596 | J004024.38+254303.4 | |
| 1.90e-01 | 1.60e-02 | 11.9 | 6.6 | 10.3 | 1 | 975 | J012205.12-610705.0 |
| 2.69e-02 | 1.50e-03 | 18.3 | 14.2 | 11.5 | 5 | 15292 | J013251.50-742545.4 |
| 3.68e-03 | 9.10e-04 | 4.0 | 3.6 | 4 | 6035 | J015422.40-503240.0 | |
| 1.78e-03 | 5.70e-04 | 3.2 | 2.9 | 5 | 8247 | J015848.81+264250.6 | |
| 4.08e-03 | 9.10e-04 | 4.5 | 3.9 | 3 | 6619 | J020803.46-290408.3 | |
| 2.39e-04 | 5.50e-05 | 4.4 | 3.6 | 3.0 | 14 | 166916 | |
| 1.98e-04 | 5.20e-05 | 3.8 | 3.2 | 14 | 166916 | J021822.70-500557.5 | |
| 4.35e-04 | 7.40e-05 | 5.9 | 3.9 | 4.6 | 14 | 166916 | |
| 1.13e-01 | 6.00e-03 | 19.0 | 15.1 | 14.3 | 4 | 4440 | J022454.49+452747.1 |
| 3.69e-02 | 5.50e-03 | 6.7 | 5.1 | 4.8 | 1 | 1507 | J025150.95+433653.5 |
| 5.27e-03 | 1.20e-03 | 4.3 | 4.0 | 5 | 4651 | J025847.30+354357.3 | |
| 2.92e-03 | 8.80e-04 | 3.3 | 3.4 | 3 | 5549 | J033423.01-520416.0 | |
| 2.48e-02 | 1.90e-03 | 13.2 | 12.8 | 5.5 | 9 | 10395 | J040847.92-791405.6 |
| 4.95e-02 | 5.60e-03 | 8.9 | 6.1 | 6.8 | 2 | 2086 | J041222.58+305234.4 |
| 1.92e-03 | 5.90e-04 | 3.3 | 3.0 | 4 | 8089 | J042113.19+260352.6 | |
| 3.80e-03 | 1.10e-03 | 3.4 | 2.9 | 3 | 4345 | J043336.20-510607.9 | |
| 1.03e-03 | 2.60e-04 | 4.0 | 2.6 | 3.3 | 2 | 24394 | |
| 1.27e-03 | 3.10e-04 | 4.1 | 3.5 | 2 | 24394 | J053618.88-320533.0 | |
| 9.32e-03 | 1.60e-03 | 5.9 | 5.8 | 4 | 4847 | J060653.35+565204.1 | |
| 1.76e-01 | 6.20e-03 | 28.6 | 18.7 | 24.2 | 4 | 6338 | J070932.05-353746.5 |
| 3.02e-03 | 8.40e-04 | 3.6 | 4 | 6338 | |||
| 1.56e-01 | 5.90e-03 | 26.5 | 17.2 | 21.5 | 7 | 6504 | J071215.60+153930.1 |
| 3.50e-03 | 8.60e-04 | 4.1 | 3.4 | 6 | 7454 | J074121.92-672352.0 | |
| 4.56e-02 | 4.00e-03 | 11.4 | 7.7 | 8.6 | 5 | 3861 | J075145.40+644903.0 |
| 6.51e-02 | 2.40e-03 | 27.6 | 22.5 | 16.1 | 4 | 13050 | J080039.96-431107.2 |
| 3.63e-03 | 6.20e-04 | 5.8 | 3.7 | 4.6 | 4 | 13050 | J080045.83-430939.3 |
| 4.42e-02 | 3.20e-03 | 14.0 | 5.0 | 13.1 | 4 | 6692 | J081914.73-251116.6 |
| 1.13e-02 | 1.50e-03 | 7.4 | 5.0 | 5.8 | 4 | 6692 | J081916.20-250706.4 |
| 4.52e-03 | 1.10e-03 | 4.0 | 3.8 | 3 | 4949 | J083850.15+261105.5 | |
| 8.52e-02 | 4.80e-03 | 17.6 | 10.5 | 15.4 | 5 | 4992 | J085656.49+670257.3 |
| 2.67e-03 | 8.70e-04 | 3.1 | 5 | 4992 | |||
| 4.41e-03 | 1.20e-03 | 3.6 | 2.9 | 1 | 4272 | J090036.26-333415.1 | |
| 1.66e-02 | 4.40e-03 | 3.8 | 4.0 | 2 | 1158 | J090522.48-150344.6 | |
| 1.77e-02 | 4.50e-03 | 3.9 | 3.5 | 2 | 1158 | J090533.64-145956.2 | |
| 1.98e-03 | 5.50e-04 | 3.6 | 3.6 | 13 | 9831 | J091038.47+103450.4 | |
| 8.41e-02 | 4.50e-03 | 18.7 | 13.0 | 14.5 | 1 | 5483 | J103915.25-490303.3 |
| 1.04e-02 | 2.00e-03 | 5.2 | 5.3 | 3 | 3570 | J104115.62+045313.8 | |
| 2.38e-03 | 7.30e-04 | 3.3 | 3.3 | 14 | 6434 | J105656.82-032143.0 | |
| 2.07e-02 | 2.30e-03 | 8.8 | 8.8 | 8 | 5127 | J112655.08+184957.2 | |
| 1.38e-02 | 2.00e-03 | 6.9 | 7.1 | 8 | 4533 | J114054.57+360957.2 | |
| 3.03e-02 | 2.30e-03 | 13.4 | 9.4 | 10.4 | 10 | 9089 | |
| 4.01e-03 | 7.30e-04 | 5.5 | 2.9 | 4.5 | 10 | 10062 | J115843.34+570536.5 |
| 2.69e-02 | 1.60e-03 | 16.3 | 15.4 | 5.6 | 10 | 11616 | J122810.13-092703.4 |
| 2.46e-03 | 6.90e-04 | 3.6 | 3.6 | 8 | 8292 | J123622.59+221834.6 |
| count rate | S/N full | S/N hard | S/N soft | Nobs | Texp | WISE Name | |
|---|---|---|---|---|---|---|---|
| [0.5, 10] keV | [2, 10] keV | [0.5, 2] keV | s | ||||
| 3.29e-03 | 7.70e-04 | 4.3 | 3.9 | 20 | 8500 | J132949.54-105255.3 | |
| 3.10e-02 | 5.70e-04 | 54.4 | 38.7 | 42.3 | 118 | 150511 | J143008.64+230621.6 |
| 4.50e-04 | 8.20e-05 | 5.5 | 5.4 | 118 | 150511 | J143010.96+230134.8 | |
| 6.15e-02 | 8.10e-04 | 76.3 | 47.4 | 61.0 | 118 | 150511 | J143016.03+230344.2 |
| 3.66e-04 | 7.40e-05 | 5.0 | 3.1 | 4.0 | 118 | 150511 | J143024.88+230012.7 |
| 1.18e-03 | 1.10e-04 | 10.4 | 5.8 | 8.4 | 118 | 150511 | J143035.69+230406.5 |
| 1.67e-03 | 4.50e-04 | 3.7 | 3.2 | 16 | 11591 | J145054.14-803520.7 | |
| 2.79e-02 | 3.60e-03 | 7.8 | 6.6 | 4.1 | 4 | 2683 | |
| 4.15e-03 | 1.20e-03 | 3.5 | 3.0 | 7 | 3999 | J150631.92-292235.4 | |
| 3.55e-03 | 1.10e-03 | 3.3 | 2.8 | 4 | 4433 | J152931.06-652229.9 | |
| 1.56e-03 | 3.30e-04 | 4.7 | 4.5 | 16 | 22633 | J154132.85+111339.7 | |
| 4.11e-03 | 1.00e-03 | 3.9 | 3.0 | 2.6 | 4 | 4746 | J154706.47+314558.5 |
| 2.95e-03 | 6.80e-04 | 4.3 | 2.8 | 3.3 | 7 | 10074 | J161955.84+651301.0 |
| 3.42e-02 | 3.20e-03 | 10.7 | 9.4 | 6.0 | 4 | 4232 | J165551.96-495732.2 |
| 9.44e-03 | 1.10e-03 | 8.4 | 8.3 | 8 | 9716 | ||
| 4.43e-03 | 1.30e-03 | 3.3 | 2.8 | 4 | 4187 | ||
| 8.67e-03 | 1.80e-03 | 4.7 | 4.1 | 3.4 | 4 | 4187 | |
| 1.72e-01 | 6.80e-03 | 25.3 | 17.5 | 20.7 | 3 | 5516 | J173600.69-152946.6 |
| 3.25e-03 | 1.00e-03 | 3.2 | 2.5 | 4 | 4400 | ||
| 3.03e-03 | 9.10e-04 | 3.3 | 2.2 | 2.5 | 2 | 5586 | J175757.68+042735.3 |
| 3.59e-03 | 1.00e-03 | 3.6 | 3.8 | 4 | 5105 | J180715.81-593632.5 | |
| 4.82e-04 | 1.20e-04 | 4.2 | 3.7 | 81 | 83400 | ||
| 5.52e-04 | 1.10e-04 | 4.9 | 4.2 | 3.0 | 81 | 83400 | |
| 5.01e-04 | 1.10e-04 | 4.5 | 4.0 | 81 | 83400 | ||
| 2.41e-02 | 2.50e-03 | 9.7 | 9.0 | 4.5 | 4 | 5436 | J185152.92+184812.2 |
| 3.80e-03 | 1.20e-03 | 3.2 | 3.3 | 4 | 3773 | J185422.21-343640.3 | |
| 4.11e-03 | 1.10e-03 | 3.6 | 3.8 | 1 | 5050 | J185626.89+283809.3 | |
| 3.44e-03 | 9.90e-04 | 3.5 | 2.8 | 2.4 | 1 | 5050 | J185632.13+283628.8 |
| 2.65e-02 | 2.70e-03 | 9.9 | 9.9 | 1 | 5050 | J185634.58+283531.3 | |
| 5.32e-02 | 4.00e-03 | 13.4 | 10.8 | 9.1 | 6 | 4428 | |
| 2.61e-02 | 2.80e-03 | 9.3 | 6.1 | 7.0 | 5 | 4282 | J192933.07-560343.1 |
| 1.38e-01 | 1.20e-02 | 11.6 | 7.6 | 9.0 | 1 | 1299 | J195225.09+380026.8 |
| 2.16e-02 | 2.60e-03 | 8.3 | 8.6 | 4 | 4408 | J195815.52+194131.0 | |
| 3.04e-02 | 3.20e-03 | 9.4 | 6.8 | 7.3 | 2 | 3866 | J202807.84+222324.7 |
| 4.83e-02 | 3.90e-03 | 12.5 | 9.0 | 9.6 | 5 | 4644 | J202920.02+760810.4 |
| 2.10e-02 | 2.30e-03 | 9.3 | 9.0 | 2.9 | 6 | 5499 | |
| 8.60e-02 | 5.00e-03 | 17.2 | 10.7 | 13.4 | 4 | 4165 | J213615.30+200207.2 |
| 2.72e-02 | 2.60e-03 | 10.4 | 6.6 | 8.0 | 2 | 4583 | |
| 9.21e-02 | 5.20e-03 | 17.8 | 12.9 | 12.9 | 3 | 4844 | J215532.33+701844.5 |
| 4.78e-02 | 3.60e-03 | 13.2 | 10.2 | 8.6 | 3 | 4395 | J220149.81+754428.7 |
| 1.50e-02 | 2.10e-03 | 7.0 | 4.8 | 5.1 | 5 | 4323 | J223857.02+405141.9 |
| 6.73e-03 | 8.00e-04 | 8.4 | 4.4 | 7.5 | 10 | 23147 | J231313.21-340056.2 |
| 1.88e-03 | 5.20e-04 | 3.6 | 2.3 | 2.8 | 10 | 23147 | J231337.01-340302.1 |
| 3PBC name | SDSS name | Class | |
|---|---|---|---|
| 3PBC J0040.5+2542 | J004024.39+254303.4 | 1.0015 | QSO |
| 3PBC J0838.7+2613 | J083850.15+261105.4 | 1.6139 | QSO |
| 3PBC J1041.2+0451 | J104115.61+045313.8 | 0.0683 | Sy 2 |
| 3PBC J1126.8+1851 | J112655.08+184957.4 | 0.0188 | Sy 2 |
| 3PBC J1140.8+3611 | J114054.58+360957.0 | 0.0701 | Sy 2 |
| 3PBC J1158.4+5704 | J115843.32+570536.6 | 1.1202 | QSO |
| 3PBC J1236.2+2216 | J123622.60+221834.8 | 1.8559 | QSO |
| 3PBC J1430.3+2303 | J143016.05+230344.4 | 0.0811 | Sy 2 |
| 3PBC J1430.3+2303 | J143008.64+230621.5 | 0.0791 | Sy 1 |
| 3PBC J1430.3+2303 | J143010.96+230134.7 | 0.0173 | Sy 2 |
Appendix B 2. Images of all x flagged 3PBX sources
This section shows images of all the 3PBC sources with exactly one soft Swift-XRT detection inside the BAT positional uncertainty region (red dashed circle). The green cross, if present, indicated that the source has a WISE counterpart. The black circle only highlights the position of the Swift-XRT detection, not its positional uncertainty region. One exception is 3PBCJ1730.0-3436, which has a cyan circle instead of black because the black would not be visible on top of the source’s emission.