11email: franklin.aldas@userena.cl 22institutetext: Instituto de Investigación Multidisciplinar en Ciencia y Tecnología, Universidad de La Serena, Raúl Bitrán 1305, La Serena, Chile.
33institutetext: Facultad de Ingeniería y Arquitectura, Universidad Central de Chile, Av. Francisco de Aguirre 0405, La Serena, Chile.
44institutetext: Cerro Tololo Inter-American Observatory/NSF NOIRLab, Casilla 603, La Serena, Chile.
55institutetext: International Gemini Observatory/NSF NOIRLab, Casilla 603, La Serena, Chile.
Differences in the physical properties of satellite galaxies within relaxed and disturbed galaxy groups and clusters
Abstract
Context. Galaxy groups and clusters are the most massive collapsed structures in the Universe. Those structures are formed by collapsing with other smaller structures. Groups and cluster mergers provide an appropriate environment for the evolution and transformation of their galaxies.
Aims. The merging process of groups and clusters can affect the properties of their galaxy populations. Our aim is to characterise the distribution of galaxies’ colour, specific star formation rate, quenched galaxy fraction, and gas availability in galaxies bounded to groups and clusters and to examine how these properties relate to the dynamical state of their host environments.
Methods. We used the most massive halos (M ¿ 1013 M⊙) in Illustris TNG100 simulations and separated the sample into two categories: relaxed and disturbed halos. This classification was done based on the offset between the position of the Brightest Cluster Galaxy (BCG) and the centre of mass of the gas. Subsequently, we classified their galaxy populations into red and blue galaxies using a threshold derived from a double Gaussian fit to their colour distribution. Additionally, we distinguished between star-forming and quenched galaxies by applying a threshold defined as one dex below the interpolated star-formation main sequence.
Results. Our findings reveal differences in physical properties such as colour, star formation rates, and gas availability among satellite galaxies bound to interacting clusters compared to relaxed clusters. Disturbed clusters exhibit more blue, star-forming galaxies than their relaxed counterparts. This discrepancy in the fraction of blue and star-forming galaxies can be attributed to higher gas availability, including hot, diffuse, and condensed gas in satellite galaxies in disturbed clusters compared to relaxed ones. Furthermore, our study shows that during cluster mergers, there are two crucial phases; at the beginning of interaction, there is an important boost in the star formation rate followed by a suppression as the cluster reaches the equilibrium state.
Key Words.:
Galaxies: clusters: general – Galaxies: evolution1 Introduction
Galaxy groups and clusters are the most massive gravitationally bounded structures in the Universe, containing up to thousands of luminous galaxies (Abell, 1958; Abell et al., 1989). According to the CMD model, the building of structures in the Universe followed a hierarchical process. Initially, small overdensities in the primordial Universe collapsed, and later developed into larger systems, such as groups and clusters, through merging and accretion with other smaller structures (Cole et al., 2000; White & Rees, 1978; White & Frenk, 1991). As a result, galaxy groups and clusters are not always in a dynamic equilibrium. A significant fraction, between 30 and 70, is currently undergoing a merger process (Hou et al., 2012). Cluster mergers rank among the most energetic events in the Universe, second only to the Big Bang, releasing energies up the order of erg. (Sarazin, 2001; Molnar, 2016). During these collisions, the evolution of the two primary cluster components exhibits distinct behaviours: dark matter, characterised by its collisionless nature, is only driven by gravitational force. In contrast, gas is susceptible to pressure forces and dissipative effects (Molnar, 2016). Both, gravity and dissipation significantly influence the star formation history of cluster member galaxies during the cluster-merging process (Caldwell & Rose, 1997). Therefore, these powerful events provide suitable environmental conditions for galaxy transformation and evolution. Indeed, whereas galaxy groups and clusters are mainly populated by red and quenched galaxies (Oemler & Hale Observatories, 1974; Dressler, 1980), recent studies suggest the physical properties of satellite galaxies differ between relaxed and disturbed clusters. In this sense, Aldás et al. (2023), using a sample of 84 galaxy clusters with redshifts between , showed that relaxed clusters have a redder galaxy population. In comparison, disturbed clusters have a more diverse and bluer galaxy population. This finding is supported by the observations of Sobral et al. (2015) and Yoon & Im (2020), who found that interacting clusters exhibit an increased star formation rate compared to non-interacting ones. In contrast, other studies, such as those by (Kleiner et al., 2014) and (Shim et al., 2011), found no evidence of an increase in the star formation rate, suggesting that interacting clusters can even suppress star formation.
The dynamical state of groups and clusters can play an important role in their mass determinations, which are typically estimated using self-similarity scaling relations. The relations are highly dependent on the structure’s dynamical state. An example is the scaling relation proposed by Munari et al. (2013), which relates the cluster galaxies’ velocity dispersion and the cluster mass, , where represents the virial mass and is a fitting parameter. M200 is defined as the mass enclosed inside the virial radius (R200), which is the radial distance where the cluster’s density is 200 times the average density of the Universe. Additional scaling relations usually assume equilibrium between the intra-cluster medium and the gravitational potential well, meaning that the cluster is entirely relaxed (Maughan, 2013). Examples are the power law proposed by Kravtsov et al. (2006) expressed as M, which is the most commonly used scaling relation between X-ray luminosity (Yx) and mass, and the widely used Sunayev-Zeldovich (SZ) emission (YSZ) to mass scaling relation proposed by Nagai (2006) and Battaglia et al. (2012). However, some studies show deviation of those scaling relations for non-relaxed galaxy clusters, leading to errors in the mass estimation (Barnes et al., 2021; Biffi et al., 2016).
From an observational standpoint, the dynamic state of clusters has been quantified using data from different wavelengths. Radio-emitting clusters are often associated with disturbed clusters due to shocks during merging that can trigger the acceleration of charged particles and lead to synchrotron radiation (Brunetti et al., 2008). In contrast, those lacking radio emission are considered relaxed clusters (Brunetti et al., 2007, 2009; Feretti et al., 2012). The presence of a cool core in X-ray observations of clusters has also been used as an indicator of a relaxed state in these clusters. When the radiative cooling time in the core is shorter than the cluster’s age, it suggests that the cluster has likely attained a relaxed state (Bauer et al., 2005). This inference is grounded in the fact that X-rays emitted by the ICM induce a temperature drop in the innermost regions of galaxy clusters. In addition, some authors have investigated the dynamical state of galaxy clusters by examining morphological parameters of their X-ray emission, such as the asymmetry parameter . This parameter quantifies the deviation of the photometric distribution within a specific annulus from a symmetric distribution (Nurgaliev et al., 2013, 2017). Another parameter commonly used is the centroid shift, which measures the offset between the BCG position and the peak of the X-ray emission (Nurgaliev et al., 2017; Yuan et al., 2022; Campitiello et al., 2022). In this sense, Campitiello et al. (2022) defined a relaxation parameter (M) to produce a unique indicator of the dynamical state of the clusters as the combination of the centroid shift (separation between the X-ray peak and the centroid of the X-ray surface brightness), the concentration index, which measures the ratio of the surface brightness measured in two apertures ( and R500), and the power ratio, which is based on the multipolar two-dimensional decomposition of the X-ray surface brightness.
Cosmological simulations also have been used to investigate the dynamical state of galaxy clusters, computing other indicators. For example, Bett et al. (2007) used the ’virial ratio’, defined as , to select the halos near the equilibrium state, where T is the total kinetic energy and U is the total potential energy of the halo particles. Neto et al. (2007) proposed another two parameters: i) the offset between the position of the centre of mass of the halo and the potential centre, and ii) the substructure mass fraction defined as the ratio of the central galaxy to the total mass. Additionally, there are some other parameters to measure the relaxation state of the clusters using the combination of these three parameters (Haggar et al., 2020; De Luca et al., 2021). However, Zhang et al. (2022) showed that the most important parameter to classify the dynamical state of clusters is the offset between the position of the most bounded particle, or density cusp, and the cluster’s centre of mass.
In this paper, we unveil the influence of the galaxy cluster’s dynamical state on the physical properties of their galaxy population, such as colour, star formation, metallicity, and gas availability. We also investigate the physical mechanisms responsible for causing these changes. This work was done using a fully cosmological simulation Illustris-TNG that includes a model to describe galaxy formation and evolution. This paper is organised as follows: Section 2 provides an overview of the cosmological simulations used. Section 3 describes how we selected our sample and characterised the dynamical state of halos. Section 4 and 5 explain the differences in the physical properties of relaxed and disturbed clusters. Section 6 describes how these differences vary as a function of the redshift. Section 7 discusses the gas availability in galaxies bound to clusters in different relaxation states. Finally, Section 8 presents an example of the evolution of star formation and gas availability as a function of time.
2 Cosmological Simulations
In this project, we use the Illustris TNG cosmological magnetohydrodynamical simulations, which are a series of large simulations aimed at exploring the formation and evolution of galaxies within the -Cold Dark Matter model framework (Pillepich et al., 2018a; Springel et al., 2018; Naiman et al., 2018; Nelson et al., 2018; Marinacci et al., 2018). Illustris TNG was run with the AREPO code, a flexible code for hydrodynamical cosmological simulations that solves Poisson’s equation in a fully dynamical unstructured mesh with a finite-volume method (Weinberger et al., 2020). These simulations include inhered models from Illustris simulations incorporating non-linear physical processes driving galaxy formation and evolution, such as star formation, stellar evolution, chemical enrichment, and gas recycling (Vogelsberger et al., 2014; Gene et al., 2014; Sijacki et al., 2015). Illustris TNG also has updated models for the growth and feedback of supermassive black holes, galactic winds, and metal abundance evolution (Weinberger et al., 2017; Pillepich et al., 2018b). This model exhibits a good agreement with observational data regarding the abundance of molecular and atomic gas in the IllustrisTNG, as compared to the abundances derived with the 21-cm Hydrogen line using the Giant Metre-wave Radio Telescope (Rhee et al., 2018; Diemer et al., 2019).
This suite of simulations has three different box sizes: Mpc, Mpc, and Mpc per side, hereafter TNG50, TNG100, and TNG300, respectively. Each box has different mass resolutions for Dark Matter (DM) and baryonic particles. The groups and clusters in the Illustris-TNG simulations were identified using the Friend-of-Friends algorithm with a linking length of 1 h-1kpc, 0.5 h-1kpc, and 0.2h-1kpc for TNG300, TNG100, and TNG50 respectively (Springel et al., 2018). Their corresponding subhalos were identified using the SUBFIND algorithm (Springel et al., 2001; Dolag et al., 2009). The TNG300 simulation has a volume 27 times larger and contains approximately 20 times more halos than TNG100 (Pillepich et al., 2018a). However, TNG100 offers a mass resolution that is one order of magnitude better than TNG300. Specifically, TNG100 contains DM and an equivalent number of baryonic particles with a mass resolution of M⊙ and M⊙, respectively. For this work, we have chosen to use the TNG100 to balance the number of detected structures and a good resolution. TNG100 has more than 2000 halos with masses greater than M⊙, and the most massive object detected at redshift has a mass of M⊙.
The Illustris TNG simulations reproduce notably well several observed statistical properties of the galaxy population. These properties include the clustering of galaxies as a function of stellar mass, colour, star formation, and redshift (Springel et al., 2018), the galaxy colour bimodality (Nelson et al., 2019), and the stellar mass functions from to today (Pillepich et al., 2018a). Illustris TNG uses the cosmological parameters from Planck observations (Planck Collaboration, 2016), as follows: , , , and km s-1 Mpc-1.
3 Sample Selection
In this paper, we analyse the properties of galaxy populations in groups and clusters. Our focus will be on structures with masses greater than M M⊙ containing at least ten galaxies per halo. This paper will consider as galaxies, subhalos with stellar mass greater than M, resolving each galaxy with more than 800 stellar particles. We look for clusters and groups of galaxies independently in different simulation snapshots, assuming that the dynamical state of the structures changes over time. We select halos from seven different redshifts, between and . The used redshifts are 0.1, 0.2, 0.3, 0.4, 0.5, 0.7, and 1. Following Zenteno et al. (2020) and Aldás et al. (2023), who studied the differences in properties of cluster galaxies at low and high redshift, we subdivide our sample of galaxies into two redshift bins. The first is a low-redshift bin from and a high redshift bin with halos between .
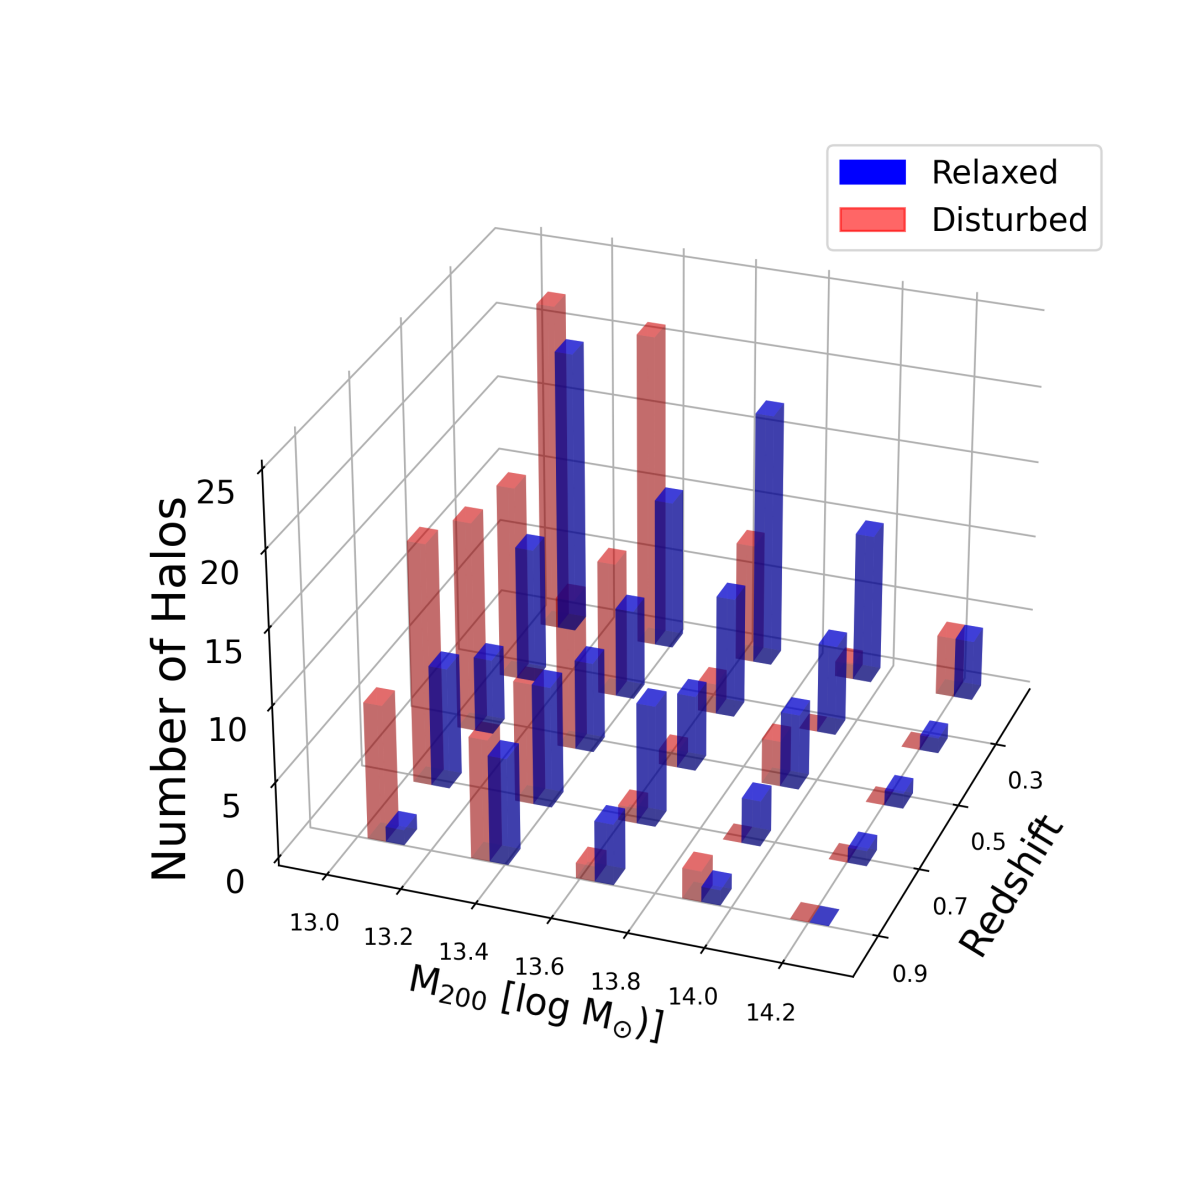
In Figure 1, we present the selected groups and clusters’ mass and redshift distribution. The redshift is presented on the x-axis, and the virial mass is on the y-axis. The mean temporal separation between the used snapshots is 1.3 Gyrs. This separation is around half the free-falling time for two collapsing structures with masses of , which were initially separated at a distance of 1 Mpc. This ensures that the dynamical state of clusters will be different from one selected snapshot to another.
3.1 Dynamical State of Clusters
To study the dynamical state of galaxy clusters, following Zenteno et al. (2020), we separated our sample of groups and clusters of galaxies into relaxed and disturbed categories using an observationally motivated parameter: the 3D offset between the position of the BCG and the position of the center of mass of the gas. The position of the BCG is determined by the position of the most bound particle, and the center of mass of the gas is computed using all gas cells bound to the halo. We consider that a cluster is disturbed if the offset between the BCG and the center of mass of the gas () is larger than . We use the position of the center of mass of the gas as a proxy for the SZ effect centroid. Our proposed methodology aligns closely with the approach outlined by De Luca et al. (2021). In their study, they incorporate various indicators for the dynamical state, including the 3D offset between the centre of mass of the cluster considering all particle types and the position of the highest density peak. When considering the centre of mass computed across all particle types in our groups and clusters and imposing the same threshold of , we find that of the groups and clusters meet the disturbed classification criterion in both methodologies.
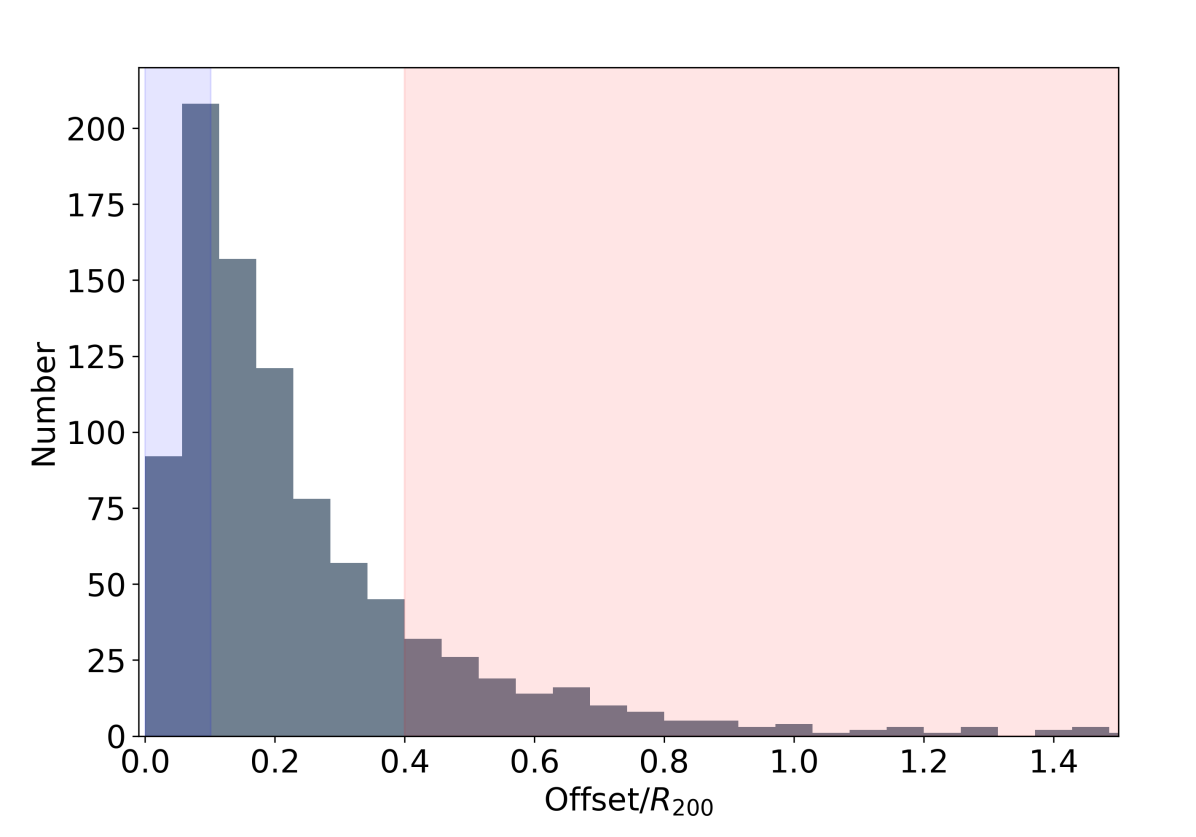
We found 640 groups and clusters with virial masses greater than M⊙ within the selected seven snapshots. From those clusters, we identified 153 as disturbed structures. To make a fair comparison of the cluster galaxies’ physical properties between relaxed and disturbed clusters, we also selected the 153 most relaxed clusters. These are the ones with the lowest ( R200). Our criterion for identifying relaxed clusters is more stringent compared to the approach suggested by Cui et al. (2017) for the center of mass offset, leading us to focus solely on the most relaxed clusters. In Figure 2, we present a histogram of the distribution of in units of R200. The blue and red shadowed areas show the selected relaxed and disturbed clusters, respectively. This selection criteria allow us to maximise the differences between the two samples. As a result, clusters that are in an intermediate relaxation state, which are located in between the shaded areas of Figure 2, have not been considered in this study. As shown in Table 1, the relaxed clusters have 4442 galaxies, while the disturbed ones have slightly larger substructures, corresponding to 4494 galaxies. Each subsample, i.e. disturbed and relaxed, is further subdivided into a low () and high () redshift subsample. As a result, we end up with four distinct galaxy groups. The final number of galaxy clusters and the number of their member galaxies in each subgroup is given in Table 1. Each subgroup has at least 63 clusters and groups with at least 1633 bounded galaxies.
| z | # Rel. clust. (Gal.) | # Dist. clust. (Gal.) |
|---|---|---|
| 90 (2809) | 80 (2682) | |
| 63 (1633) | 73 (1802) | |
| Total | 153 (4442) | 153 (4494) |
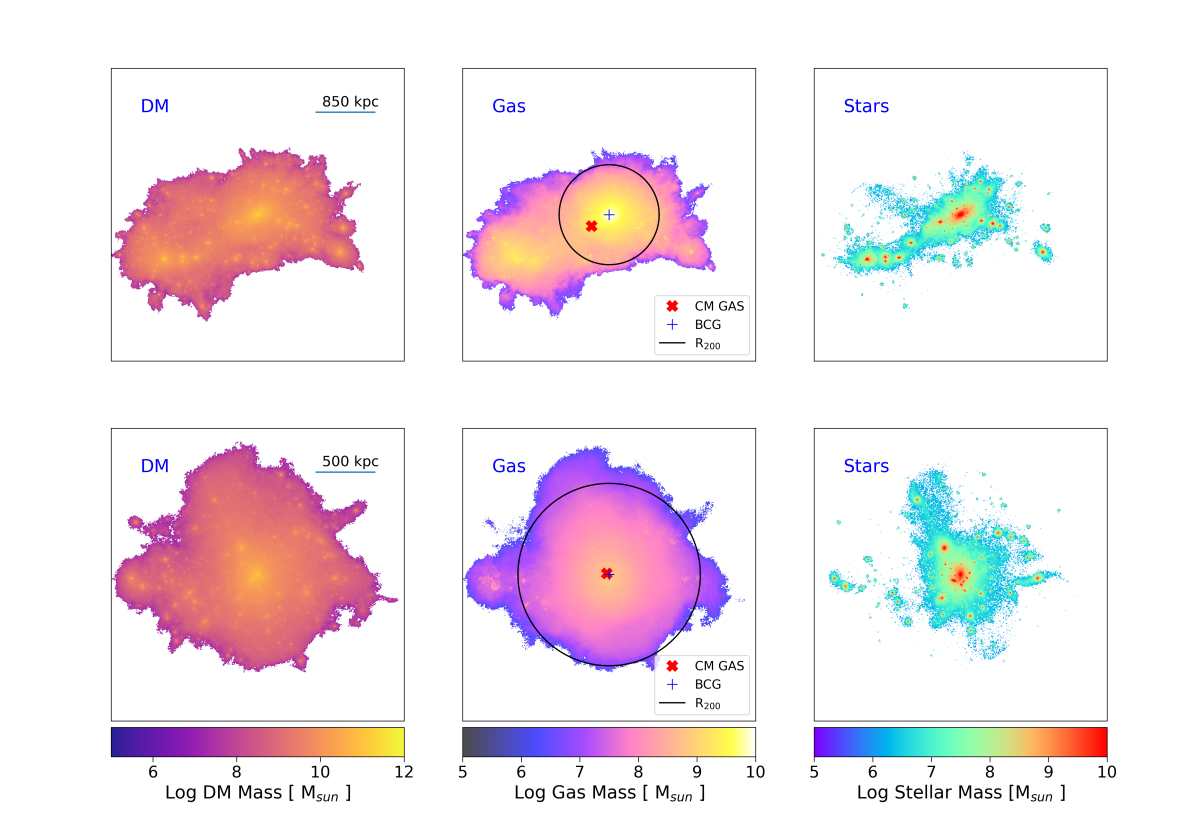
The left, middle and right columns of Figure 3 show the DM, gas and stellar mass distribution, of an example of disturbed (top panels) and relaxed (bottom panel) cluster, respectively. In the central panels, the blue ’+’ mark represents the position of the most bound particle, which traces the location of BCG. The red ’x’ mark represents the position of the CM of the gas distribution, and the black circle represents the virial radius (R200) of the halo centred in the BCG position. The disturbed cluster (top panels) has a halo with at redshift . We can see that the position of the CM of the gas has an offset of R200 from the position of the BCG due to another massive structure that is infalling in the central halo. On the other hand, in the bottom panels, we present a halo with a mass of , also at redshift , as an example of one relaxed cluster. We can see that, despite some small structures falling into the central halo, the position of the centre of gas remains the same as the position of the BCG, and the cluster’s shape is much more symmetrical compared to the example of the disturbed one. In each example, the distribution of gas and DM mass follows similar shapes, in accordance with results by Rasia et al. (2004), who showed that the gas and DM follow similar density profiles with different concentration values for . Finally, we can observe that the stellar mass is mainly distributed in the inner parts of the halo, where the gas density is large enough to trigger the star formation.
4 Galaxy Populations
In this section, we analyse the colour of galaxies, establishing a threshold to divide between red and blue galaxy populations. Additionally, we classify galaxies based on their star formation activity into star-forming and quenched galaxies. We consider all galaxies bound to groups and clusters, regardless of their dynamical state. The impact of the dynamical state on the physical properties of satellite galaxies will be studied in Section 5.
4.1 Color distributions
Galaxies are classified into red and blue based on their colours, providing insight into their dominant stellar populations. Red galaxies are characterised by a prevalence of late-type stars, while blue galaxies are dominated by early-type stellar populations. The Balmer break offers a way to identify sample sets of star-forming galaxies because its presence is common in A-type stars. The presence of A-type stars and their limited lifetime indicate recent star formation (Mihalas, 1967; Poggianti & Barbaro, 1997). The Balmer break can be found by spectrography and photometry using specifically chosen colour indices. For this reason, in this paper, we define the colour of a galaxy as the difference in the magnitude between the simulated and SDSS broad-band filters. TNG100 simulations provide the rest frame absolute magnitudes for each galaxy computed as the summed-up luminosity of all-star particles gravitationally bounded to the subhalo in different passbands (Pillepich et al., 2018a).
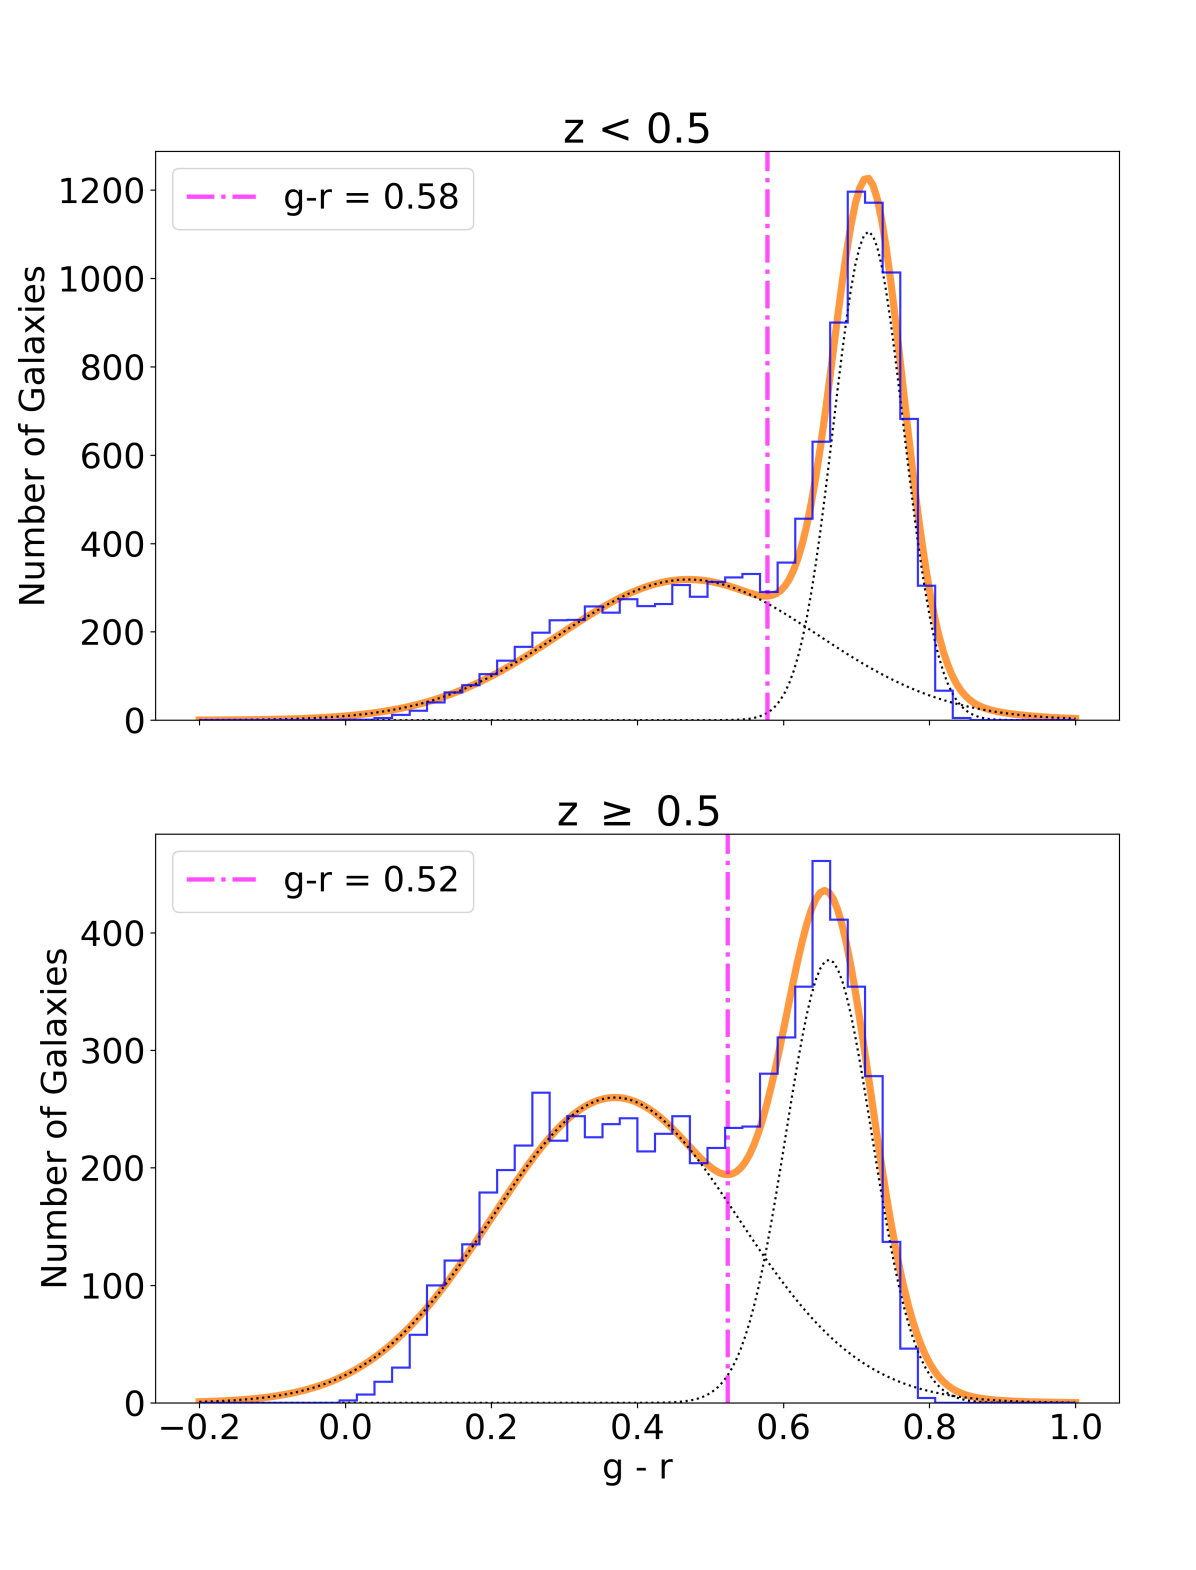
The division into red and blue galaxies is typically done by using a threshold in the colour of the galaxies. As the threshold is expected to vary with redshift due to the Butcher-Oemler effect (Butcher & Oemler, 1984), we define a value for low-redshift and another for high-redshift galaxies. To determine these values, we followed the pipeline proposed by Guglielmo et al. (2019). This process consists of fitting a double-Gaussian model to the galaxy’s colour distribution and using the local minimum of its distribution as the threshold. In the top panel of Figure 4, we show the double-Gaussian fit for galaxies in low-redshift clusters ( ), while the bottom panel shows the results for the high-redshift clusters ( ). Figure 4 shows that the colour distribution for galaxies is bimodal, with two well-defined peaks corresponding to the blue and red galaxy populations (Nelson et al., 2018). The peaks in the distribution of the blue and red galaxy populations are centred at and in (g-r) for the low-redshift bin, and are located at and for the high redshift bin. The thresholds, determined by the minimum between the two peaks, are g-r = for low-redshift galaxies and g-r = for high-redshift galaxies. We define a galaxy as red if its colour exceeds the threshold, while a galaxy is classified as blue if its colour falls below the threshold. These values obtained for the thresholds align with the findings of Guglielmo et al. (2019), which suggest that this value gets lower as the redshift increases.
Figure 4 illustrates that in the low redshift bin, the majority of the galaxy population is made up of red galaxies, while blue galaxies are more significant in the high redshift bin. This difference can be quantified by comparing the heights of the Gaussian curves. For low-redshift galaxies, the peak of the red population is approximately 3.5 times higher than that of the blue population. However, in the high redshift bin, the peak of the red population is only 1.5 times higher than that of the blue population. This procedure allowed us to naturally define two populations, effectively distinguishing between blue and red galaxies.
4.2 Star Forming and Quenched Galaxies
Galaxies can be classified based on their star formation activity into two categories: star-forming and quenched galaxies. Star-forming galaxies are characterised by ongoing star-formation activity, while quenched galaxies have consumed, depleted or heated their gas reservoir, resulting in the cessation of star formation. Defining a single threshold to classify star-forming and quenched galaxies is challenging since star-formation activity depends on the galaxy’s mass and redshift. This paper follows the definition of quenched galaxies proposed by Donnari et al. (2019) and Pillepich et al. (2019), which states that a galaxy is considered quenched if its Star Formation Rate (SFR) is one dex below the extrapolated star-forming main sequence (MS). Donnari et al. (2021) fitted the location of the MS in the stellar mass versus SFR diagram for the galaxies in the Illustris-TNG300 simulations using the relation:
| (1) |
where , and are coefficients obtained from a iterative fitting process. The values for the coefficients are presented in Table 3 of Donnari et al. (2021). Despite the definition adopted in this paper, the main results and conclusions do not change if we repeat the analysis using the widely used definition of quenched galaxies according to their specific star formation rate (sSFR), where a galaxy is quenched if (Wetzel et al., 2012).
In this article, we have calculated the SFR of a galaxy by adding up the SFR of each gravitationally bounded gas cell in it. This value corresponds to the instantaneous star formation rate available in the IllustrisTNG catalogues (Donnari et al., 2019). However, observationally, the SFR is typically derived by comparing the flux measured in two different passbands, resulting in an average SFR value. Although both indicators give information about the galaxy’s star-forming activity, the instantaneous SFR indicates the present stellar formation, while the galaxy’s colour indicates its recent evolution.
5 Differences between Relaxed and disturbed clusters
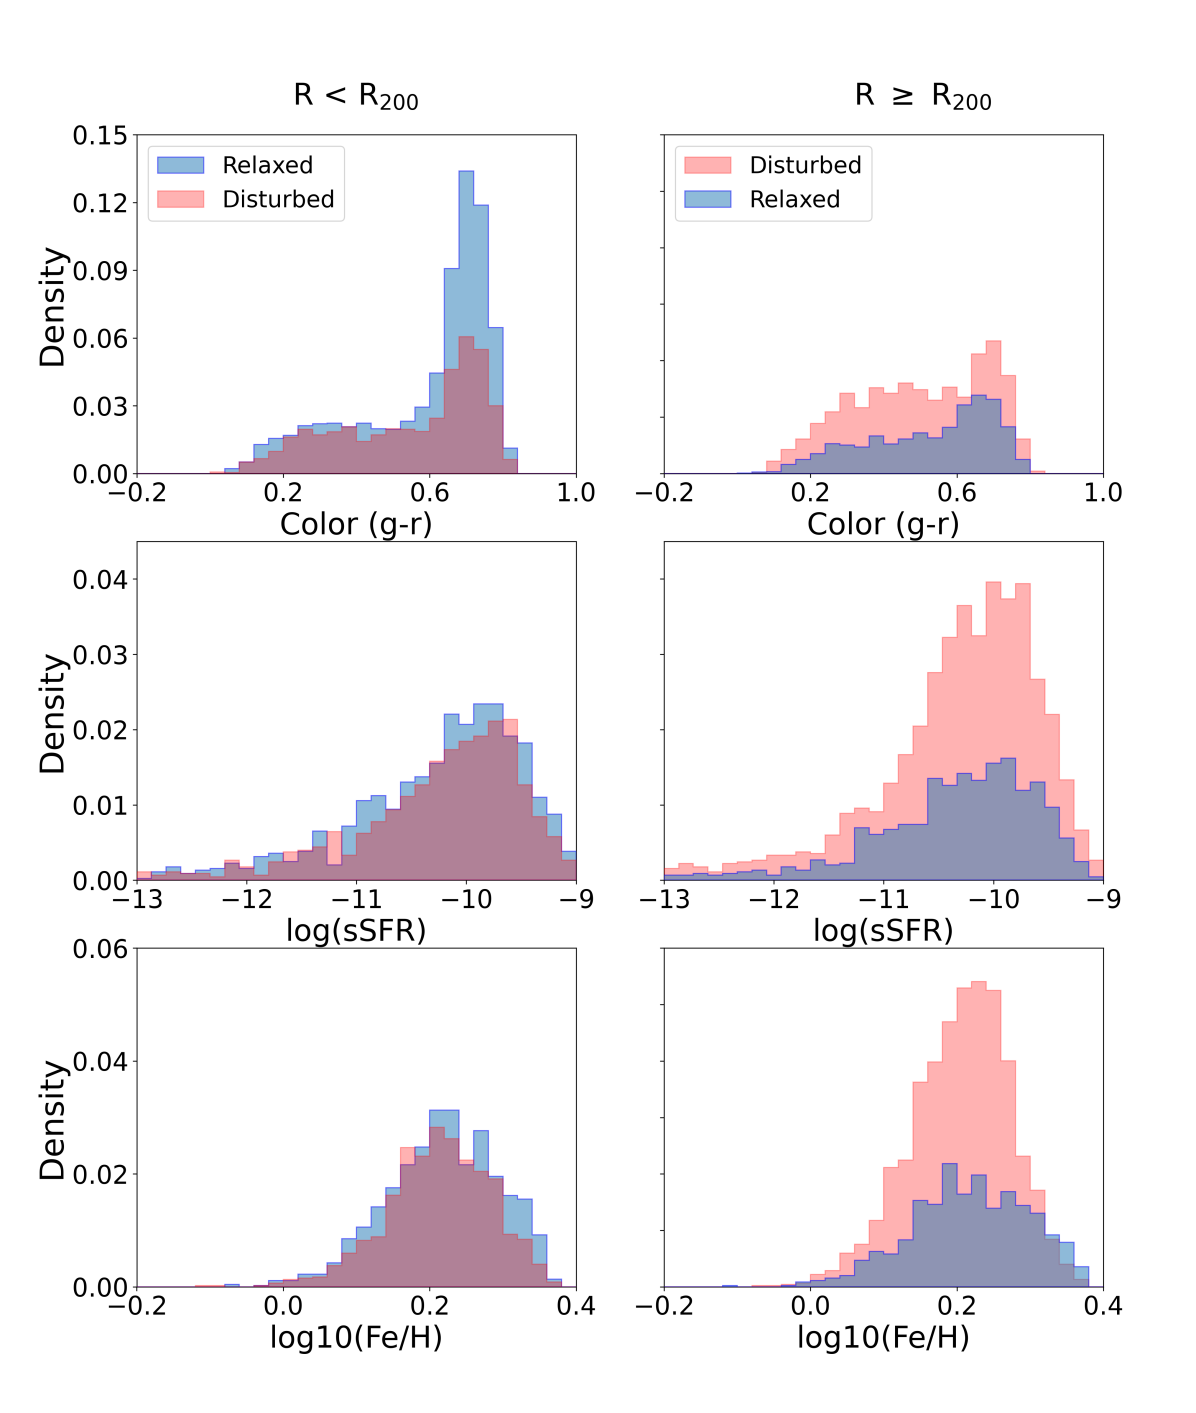
In this section, we use the relaxed and disturbed clusters selected in a redshift range of to study the dependence of the physical properties of galaxies on the dynamical state of their host clusters. Figure 5 shows histograms of the galaxies colour, sSFR and stellar metallicity (Fe/H) in the first, second and last rows, respectively. The left panels present the galaxies within , while the right panels present those outside . In each panel, the histogram for galaxies inhabiting disturbed clusters is shown in red, while for galaxies inhabiting relaxed clusters in blue. All histograms are normalised by the corresponding total number of galaxies, i.e. inside and outside .
First, we notice a larger fraction of galaxies outside the virial radius (up to 3 ) in the disturbed clusters compared to the relaxed ones. This is expected since disturbed clusters are interacting with other structures that also have their satellite galaxies, often located outside the main structure’s . In the top panels, we observe a well-defined Red Sequence (RS), centered at in colour (g-r), dominating the galaxy distribution, especially in the inner regions of the clusters. However, within , the fraction of galaxies in the RS is smaller in the disturbed sample with respect to their relaxed counterpart. The RS peak is also present for galaxies in the outer parts of the cluster (outside ) but is less noticeable. The differences in the populations between red and blue galaxies are quantified using the threshold derived in Section 4.1. The results show that, for the inner parts of the cluster, of galaxies are red in relaxed clusters while in disturbed clusters. Meanwhile, in the outer parts of the cluster, the fraction of the red population decreases to for the relaxed clusters and for the disturbed ones. These results show that the outer parts of clusters have a population of galaxies bluer than those within , which are denser environments, and ram pressure stripping is stronger, thus quenching the galaxies more efficiently. Disturbed clusters have more blue galaxies in the outer parts, suggesting a more recent star formation activity in the disturbed clusters. These results agree with those presented by Ferrari et al. (2003), and Łokas (2020), showing that infalling galaxies to the cluster display bluer colours. Meanwhile, the galaxies inside the become redder as they spend time interacting with the Intra Cluster Medium (Pallero et al., 2022). As expected, we find that early-type galaxies tend to dominate in the centre of clusters, and late-type galaxy population is more important in the outskirts of clusters (Dressler, 1980). Finally, our results broadly agree with (Soares & Rembold, 2019), which, using data from SDSS III, found that, on average, the stellar populations of galaxies in unrelaxed clusters are younger than in relaxed ones.
In the second row of Figure 5, we present the distribution of galaxies’ sSFR, defined as the Star Formation Rate divided by its stellar mass. Note that not all galaxies are shown in this histogram because galaxies are fully quenched. In fact, of satellite galaxies belonging to relaxed clusters have no gas, and have null star formation. However, in disturbed clusters, we find only of galaxies with no gas and have null star formation. As a result, this plot shows just of satellite galaxies in relaxed clusters and of galaxies in the case of disturbed clusters. However, galaxies without gas are considered for the normalisation of histograms. We clearly note that, in the case of disturbed clusters, a significant fraction of star-forming galaxies are outside . Also, in these regions, disturbed clusters have approximately twice as many galaxies with sSFR between 10-9.5 to 10-10.5 [yr-1] as in relaxed clusters. However, the sSFR distribution of the star-forming galaxies, is similar for galaxies inside for both relaxed and disturbed groups and clusters.
Metal elements are synthesised in the stellar interiors and then redistributed into the Interstellar medium through processes such as SN Type I and Type II and AGB winds. Thus, the gas metallicity provides insights into the star formation history in galaxies (Searle & Sargent, 1972; Nagao et al., 2006). The histograms in the bottom panels of Figure 5 show the mean gas iron content distribution, denoted as of galaxies in both relaxed and distrurbed clusters. We see that all distributions range from 0 to 0.4 and peak at similar metallicity values , meaning around 1.6 times the solar metallicity. Also, the distribution of metallicity in relaxed and disturbed clusters is similar for the inner regions of the clusters. We note that, while in the outer cluster region, the distribution is still very similar, we note a larger number of galaxies in the disturbed sub-sample.
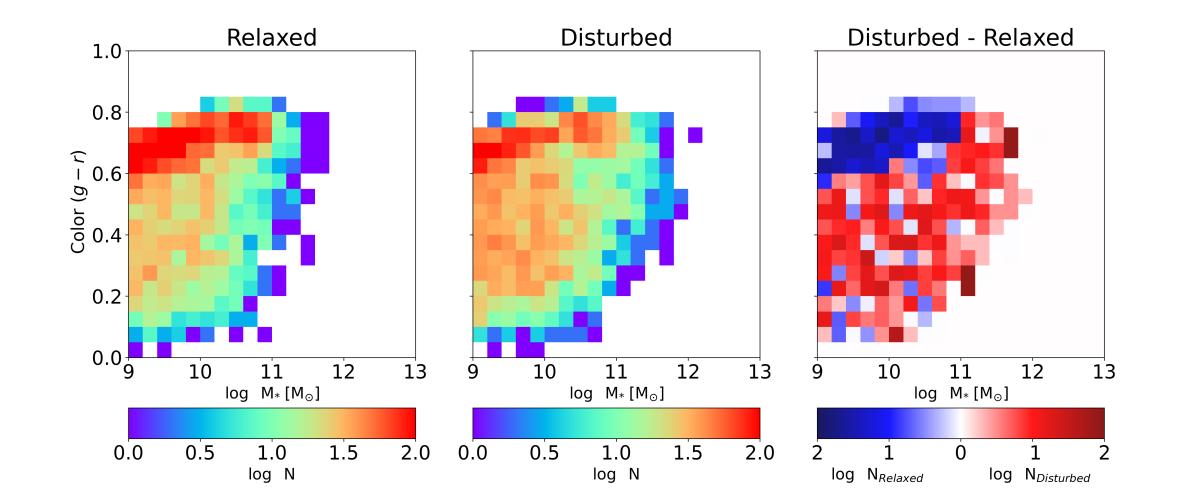
To better visualise the differences in the distribution of galaxies in relaxed and disturbed clusters, we present, in Figure 6, their density distribution in colour (g-r) versus stellar mass, considering all galaxies inside and outside . In the left and middle panels, we show the results for the relaxed and disturbed clusters, respectively. Both panels are normalised to have the same number of galaxies. The most representative feature in the two panels is the RS, which is the zone with the higher density of galaxies around . This zone is populated by red/elliptical galaxies, whose stellar populations are mainly composed of red and old stars. For this reason, they cover a small range in colour but a larger range in magnitudes. Under the red sequence, we can also identify the blue cloud corresponding to galaxies with recent stellar formation activity. To highlight the difference between those two distributions, we show the residual map in the rightmost panel after subtracting the normalised number between the galaxy population of relaxed clusters from the disturbed clusters in each bin. This panel clearly shows that the red sequence is significantly more populated in relaxed clusters, while the remaining area, including the blue cloud, is more prominent in disturbed clusters. This result means that there is more recent formation activity in the disturbed clusters than in the relaxed ones.
Figure 7 presents similar diagrams, but the sSFR versus the stellar mass distribution. Galaxies belonging to relaxed and disturbed clusters are shown in the left and middle panels, respectively. Here, we also include galaxies that have null sSFR with a representative value of [yr-1]. In those plots, we can see the star-forming main sequence around 10-10 [yr-1]. This zone is more populated than other parts of the diagram, except for those that are considered to be fully quenched. However, we notice that it is better defined in the disturbed clusters than in the relaxed ones. We can also identify galaxies with SFR between [yr-1] and [yr-1] transitioning from the star-forming zone to the quenched zone. In the right panel, we show the differences between the number of galaxies in relaxed clusters and the number of galaxies in disturbed clusters. We can see that, with respect to the disturbed clusters, the zone of quenched galaxies is more populated by galaxies in relaxed clusters. In contrast, in all other areas, i.e. the star-forming and transition zones, are dominated by the galaxies in disturbed clusters.
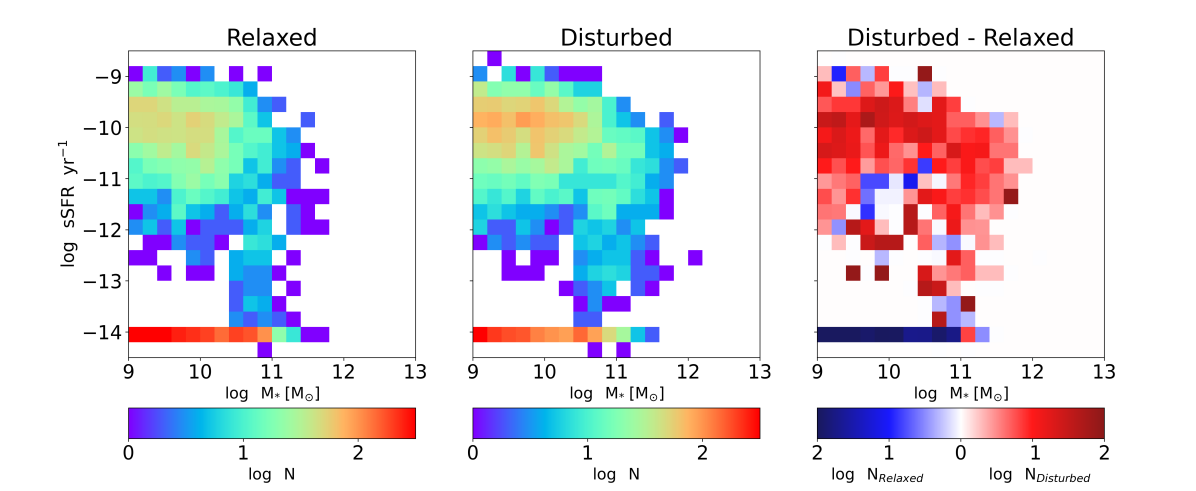
The distribution of galaxies in Figures 6, and 7, and the fact that we observed a clear difference in the fraction of red and quenched galaxies in relaxed clusters and more blue and star-forming galaxies in disturbed clusters, suggests that relaxed clusters are in a more evolved dynamical state than disturbed clusters.
6 Redshift Dependance
Several studies suggest that galaxy clusters observed at low () redshifts, exhibit different physical properties than galaxy clusters at higher () redshifts (Butcher & Oemler, 1984; Pallero et al., 2022; Zenteno et al., 2020). The high redshift clusters, particularly their satellite galaxies, tend to have bluer colours and more star formation (Aldás et al., 2023; Zenteno et al., 2020). To explore this reported difference, in this section, we study the quenched fraction of satellite galaxies as a function of redshift and how it depends on the dynamical state of their host groups and clusters.
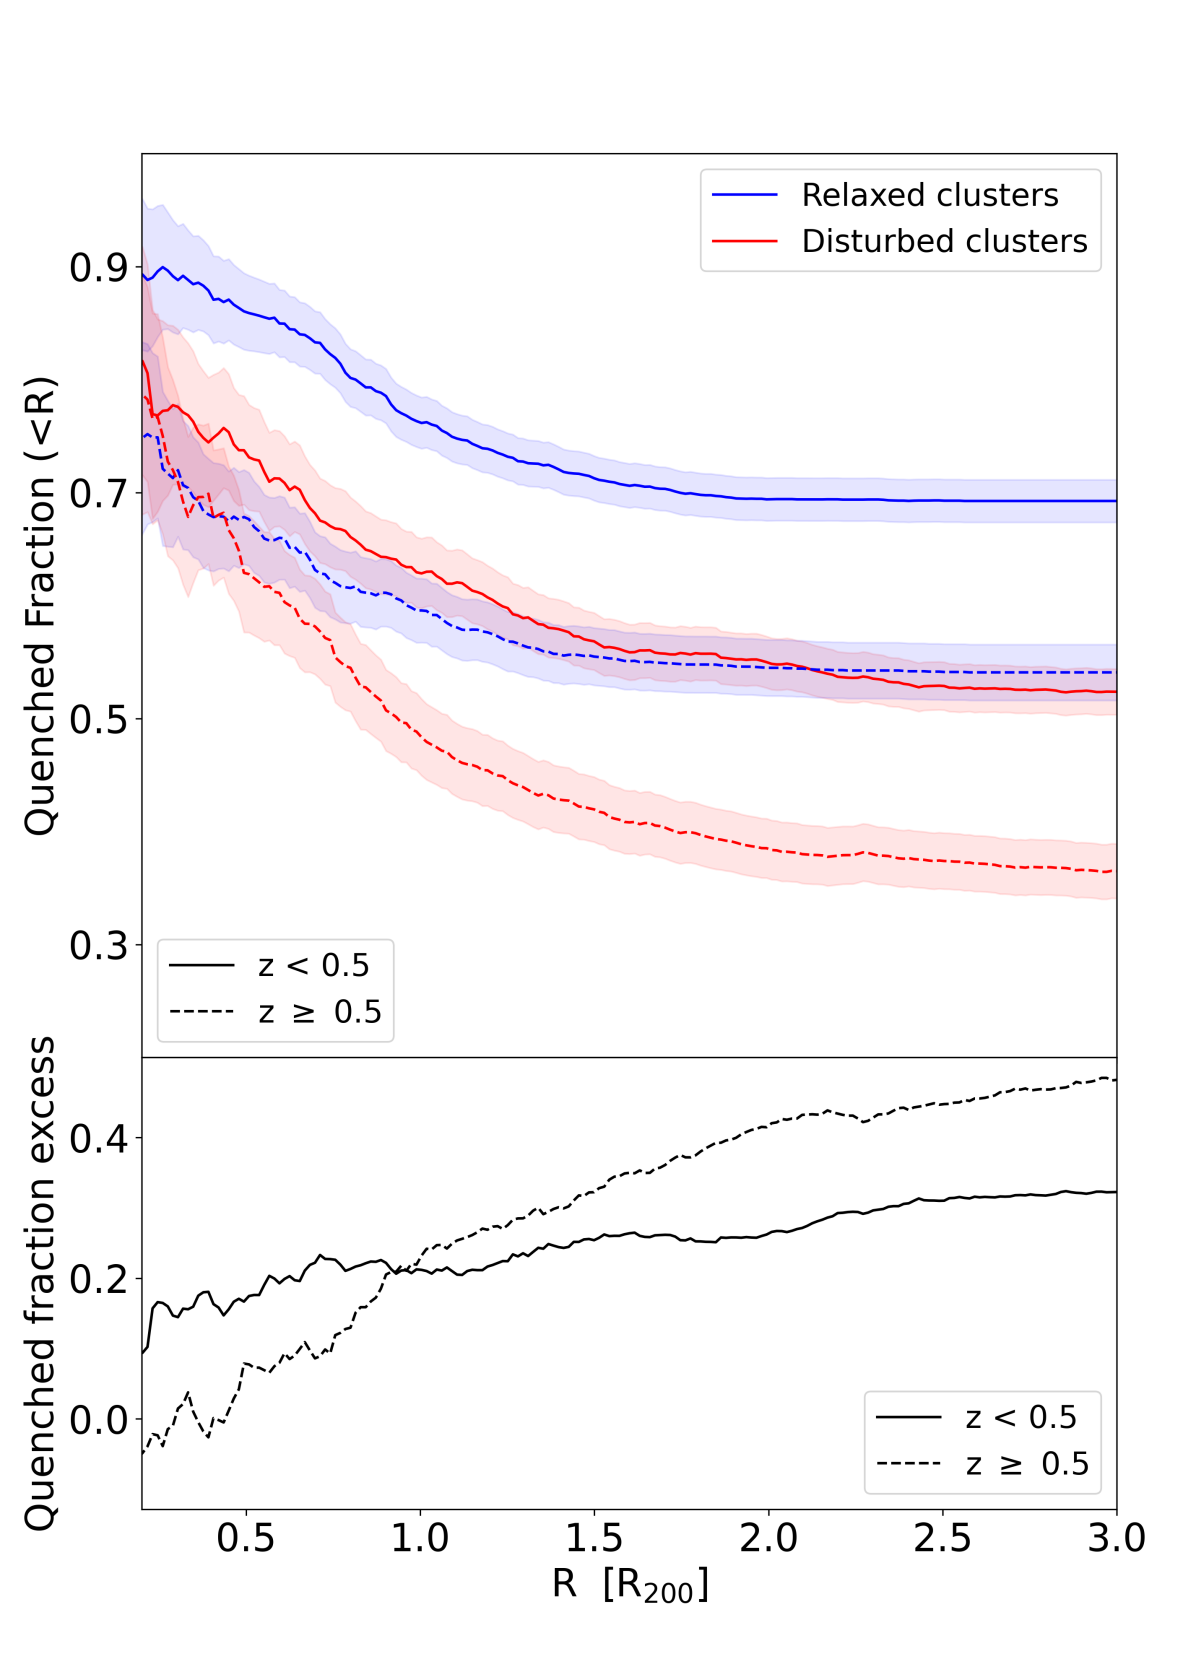
The top panel of Figure 8 presents the quenched fraction of satellite galaxies as a function of distance from the cluster centre (in units of ) for both relaxed and disturbed clusters across different redshift ranges. The galaxies were classified as quenched using the definition provided in section 4.2. The fraction of quenched satellite galaxies was computed as the number of passive galaxies divided by the number of all galaxies whose holocentric distances are lower than R. Blue and red lines denote relaxed clusters and disturbed clusters, respectively, and solid lines indicate the results for the low redshifts () subsamples while dashed lines for high redshift () subsamples. The shaded regions around each line indicate the uncertainties in the quenched fraction computed under the assumption of a Poisson noise. The top panel shows that quenched fractions decrease with increasing distance from the cluster centre in both relaxed and disturbed clusters, with relaxed clusters consistently exhibiting higher quenched fractions. This trend is more pronounced at low redshifts, indicating that environmental quenching processes are more effective or have had more time to act at these redshifts. Specifically, in the low redshift bin, the fraction of quenched galaxies in the central region of the cluster is approximately 90 %, gradually decreasing to 70% considering all galaxies within a radial distance of 3 R200. Meanwhile, for relaxed clusters, the fraction of quenched galaxies in the central regions is around 80 %, diminishing to 52 %, in the cluster outskirts. On the other hand, in the high redshift bin, both relaxed and disturbed clusters manifest a quenched galaxy fraction of around 75% in their central regions, which subsequently decreases to 54%, taking into account satellite galaxies up of the relaxed clusters and 36% for disturbed clusters. The higher quenched fractions observed in the central regions of both relaxed and disturbed clusters suggest the presence of strong environmental effects like ram-pressure stripping and tidal interactions close to the cluster core (Boselli & Gavazzi, 2006).
To conduct a more robust comparison between the quenched fraction in relaxed and disturbed clusters, and noting that the quenched fraction consistently exhibits higher values in relaxed clusters compared to disturbed ones, we introduce the concept of the relaxed quenched fraction excess following Wetzel et al. (2013), defined as:
The relaxed quenched fraction excess, presented in the bottom panel of Figure 8, quantifies the excess (or deficit) of quenched galaxies in relaxed clusters with respect to those typically found in their disturbed counterparts. The bottom panel shows that quenched fraction excess for relaxed clusters increases with distance from the cluster centre, especially at high redshifts. This suggests, especially at , that quenching in relaxed clusters is more effective even in the outskirts, potentially impacting satellite galaxies that are on infalling trajectories or those that have been ejected but remain within the cluster’s gravitational influence (Bahé et al., 2013). Although the quenching effects are much stronger around , Wetzel et al. (2014) show that the environmental quench could extend up to and can be explained by satellites ejected by the cluster. In contrast, at lower redshifts, the excess remains relatively stable, reflecting a sustained quenching effect throughout the cluster’s extent. This stability aligns with Pallero et al. (2022), who found that most of satellites are quenched during their initial infall, indicating that initial interactions with the cluster environment are crucial for quenching.
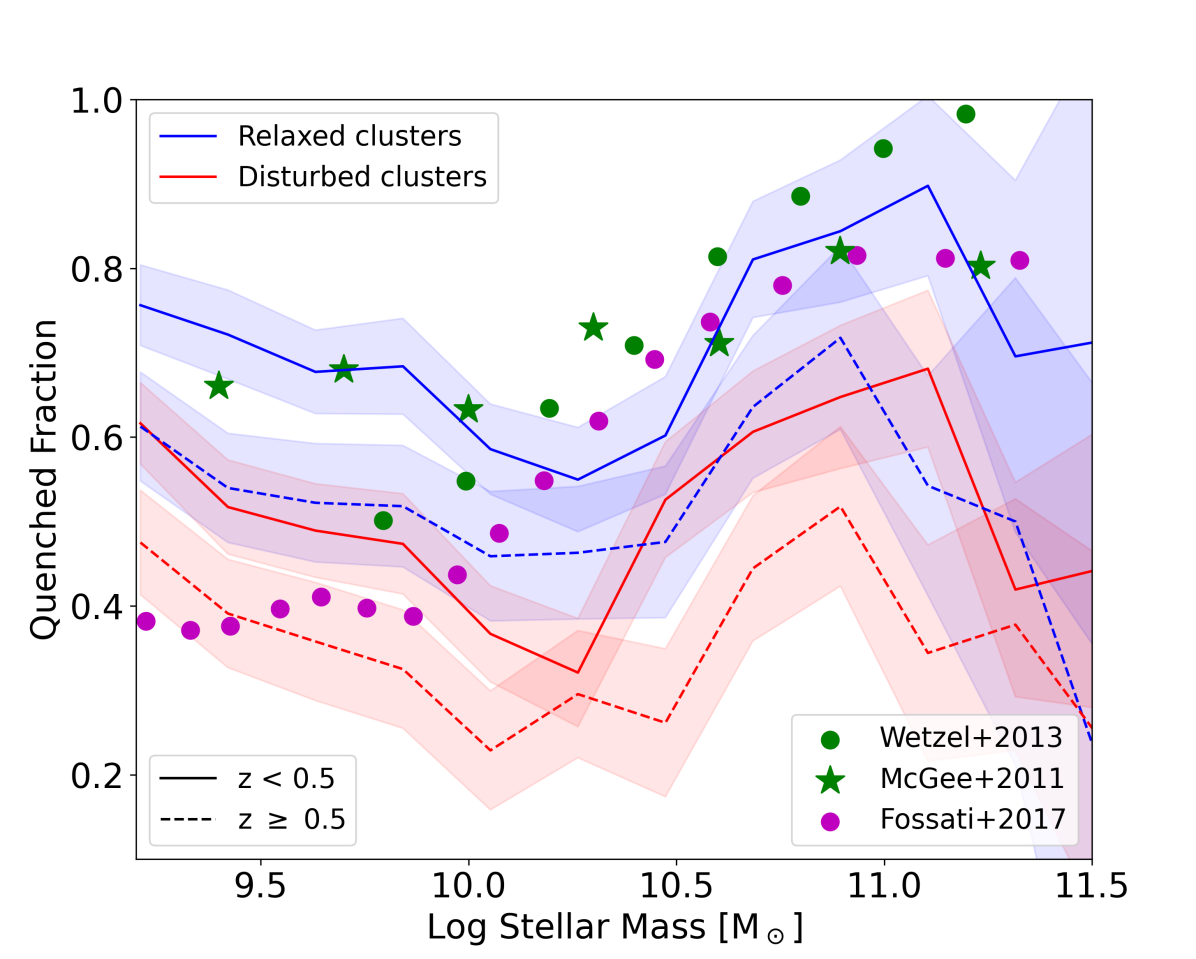
In Figure 9, we show the quenched fraction of satellite galaxies as a function of galaxy stellar mass. At low redshifts, the quenched fraction in relaxed clusters (solid blue line) shows a slight decrease for masses between and , followed by a significant increase with stellar mass, peaking around . The quenched fraction for disturbed clusters at low redshifts (solid red line) follows a similar pattern, but remains consistently lower than in relaxed clusters. This difference is present at low- and high-redshift bins, suggesting that the more stable environments (relaxed clusters) facilitate more effective quenching. We compared our simulated quenched fraction with various observational datasets. For the low-redshift bin, the data from Wetzel et al. (2013) (green circles) correspond to satellite galaxies bound to low redshift clusters (up to ), based on the NYU Value-Added Galaxy Catalogue from the Sloan Digital Sky Survey (SDSS). These observational results align well with the quenched fraction in relaxed clusters, especially at higher stellar masses, but show discrepancies in the low mass regime. As demonstrated by Donnari et al. (2021), these differences can be attributed to the sample selection. In this context, they illustrated that Wetzel’s data could be better replicated by including satellite galaxies bound to lower mass groups ().
Furthermore, comparing with Mcgee et al. (2011) (green stars), using SDSS data at , it shows that our simulated quenched fractions at low redshift relaxed clusters follow a similar trend. Although their work does not specify any mass cutoff for the galaxy groups, they infer that they are including galaxies belonging to groups with masses . Therefore, this closer agreement between our simulated quenched fraction and McGuee’s observational data is likely due to the better match between the sample selection criteria.
The data from Fossati et al. (2017) (purple circles) correspond to high redshift observations. Specifically, we are comparing the passive galaxy fraction for satellite galaxies with host masses in the redshift range of . Our simulations reasonably match the observed data, particularly at lower stellar masses. However, the simulations underestimate the quenched fraction in the high mass range. Nevertheless, it is worth noting that the simulation can reproduce a lower quenched fraction in the high redshift bin compared to the low redshift bin at low galaxy mass regimen, as obtained from observational data.
Figure 9 shows that there is a decrement in the quenched fraction for masses exceeding . This deviation is due to numerical noise resulting from poor statistics in this mass range. As shown in Donnari et al. (2021), using the significantly larger sample extracted from the TNG300 simulation, considering a similar halo selection criteria and the same criteria to define quenched galaxies. It is worth noting that applying the criteria proposed by Wetzel et al. (2012) to separate between star-forming and passive galaxies (sSFR) does not alter our findings and primary conclusions.
In summary, this section’s results underscore the influence of the cluster’s dynamical state on satellite galaxy quenching. Relaxed clusters exhibit higher quenched fractions at both redshifts, suggesting that stable environments enhance the efficiency of quenching mechanisms. The difference between relaxed and disturbed clusters is more pronounced at low redshifts, where mature clusters have more time to quench their satellite galaxies effectively.
7 Gas Content
Here, we analyse the gas content of satellite galaxies within both relaxed and disturbed clusters and groups in the IllustrisTNG simulations. Quantifying the gas in various phases provides valuable insights into the physical mechanisms governing galaxy evolution and could provide important information regarding the cluster’s dynamical state (Pillepich et al., 2018b; Nelson et al., 2019). The presence of gas is directly linked to galaxy transformation and evolution. As previously discussed, stellar populations born at different times will have different characteristics depending on the properties of the intra-galaxy gas. For example, gas clouds are progressively enriched with chemical elements, thanks to processes such as SN Type I and II, and winds from AGB stars. As a result, galaxies with ongoing start-formation activity will have not only bluer stellar populations, but also different chemical compositions. In dynamical terms, Zhang et al. (2016) showed that merging time scales in galaxy clusters are dependent on their gas content. Clusters with higher gas fractions tend to have shorter merging time scales than those with lower ones. This difference is attributed to the additional gravitational force exerted by the gas, resulting in a quicker infalling of the structures.
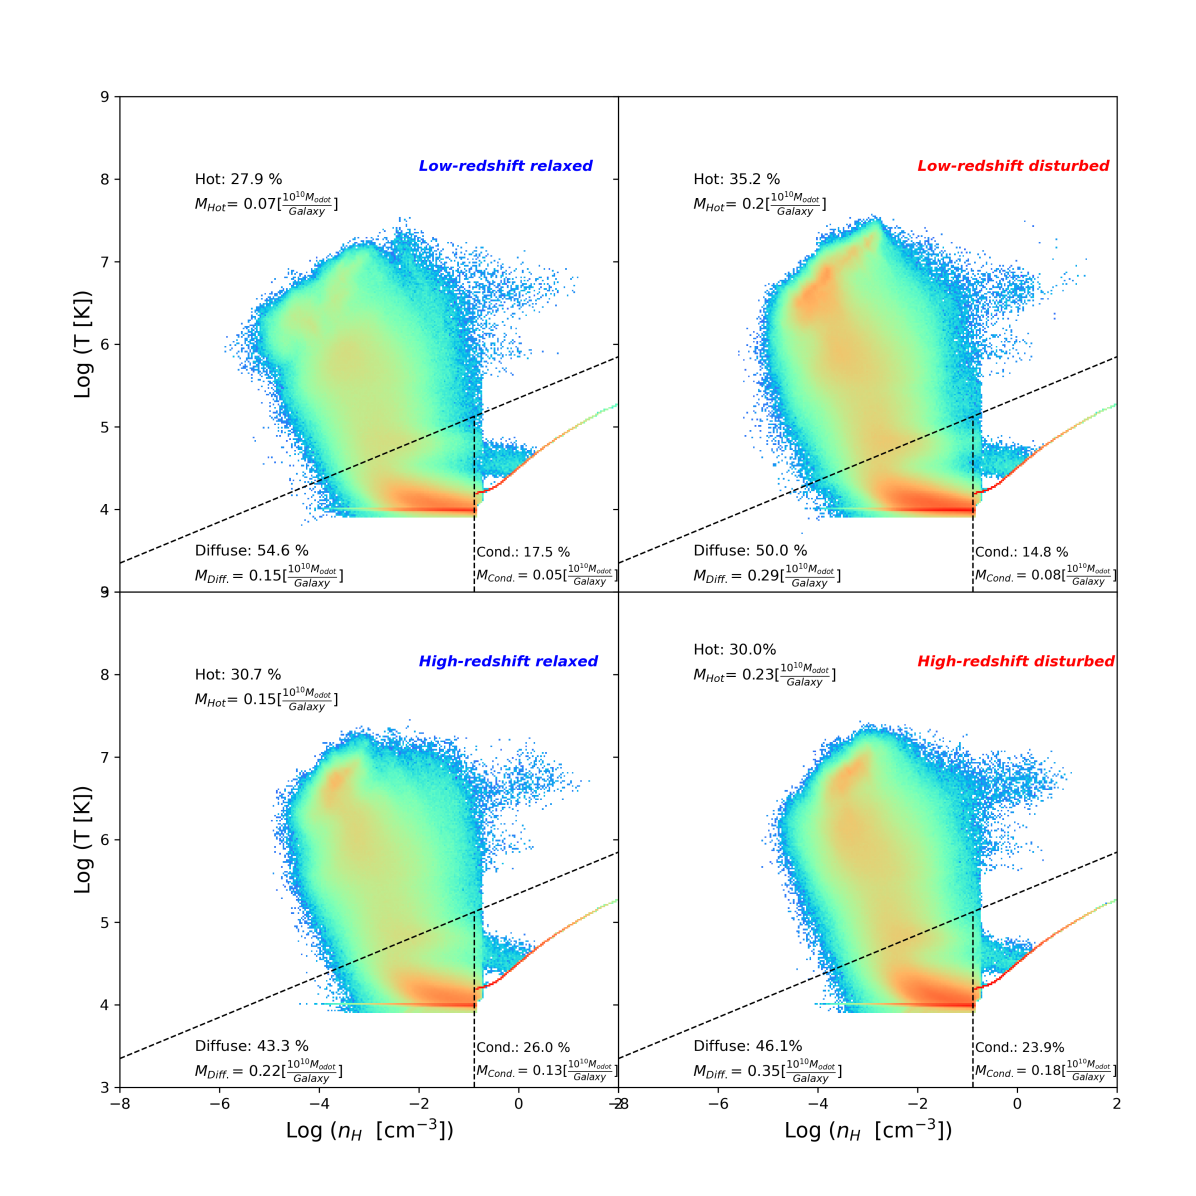
To characterise the gas available in galaxies bound to relaxed and disturbed clusters, we classify it into diffuse, condensed, and hot phases based on density and temperature. The temperature of the gas is calculated for each gas cell using the internal energy and the Electron Abundance , provided in the simulation outputs with the following equation
Here is the Boltzmann constant, , , is the proton mass, and the mean molecular weight, defined as:
The classification of the different gas phases applied here is based on the boundaries proposed by Torrey et al. (2012) and Torrey et al. (2019). Gas is considered hot if , where is the gas density expressed in units of atoms of Hidrogen per unit of cubic volume. Gas not meeting this condition is further categorised as diffuse if its density is , and as condensed if its density is greater than .
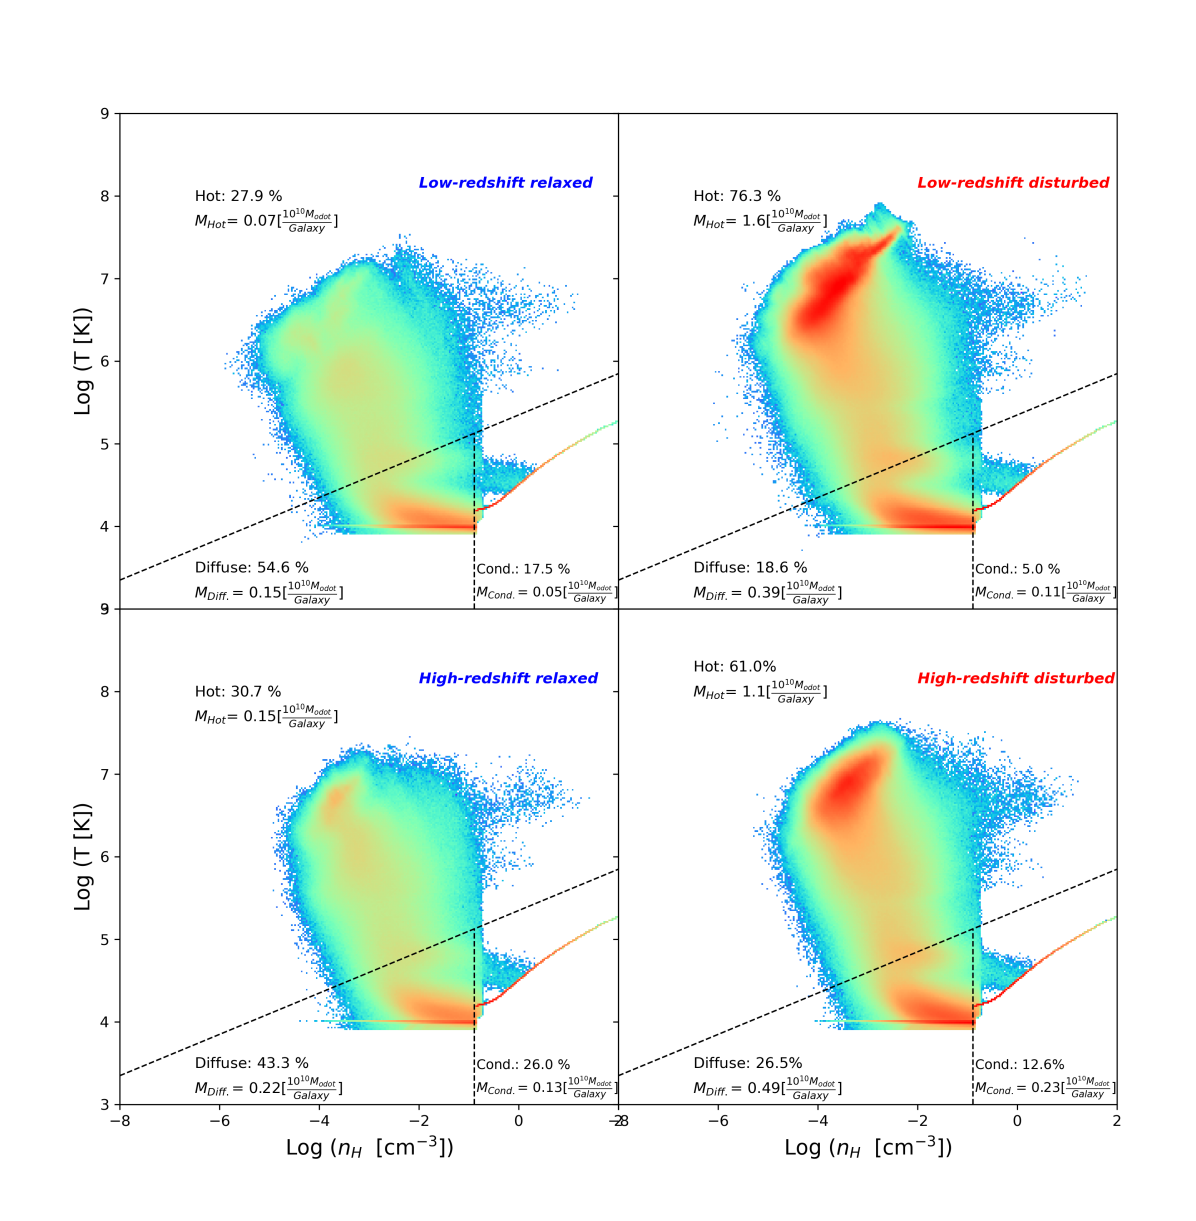
In Figure 10, the four panels show the distribution of gas related to galaxy clusters in different categories based on their dynamical state (relaxed or disturbed) and redshift (low or high). Those diagrams were obtained by adding together all of the gas particles bound to the cluster galaxies, excluding the gas of the BCG. The x-axis represents the logarithm of gas density ( in cm-3), and the y-axis displays the logarithm of gas temperature (T in K). Each panel is color-coded to represent the amount of gas, with blue indicating lower gas quantities and red indicating higher quantities. Additionally, each diagram includes the percentages of gas in the different phases relative to their total and the average amount of gas per galaxy in the corresponding phase per galaxy satellite. The dashed lines demarcate the boundaries between the different gas phases.
Figure 10 allows us to understand the relationship between the amount of gas available and the dynamical state of the clusters. Satellite galaxies in groups and clusters contain significant amounts of gas across all gas phases. When comparing satellite galaxies in relaxed and disturbed clusters, it is evident that disturbed clusters contain more gas in the hot phase in both low- and high-redshift bins compared to the relaxed ones. The difference in the hot gas fraction is quite substantial, with 28% for relaxed clusters and 76% for disturbed clusters in the low-redshift bin. In the high-redshift bin, the hot gas fraction is 30% for relaxed clusters and 61% for disturbed clusters. It is important to note that not only is the fraction of hot gas greater in disturbed halos, but more importantly, the average mass per galaxy is much higher.
We now look at the diffuse gas phase, corresponding to cold gas cells with a density lower than that required to form stars. In this phase, disturbed clusters have a significantly higher average amount of gas per galaxy than relaxed clusters despite having a lower diffuse gas fraction. For instance, in the low redshift bin, there is 2.6 times more diffuse gas in galaxies belonging to disturbed clusters compared to relaxed ones. This difference is also observed in the high redshift bin, where disturbed cluster galaxies have 2.2 times more diffuse gas available than relaxed ones. It is crucial to quantify the availability of gas in this phase because, during cluster mergers, the gas can be compressed in the front half of galaxies due to ram pressure (Schaye et al., 2015; Troncoso-Iribarren et al., 2020). This can lead to a burst of star formation and gas transfer to the trailing half of galaxies. Using EAGLE simulations, Troncoso-Iribarren et al. (2020) concluded that this effect is more important for galaxies with stellar masses lower than M⊙ located near . This enhancement in star formation in infalling galaxies was observationally confirmed by Roberts et al. (2022) studying the cluster IC3949 using data from the ALMA MaNGA survey. Galaxies with stellar masses larger than this mass range tend to arrive in their final cluster already preprocessed and quenched by their active galactic nuclei (AGN). Additionally, these galaxies may have very little gas in the diffuse phase, as most of it is heated by the AGN. Consequently, gas compression does not play a significant role in this mass range.
The condensed gas phase is the one that has the pressure and density to begin forming stars. This gas phase distribution has a characteristic thin shape in the density-temperature phase diagram, governed by the Springel & Hernquist (2003) state equation, as shown on the right side of the plots in Figure 10. The amount of available condensed gas per galaxy in disturbed clusters is around times the amount of gas available in relaxed ones. As a result, on average, the star formation rate is higher in disturbed galaxy clusters than in relaxed counterparts. This ongoing star formation can explain the presence of a more diverse galaxy population and the excess of blue galaxies found in disturbed clusters compared to the relaxed ones presented in Section 5. This difference is present in both redshift bins. However, it is more pronounced for galaxy clusters in the high redshift bin, suggesting that the excess of blue and young galaxy population is likely more significant in the case of clusters between . This result agrees with Aldás et al. (2023), where they observed that the galaxies are bluer in the disturbed galaxies for this redshift range.
The differences in the hot gas fraction found between the relaxed and disturbed clusters presented in Figure 10 can be explained by either a more massive population of galaxies in the disturbed cluster (containing a larger amount of hot gas), as described by Torrey et al. (2019), or by gas shock heating mechanism during cluster interactions, injecting energy into the gas reservoir. To understand the cause of this difference and to make a more fair comparison between the relaxed and disturbed clusters, in Figure 13, we present plots analogous to those in Figure 10 but now also excluding the BCG belonging to the secondary structure falling to the main cluster. A primary distinction evident upon comparison between both figures lies in the hot gas phase, where the large amount of hot gas with high temperature and low density, observed in Figure 10 becomes less pronounced when excluding the BCG from the secondary galaxy cluster. Consequently, the hot gas fraction in disturbed clusters decreases from 70% to 35% for low-redshift disturbed clusters and from 60% to 30% for high-redshift disturbed clusters. Despite this, the fraction of hot gas in disturbed clusters remains larger than that measured in their relaxed counterparts.
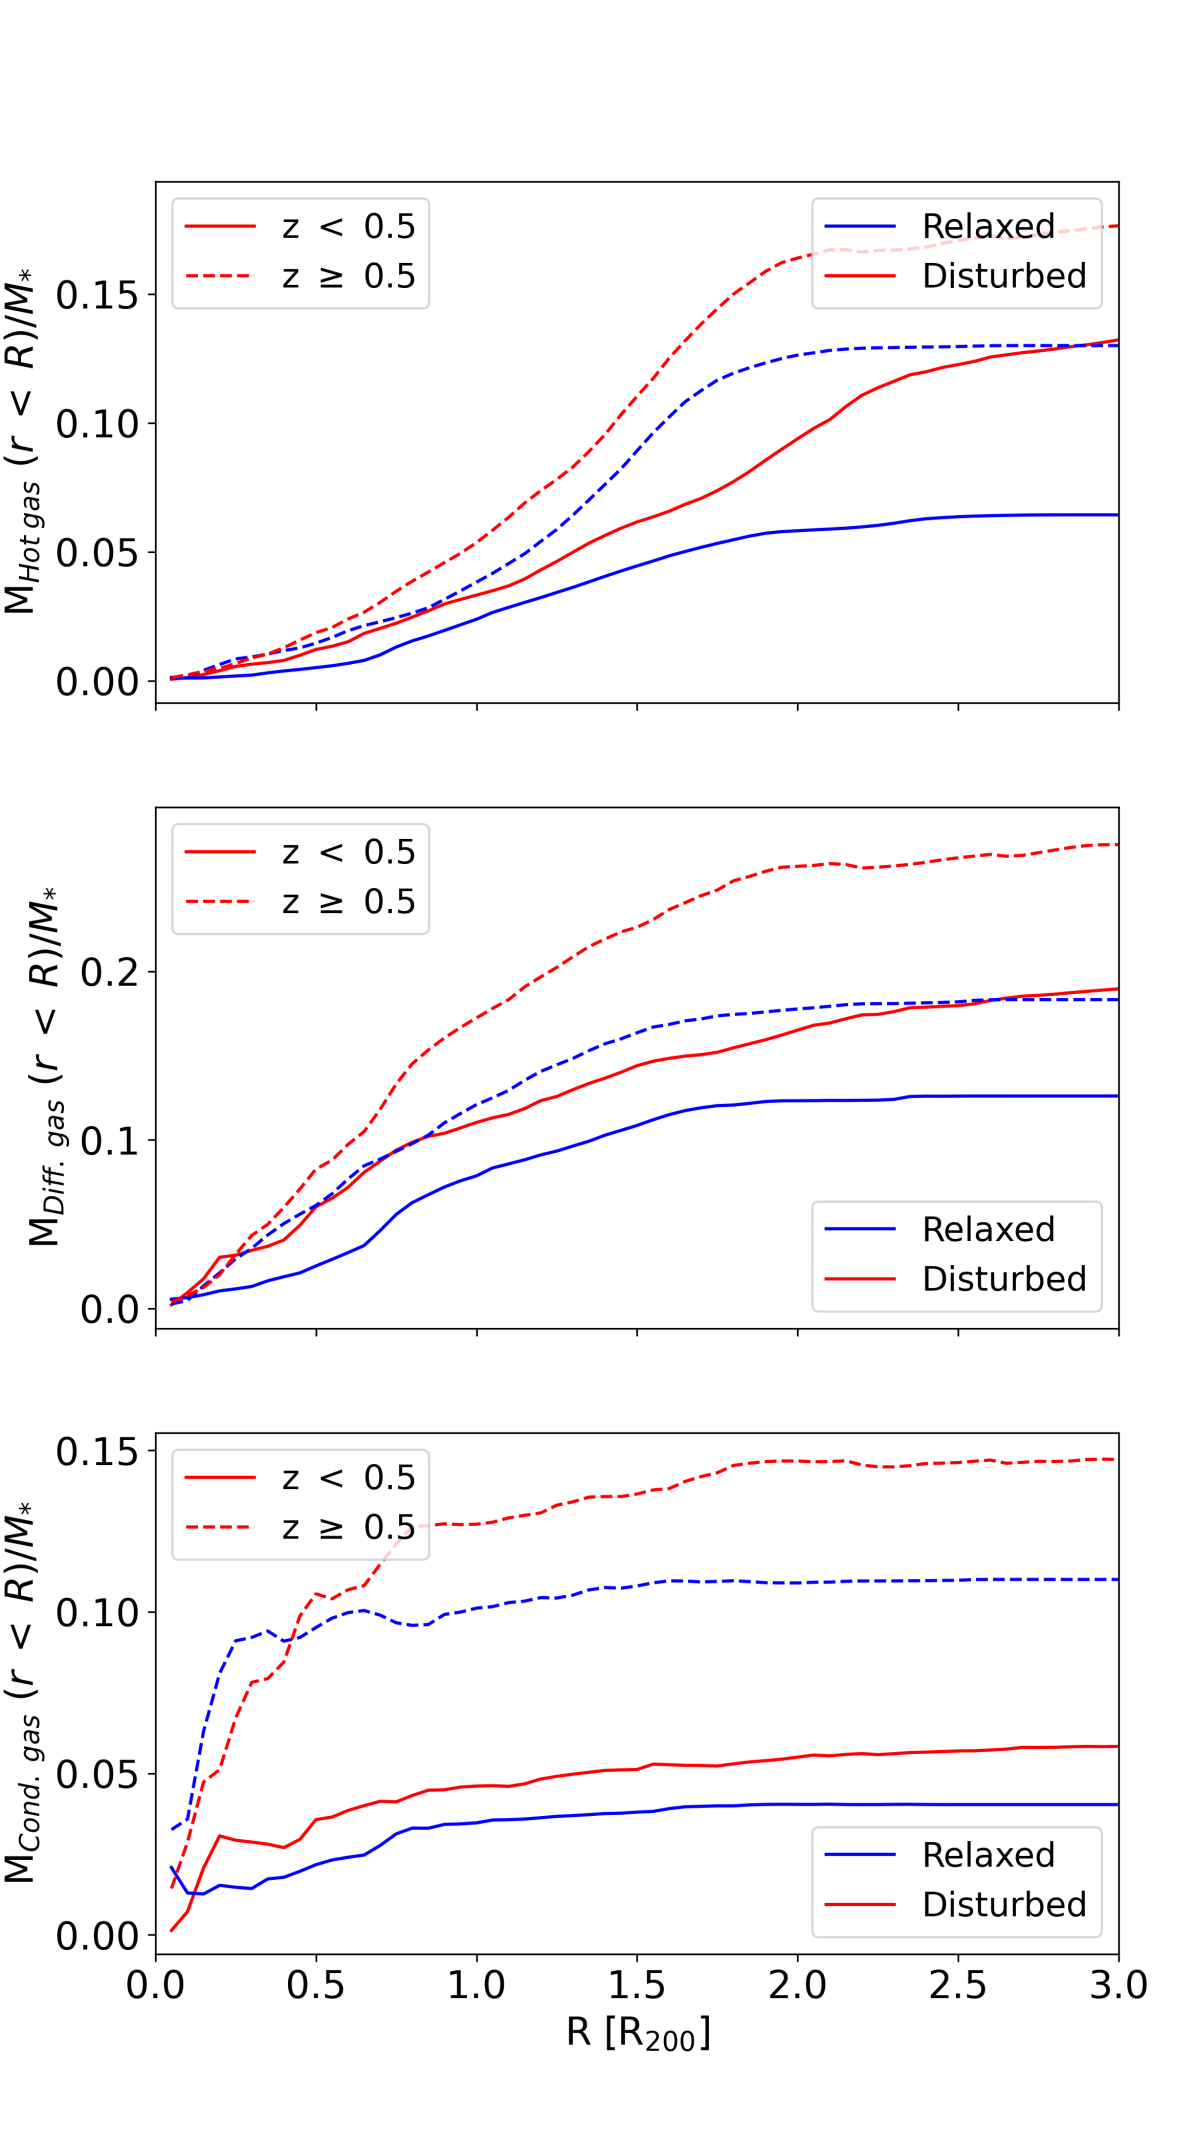
Finally, we examine the gas-to-stellar mass ratio, hereafter referred to as the gas ratio. In this analysis, we include gas cells bound to all satellite galaxies, excluding the BCG in relaxed clusters and the main and secondary BCGs in disturbed ones. The gas ratio parameter is calculated by adding up the mass of all gas cells within a given cluster centric radius , and dividing it by the total stellar within the same volume. The gas ratio provides insights into the baryon content of the satellite galaxies bounded to the clusters in different dynamical states. This ratio is also closely linked to ram pressure, the predominant mechanism of gas stripping for galaxies in a dense environment like clusters (Jung et al., 2018). The results are presented in Figure 11, where we show the mean gas ratio for different gas phases: hot gas in the top panel, diffuse gas in the middle panel, and condensed gas in the bottom panel, all as a function of the cluster centric distance. The figure shows that the hot gas bounded to galaxies within is relatively sparse in relaxed clusters, while it is slightly larger in disturbed clusters at the same redshift. This difference in the hot gas mass ratio between relaxed and disturbed clusters becomes more pronounced in the outer regions of galaxy clusters, where the presence of hot gas is larger in disturbed clusters, likely due to the accretion shocks (Cole et al., 2000). The middle panel shows the diffuse gas mass ratio, which is also primarily found in galaxies located in the outer parts of the clusters but closer to the cluster’s centre than the hot gas. This panel also indicates that galaxies in relaxed clusters have a larger diffuse gas ratio in disturbed clusters compared to relaxed ones. Finally, the bottom panel shows the condensed gas distribution, predominantly located in the galaxies in the central regions of clusters. For the high redshift bin, the condensed gas ratio rises sharply at small radii and then stabilises, whereas in the low redshift bin, the ratio is relatively flat and minimal. These findings are consistent with the notion that, at lower redshifts, most galaxies are already quenched by the time they are incorporated into their final host clusters (Pallero et al., 2022).
Furthermore, these results align with the observations made by Stroe et al. (2014), who, using optical spectroscopic data for the clusters CIZA J2242.8+5301 and 1RXS J0603.3+4213, demonstrated that mergers in gas-rich clusters lead to increased star formation rates. This increase is attributed to shock waves that compress the gas of the cluster galaxy members during these mergers. This finding is also in agreement with Aldás et al. (2023), who observed an excess of blue galaxy population in disturbed clusters in the high redshift bin compared to relaxed ones. In contrast, differences for galaxies in the low-redshift bin were within the error, suggesting a convergence in galaxy properties at lower redshifts.
It is worth noting that by including the secondary BCG in disturbed clusters, the results for the condensed and diffuse gas ratio are not affected. However, a significant increase in the hot gas ratio is observed, as illustrated in Figure 10. This indicates that the secondary BCG is primarily composed of hot gas while containing minimal amounts of diffuse and condensed gas. These results support the idea that the populations of galaxies can provide relevant information about the cluster’s dynamical state, especially when both BCGs of the merging system are removed from the analysis.
8 Star Formation burst and post quenching.
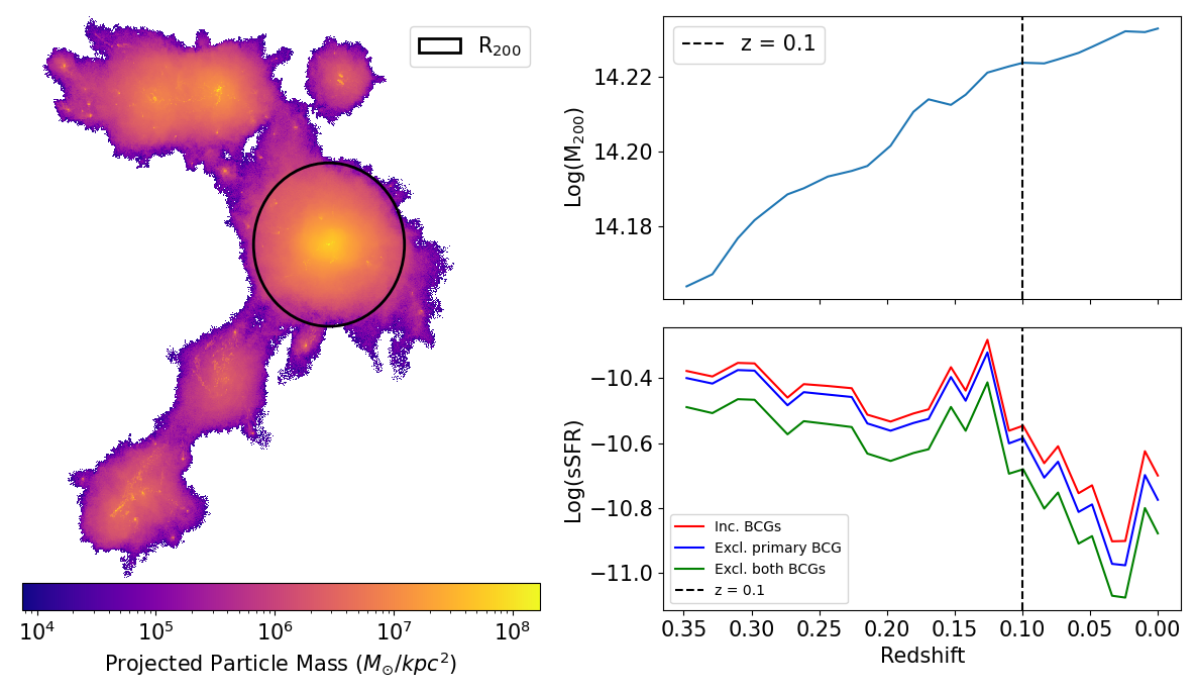
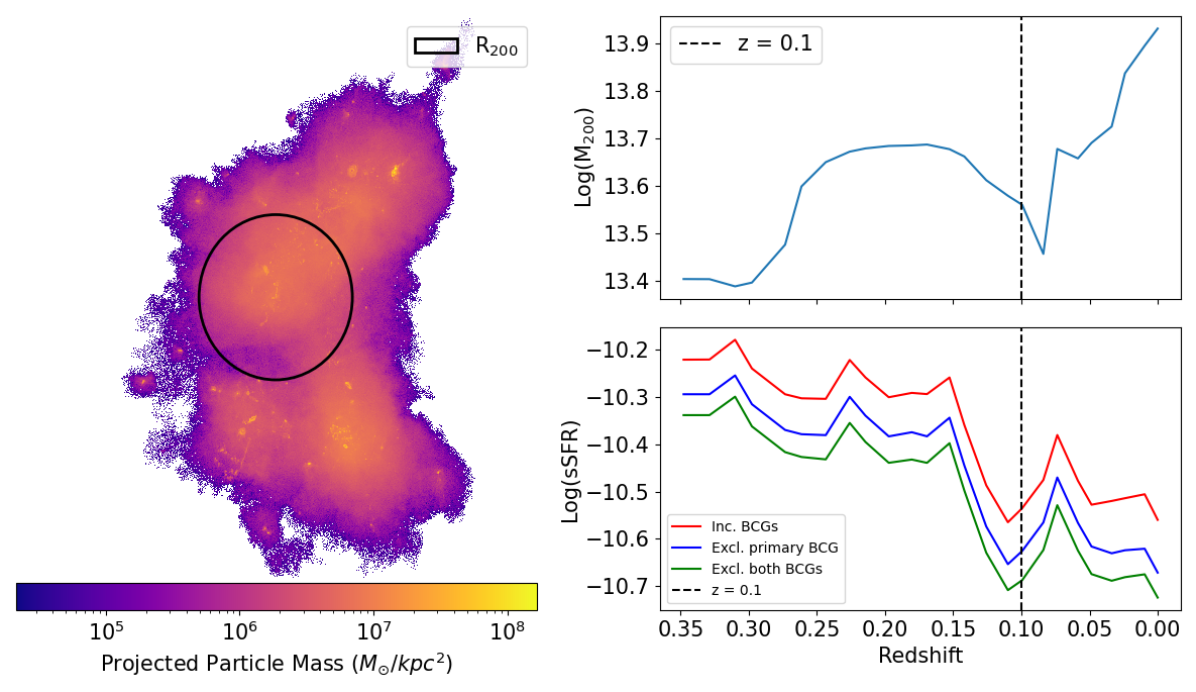
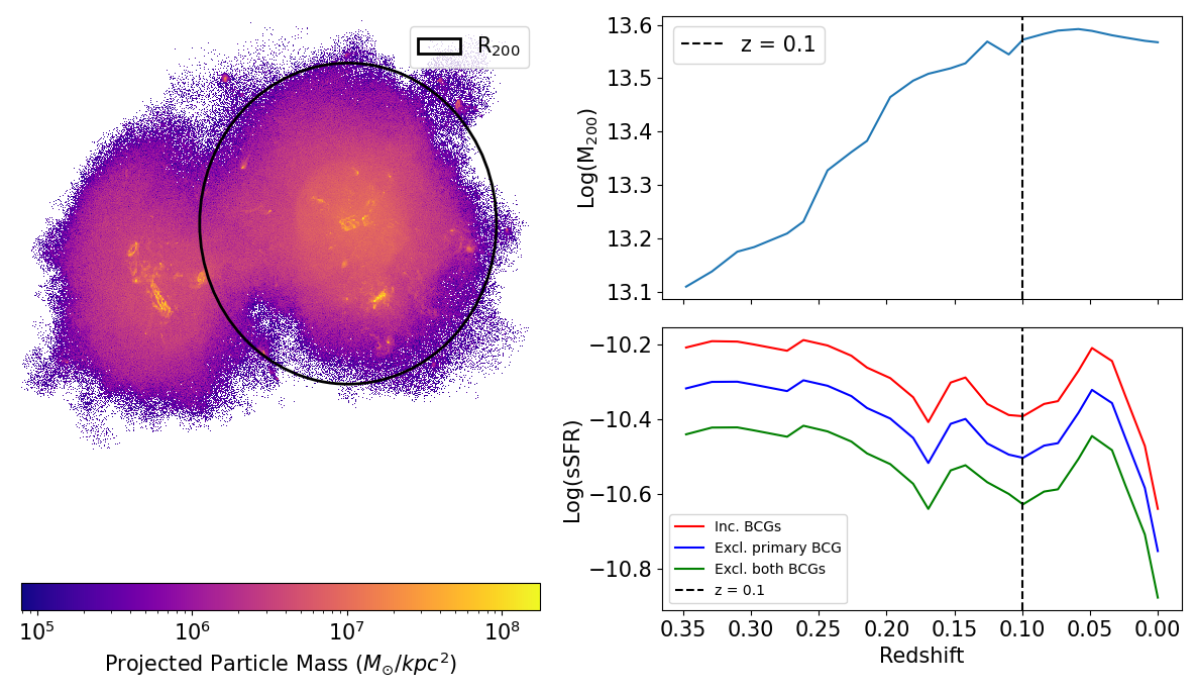
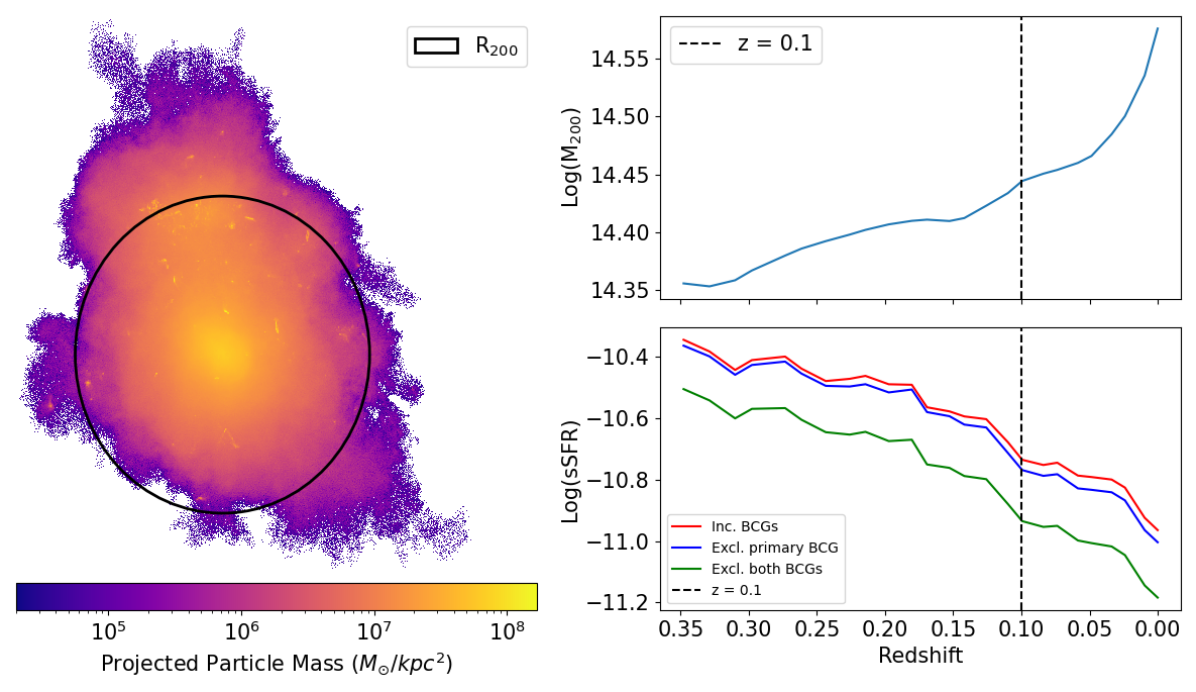
To delve into the origins of the differences in galaxy populations described in Section 5, specifically the higher fraction of blue galaxies in disturbed clusters compared to relaxed clusters, this section explores the star formation history and gas mass distribution in disturbed galaxy clusters during the merging process. In this analysis, we studied four representative disturbed clusters at different stages of interaction: two clusters where the structures are approaching but have not yet crossed and two clusters in a more advanced merging stage where the secondary structure has already crossed of the main one. The clusters were selected at redshift to provide insights into the later stages of galaxy and cluster evolution as they are closer to their present-day configurations. In Figure 12, we explore the evolution of these clusters as a function of time. On the left side of each panel, we show their projected gas mass distribution at , with a solid line circle representing of the main cluster. It is evident that all four clusters are indeed disturbed; however, those in the top panels are in the early stages of interaction, whereas those in the bottom panels are in a more advanced merging stage. The gas morphology in these clusters is irregular and clumpy, showing two or even more structures interacting. Some gas clouds might appear elongated or have comet-like shapes with tails pointing away from the dense central regions, highlighting the effects of ram pressure stripping. On the top right of each panel, we show the time evolution of the cluster’s virial mass, , of the main structure, computed as the total mass within shown in the left panel. The dotted lines in those panels indicate the redshift of the shown gas distribution. We note that the virial mass increases over time, reflecting the hierarchical nature of structure formation in the universe, where small structures merge to form larger ones. The virial mass plots show pronounced raises toward lower redshifts, consistent with their merging nature. Aditionally, the bottom right side of each panel shows the integrated sSFR of the satellite galaxies as a function of redshift. This integrated sSFR is computed considering both BCGs (red), excluding the primary BCG ( blue), and excluding both BCGs (green). The presence of peaks and subsequent rapid decreases observed in the sSFR in most clusters shows that it can be influenced by dynamical processes like mergers. The asymmetric gas distributions and gas tails in cluster galaxies have been associated with an enhancement in the star formation rate, which is produced by the gas compression in the leading edge of the galaxies (Safarzadeh & Loeb, 2019; Vulcani et al., 2020; Rohr et al., 2023). It’s been suggested that, initially, a merger can trigger star formation by compressing the gas, but gas stripping and heating due to the interaction quench the galaxy over time, as shown in Figure 12. These results agree with Fujita & Nagashima (1999), who studied the impact of ram pressure on the SFR of satellites in clusters. They found that the SFR increases by a factor of two when galaxies reach the first pericenter passage, given the gas compression. However, after this point, there is a rapid quenching due to the effect of ram pressure near the central regions, resulting in the stripping of the cold gas and, thus, the depletion of molecular gas. This scenario for gas-rich merging clusters was also reported by Stroe et al. (2014), suggesting this short star formation rate increase could last just a few 100 Myr.
Our results complement those presented by Contreras-Santos et al. (2022) who, using the Three Hundred Simulations, found a slight increase of young stars in the BCGs after cluster mergers. They found that the merger-induced star formation rate was also accompanied by an increase in the luminosity and an excess of blue BCGs in the disturbed cluster sample compared than with the relaxed one. The same trend described for those four clusters presented in Figure 12 is observed in around 75% of disturbed clusters at redshift . This is a first boost in star formation rate when the clusters start to interact, followed by a cessation of star formation while the cluster reaches a relaxed state. The process involved in boosting the star formation rate and post-quenching will be studied and quantified more deeply in a follow-up article.
9 Summary and Conclusions
In this study, we used the Illustris TNG100 simulations to investigate the relationship between the dynamic state of galaxy groups and clusters and the physical characteristics of their galaxy population. We selected a sample of groups and clusters with masses and classified them between disturbed and relaxed based on the offset between the position of the Brightest Cluster Galaxy (BCG) and the position of the center of mass of the gas cells. Clusters were considered disturbed if this offset is larger than . We identified 153 disturbed galaxy clusters within a redshift range of and compared them with an equivalent set of the 153 most relaxed galaxy clusters. We also divided our sample into high- and low-redshift structures to analyse the evolution of those properties.
Galaxies in each subsample were classified as red and blue galaxies using a double Gaussian fit for the galaxies’ colour distribution. The fits were performed for the high and low groups and clusters. We also separated between quenched and star-forming galaxies following Donnari et al. (2019). Our analysis shows that the physical properties of satellite galaxies, such as colour, star formation rate, and gas availability, depend significantly on the relaxation state of their host clusters. Specifically, we found that clusters in a disturbed state have a higher fraction of blue galaxies and a lower fraction of quenched galaxies compared with their relaxed counterparts. We also find a significant dependence of the fraction of red galaxies and quenched galaxies with redshift of the cluster. We observed a higher proportion of blue galaxies and larger star formation activity at higher redshifts. The higher sSFR observed in galaxies bound to disturbed clusters aligns well with the study conducted by Cohen et al. (2015). In their study, they analysed a sample of 379 galaxy clusters from the Sloan Digital Sky Survey, revealing an inverse correlation between the relaxation state of galaxy clusters and SFR. Those results are also consistent with Pallero et al. (2022). Using sample zoom-in simulations of galaxy clusters, they showed that, at low , a large fraction of the present-day cluster galaxy population arrives at the cluster pre-processed, regardless of the cluster mass. However, at higher most galaxies reach their quenching state in situ, regardless of the cluster mass. As a result, even massive clusters show a significant star-forming galaxy population that undergoes a rapid quenching phase after reaching the cluster . Also, those results are consistent with Aldás et al. (2023), who observed that in both high and low redshifts, the galaxy population is more mixed in the disturbed clusters than in the relaxed ones, but the difference is more pronounced at high redshifts.
We have also explored the differences in gas availability among galaxies bound to relaxed and disturbed clusters. The results show that galaxies in disturbed clusters consistently have higher quantities of gas in all phases - hot, diffuse, and condensed - compared to galaxies in relaxed clusters. The large amount of condensed gas can explain the higher star formation rate found in disturbed clusters and the lower fraction of quenched galaxies. The presence of more hot gas can be explained by the presence of shocks produced during the merging.
Finally, we found that during the initial phases of cluster mergers, the specific star formation rate (sSFR) rises, likely due to gas compression resulting from the shocks generated during the merging process of clusters. As the galaxy cluster becomes more relaxed, star formation slows down, and galaxies become less active in forming new stars. These findings have significant implications for our understanding of galaxy evolution, highlighting the dynamic nature of star formation and the role of gas distribution in this process. To understand why this happens during mergers, we need to track and estimate the tidal forces and ram pressure stripping acting on galaxies, which will be done in a follow-up work.
Acknowledgements.
FA was supported by the doctoral thesis scholarship of Agencia Nacional de Investigación y Desarrollo (ANID)-Chile, grant 21211648. FAG acknowledges funding from the Max Planck Society through a “PartnerGroup” grant. FAG acknowledges support from ANID FONDECYT Regular 1211370, the ANID Basal Project FB210003 and the HORIZON-MSCA-2021-SE-01 Research and Innovation Programme under the Marie Sklodowska-Curie grant agreement number 101086388. FAG acknowledges support from ANID Fondo 2021 GEMINI ASTRO21-0061. CVM acknowledges support from ESO Comité Mixto, and FONDEQUIP project EQM200216. The work of AZ and ERC is supported by NOIRLab, which is managed by the Association of Universities for Research in Astronomy (AURA) under a cooperative agreement with the U.S. National Science Foundation. ERC is supported by the International Gemini Observatory, a program of NSF NOIRLab, which is managed by the Association of Universities for Research in Astronomy (AURA) under a cooperative agreement with the U.S. National Science Foundation, on behalf of the Gemini partnership of Argentina, Brazil, Canada, Chile, the Republic of Korea, and the United States of America. Powered@NLHPC: This research was partially supported by the supercomputing infrastructure of the NLHPC (CCSS210001)References
- Abell (1958) Abell, G. O. 1958, ApJS, 3, 211
- Abell et al. (1989) Abell, G. O., Corwin, Harold G., J., & Olowin, R. P. 1989, ApJS, 70, 1
- Aldás et al. (2023) Aldás, F., Zenteno, A., Gómez, F. A., et al. 2023, MNRAS, 525, 1769
- Bahé et al. (2013) Bahé, Y. M., McCarthy, I. G., Balogh, M. L., & Font, A. S. 2013, Monthly Notices of the Royal Astronomical Society, 430, 3017
- Barnes et al. (2021) Barnes, D. J., Vogelsberger, M., Pearce, F. A., et al. 2021, MNRAS, 506, 2533
- Battaglia et al. (2012) Battaglia, N., Bond, J. R., Pfrommer, C., & Sievers, J. L. 2012, ApJ, 758, 74
- Bauer et al. (2005) Bauer, F. E., Fabian, A. C., Sanders, J. S., Allen, S. W., & Johnstone, R. M. 2005, MNRAS, 359, 1481
- Bett et al. (2007) Bett, P., Eke, V., Frenk, C. S., et al. 2007, MNRAS, 376, 215
- Biffi et al. (2016) Biffi, V., Borgani, S., Murante, G., et al. 2016, ApJ, 827, 112
- Boselli & Gavazzi (2006) Boselli, A. & Gavazzi, G. 2006, Environmental Effects on Late-Type Galaxies in Nearby Clusters, Tech. rep.
- Brunetti et al. (2009) Brunetti, G., Cassano, R., Dolag, K., & Setti, G. 2009, A&A, 507, 661
- Brunetti et al. (2008) Brunetti, G., Giacintucci, S., Cassano, R., et al. 2008, Nature, 455, 944
- Brunetti et al. (2007) Brunetti, G., Venturi, T., Dallacasa, D., et al. 2007, ApJ, 670, L5
- Butcher & Oemler (1984) Butcher, H. & Oemler, A., J. 1984, ApJ, 285, 426
- Caldwell & Rose (1997) Caldwell, N. & Rose, J. A. 1997, The Astronomical Journal, 113, 492
- Campitiello et al. (2022) Campitiello, M. G., Ettori, S., Lovisari, L., et al. 2022, A&A, 665
- Cohen et al. (2015) Cohen, S. A., Hickox, R. C., & Wegner, G. A. 2015, Astrophysical Journal, 806
- Cole et al. (2000) Cole, S., Lacey, C. G., Baugh, C. M., & Frenk, C. S. 2000, MNRAS, 319, 168
- Contreras-Santos et al. (2022) Contreras-Santos, A., Knebe, A., Pearce, F., et al. 2022, Monthly Notices of the Royal Astronomical Society, 511, 2897
- Cui et al. (2017) Cui, W., Power, C., Borgani, S., et al. 2017, Monthly Notices of the Royal Astronomical Society, 464, 2502
- De Luca et al. (2021) De Luca, F., De Petris, M., Yepes, G., et al. 2021, MNRAS, 504, 5383
- Diemer et al. (2019) Diemer, B., Stevens, A. R., Lagos, C. d. P., et al. 2019, MNRAS, 487, 1529
- Dolag et al. (2009) Dolag, K., Borgani, S., Murante, G., & Springel, V. 2009, MNRAS, 399, 497
- Donnari et al. (2021) Donnari, M., Pillepich, A., Nelson, D., et al. 2021, MNRAS, 506, 4760
- Donnari et al. (2019) Donnari, M., Pillepich, A., Nelson, D., et al. 2019, MNRAS, 485, 4817
- Dressler (1980) Dressler, A. 1980, ApJ, 236, 351
- Feretti et al. (2012) Feretti, L., Giovannini, G., Govoni, F., & Murgia, M. 2012, A&AR, 20, 54
- Ferrari et al. (2003) Ferrari, C., Maurogordato, S., Cappi, A., & Benoist, C. 2003, Astronomy and Astrophysics, 399, 813
- Fossati et al. (2017) Fossati, M., Wilman, D. J., Mendel, J. T., et al. 2017, The Astrophysical Journal, 835, 153
- Fujita & Nagashima (1999) Fujita, Y. & Nagashima, M. 1999, ApJ, 516, 619
- Gene et al. (2014) Gene, S., Vogelsberger, M., Springel, V., et al. 2014, MNRAS, 445, 175
- Guglielmo et al. (2019) Guglielmo, V., Poggianti, B. M., Vulcani, B., et al. 2019, The XXL Survey: XXXVII. the role of the environment in shaping the stellar population properties of galaxies at $0.1 \geq z \geq 0.5$
- Haggar et al. (2020) Haggar, R., Gray, M. E., Pearce, F. R., et al. 2020, MNRAS, 492, 6074
- Hou et al. (2012) Hou, A., Parker, L. C., Wilman, D. J., et al. 2012, MNRAS, 421, 3594
- Jung et al. (2018) Jung, S. L., Choi, H., Wong, O. I., et al. 2018, The Astrophysical Journal, 865, 156
- Kleiner et al. (2014) Kleiner, D., Pimbblet, K. A., Owers, M. S., Jones, D. H., & Stephenson, A. P. 2014, MNRAS, 439, 2755
- Kravtsov et al. (2006) Kravtsov, A. V., Vikhlinin, A., & Nagai, D. 2006, ApJ, 650, 128
- Łokas (2020) Łokas, E. L. 2020, A&A, 638
- Marinacci et al. (2018) Marinacci, F., Vogelsberger, M., Pakmor, R., et al. 2018, MNRAS, 480, 5113
- Maughan (2013) Maughan, B. J. 2013, MNRAS, 437, 1171
- Mcgee et al. (2011) Mcgee, S. L., Balogh, M. L., Wilman, D. J., et al. 2011, Monthly Notices of the Royal Astronomical Society, 413, 996
- Mihalas (1967) Mihalas, D. 1967, ApJ, 150, 1168
- Molnar (2016) Molnar, S. M. 2016, Cluster Physics with Merging Galaxy Clusters, Vol. 2 (Frontiers Media S.A.)
- Munari et al. (2013) Munari, E., Biviano, A., Borgani, S., Murante, G., & Fabjan, D. 2013, Monthly Notices of the Royal Astronomical Society, 430, 2638
- Nagai (2006) Nagai, D. 2006, ApJ, 650, 538
- Nagao et al. (2006) Nagao, T., Maiolino, R., & Marconi, A. 2006, A&A, 459, 85
- Naiman et al. (2018) Naiman, J. P., Pillepich, A., Springel, V., et al. 2018, MNRAS, 477, 1206
- Nelson et al. (2019) Nelson, D., Pillepich, A., Springel, V., et al. 2019, MNRAS, 490, 3234
- Nelson et al. (2018) Nelson, D., Pillepich, A., Springel, V., et al. 2018, MNRAS, 475, 624
- Neto et al. (2007) Neto, A. F., Gao, L., Bett, P., et al. 2007, MNRAS, 381, 1450
- Nurgaliev et al. (2017) Nurgaliev, D., McDonald, M., Benson, B. A., et al. 2017, ApJ, 841, 5
- Nurgaliev et al. (2013) Nurgaliev, D., McDonald, M., Benson, B. A., et al. 2013, Astrophysical Journal, 779
- Oemler & Hale Observatories (1974) Oemler, A. & Hale Observatories, J. 1974, THE SYSTEMATIC PROPERTIES OF CLUSTERS OF GALAXIES. I. PHOTOMETRY OF 15 CLUSTERS, Tech. rep.
- Pallero et al. (2022) Pallero, D., Gómez, F. A., Padilla, N. D., et al. 2022, Monthly Notices of the Royal Astronomical Society, 511, 3210
- Pillepich et al. (2018a) Pillepich, A., Nelson, D., Hernquist, L., et al. 2018a, MNRAS, 475, 648
- Pillepich et al. (2019) Pillepich, A., Nelson, D., Springel, V., et al. 2019, MNRAS, 490, 3196
- Pillepich et al. (2018b) Pillepich, A., Springel, V., Nelson, D., et al. 2018b, MNRAS, 473, 4077
- Planck Collaboration (2016) Planck Collaboration. 2016, A&A, 594, A24
- Poggianti & Barbaro (1997) Poggianti, B. M. & Barbaro, G. 1997, A&A, 325, 1025
- Rasia et al. (2004) Rasia, E., Tormen, G., & Moscardini, L. 2004, MNRAS, 351, 237
- Rhee et al. (2018) Rhee, J., Lah, P., Briggs, F. H., et al. 2018, MNRAS, 473, 1879
- Roberts et al. (2022) Roberts, I. D., Lang, M., Trotsenko, D., et al. 2022, ApJ, 941, 77
- Rohr et al. (2023) Rohr, E., Pillepich, A., Nelson, D., et al. 2023, Monthly Notices of the Royal Astronomical Society, 524, 3502
- Safarzadeh & Loeb (2019) Safarzadeh, M. & Loeb, A. 2019, Monthly Notices of the Royal Astronomical Society: Letters, 486, L26
- Sarazin (2001) Sarazin, C. L. 2001, THE PHYSICS OF CLUSTER MERGERS, Tech. rep.
- Schaye et al. (2015) Schaye, J., Crain, R. A., Bower, R. G., et al. 2015, MNRAS, 446, 521
- Searle & Sargent (1972) Searle, L. & Sargent, W. L. W. 1972, INFERENCES FROM THE COMPOSITION OF TWO DWARF BLUE GALAXIES, Tech. rep.
- Shim et al. (2011) Shim, H., Im, M., Lee, H. M., et al. 2011, Astrophysical Journal, 727
- Sijacki et al. (2015) Sijacki, D., Vogelsberger, M., Genel, S., et al. 2015, MNRAS, 452, 575
- Soares & Rembold (2019) Soares, N. R. & Rembold, S. B. 2019, MNRAS, 483, 4354
- Sobral et al. (2015) Sobral, D., Stroe, A., Dawson, W. A., et al. 2015, MNRAS, 450, 630
- Springel & Hernquist (2003) Springel, V. & Hernquist, L. 2003, Cosmological smoothed particle hydrodynamics simulations: a hybrid multiphase model for star formation, Tech. rep.
- Springel et al. (2018) Springel, V., Pakmor, R., Pillepich, A., et al. 2018, MNRAS, 475, 676
- Springel et al. (2001) Springel, V., White, S. D., Tormen, G., & Kauffmann, G. 2001, MNRAS, 328, 726
- Stroe et al. (2014) Stroe, A., Sobral, D., Röttgering, H. J., & van Weeren, R. J. 2014, MNRAS, 438, 1377
- Torrey et al. (2019) Torrey, P., Vogelsberger, M., Marinacci, F., et al. 2019, MNRAS, 484, 5587
- Torrey et al. (2012) Torrey, P., Vogelsberger, M., Sijacki, D., Springel, V., & Hernquist, L. 2012, MNRAS, 427, 2224
- Troncoso-Iribarren et al. (2020) Troncoso-Iribarren, P., Padilla, N., Santander, C., et al. 2020, MNRAS, 497, 4145
- Vogelsberger et al. (2014) Vogelsberger, M., Genel, S., Springel, V., et al. 2014, MNRAS, 444, 1518
- Vulcani et al. (2020) Vulcani, B., Fritz, J., Poggianti, B. M., et al. 2020, The Astrophysical Journal, 892, 146
- Weinberger et al. (2017) Weinberger, R., Springel, V., Hernquist, L., et al. 2017, MNRAS, 465, 3291
- Weinberger et al. (2020) Weinberger, R., Springel, V., & Pakmor, R. 2020, ApJS, 248, 32
- Wetzel et al. (2012) Wetzel, A. R., Tinker, J. L., & Conroy, C. 2012, Monthly Notices of the Royal Astronomical Society, 424, 232
- Wetzel et al. (2013) Wetzel, A. R., Tinker, J. L., Conroy, C., & van den Bosch, F. C. 2013, MNRAS, 432, 336
- Wetzel et al. (2014) Wetzel, A. R., Tinker, J. L., Conroy, C., & van den Bosch, F. C. 2014, Monthly Notices of the Royal Astronomical Society, 439, 2687
- White & Frenk (1991) White, S. D. M. & Frenk, C. S. 1991, The Astrophysical Journal, 379, 52
- White & Rees (1978) White, S. D. M. & Rees, M. J. 1978, Monthly Notices of the Royal Astronomical Society, 183, 341
- Yoon & Im (2020) Yoon, Y. & Im, M. 2020, ApJ, 893, 117
- Yuan et al. (2022) Yuan, Z. S., Han, J. L., & Wen, Z. L. 2022, MNRAS, 513, 3013
- Zenteno et al. (2020) Zenteno, A., Herńandez-Lang, D., Klein, M., et al. 2020, MNRAS, 495, 705
- Zhang et al. (2022) Zhang, B., Cui, W., Wang, Y., Dave, R., & De Petris, M. 2022, MNRAS, 516, 26
- Zhang et al. (2016) Zhang, C., Yu, Q., & Lu, Y. 2016, ApJ, 820, 85
Appendix A Gas Content excluding the second BCG
In this part, we present the gas content for the satellite galaxies bound to relaxed and disturbed clusters at low and high redshifts analogous to Figure 10, but excluding the main and secondary BCG in the case of disturbed clusters. We can see that the hot gas content decreases, but we can see that on average galaxies in disturbed clusters contain more diffuse and condensed gas.