11email: jamie.burke@ed.ac.uk22institutetext: Robert O Curle Ophthalmology Suite, Institute for Regeneration and Repair, University of Edinburgh, UK 33institutetext: School of Informatics, University of Edinburgh, Edinburgh, UK 44institutetext: Centre for Medical Informatics, University of Edinburgh, Edinburgh, UK 55institutetext: Clinical Research Facility and Imaging, University of Edinburgh, Edinburgh, UK66institutetext: Department of Vision Sciences, Glasgow Caledonian University, Glasgow, UK77institutetext: British Heart Foundation Centre for Cardiovascular Science, University of Edinburgh, Edinburgh, UK88institutetext: Centre for Clinical Brain Sciences, University of Edinburgh, Edinburgh, UK 99institutetext: The Bayes Centre, University of Edinburgh, Edinburgh, UK 1010institutetext: Institute for Adaptive and Neural Computation, School of Informatics, University of Edinburgh, Edinburgh, UK
Domain-specific augmentations with resolution agnostic self-attention mechanism improves choroid segmentation in optical coherence tomography images
Abstract
The choroid is a key vascular layer of the eye, supplying oxygen to the retinal photoreceptors. Non-invasive enhanced depth imaging optical coherence tomography (EDI-OCT) has recently improved access and visualisation of the choroid, making it an exciting frontier for discovering novel vascular biomarkers in ophthalmology and wider systemic health. However, current methods to measure the choroid often require use of multiple, independent semi-automatic and deep learning-based algorithms which are not made open-source. Previously, Choroidalyzer — an open-source, fully automatic deep learning method trained on 5,600 OCT B-scans from 385 eyes — was developed to fully segment and quantify the choroid in EDI-OCT images, thus addressing these issues. Using the same dataset, we propose a Robust, Resolution-agnostic and Efficient Attention-based network for CHoroid segmentation (REACH). REACHNet leverages multi-resolution training with domain-specific data augmentation to promote generalisation, and uses a lightweight architecture with resolution-agnostic self-attention which is not only faster than Choroidalyzer’s previous network (4 images/s vs. 2.75 images/s on a standard laptop CPU), but has greater performance for segmenting the choroid region, vessels and fovea (Dice coefficient for region 0.9769 vs. 0.9749, vessels 0.8612 vs. 0.8192 and fovea 0.8243 vs. 0.3783) due to its improved hyperparameter configuration and model training pipeline. REACHNet can be used with Choroidalyzer as a drop-in replacement for the original model and will be made available upon publication.
Keywords:
Segmentation Choroid Deep learning OCT1 Introduction
The choroid, a dense vascular layer behind the retina, plays a pivotal role in the maintenance of the outer retinal layers [19]. Non-invasive optical coherence tomography (OCT) images the choroid at micron resolution, but its optical signal has historically struggled to penetrate this tissue due to the hyperreflective retinal-pigment epithelium (RPE) sitting above it, thus leaving OCT imaging previously focused on retinal image analysis. Recently, enhanced depth imaging OCT (EDI-OCT) has improved choroidal visualisation [24], enabling researchers to investigate the choroid’s potential as a biomarker in systemic health research and broader ‘oculomics’ [22, 3, 25].
The choroid contains a dense, heterogeneous population of vessels interspersed and suspended by connective tissue in its interstitial space. Isolating the choroidal region and vessels are the two primary tasks in OCT choroid analysis. Segmenting the region relies on detecting a single shape using identifiable landmarks, such as its position below the hyperreflective RPE and above the homogeneous appearing sclera. Conversely, defining choroidal vessels is far more challenging due to speckle noise and the complex nature of the vascular bed, meaning OCT images capture oblique sections through vessels which often don’t have clear boundaries. This can make manual segmentation prohibitively time consuming, and potentially lead to inconsistencies among existing segmentation methods [28].
Accurate choroid analysis demands precise segmentation of the region and vessels, and careful consideration of the region of interest used for analysis. This typically involves referencing the fovea’s location and accounting for image quality variations. This standardisation is crucial for consistent comparisons across diverse studies, populations and imaging devices. Unfortunately, current practices often rely on separate tools for full segmentation and measurement of the choroid [13, 2, 11, 18, 3, 1] and fovea localisation [30]. Moreover, many of these tools are not openly available to researchers which can further hinder accessibility and standardisation in the field [16, 12, 4].
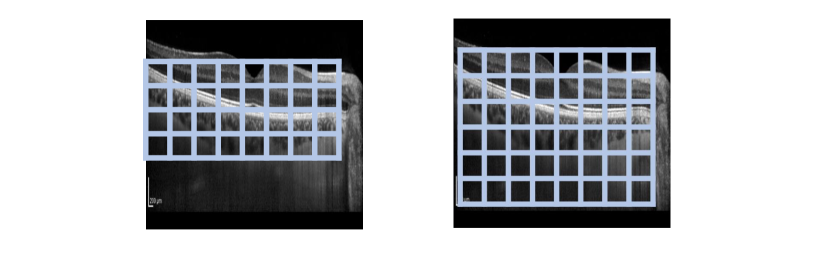
Choroidalyzer [6] is a recent deep learning approach to segment and measure the choroidal region, vessels, and fovea in OCT images. We use REACHNet to improve on Choroidalyzer’s model on the same dataset (Fig. 1). REACHNet utilises multi-resolution training and domain-specific augmentations to generalise across device resolutions, handle speckle artefacts, vessel occlusions and poor image acquisition. Its lightweight architecture with a resolution-agnostic self-attention mechanism improves segmentation performance compared to Choroidalyzer and other pre-trained models, while reducing inference speed and memory consumption through an optimised training pipeline and hyperparameter configuration.
2 Methods
2.1 Data
The protocol for data collection is previously described [6]. Briefly, we used 5,600 OCT B-scans belonging to 385 eyes of 233 subjects using 5 cohorts related to systemic health (chronic kidney disease [5], dementia [21], pregnancy and diurnal variation [17]). B-scans were collected from three imaging devices from two leading OCT imaging device manufacturers, Heidelberg Engineering —- the Standard Heidelberg spectral domain OCT SPECTRALIS Module and its mobile-equivalent, the SPECTRALIS FLEX Module (Heidelberg Engineering, Heidelberg, Germany) — and Topcon, the swept source OCT DRI Triton Plus (Topcon, Tokyo, Japan). Our dataset comprises macular-centred, horizontal line B-scans from Heidelberg Engineering imaging devices, and macular, fovea-centred radial B-scans from the Topcon DRI Triton Plus device. Supplementary Table 1 provides an overview of the population used in this work.
5 of the 6 cohorts were split at the patient level into training (4,144 B-scans, 122 subjects), validation (466 B-scans, 28 subjects) and internal test sets (756 B-scans, 37 subjects). The OCTANE cohort was entirely held-out and used as an external test set (168 B-scans, 46 subjects). Supplementary Table 2 describes the populations within each set.
We follow the same protocol which Choroidalyzer uses for generating ground-truth choroid region segmentation labels [6, 1]. Choroidal vessel segmentation labels were generated with a software tool previously described in [6], after the following pre-processing steps: images were enhanced using non-local means denoising, contrast limited histogram equalisation and Gamma-level transforms to sharpen choroidal vessel walls, and a column-wise pixel intensity moving average to compensate for superficial retinal vessel shadowing was applied. The fovea pixel coordinate was manually selected as in [6], but here each segmentation mask is an isotropic 2D Gaussian centred at this coordinate with a standard deviation of 30 pixels — B-scans not fovea-centred set the origin as the corresponding mask.
2.2 Domain-specific data augmentation
Speckle noise. OCT B-scans suffer from multiplicative speckle noise from scattering light waves emitted from the device during acquisition. We recreate this by degrading a B-scan using element-wise multiplication with an array whose elements are independently sampled from a Gaussian distribution .
Vessel shadowing. A primary problem of choroid vessel segmentation is where incident light perpendicularly penetrates through superficial retinal vessels, subsequently darkening the corresponding A-scans (pixel columns). We artificially produce these shadows through randomly selecting A-scans uniformly and lower the brightness of a random number of adjacent A-scans using element-wise Gamma transforms (). The beginning of each shadow is 30 pixels above the choroid, approximately at the outer plexiform layer which are where the A-scan columns are first corrupted from retinal vessels.
Acquisition distortion. Optimal OCT image acquisition expects the retinal and choroidal structures to lie parallel to the horizontal image axis. However, various factors including patient concentration, imager inexperience and degree of myopathy can skew the B-scan. We use an affine transformation with some random degree of rotation and anisotropic scaling to simulate this acquisition, where are the image axes pixel length scales. The ratio is approximately for Heidelberg and Topcon devices, so the vertical and horizontal image axes will be squashed and elongated as the image is rotated.
2.3 Multi-resolution training
The native resolutions for the Heidelberg Standard and FLEX Modules are and , respectively, while the Topcon DRI Triton Plus has a native resolution of . Choroidalyzer’s experiments were conducted and evaluated at a common pixel resolution [6], leading to unexpected behaviour when applied at higher resolution (Topcon) or to a reduced field of view. Here, we either fix the input resolution of each batch to or to one of or with equal probability (. For the larger resolution, we crop a random patch to reduce computational load, and for the smaller resolution we either resize or randomly crop the image to (), the latter option simulating a reduced field of view.
2.4 Model architecture with resolution-agnostic attention mechanism
The UNet architecture [23] of Choroidalyzer’s deep learning model has been described previously [6]. While the block structure is kept fixed, REACHNet uses a reduced depth size of 5 and scales the feature maps of the first 3 blocks by 2 and the remaining blocks by 4. This reduces the feature map of the deepest block to (for an input resolution of ) to enable global contextual learning. To account for the reduced depth, our filter size doubles every block from 8 until a maximum of 128, utilising skip connections between symmetrical down- and up-blocks to aid information flow and enhance representation power.
REACHNet has a multi-head, self-attention block [26] with 8 heads at the deepest point of the architecture. The self-attention mechanism is resolution agnostic and is applied at a fixed resolution of , resizing feature maps accordingly in order to handle multi-resolution input during training. We hypothesise that contextually weighting local patches in the deepest feature maps would aid memory consumption, multi-resolution segmentation and fovea localisation.
2.5 Model training and hyperparameter configuration
All our experiments used the following training pipeline: Each is trained for 40 epochs using the AdamW optimizer [14] (weight decay , ) minimising the binary cross entropy loss. We used a linear warm-up of the learning rate from to for 5 epochs, and then decayed it following a cosine relationship for 25 epochs, after which it was fixed at for 10 epochs. We used a batch size of 8 to lower memory consumption but used an effective batch size of 64 by linearly scaling the learning rate by [7]. To smooth output segmentations, we maintained an exponential moving average of the model weights from epoch 20 using a decay of 0.99. Images were standardised using a mean and standard deviation of 0.5. Alongside our domain-specific augmentations (all ), we applied horizontal flipping (), random perspective shifts with a scale of 0.2 (), altered the brightness and contrast randomly in [0.6, 1.4] () and applied isotropic scaling in [0.9, 1.5], rotation in [-25, 25] and shear in [-15, 15] (). Affine transforms were selected instead of our acquisition distortion with equal probability (). We used python 3.12, PyTorch 2.0, Segmentation Models PyTorch [10] and the timm library [29].
2.6 Evaluation and statistical analysis
We compare REACHNet and our proposed improvements against Choroidalyzer’s underlying model, as well as two ImageNet-pretrained UNet models using ResNet-18 [8] and MobileNetV3 [9] backbones. The dice coefficient was used to measure segmentation performance, and clinically relevant, fovea-centred choroid-derived measurements of thickness, area and vascular index were assessed using Pearson correlation coefficients and mean absolute error (MAE). We follow the same protocol which Choroidalyzer uses for measuring choroid thickness, area and vascular index [6, 3]. All metrics for both internal and external test sets were evaluated on images at their native resolution.
As vessel segmentation is the most challenging task, we had a clinical ophthalmologist qualitatively assess segmentations from REACHNet against Choroidalyzer [6] and the ground-truth labels, in which it was trained, in a masked a randomised fashion. For 100 examples with the poorest agreement, they graded the quality of the image and identified which segmentation they preferred. They also qualitatively rated the segmentations of 50 images with the greatest disagreement, according to their sensitivity (vessel detection) and specificity (interstitial exclusion), using an ordinal rating system from -2 (very bad) to 2 (very good).
3 Results
Speed and memory consumption. All experiments were run on a computer with a 13 generation, Intel Z1 processor running at 2GHz on Windows 10 with 32Gb of RAM, utilising an NVIDIA GeForce RTX 3070 graphics card with 8Gb of VRAM. We used dummy data with a resolution of to measure each model’s performance (Table 1). REACHNet is significantly more compute efficient for training and inference, irrespective of processing unit. Moreover, on a standard laptop CPU, REACHNet can process an image in 0.256 0.004s, a significant improvement on Choroidalyzer’s model, taking 0.362 0.490s.
Model Disk size (Mb) Inference Training CPU (img/s) GPU (img/s) Memory (Gb) GPU (time/epoch) Memory (Gb) Choroidalyzer [6] 3.196 14.54 252.14 1.61 3m 26.72s 2.39 UNet w/ ResNet18 [10] 56.082 4.84 303.28 2.05 3m 29.09s 3.79 UNet w/ MobileNetV3 [10] 4.160 12.77 94.42 1.41 3m 58.11s 2.93 REACHNet (ours) 3.191 19.41 326.25 1.60 2m 42.50s 2.76
Agreement in segmentation. REACHNet out-performed Choroidalyzer [6] across all segmentation tasks. This can especially be observed for the fovea (internal test 0.8379 vs. 0.3788, external 0.8243 vs. 0.3783) and vessels (internal 0.8445 vs. 0.8236, external 0.8612 vs. 0.8192), with region detection reaching similar, but higher, levels of performance (internal 0.9792 vs. 0.9753, external 0.9769 vs. 0.9749). Importantly, REACHNet had excellent performance on the external test set, whose cohort and disease type share no overlap to the training data, even against pre-trained UNet models across most metrics.
Experiment Internal External Region Vessel Fovea Region Vessel Fovea Choroidalyzer [6] 0.9753 0.8236 0.3788 0.9749 0.8192 0.3783 UNet w/ ResNet18 [10] 0.9763 0.8404 0.8066 0.9763 0.8504 0.8066 UNet w/ MobileNetV3 [10] 0.9499 0.7881 0.8303 0.9499 0.7881 0.8303 REACHNet (ours) 0.9792 0.8445 0.8379 0.9769 0.8612 0.8243 REACHNet — no domain-specific augs 0.9773 0.8467 0.8273 0.9742 0.8587 0.8065 REACHNet — no multi-resolution 0.9774 0.8445 0.8281 0.975 0.8571 0.8488 REACHNet — no self-attention 0.9790 0.8456 0.8146 0.9747 0.8553 0.8193
Agreement in choroid-derived measurements. REACHNet had stronger Pearson correlation coefficients with all clinically meaningful, segmentation-derived choroid measurements of interest compared with Choroidalyzer [6] and previously state of the art pre-trained UNet models (Table 3). While we observed significantly lower correlations for choroid vascular index (CVI) compared with other metrics in both test sets (internal test Pearson area, 0.9852; thickness, 0.9838; fovea, 0.9912; CVI, 0.6146), REACHNet obtained better mean absolute errors, CA: 0.035mm2 vs. 0.0417mm2; CT: 8.36m vs. 9.70m; CVI: 0.038 vs. 0.0767; fovea : (5.0px, 5.5px) vs. (5.9px, 12.6px)) (see supplementary Table 3 for an ablated table of segmentation-derived MAE values). Importantly, the values reported here are impressively small compared to repeatability measurements previously reported in the literature [15, 20].
Experiment Internal External Area Thickness CVI Fovea Area Thickness CVI Fovea Choroidalyzer [6] 0.9728 0.9716 0.4162 0.986 0.9751 0.9773 0.5976 0.8383 UNet w/ ResNet18 [10] 0.9835 0.9819 0.5953 0.9621 0.9735 0.9819 0.6149 0.8728 UNet w/ MobileNetV3 [10] 0.7609 0.7573 0.3041 0.9712 0.7609 0.7573 0.3041 0.8896 REACHNet (ours) 0.9852 0.9836 0.6146 0.9912 0.9810 0.9828 0.6281 0.8751 REACHNet — no domain-specific augs 0.985 0.9832 0.6186 0.9912 0.9717 0.9752 0.5906 0.8795 REACHNet — no multi-resolution 0.9472 0.9450 0.5765 0.9163 0.9736 0.9774 0.5345 0.8798 REACHNet — no self-attention 0.9841 0.9838 0.5812 0.9778 0.9759 0.9782 0.5327 0.8804
Qualitative evaluation. REACHNet had an 85% preference rating which was invariant to image quality (Table S4) and device type (supplementary Table 4). Qualitative grading of the 50 segmentations with greatest disagreement implies the models’ improved sensitivity and specificity over Choroidalyzer [6], being primarily rated “Good” for vessel detection and interstitial exclusion (41 and 42, respectively), and without any negative ratings unlike Choroidalyzer and the ground-truth labels (19 and 20 “Bad” ratings in total, respectively).
Image Quality REACHNet (ours) Choroidalyzer [6] Ground-truth labels Very good () 2 0 0 Good () 16 2 2 Okay () 24 0 5 Bad () 31 3 2 Very bad () 12 1 0 Total () 85 6 9 Method Choroid vessel detection Interstitial exclusion REACHNet (ours) VG: 0, G: 41, O: 9, B: 0, VB: 0 VG: 1, G: 42, O: 7, B: 0, VB: 0 Choroidalyzer [6] VG: 0, G: 10, O: 25, B: 15, VB: 0 VG: 0, G: 31, O: 15, B: 4, VB: 0 Ground-truth labels VG: 0, G: 29, O: 17, B: 4, VB: 0 VG: 0, G: 19, O: 15, B: 16, VB: 0
4 Discussion
We have developed REACHNet to deliver a more robust and efficient model for fully automatic segmentation of the choroid in OCT B-scans. We anticipate that REACHNet’s model can be used to improve Choroidalyzer’s ability to convert a raw OCT B-scan into a set of clinically meaningful segmentation-derived measurements in real-time, thus addressing the distinct lack of unified and open-source methods for choroid analysis.
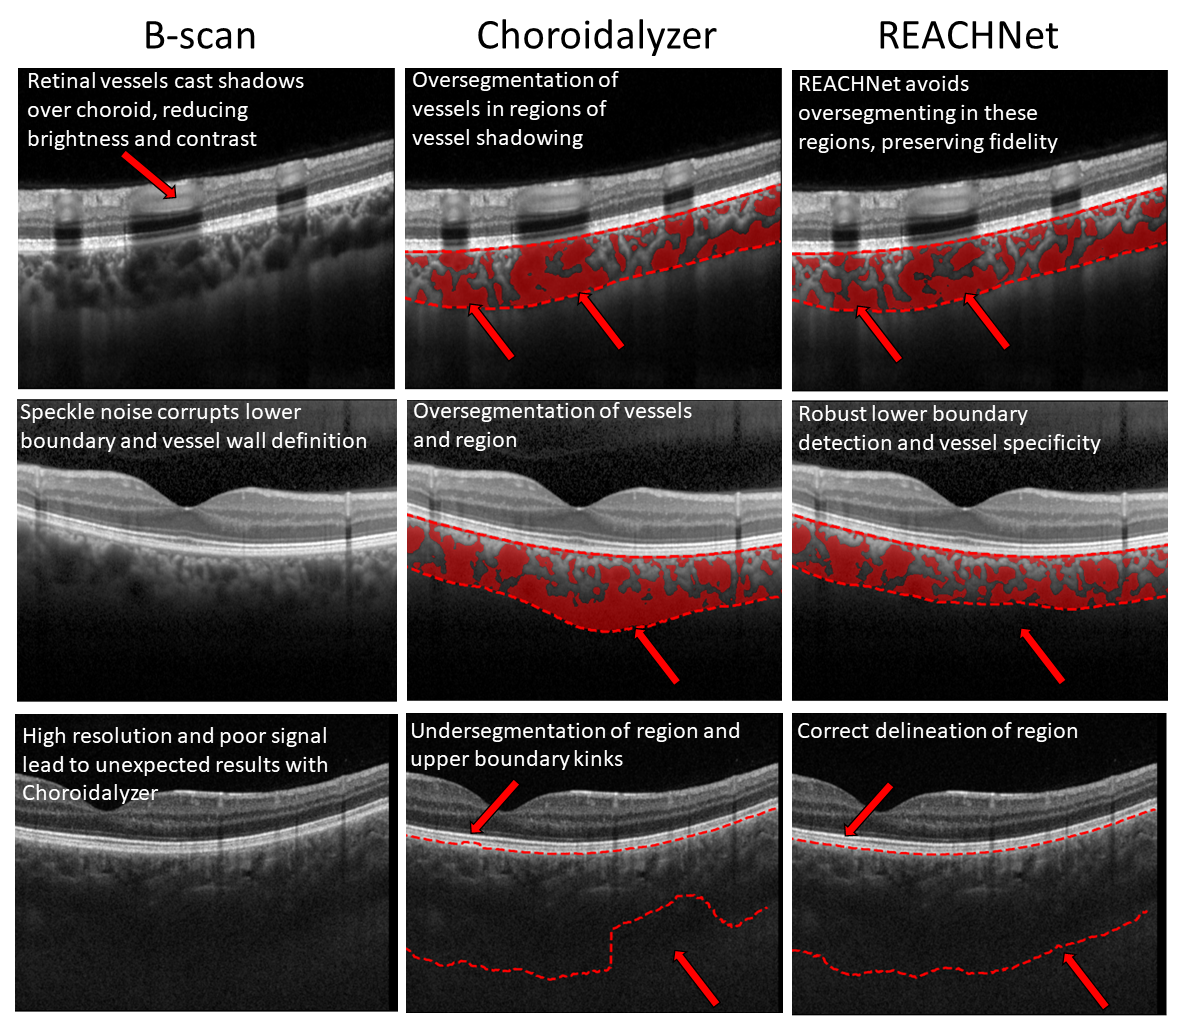
REACHNet is more robust to artefacts and obscurations commonly observed in OCT B-scans than previously before, producing higher quality segmentations capable of overcoming speckle noise, poor image acquisition and superficial retinal vessel shadowing (Fig. 2). Moreover, REACHNet can handle multi-resolution input from both Heidelberg and Topcon devices more reliably than before (supplementary Table 4). We therefore expect it to be robust to images of varying quality and resolution from a range of cohorts related to systemic health.
Interestingly, excluding domain-specific augmentations improved vessel segmentation performance against the ground-truth labels (Table 2). We believe this — as well as obtaining only moderately strong correlations of CVI (Table 3) — is due to real vessel shadowing still corrupting the ground-truth segmentation labels. This is evidenced by the ground-truth labels receiving a large number of “Okay” and “Bad” ratings (15 and 16, respectively) for its specificity (interstitial exclusion). Thus, as REACHNet was overwhelmingly preferred by the clinical ophthalmologist, we believe the superior model of choice is one which includes our domain-specific augmentations, which yielded only positive ratings for the models’ interstitial exclusion (specificity), and vessel detection (sensitivity).
REACHNet can process approximately 4 images/s using a standard laptop CPU, compared to Choroidalyzer’s 2.75 images/s. This will have major benefits for large-scale data analysis such as the UK Biobank or AlzEye [27]. In the latter, their 1,567,358 OCT B-scans would take almost two days less time to process using REACHNet (111 hours) compared to the original model (157 hours), with GPU acceleration significantly reducing this processing time even further.
REACHNet was trained and evaluated using systemic health data. In future, we will address its performance against ocular disease, particularly in the context of choroid-related disease causing extreme choroidal thinning and thickening, such as pathological myopia and central serous chorioretinopathy, respectively.
REACHNet provides a unified approach to choroid segmentation in OCT, and is freely available to use as Choroidalyzer’s deep learning model for researchers and clinicians alike. We hope to bring consistency and robustness, both at scale, to this nascent field.
Acknowledgements
J.B. was supported by the Medical Research Council (grant MR/N013166/1) as part of the Doctoral Training Programme in Precision Medicine at the Usher Institute, University of Edinburgh. For the purpose of open access, the authors have applied a creative commons attribution (CC BY) licence to any author accepted manuscript version arising. The authors would also like to thank all participants in the studies used in this paper, as well as all staff at the Edinburgh Imaging Facility who contributed to image acquisition for this study.
References
- [1] Burke, J., Engelmann, J., Hamid, C., Reid-Schachter, M., Pearson, T., Pugh, D., Dhaun, N., King, S., MacGillivray, T., Bernabeu, M.O., Storkey, A., MacCormick, I.J.C.: An open-source deep learning algorithm for efficient and fully-automatic analysis of the choroid in optical coherence tomography (2023)
- [2] Burke, J., King, S.: Edge tracing using gaussian process regression. IEEE Transactions on Image Processing 31, 138–148 (2021)
- [3] Burke, J., Pugh, D., Farrah, T., Hamid, C., Godden, E., MacGillivray, T.J., Dhaun, N., Baillie, J.K., King, S., MacCormick, I.J.C.: Evaluation of an Automated Choroid Segmentation Algorithm in a Longitudinal Kidney Donor and Recipient Cohort. Translational Vision Science & Technology 12(11), 19–19 (11 2023). https://doi.org/10.1167/tvst.12.11.19, https://doi.org/10.1167/tvst.12.11.19
- [4] Chen, H.J., Huang, Y.L., Tse, S.L., Hsia, W.P., Hsiao, C.H., Wang, Y., Chang, C.J.: Application of artificial intelligence and deep learning for choroid segmentation in myopia. Translational Vision Science & Technology 11(2), 38–38 (2022)
- [5] Dhaun, N.: Optical coherence tomography and nephropathy: The octane study. https://clinicaltrials.gov/ct2/show/NCT02132741 (2014), clinicalTrials.gov identifier: NCT02132741. Updated November 4, 2022. Accessed May 31st, 2023
- [6] Engelmann, J., Burke, J., Hamid, C., Reid-Schachter, M., Pugh, D., Dhaun, N., Moukaddem, D., Gray, L., Strang, N., McGraw, P., et al.: Choroidalyzer: An open-source, end-to-end pipeline for choroidal analysis in optical coherence tomography. arXiv preprint arXiv:2312.02956 (2023)
- [7] Goyal, P., Dollár, P., Girshick, R., Noordhuis, P., Wesolowski, L., Kyrola, A., Tulloch, A., Jia, Y., He, K.: Accurate, large minibatch sgd: Training imagenet in 1 hour. arXiv preprint arXiv:1706.02677 (2017)
- [8] He, K., Zhang, X., Ren, S., Sun, J.: Deep residual learning for image recognition. In: Proceedings of the IEEE conference on computer vision and pattern recognition. pp. 770–778 (2016)
- [9] Howard, A., Sandler, M., Chu, G., Chen, L.C., Chen, B., Tan, M., Wang, W., Zhu, Y., Pang, R., Vasudevan, V., et al.: Searching for mobilenetv3. In: Proceedings of the IEEE/CVF international conference on computer vision. pp. 1314–1324 (2019)
- [10] Iakubovskii, P.: Segmentation models pytorch. https://github.com/qubvel/segmentation_models.pytorch (2019)
- [11] Khaing, T.T., Okamoto, T., Ye, C., Mannan, M.A., Yokouchi, H., Nakano, K., Aimmanee, P., Makhanov, S.S., Haneishi, H.: Choroidnet: a dense dilated u-net model for choroid layer and vessel segmentation in optical coherence tomography images. IEEE Access 9, 150951–150965 (2021)
- [12] Kugelman, J., Alonso-Caneiro, D., Read, S.A., Hamwood, J., Vincent, S.J., Chen, F.K., Collins, M.J.: Automatic choroidal segmentation in oct images using supervised deep learning methods. Scientific reports 9(1), 13298 (2019)
- [13] Liu, X., Bi, L., Xu, Y., Feng, D., Kim, J., Xu, X.: Robust deep learning method for choroidal vessel segmentation on swept source optical coherence tomography images. Biomedical Optics Express 10(4), 1601–1612 (2019)
- [14] Loshchilov, I., Hutter, F.: Decoupled weight decay regularization. arXiv preprint arXiv:1711.05101 (2017)
- [15] Ma, F., Bai, Y., Duan, J., Liang, Y., Shang, Q.: Validation of reliability, repeatability and consistency of three-dimensional choroidal vascular index. Scientific Reports 14(1), 1576 (2024)
- [16] Mazzaferri, J., Beaton, L., Hounye, G., Sayah, D.N., Costantino, S.: Open-source algorithm for automatic choroid segmentation of oct volume reconstructions. Scientific reports 7(1), 42112 (2017)
- [17] Moukaddem, D., Strang, N., Gray, L., McGraw, P., Scholes, C.: Comparison of diurnal variations in ocular biometrics and intraocular pressure between hyperopes and non-hyperopes. Investigative Ophthalmology & Visual Science 63(7), 1428–F0386 (2022)
- [18] Muller, J., Alonso-Caneiro, D., Read, S.A., Vincent, S.J., Collins, M.J.: Application of deep learning methods for binarization of the choroid in optical coherence tomography images. Translational Vision Science & Technology 11(2), 23–23 (2022)
- [19] Nickla, D.L., Wallman, J.: The multifunctional choroid. Progress in retinal and eye research 29(2), 144–168 (2010)
- [20] Rahman, W., Chen, F.K., Yeoh, J., Patel, P., Tufail, A., Da Cruz, L.: Repeatability of manual subfoveal choroidal thickness measurements in healthy subjects using the technique of enhanced depth imaging optical coherence tomography. Investigative ophthalmology & visual science 52(5), 2267–2271 (2011)
- [21] Ritchie, C.W., Ritchie, K.: The prevent study: a prospective cohort study to identify mid-life biomarkers of late-onset alzheimer’s disease. BMJ open 2(6), e001893 (2012)
- [22] Robbins, C.B., Grewal, D.S., Thompson, A.C., Powers, J.H., Soundararajan, S., Koo, H.Y., Yoon, S.P., Polascik, B.W., Liu, A., Agrawal, R., et al.: Choroidal structural analysis in alzheimer disease, mild cognitive impairment, and cognitively healthy controls. American Journal of Ophthalmology 223, 359–367 (2021)
- [23] Ronneberger, O., Fischer, P., Brox, T.: U-net: Convolutional networks for biomedical image segmentation. In: Medical Image Computing and Computer-Assisted Intervention–MICCAI 2015: 18th International Conference, Munich, Germany, October 5-9, 2015, Proceedings, Part III 18. pp. 234–241. Springer (2015)
- [24] Spaide, R.F., Koizumi, H., Pozonni, M.C.: Enhanced depth imaging spectral-domain optical coherence tomography. American journal of ophthalmology 146(4), 496–500 (2008)
- [25] Tan, K.A., Gupta, P., Agarwal, A., Chhablani, J., Cheng, C.Y., Keane, P.A., Agrawal, R.: State of science: choroidal thickness and systemic health. Survey of ophthalmology 61(5), 566–581 (2016)
- [26] Vaswani, A., Shazeer, N., Parmar, N., Uszkoreit, J., Jones, L., Gomez, A.N., Kaiser, Ł., Polosukhin, I.: Attention is all you need. Advances in neural information processing systems 30 (2017)
- [27] Wagner, S.K., Hughes, F., Cortina-Borja, M., Pontikos, N., Struyven, R., Liu, X., Montgomery, H., Alexander, D.C., Topol, E., Petersen, S.E., et al.: Alzeye: longitudinal record-level linkage of ophthalmic imaging and hospital admissions of 353 157 patients in london, uk. BMJ open 12(3), e058552 (2022)
- [28] Wei, X., Sonoda, S., Mishra, C., Khandelwal, N., Kim, R., Sakamoto, T., Agrawal, R.: Comparison of choroidal vascularity markers on optical coherence tomography using two-image binarization techniques. Investigative Ophthalmology & Visual Science 59(3), 1206–1211 (2018)
- [29] Wightman, R.: Pytorch image models. https://github.com/rwightman/pytorch-image-models (2019). https://doi.org/10.5281/zenodo.4414861
- [30] Xuan, M., Wang, W., Shi, D., Tong, J., Zhu, Z., Jiang, Y., Ge, Z., Zhang, J., Bulloch, G., Peng, G., et al.: A deep learning–based fully automated program for choroidal structure analysis within the region of interest in myopic children. Translational Vision Science & Technology 12(3), 22–22 (2023)
5 Supplementary materials
5.1 Population tables
OCTANE [5] Diurnal Variation [5] Normative i-Test [5] Prevent Dementia [21] GCU Topcon [17] Total Subjects 46 20 1 21 121 24 233 Control/Case 0 / 46 20 / 0 1 / 0 11 / 10 56 / 65 24 / 0 112 / 121 Male/Female 24 / 22 11 / 9 1 / 0 0 / 21 66 / 55 14 / 9 116 / 116 Right/Left eyes 46 / 0 20 / 0 1 / 1 21 / 21 117 / 115 22 / 21 227 / 158 Age (mean (SD)) 47.5 (12.3) 21.4 (2.3) 23.0 (0.0) 32.8 (5.4) 50.8 (5.6) 21.8 (7.9) 42.9 (13.7) Device manufacturer Heidelberg Heidelberg Heidelberg Heidelberg Heidelberg Topcon All Device type Standard Standard FLEX FLEX Standard DRI Triton Plus All nEDI / EDI EDI EDI Both EDI Both Average ART 100 100 9 50 100 Scan location Horizontal/Vertical 168 / 0 55 / 50 4 / 4 76 / 76 381 / 369 132 / 139 816 / 638 Volume/Radial/Peripapillary 0 / 0 / 0 0 / 0 / 66 365 / 0 / 0 2,408 / 0 / 0 0 / 0 / 0 0 / 1,307 / 0 2,773 / 1,307 / 66 Total B-scans 168 171 373 2,560 750 1,578 5,600
Training Validation Testing External test Total Subjects 122 28 37 46 233 Male/Female 64 / 57 12 / 16 16 / 21 24 / 22 116 / 116 Control/Case 76 / 46 16 / 12 20 / 17 0 / 46 112 / 121 Right/Left eyes 117 / 107 27 / 23 37 / 28 46 / 0 227 / 158 Standard/FLEX/DRI Triton Plus 88 / 14 / 20 24 / 2 / 2 29 / 6 / 2 46 / 0 / 0 187 / 22 / 24 Heidelberg/Topcon 102 / 20 26 / 2 35 / 2 46 / 0 209 / 24 Age (mean (SD)) 40.7 (14.2) 42.5 (11.9) 44.5 (13.4) 47.5 (12.3) 42.9 (13.4) Cohort OCTANE 0 0 0 46 46 Diurnal Variation 12 4 4 0 20 Normative 1 0 0 0 1 i-Test 13 2 6 0 21 Prevent Dementia 76 20 25 0 121 GCU Topcon 20 2 2 0 24 B-scans Standard/Flex/DRI Triton Plus 582 / 2,281 / 1,281 136 / 190 / 140 137 / 462 / 157 168 / 0 / 0 1,023 / 2,933 / 1,578 Heidelberg/TopCon 2,863 / 1,281 326 / 140 599 / 157 168 / 0 3,956 / 1,578 Horizontal/Vertical scans 462 / 461 90 / 82 95 / 95 168 / 0 816 / 638 Volume/Radial/Peripapilary scans 2,161 / 1,060 / 39 178 / 116 / 15 434 / 131 / 12 0 / 0 / 0 2,773 1,307 / 0 Total B-scans 4,183 481 768 168 5,600
5.2 Mean absolute error analysis of choroid measurements
Experiment Internal External Area Thickness CVI Fovea Area Thickness CVI Fovea Choroidalyzer [6] 0.0381 9.2445 0.0414 6.9,11.0 0.0417 9.6963 0.0767 5.9,12.6 UNet w/ ResNet18 [10] 0.0300 7.1159 0.0348 12.1,11.3 0.0400 9.1159 0.0448 12.1,11.3 UNet w/ MobileNetV3 [10] 0.0597 14.8460 0.0517 12.0,9.2 0.0597 14.8460 0.0517 12.0,9.2 REACHNet (ours) 0.0273 6.8788 0.0338 6.4,5.4 0.0350 8.3590 0.0382 5.0,5.5 REACHNet — no domain-specific augs 0.0306 7.4182 0.0329 6.4,5.6 0.0431 10.0769 0.0427 5.2,5.7 REACHNet — no multi-resolution 0.0300 7.7629 0.0383 10.7,8.0 0.0412 10.0533 0.0410 5.1,5.3 REACHNet — no self-attention 0.028 6.6203 0.0354 6.5,7.0 0.0407 10.2387 0.0391 5.6,5.8
5.3 Qualitative preference stratified by device and manufacturer
Device type REACHNet (ours) Choroidalyzer [6] Ground-truth labels Topcon DRI Triton Plus () 8 3 1 Heidelberg Standard () 41 1 2 Heidelberg FLEX () 36 2 6 Total () 85 6 9