Rotation of the Globular Cluster Population of the Dark Matter Deficient Galaxy NGC 1052-DF4: Implication for the total mass
Abstract
We explore the globular cluster population of NGC 1052-DF4, a dark matter deficient galaxy, using Bayesian inference to search for the presence of rotation. The existence of such a rotating component is relevant to the estimation of the mass of the galaxy, and therefore the question of whether NGC 1052-DF4 is truly deficient of dark matter,similar to NGC 1052-DF2, another galaxy in the same group. The rotational characteristics of seven globular clusters in NGC 1052-DF4 were investigated, finding that a non-rotating kinematic model has a higher Bayesian evidence than a rotating model, by a factor of approximately 2.5. In addition, we find that under the assumption of rotation, its amplitude must be small. This distinct lack of rotation strengthens the case that, based on its intrinsic velocity dispersion, NGC 1052-DF4 is a truly dark matter deficient galaxy.
Y. Li]yli464@aucklanduni.ac.nz
1 Introduction
Ultra-diffuse galaxies (UDGs) are defined by their extremely low matter densities and luminosities, with a surface brightness from 25 to 28 mag arcsec-2 and a relatively large scale radius of about kpc 2015ApJ…798L..45V (21, 8). According to 2016ApJ…828L…6V (20), some UDGs appear to have very high dark matter fractions with very little stellar material. Alternatively, other UDGs appear to possess much less dark matter than expected (2018Natur.555..629V, 24, e.g.).
NGC 1052-DF2 is one such claimed matter deficient UDG in the NGC 1052 group. 2018ApJ…864L..18V (25) first reported that NGC1052-DF2 has a comparatively small velocity dispersion of about 3.2 km s-1, which is the basis for the galaxy’s low mass estimate, and hence implied deficiency of dark matter. This finding prompted controversy since dark matter is thought to be essential to galaxy formation and evolution and presumed to be significant in almost all galaxies. Through a Bayesian-based analysis, 2018ApJ…859L…5M (11) concluded that NGC 1052-DF2’s inherent velocity dispersion is about 9.5 km s-1, which somewhat mitigates the shortage of dark matter. However, 2019ApJ…874L…5V (23) discovered a second galaxy in the NGC 1052 group, naming it NGC 1052-DF4. This galaxy is also a UDG and is very similar to the NGC 1052-DF2 galaxy in size, surface brightness, and shape. 2019ApJ…874L…5V (23) found that NGC 1052-DF4 also possessed a relatively low velocity dispersion, and hence concluded it is also dark matter deficient.
The potential lack of dark matter in NGC 1052-DF2 and NGC 1052-DF4 has prompted investigation from several angles. Some have focused on determining the distance to these galaxies 2019MNRAS.486.1192T (19, 3, 16, 31), with the possibility that a smaller distance would bring the properties of these galaxies inline with the overall galaxy populations. Others have considered the estimation of their intrinsic velocity dispersion 2018ApJ…864L..18V (25, 11, 4, 23), as well as the question of whether the associated globular cluster population rotates 2020MNRAS.491L…1L (10).
There are several hypotheses that have been suggested to account for the distinct characteristics of these dark matter deficient galaxies. 2018MNRAS.473.4339O (14) proposes that these galaxies originally contained a typical amount of dark matter, which they later lost as a result of interactions with nearby galaxies, a scenario backed up through computer simulations 2022NatAs…6..496M (13). Based on this mechanism, they estimate that about 30% of massive central galaxies contain a single satellite with little dark matter. The findings of 2018anms.conf….1B (1) also suggest that the creation of some UDGs can be associated with interactions between galaxies, either due to UDGs coalescing from tidal debris in stellar streams. Moreover, it is suggested by 2022Natur.605..435V (26) that NGC 1052-DF2 and NGC 1052-DF4, the two dark matter deficient galaxies which are the focus of this study, originated in an individual event, a “bullet dwarf” collision, roughly eight billion years ago.
Recently, multiple investigations have confirmed that NGC 1052-DF4 is experiencing tidal stripping, which may account for the galaxy’s low dark matter content. 2020ApJ…904..114M (12) showed that NGC 1052-DF4 is experiencing tidal disruption, and they infer that the contact between it and the nearby galaxy, NGC 1035, is most likely the cause for the stripping of dark matter. 2022ApJ…935..160K (7) also discovered evidence of tidal disruption observed in both NGC 1052-DF2 and NGC 1052-DF4, which strongly suggests a common origin for the removal of dark matter. However, they concluded that the most probable cause of these tidal disruptions is the central giant elliptical galaxy, NGC 1052, which lies between the two galaxies. More recently, 2024arXiv240204304G (5) used ultra-deep images from the Gemini telescopes to explore tidal signatures in NGC 1052-DF2 and NGC 1052-DF4, finding no signs of tidal disruption, although NGC 0152-DF4 does appear to exhibit tidal tails. They, too, conclude that gravitational interactions may have removed the dark matter from NGC1052-DF4.
However, it is important to note that the claim of dark matter deficiency is based on dynamical modeling that assumes no rotation 2020MNRAS.491L…1L (10). Such rotation shifts the balance between pressure and rotational support, and hence, neglecting it will bias the inferred dark matter mass 2018ApJ…863L..15W (29, 9).Inspired by the work of 2020MNRAS.491L…1L (10) on NGC 1052-DF2, a similar statistical analysis of NGC 1052-DF4’s globular clusters was undertaken. The primary objective of this study is to determine whether the globular cluster population rotates.
The paper is structured as follows. Section 2 describes the data for the NGC 1052-DF4 globular cluster population. Section 3 presents the kinematic model employed in this paper, and Bayesian inference is also explained in this section. Bayesian inference was used to estimate the posterior probability distributions and the marginal likelihoods for various kinematic models of the globular clusters. Section 4 presents the findings, while Section 5 presents the effect on the estimated mass of NGC 1052-DF4. Finally, the discussion and conclusions are presented in Sections 6 and 7, respectively.
2 Data
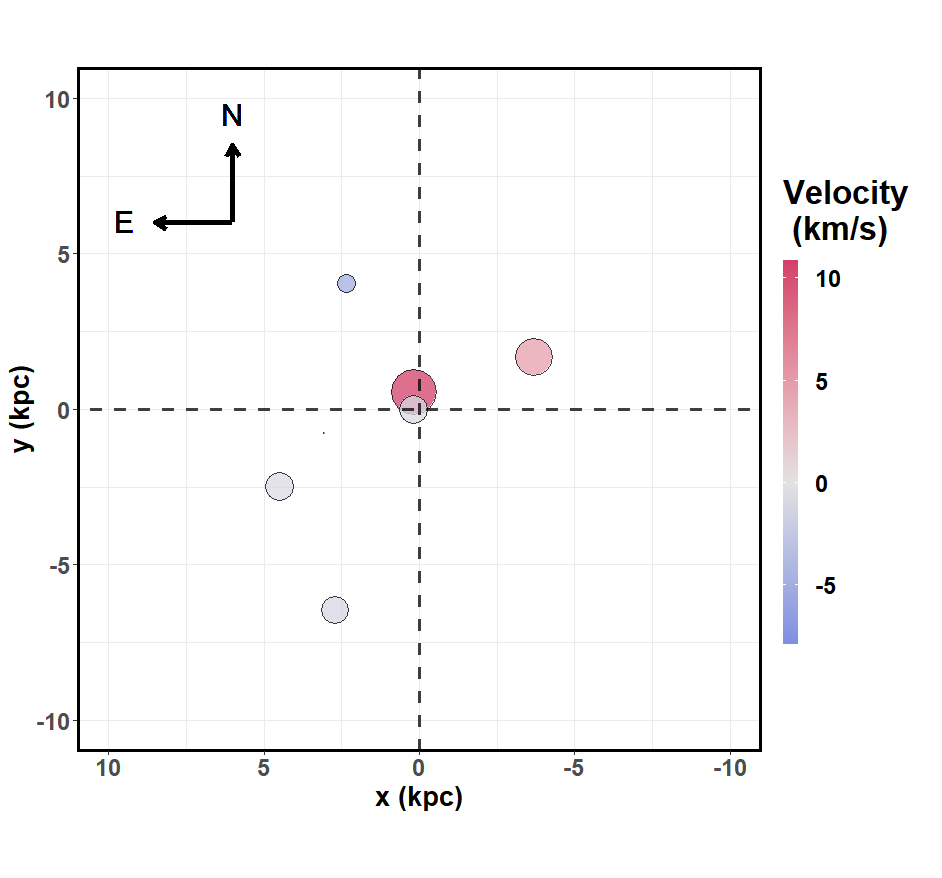
Previous authors used the Hubble Space Telescope to discover the compact objects associated with NGC 1052-DF4 (van Dokkum et al. 2019). Using the technique described in 2018ApJ…856L..30V (22), SExtractor 1996AAS..117..393B (2) was used to assess the overall magnitudes, colors, and Full Width Half Maximum (FWHM) sizes of compact objects in the images. 2018ApJ…856L..30V (22) stated that compact objects with an magnitude smaller than 23, a colour within the range between 0.20 and 0.43, and a FWHM value between 0.12” and 0.30” are considered to be likely globular clusters. Hence, by applying this method, 2019ApJ…874L…5V (23) found that, out of 11 candidates, only seven meet these criteria, with a mean overall magnitude with a value of 22.10 and an rms spread of 0.39 mag. These seven objects were subsequently confirmed as being associated with NGC 1052-DF4 using spectra from the Low Resolution Imaging Spectrograph on the Keck I telescope. Information about the seven confirmed globular clusters of NGC 1052-DF4 was available from 2019ApJ…874L…5V (23). For our purposes, the data consists of the positions of the clusters on the sky, the measured velocities of the clusters along the line of sight, and the uncertainties on these line-of-sight velocities. The positions and velocities of these seven clusters are shown in Figure 1.
3 Models and Bayesian Inference
The kinematic model used to analyze the NGC1052-DF2 galaxy 2020MNRAS.491L…1L (10) is still used in this study. The line-of-sight velocity due to rotation is given by:
| (1) |
where signifies the rotational amplitude and denotes how the rotation axis of the globular clusters is oriented. This choice of functional form for the rotational velocity has previously been called the model, after 2014MNRAS.442.2929V (27). In other work, consideration was also given to the other two types of models, called and . However, in order to maintain continuity with the previous analysis of NGC 1052-DF2, we chose to employ model in this analysis. A presents the details of the and models.
Bayesian inference is used throughout this work to determine the parameters’ posterior probability distributions based on the data analysed. The posterior distribution is provided by Bayes’s theorem:
| (2) |
where is a vector of unknown parameters for which an inference is anticipated (since and are used in this work to signify angles on the sky, was chosen to denote unknown parameters). The data is represented by , the parameters’ prior probability distribution is defined by , is the likelihood function, and is the marginal likelihood value, sometimes called the evidence. The prior distributions for unknown parameters are shown in Table 1.
| \headrowParameters | Description | Prior | Unit |
|---|---|---|---|
| Rotational Amplitude | Uniform(0, 20) | km s-1 | |
| Orientation of rotation axis | Uniform(0, 2) | radians | |
| Velocity dispersion | Uniform(0, 20) | km s-1 | |
| Systemic Velocity | Uniform(-10, 10) | km s-1 |
The measured velocities given the parameters are assumed to have a Normal Distribution with mean and dispersion of as shown below:
| (3) |
so the likelihood function can be expressed as:
| (4) |
The marginal likelihood or evidence is estimated using nested sampling introduced by 2004AIPC..735..395S (18) and expressed as follows:
| (5) |
where is the evidence (marginal likelihood), represents the likelihood function, and stands for the prior distribution. Since nested sampling computes the marginal likelihood for each model constructed, we are able to choose the most plausible model based on the highest marginal likelihood value (assuming equal prior probabilities) or propagate uncertainty about the model into any conclusions reached.
The Bayes factor is subsequently computed to assess which model fits the data best after obtaining the marginal likelihood for each model. It is a ratio of the marginal likelihood of two models, and its value determines how strongly the data supports one model over another. The Bayes Factor is given by:
| (6) |
where the model is denoted by .
4 Results
4.1 Model 1: Non-Rotational Model
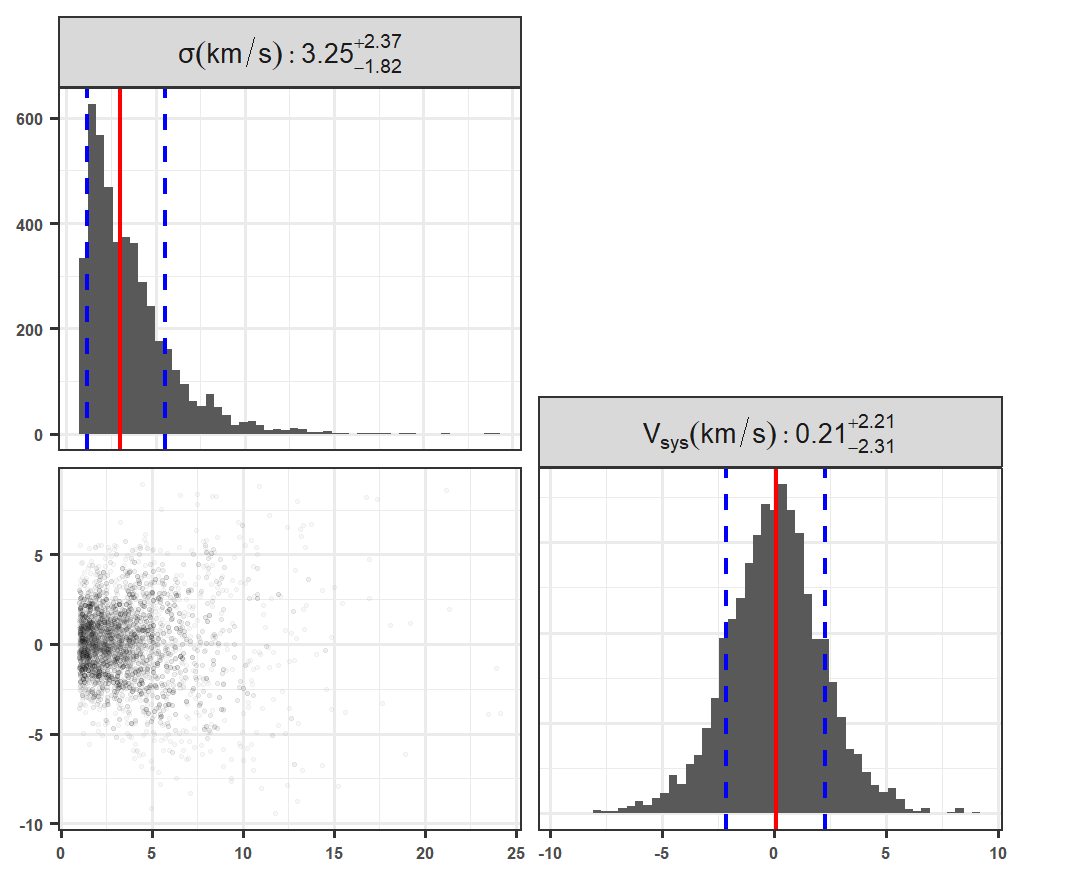
We first consider a scenario in which the globular cluster population does not rotate. Under this assumption, the amplitude in Equation 1 will be equal to zero, and hence the velocity is entirely dependent on the velocity dispersion . This leaves only two parameters to be estimated, and . Table 2 displays the summary statistics of parameter estimates, and Figure 2 shows the posterior distributions for systematic velocity and velocity dispersion . The distribution of is right-skewed, whereas the distribution of is symmetric. Finally, this Non-Rotational Model has a marginal likelihood of .
| \headrowParameters | Estimates | Units |
|---|---|---|
| km s-1 | ||
| km s-1 |
4.2 Model 2: Rotational Model
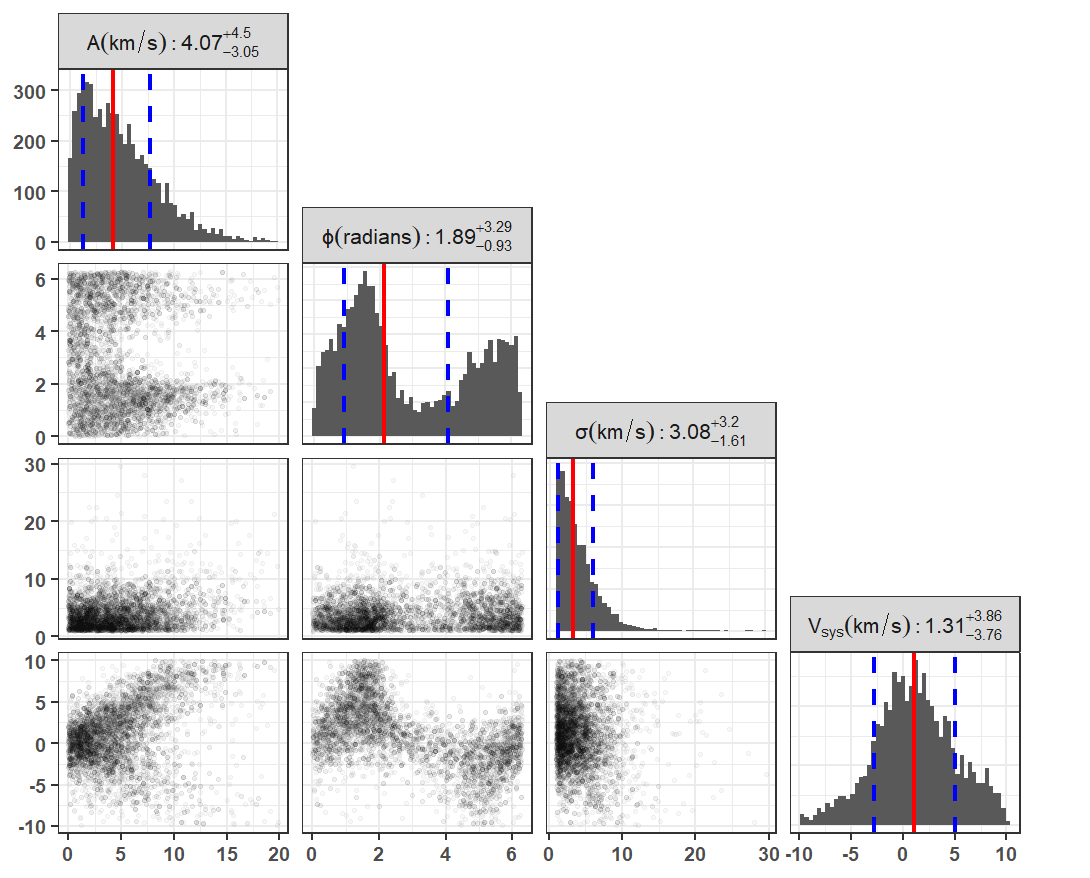
The second model we considered includes a nonzero rotational amplitude . The posterior distribution for the parameters of the Rotational Model is displayed in Figure 3. There is a right-skewed posterior distribution of parameters and , with most probabilities accumulating between 0 km s-1and 7 km s-1and 0 km s-1and 6 km s-1, respectively. Furthermore, the posterior distribution of is symmetric. Interestingly, the posterior distribution for is weakly bimodal, as there are multiple ways of dividing the globular clusters into a red-shifted half and a blue-shifted half (on average). Note that the apparent large bimodality is an artifact of the periodicity of the parameter space — the smaller, actual bimodality can be seen when angles are redefined to be centered around zero. The mean and median values of amplitude, , are 4.88 km s-1and 4.07 km s-1, which are somewhat higher than those of velocity dispersion, . The summary statistics of parameter estimates are shown in Table 3 and the marginal likelihood of the Rotational Model is .
| \headrowParameters | Estimates | Units |
|---|---|---|
| km s-1 | ||
| radians | ||
| km s-1 | ||
| km s-1 |
4.3 Model 3: Rotational Model with Alternative Priors
Finally, we considered the rotational model but with a more complex joint prior distribution for amplitude , velocity dispersion , and systemic velocity , rather than the simple uniform distributions used above. These priors model the idea that the rotational amplitude is likely not to be precisely zero but may be small, moderate, or large. Roughly speaking, the rotating and non-rotating (or, more accurately, hardly-rotating) possibilities are here represented in the parameter space of a single parameter estimation problem, rather than being represented in two separate models, as we have done so far. The prior distribution stays the same for the orientation of the rotation axis . Table 4 presents the details of the alternative prior distribution of the parameters.
| \headrowParameters | Description | Prior | Unit |
|---|---|---|---|
| Rotational Amplitude | km s-1 | ||
| Orientation of rotation axis | Uniform(0, 2) | radians | |
| Velocity dispersion | km s-1 | ||
| Systemic Velocity | km s-1 |
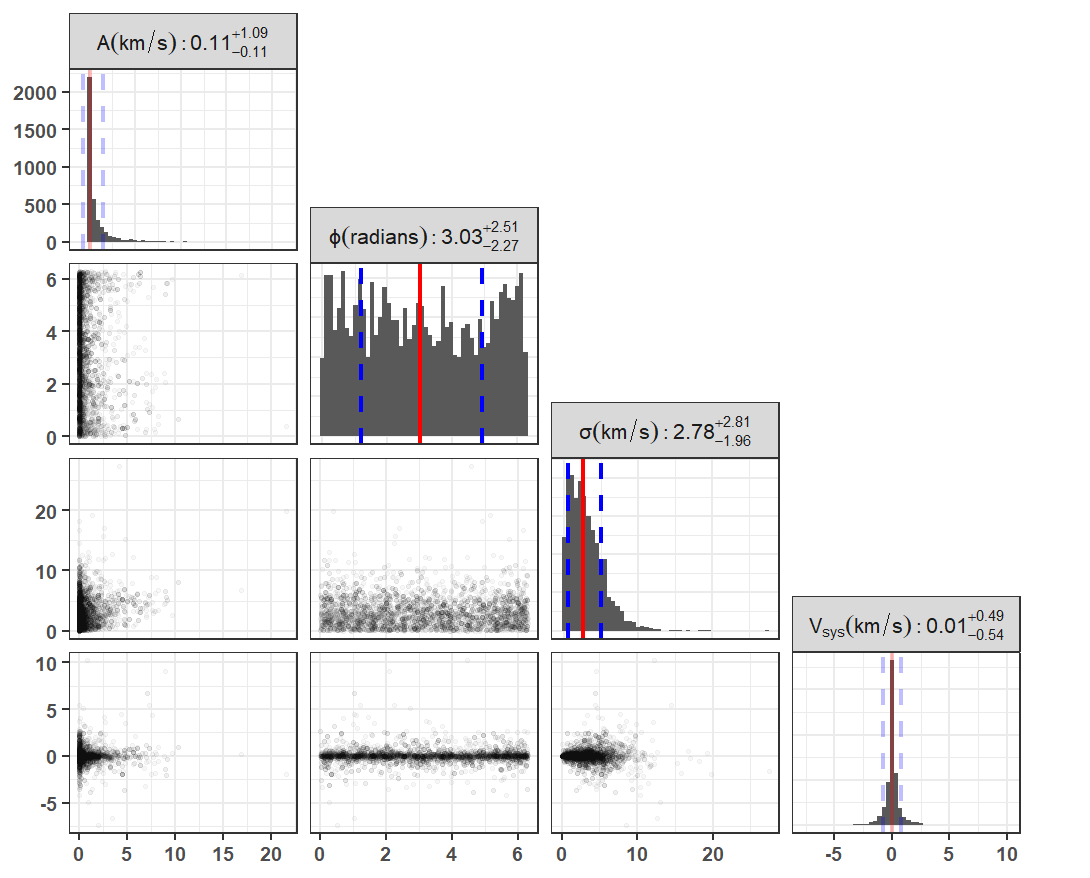
Figure 4 demonstrates a similar outcome to Figure 3; the posterior distribution of parameters and is right-skewed, with the majority of the probabilities gathering between 0 kms-1 and 2 kms-1 and 0 kms-1 and 6 kms-1, respectively. Additionally, the posterior distribution of shows that it is effectively zero (though it will never be precisely zero) and is still symmetric. Compared to the outcome of the Rotational Model, the amplitude, , from this model, has a much lower value for the mean and median and is smaller than those values for the velocity dispersion, . In this case, the posterior distribution for is approximately equal to the prior distribution, as the angle becomes less important when the amplitude is low, as it is here. The marginal likelihood of the Rotational Model with Alternative Priors is . Table 5 presents parameter estimation summary statistics.
| \headrowParameters | Estimates | Unit |
|---|---|---|
| km s-1 | ||
| radians | ||
| km s-1 | ||
| km s-1 |
4.4 Model Comparison
The study will not compare the marginal likelihood of Model 3 (Rotational Model with Alternative Priors) to the other two models since it is intended to capture both possibilities within a single model. Table 6 shows that the marginal likelihood estimate for the Non-Rotational model is slightly larger than the Rotational Model. The Bayes Factor of the Non-Rotational Model over the Rotational Model is calculated as below:
| (7) |
where, is the Non-Rotational Model and is the Rotational Model. This Bayes Factor of around 2.5 indicates weak support for the non-rotational model.
| \headrowModels | |
|---|---|
| Non-Rotational | |
| Rotational |
5 Mass of the Galaxy
As stated in the introduction, the idea that the galaxy is dark matter deficient is supported by a mass estimate based on the assumption of no rotation. If a rotational signature is detected in the globular clusters in Section 4, the estimated dynamical mass of NGC 1052-DF4 will be affected, which would further affect conclusions about the quantity of dark matter in the galaxy. Therefore, the study investigated employing the same estimator that 2020MNRAS.491L…1L (10) used to estimate the overall mass of the NGC 1052-DF2 galaxy within a certain radius. The estimator is expressed as follows:
| (8) |
where, is the rotational velocity as given in equation 1, for velocity dispersion, and according to the standard astronomical definition, is the rotation’s inclination angle. In this section, the amplitude, , serves as the only representation of the rotating velocity, . Moreover, is the reference radius with a value of 7.5 kpc, and is the Newtonian gravitational constant. According to 2009ApJ…704.1274W (28) and 2010MNRAS.406.1220W (30), equation 8 can be considered as a lower estimate of the galaxy’s total mass because the more complicated mass estimators normally have a multiplication constant together with the square of the , which explains the internal mass distribution, and usually exceeds one. The mass estimator here is a function of the unknown parameters. To compute the posterior distribution for the mass, we applied the formula to each possible parameter vector in our posterior sample.
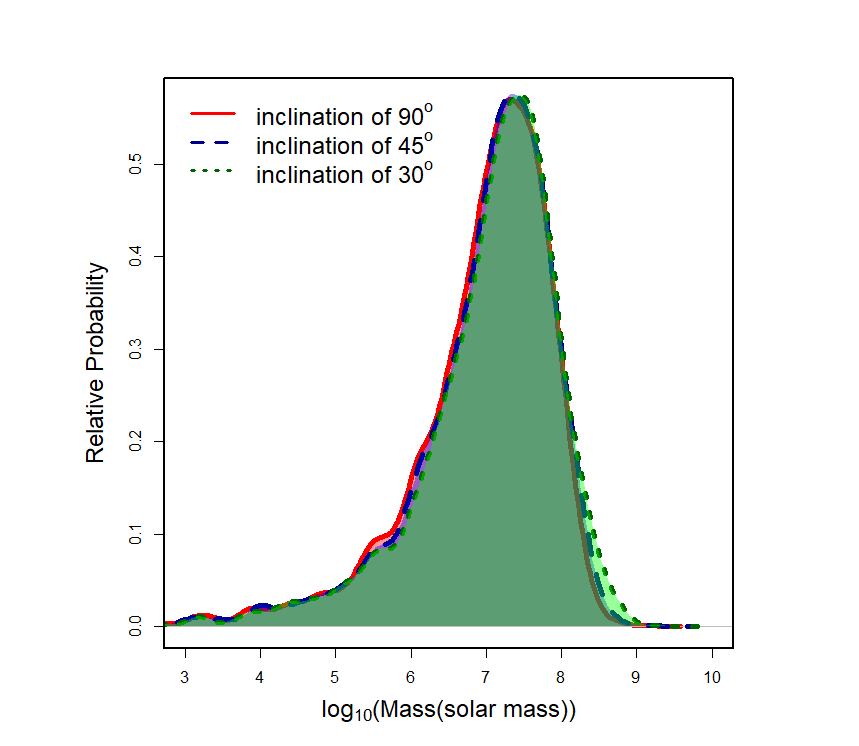
The posterior distribution of NGC 1052-DF4’s estimated mass with three different rotational inclinations is shown in Figure 5. This figure suggests that the estimated mass of NGC 1052-DF4 has right-skewed posterior distributions for all three inclination angles, with the majority of the probability falling between 0 and solar masses. Moreover, the estimated mass of the NGC 1052-DF4 can reach as high as 6 solar masses. There is no substantial difference between the three density curves with different inclinations. This is reasonable as the amplitude, , was very small or possibly zero, which caused the velocity dispersion, , to dominate in the equation 8 and result in the inclination becoming irrelevant.
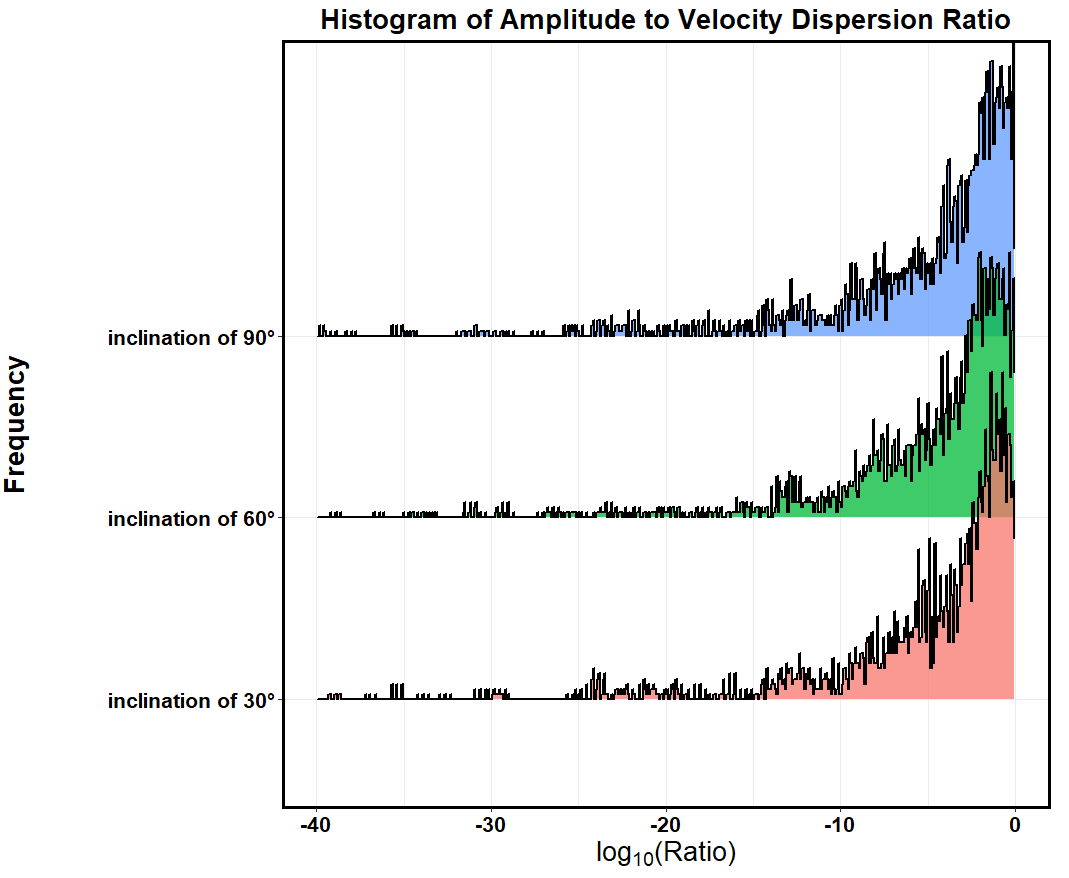
Figure 6 displays the posterior distributions of the log amplitude-to-velocity-dispersion ratio, , with different inclinations. The distributions of with different inclinations are all remarkably similar, with the majority of the probability being for large negative values of the log ratio. This demonstrates that the NGC 1052-DF4 galaxy’s globular cluster population has a low probability of containing a significant rotating component, and that estimates of its mass do not need to take any significant rotation into account.
6 Discussion
Through the fitting of three Bayesian models to the data, the rotational characteristics of the globular cluster population of NGC 1052-DF4 have been assessed. Standard uniform priors were used for the Non-Rotational Model and one of the Rotational Models, and under these assumptions, we performed a model comparison, finding that the Non-Rotational Model was favoured. As an alternative, using a more complex prior, we performed a similar analysis using only parameter estimation. In this latter case, the question being answered changed from “Is the amplitude zero or non-zero?” to “Is the amplitude small or large?”
The posterior distribution in Figure 3 reveals that a significant portion of the posterior probabilities for the rotational amplitude, , and velocity dispersion, , are close to zero. This implies the rotational amplitudes of the globular clusters in NGC 1052-DF4 are extremely small. Moreover, the right-skewed posterior distribution of results from the small sample size, as high values of cannot necessarily be ruled out. Model 3 (Rotational Model with Alternative Priors) had a similar result for the amplitude of rotation, , and velocity dispersion, . The 68% central credible interval for extends from 0.00 kms-1 to only 1.19 kms-1. As can also be seen from Table 3, both of the estimations of the rotational amplitudes, , are smaller than those for the velocity dispersion, .
As seen in Table 6, the Non-Rotational Model’s marginal likelihood is greater than that of the Rotational Model. Although the difference between the two is small, it does indicate that the data favor the Non-Rotational Model over the Rotational Model. However, according to the value (2.46) of the Bayes factor calculated in Equation 7, there is only weak evidence to support the Non-Rotation Model (guides for interpretation of Bayes Factors may be found in kass (6) and PENNY2007454 (15)). In other words, the rotation of NGC 1052-DF4’s globular clusters is not completely ruled out. However, if it does exist, it is small.
Based on equation 1, the amplitude is directly proportional to the rotational velocity. Also, from equation 5, it can be seen that the rotational velocity and the velocity dispersion, , are directly related to the mass of the galaxy. Consequently, a low amplitude value (around 0) and a slightly larger value of indicate that the globular cluster rotational velocities will likewise be small, resulting in a very low estimated mass of the NGC 1052-DF4 galaxy, which is about the same as in the previous study 2019ApJ…874L…5V (23). Hence, these results further imply that the NGC 1052-DF4 galaxy contains little dark matter, which is consistent with the result of a newly published paper from 2023ApJ…957….6S (17). As mentioned in Section 1, 2024arXiv240204304G (5) found that NGC 0152-DF4 exhibits tidal tails, which explains the low quantity of dark matter in the galaxy.
7 Conclusions
In this paper, we tested the existence of a rotating element by analysing the rotational features of the seven globular clusters in NGC 1052-DF4. After comparing the marginal likelihood and calculating the Bayes factor of the Non-Rotational Model versus the Rotational Model, we find that the Non-Rotational Model is weakly preferred by a Bayes Factor of about 2.5. The outcome of the Rotational Model with Alternative Priors provides more evidence that the globular cluster populations of NGC 1052-DF4 do not rotate significantly. The result from this study is consistent with the previous study 2019ApJ…874L…5V (23). Furthermore, this result supports the conclusion that there is little dark matter in the NGC 1052-DF4 galaxy since mass estimates to not need to be modified to take rotation into account. This result is also consistent with the recent study from 2024arXiv240204304G (5) and reinforces the conclusion from 2023ApJ…957….6S (17).
We thank the anonymous referee for helpful comments which assisted us in improving this manuscript.
Funding Statement
This research received no external funding.
Competing Interests
None
Data Availability Statement
Any reasonable request will be granted access to the data used in this work.
References
- (1) P. Bennet et al. “Evidence for Ultra-Diffuse Galaxy ’Formation’ Through Galaxy Interactions” In The 34th Annual New Mexico Symposium, 2018, pp. 1
- (2) E. Bertin and S. Arnouts “SExtractor: Software for source extraction.” In Astronomy and Astrophysics Supplement Series 117, 1996, pp. 393–404 DOI: 10.1051/aas:1996164
- (3) Shany Danieli et al. “A Tip of the Red Giant Branch Distance to the Dark Matter Deficient Galaxy NGC 1052-DF4 from Deep Hubble Space Telescope Data” In The Astrophysical Journal Letters 895.1, 2020, pp. L4 DOI: 10.3847/2041-8213/ab8dc4
- (4) Jérémy Fensch et al. “The ultra-diffuse galaxy NGC 1052-DF2 with MUSE. II. The population of DF2: stars, clusters, and planetary nebulae” In Astronomy and Astrophysics 625, 2019, pp. A77 DOI: 10.1051/0004-6361/201834911
- (5) Giulia Golini et al. “Ultra-deep imaging of NGC1052-DF2 and NGC1052-DF4 to unravel their origins” In arXiv e-prints, 2024, pp. arXiv:2402.04304 arXiv:2402.04304 [astro-ph.GA]
- (6) Robert E. Kass and Adrian E. Raftery “Bayes Factors” In Journal of the American Statistical Association 90.430 Taylor & Francis, 1995, pp. 773–795 DOI: 10.1080/01621459.1995.10476572
- (7) Michael A. Keim et al. “Tidal Distortions in NGC1052-DF2 and NGC1052-DF4: Independent Evidence for a Lack of Dark Matter” In The Astrophysical Journal 935.2, 2022, pp. 160 DOI: 10.3847/1538-4357/ac7dab
- (8) Jin Koda, Masafumi Yagi, Hitomi Yamanoi and Yutaka Komiyama “Approximately a Thousand Ultra-diffuse Galaxies in the Coma Cluster” In The Astrophysical Journal Letters 807.1, 2015, pp. L2 DOI: 10.1088/2041-8205/807/1/L2
- (9) Enrico Laudato and Vincenzo Salzano “DHOST gravity in ultra-diffuse galaxies - part I: the case of NGC1052-DF2” In European Physical Journal C 82.10, 2022, pp. 935 DOI: 10.1140/epjc/s10052-022-10901-0
- (10) Geraint F. Lewis, Brendon J. Brewer and Zhen Wan “The globular cluster population of NGC 1052-DF2: evidence for rotation” In Monthly Notices of the Royal Astronomical Society 491.1, 2020, pp. L1–L5 DOI: 10.1093/mnrasl/slz157
- (11) Nicolas F. Martin, Michelle L.. Collins, Nicolas Longeard and Erik Tollerud “Current Velocity Data on Dwarf Galaxy NGC 1052-DF2 do not Constrain it to Lack Dark Matter” In The Astrophysical Journal Letters 859.1, 2018, pp. L5 DOI: 10.3847/2041-8213/aac216
- (12) Mireia Montes et al. “The Galaxy “Missing Dark Matter” NGC 1052-DF4 is Undergoing Tidal Disruption” In The Astrophysical Journal 904.2, 2020, pp. 114 DOI: 10.3847/1538-4357/abc340
- (13) Jorge Moreno et al. “Galaxies lacking dark matter produced by close encounters in a cosmological simulation” In Nature Astronomy 6, 2022, pp. 496–502 DOI: 10.1038/s41550-021-01598-4
- (14) Go Ogiya and Oliver Hahn “What sets the central structure of dark matter haloes?” In Monthly Notices of the Royal Astronomical Society 473.4, 2018, pp. 4339–4359 DOI: 10.1093/mnras/stx2639
- (15) W.D. Penny, J. Mattout and N. Trujillo-Barreto “CHAPTER 35 - Bayesian model selection and averaging” In Statistical Parametric Mapping London: Academic Press, 2007, pp. 454–467 DOI: https://doi.org/10.1016/B978-012372560-8/50035-8
- (16) Zili Shen, Pieter van Dokkum and Shany Danieli “A Complex Luminosity Function for the Anomalous Globular Clusters in NGC 1052-DF2 and NGC 1052-DF4” In The Astrophysical Journal 909.2, 2021, pp. 179 DOI: 10.3847/1538-4357/abdd29
- (17) Zili Shen, Pieter van Dokkum and Shany Danieli “Confirmation of an Anomalously Low Dark Matter Content for the Galaxy NGC 1052-DF4 from Deep, High-resolution Continuum Spectroscopy” In The Astrophysical Journal 957.1, 2023, pp. 6 DOI: 10.3847/1538-4357/acfa70
- (18) John Skilling “Nested Sampling” In Bayesian Inference and Maximum Entropy Methods in Science and Engineering: 24th International Workshop on Bayesian Inference and Maximum Entropy Methods in Science and Engineering 735, American Institute of Physics Conference Series, 2004, pp. 395–405 DOI: 10.1063/1.1835238
- (19) Ignacio Trujillo et al. “A distance of 13 Mpc resolves the claimed anomalies of the galaxy lacking dark matter” In Monthly Notices of the Royal Astronomical Society 486.1, 2019, pp. 1192–1219 DOI: 10.1093/mnras/stz771
- (20) Pieter van Dokkum et al. “A High Stellar Velocity Dispersion and 100 Globular Clusters for the Ultra-diffuse Galaxy Dragonfly 44” In The Astrophysical Journal Letters 828.1, 2016, pp. L6 DOI: 10.3847/2041-8205/828/1/L6
- (21) Pieter van Dokkum et al. “Forty-seven Milky Way-sized, Extremely Diffuse Galaxies in the Coma Cluster” In The Astrophysical Journal Letters 798.2, 2015, pp. L45 DOI: 10.1088/2041-8205/798/2/L45
- (22) Pieter van Dokkum et al. “An Enigmatic Population of Luminous Globular Clusters in a Galaxy Lacking Dark Matter” In The Astrophysical Journal Letters 856.2, 2018, pp. L30 DOI: 10.3847/2041-8213/aab60b
- (23) Pieter van Dokkum et al. “A Second Galaxy Missing Dark Matter in the NGC 1052 Group” In The Astrophysical Journal Letters 874.1, 2019, pp. L5 DOI: 10.3847/2041-8213/ab0d92
- (24) Pieter van Dokkum et al. “A galaxy lacking dark matter” In Nature 555.7698, 2018, pp. 629–632 DOI: 10.1038/nature25767
- (25) Pieter van Dokkum et al. “The Distance of the Dark Matter Deficient Galaxy NGC 1052-DF2” In The Astrophysical Journal Letters 864.1, 2018, pp. L18 DOI: 10.3847/2041-8213/aada4d
- (26) Pieter van Dokkum et al. “A trail of dark-matter-free galaxies from a bullet-dwarf collision” In Nature 605.7910, 2022, pp. 435–439 DOI: 10.1038/s41586-022-04665-6
- (27) J. Veljanoski et al. “The outer halo globular cluster system of M31 - II. Kinematics” In Monthly Notices of the Royal Astronomical Society 442.4, 2014, pp. 2929–2950 DOI: 10.1093/mnras/stu1055
- (28) Matthew G. Walker et al. “A Universal Mass Profile for Dwarf Spheroidal Galaxies?” In The Astrophysical Journal 704.2, 2009, pp. 1274–1287 DOI: 10.1088/0004-637X/704/2/1274
- (29) Asher Wasserman et al. “A Deficit of Dark Matter from Jeans Modeling of the Ultra-diffuse Galaxy NGC 1052-DF2” In The Astrophysical Journal Letters 863.2, 2018, pp. L15 DOI: 10.3847/2041-8213/aad779
- (30) Joe Wolf et al. “Accurate masses for dispersion-supported galaxies: Accurate masses for spheroidal galaxies.” In Monthly Notices of the Royal Astronomical Society 406.2, 2010, pp. 1220–1237 DOI: 10.1111/j.1365-2966.2010.16753.x
- (31) Akram Hasani Zonoozi, Hosein Haghi and Pavel Kroupa “IMF-induced intrinsic uncertainties on measuring galaxy distances based on the number of giant stars: the case of the ultradiffuse galaxy NGC 1052-DF2” In Monthly Notices of the Royal Astronomical Society 504.2, 2021, pp. 1668–1675 DOI: 10.1093/mnras/stab789
Appendix A Other Kinematic Models
In this paper, we considered applying three different types of models (Table 7) to analyze the rotational features of NGC 1052-DF4’s globular cluster population:
-
•
2014MNRAS.442.2929V (27) introduced the model . This model takes into account a rotational velocity with a constant amplitude that is affected by angular dependence.
-
•
In the model, the globular cluster population rotates like a solid body, and the velocity increases linearly with respect to the rotation axis.
-
•
According to model , the rotation of the globular clustersis asymptotically flat. It is predicted that the velocity approaches a constant value away from the rotation axis, comparable to the rotation curve of spiral galaxies.
| \headrowModels | functional form of the models |
|---|---|
Although Model had the highest marginal likelihood estimates for both the Rotation Model and the Rotation Model with Alternative Priors, the difference is incredibly small when compared to the marginal likelihood estimates from Model for both the Rotation Model and the Rotation Model with Alternative Priors (Table 8). However, for consistency with the earlier study of NGC 1052-DF2, which used Model , we have decided to use model for this study. The main conclusions of the paper are not sensitive to the choice of rotation model.
| \headrowModels | for Model 2 | for Model 3 |
|---|---|---|