Observations of Water Frost on Mars with THEMIS: Application to the Presence of Brines and the Stability of (Sub)Surface Water Ice
Abstract
Characterizing the exchange of water between the Martian atmosphere and the (sub)surface is a major challenge for understanding the mechanisms that regulate the water cycle. Here we present a new dataset of water ice detected on the Martian surface with the Thermal Emission Imaging System (THEMIS). The detection is based on the correlation between bright blue-white patterns in visible images and a temperature measured in the infrared that is too warm to beassociated with CO2 ice and interpreted instead as water ice. Using this method, we detect ice down to 21.4°S, 48.4°N, on the pole-facing slopes at mid-latitudes, and on any surface orientation poleward of 45° latitude. Water ice observed with THEMIS is most likely seasonal rather than diurnal. Our dataset is consistent with near-infrared spectroscopic data predictions by the Mars Planetary Climate Model. The water frost average temperature is 170 K, and the maximum temperature measured is 243 K, lower than the water ice melting point. We show that the melting of pure water ice on the surface is unlikely due to cooling by latent heat during its sublimation. However, 243 THEMIS images show frosts that are hot enough to form brines if salts are present on the surface. The water vapor pressure at the surface, calculated from the ice temperature, indicates a dry atmosphere in early spring, during the recession of the CO2 ice cap. When it sublimes, the frost acts as a vapor source that is wetter than the near-surface atmosphere, which stabilizes the subsurface ice.
JGR Planets
Laboratoire de Météorologie Dynamique, Institut Pierre-Simon Laplace (LMD/IPSL), Sorbonne Université, Centre National de la Recherche Scientifique (CNRS), École Polytechnique, École Normale Supérieure (ENS), Paris, France Jet Propulsion Laboratory, California Institute of Technology, Pasadena, CA 91109, USA Northern Arizona University, Department of Astronomy and Planetary Science PO BOX 6010 Flagstaff, AZ 86011, USA Laboratoire Atmosphères, Milieux, Observations Spatiales (LATMOS/CNRS), Paris, France
Lucas Langelucas.lange@lmd.ipsl.fr
Seasonal water frosts on Mars are identified with coincident visible and temperature data obtained with THEMIS poleward of 48°N and 21°S;
Water frosts remain too cold to melt as pure ice. However, the warmest frost deposits observed may co-exist with brines;
Water frost on the surface stabilizes subsurface water ice, as it releases a large quantity of water vapor when it sublimes.
Plain Language Summary
During spring, parts of the Martian surface at mid and high latitudes are covered by a thin, bright layer of frost. We interpret these deposits as water ice that forms in winter and sublimes in spring as the ice temperature is too warm to be CO2 ice. Our study proposes a spatial and temporal mapping of these ice deposits to better characterize the exchange of volatiles between the Martian atmosphere and the surface. Water ice is preferentially detected on pole-facing slopes below 45° latitude and all types of surfaces at higher latitudes. In late spring, water ice cannot melt despite solar heating because of sublimation cooling. On the other hand, these ice deposits are warm enough to form brines if salt crystals are present at the surface. When the frost sublimes, it serves as a source of water vapor that can diffuse into the ground and recondense to stabilize the permafrost below the surface.
1 Introduction
Although water is only a minor component of the Martian atmosphere, the water cycle is one of the most important contributors to the present and past climate of Mars. For example, although the current atmospheric moisture is low [<]13 microns precipitable,¿Smith2002, water clouds have a strong influence on the atmospheric dynamics [Wilson \BOthers. (\APACyear2007), Wilson \BOthers. (\APACyear2008), Madeleine \BOthers. (\APACyear2012), Navarro \BOthers. (\APACyear2014)]. Similarly, the presence of ice buried in the subsurface has a profound impact on the surface energy balance, delaying or even preventing CO2 condensation in winter [Haberle \BOthers. (\APACyear2008)]. Therefore, characterizing the mechanisms controlling the water cycle is crucial to better understanding the climate on Mars. This water cycle is mainly driven by the sublimation cycle of massive water-ice deposits located primarily at the North Pole and to a lesser extent at the South Pole, although the role of the regolith in this cycle remains controversial [<]see a full discussion in¿Montmessin2017. Every summer, the northern polar water ice cap sublimes, releasing water vapor that is then transported to lower latitudes. Depending on temperature and humidity conditions, this water vapor can condense in the atmosphere and form clouds [<]e.g.,¿Curran1973, diffuse into the subsurface [<]e.g.,¿Schorghofer2005, or form frost on the surface [<]e.g.,¿Svitek1990.
The characterization of surface water frost deposits is of great interest to assess 1) the exchanges between perennial water ice reservoirs at the poles and the rest of the planet [Bapst \BOthers. (\APACyear2015)], 2) their potential to form liquid water or brines on the surface [<]e.g.,¿Schorghofer2020, 3) their contribution to current surface processes [<]e.g.,¿Diniega2021, Dundas2021, and 4) the exchanges of water vapor between surface frost and subsurface water ice buried in the mid and high latitudes [<]e.g.,¿BAPST2015, Williams2015, Lange2023ice. Since \citeALeighton1966’s pioneering work on volatile exchanges between reservoirs, local approaches at lander landing sites [Svitek \BBA Murray (\APACyear1990), Landis (\APACyear2007), Martínez \BOthers. (\APACyear2016)], or globally from orbit [Kieffer \BBA Titus (\APACyear2001), Titus \BOthers. (\APACyear2003), Schorghofer \BBA Edgett (\APACyear2006), Landis (\APACyear2007), Piqueux \BOthers. (\APACyear2008), Carrozzo \BOthers. (\APACyear2009), Schmidt \BOthers. (\APACyear2009), Vincendon, Forget\BCBL \BBA Mustard (\APACyear2010), Appéré \BOthers. (\APACyear2011), Kereszturi \BOthers. (\APACyear2011), Bapst \BOthers. (\APACyear2015), Vincendon (\APACyear2015), Stcherbinine \BOthers. (\APACyear2023)], have been undertaken to map and characterize water frost deposits. For the latter approach, two methods exist to date: 1) spectroscopic detections of water ice based on near-infrared spectral absorptions [Langevin \BOthers. (\APACyear2007), Schmidt \BOthers. (\APACyear2009), Vincendon, Forget\BCBL \BBA Mustard (\APACyear2010), Kereszturi \BOthers. (\APACyear2011), Vincendon (\APACyear2015)] and 2) the identification of bright patches with a temperature that is too warm to be CO2 ice but is instead H2O ice [Kieffer \BBA Titus (\APACyear2001), Titus \BOthers. (\APACyear2003), Schorghofer \BBA Edgett (\APACyear2006), Piqueux \BOthers. (\APACyear2008), Bapst \BOthers. (\APACyear2015), Stcherbinine \BOthers. (\APACyear2023)]. This last technique requires simultaneous measurement in visible wavelengths, to detect frost through its distinct albedo or color, and at infrared wavelengths, to determine the composition of the ice through temperature. This last quantity is required to determine the composition of the ice detected via a bright pattern in the visible range. For instance, \citeASchorghofer2006 identified bright white patches on pole-facing slopes at low latitudes. However, they were unable to access the temperature of such ice, and concluded, based on the temperatures simulated with a 1D thermal model, that these frost deposits were composed of CO2. \citeAVincendon2010water later showed, based on a near-infrared spectral method, that such ice deposits were instead water ice and not CO2 ice.
The coincident acquisition of visible and temperature data enables us to distinguish CO2 versus H2O ices, and to document new properties for Mars such as:
-
1.
The temperature of water ice. This measurement can be used to constrain the thermo-physical properties of ice through its diurnal/seasonal evolution [<]e.g.,¿Bapst2019, or to determine whether ice can reach melting temperature. However, most of these measurements have been acquired on the massive, perennial water ice deposits at the poles, where temperatures barely exceed 200 K [Kieffer \BBA Titus (\APACyear2001), Titus \BOthers. (\APACyear2003), Piqueux \BOthers. (\APACyear2008), Bapst \BOthers. (\APACyear2019)]. \citeABAPST2015 have measured ice temperatures down to 45° latitude with the Thermal Emission Spectrometer [<]TES, ¿Christensen2001 and found higher water frost temperature (220-240 K). However, they acknowledged that these warm-water ice temperatures might be due to sub-pixel terrain mixing (TES has a resolution of 3 × 6 km) and uncertainty in the retrieved surface temperatures [Bapst \BOthers. (\APACyear2019)]. \citeAVincendon2010water and \citeAVincendon2015 have detected water frost on pole-facing crater slopes at tropical latitudes, where it could exhibit higher temperatures than those from \citeABAPST2015, but they cannot retrieve the ice temperature with their instrument.
-
2.
The near-surface water vapor content. This quantity, while crucial for the stability of subsurface ice [Schorghofer \BBA Aharonson (\APACyear2005)] or to constrain the vertical profile of water vapor in the lower atmosphere [<]¿[and references therein]Leung2024, has not been directly measured by any rover or lander to date. It has been indirectly derived from simultaneous measurements of relative humidity, temperature, and pressure measurements at the Phoenix [Zent \BOthers. (\APACyear2010), Fischer \BOthers. (\APACyear2019)], Mars Science Laboratory [Harri \BOthers. (\APACyear2014)], and Mars 2020 [Polkko \BOthers. (\APACyear2023)] landing sites. However, if water frost is present at the surface, the water vapor content at the surface can be directly constrained as the vapor pressure is equal to the vapor pressure over ice at saturation (Pa), which is a function of the ice temperature (K) [Murphy \BBA Koop (\APACyear2005)]:
(1) Therefore, determining water ice temperatures could provide a new, broader set of near-surface water vapor data. Yet, this analysis has not been conducted by studies measuring water ice temperatures [<]e.g.,¿Kieffer2001, Titus2003, Piqueux2008, BAPST2015, Bapst2019.
Here we propose to extend the previous studies on the presence of water frost on the Martian surface by presenting a new dataset of water ice observed at mid and high latitudes and by providing a unique dataset of water ice temperature and vapor pressure using measurements from the Thermal Emission Imaging System [<]THEMIS, ¿Christensen2004 onboard Mars Odyssey. The latter simultaneously combines visible and infrared measurements, enabling the detection and characterization of ice as performed by \citeATitus2003, Piqueux2008, and \citeAWagstaff2008 for water ice, \citeAKhuller2021frost and \citeALange2022a for CO2 ice. \citeATitus2003, Piqueux2008 and \citeAWagstaff2008 focused their studies on the detection of water ice at high latitudes (at the South Pole and above 60°N respectively), we propose to extend their approach to the entire planet.
High-resolution imagery allows the detection of small deposits of water ice found at low latitudes [Vincendon, Forget\BCBL \BBA Mustard (\APACyear2010), Vincendon (\APACyear2015)], previously inaccessible to \citeAKieffer2001 and \citeABAPST2015 studies, and reduces uncertainty induced by sub-grid mixing. In addition, measuring ice temperatures reveals whether ice can melt or form brines and constrain the near-surface water content. These data are compared with water frost predictions made by the Mars Planetary Climate Model [<]PCM,¿Forget1999, Lange2023Model. This model, along with the processing of THEMIS data, is presented in section 2. The results on water frost spatio-temporal distribution, temperatures, and derived near-surface water vapor are described in section 3. Section 4 focuses on the discussion of these results, and the conclusions are summarized in 5.
2 Methods
2.1 THEMIS Dataset
This study uses coincident visible and thermal observations acquired by THEMIS. We recall here the description of the image processing at visible and infrared wavelengths provided by \citeALange2022a. The THEMIS visible camera has five filters with band centers located at 425 (band 1), 540 (band 2), 654 (band 3), 749 (band 4), and 860 nm (band 5) [Christensen \BOthers. (\APACyear2004)]. We use colorized images that are either conventional ”RGB” composite resulting from band 4 (or, if not available, band 3), band 2, and band 1 in the blue channel [Murray \BOthers. (\APACyear2016), Bennett \BOthers. (\APACyear2018)]; or ”R2B” images, a colorized product where of band 4 (red) and band 1 (blue) are combined using 0.65 band 1 + 0.35 band 4 to generate a simulated green band used for the RGB composite [Murray \BOthers. (\APACyear2016), Bennett \BOthers. (\APACyear2018)].
Surface temperatures are derived from THEMIS band 9 centered at 12.57 m because of its good signal-to-noise ratio and because it is low sensitivity to atmospheric effects [Fergason \BOthers. (\APACyear2006), Pilorget \BOthers. (\APACyear2013)]. The precision of the measurement is 0.5-1 K [Christensen \BOthers. (\APACyear2004)] with an absolute accuracy of 2.8 K at 180 K [Fergason \BOthers. (\APACyear2006)], a common temperature for water frost (see section 3.2). We use the Projected Brightness Temperature (PBT) product provided on the Planetary Data System (PDS) [P\BPBIR. Christensen (\APACyear2002)]. No atmospheric correction is made here. However, as shown in section 3.2, most of the images are taken between 6 a.m. and 9 a.m. and 4 p.m. and 8 p.m., when the contrast between atmospheric temperature and the surface is small.
THEMIS visible wavelength images are characterized by a footprint of 18 km wide on the ground (18 m resolution), smaller than the km wide swath of the infrared data. Therefore, infrared data are cropped to the extent of the overlapping visible wavelength data. Infrared images display a resolution of 100 m/pixel. Visible images are therefore ”degraded” by performing a bilinear interpolation of the visible image grid to the infrared image grid.
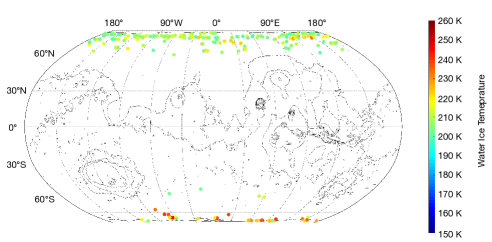
Data analyzed here have been acquired during the daytime, with a local time varying from 5 a.m. to 7 p.m., to have a clear image of the surface at visible wavelengths. We only analyze the visible images acquired concomitant to measurements at infrared wavelengths. Some image pairs are disqualified because of 1) calibration issues in both visible and infrared wavelengths, most likely due to the challenging illumination conditions, and 2) unclear surface exposure due to the presence of clouds/dust. The complete dataset, presented in Figure 1, represents 39,496 images.
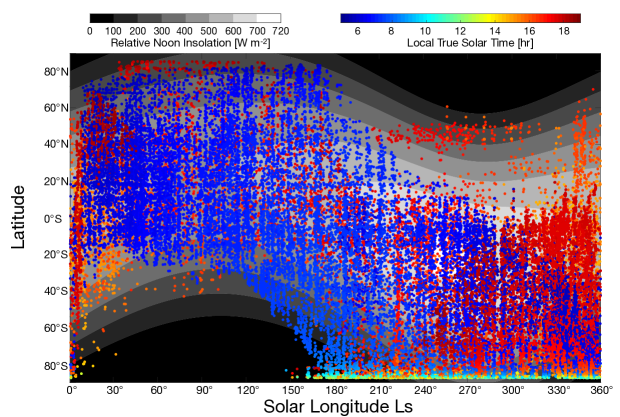
The dataset analyzed in this study presents some bias caused by operational, local weather, and illumination constraints (e.g., fewer images are taken in the northern latitudes during the second part of the Martian Year [MY] as the sky is dustier [Montabone \BOthers. (\APACyear2015)], challenging the observations of the surface). The dataset exhibits a strong asymmetry in the coverage of the Northern and Southern Hemispheres, thus making a comparison between the two hemispheres difficult. Also, few measurements are made during the autumn/winter at mid and high latitudes, preventing the study of condensation of water frost during this period.
2.2 Water Frost Identification
The identification of water frost is done in two steps, beginning with looking at visible images. Snow or glacier water ice is associated with a high albedo at visible wavelengths, with a spectral slope from blue to red, in contrast to the low albedo of the Martian bare surface [<]¿[and references therein]Putzig2005, Singh2016, Singh2018, Murchie2019, Flanner2021, Khuller2021albeo. For this reason, we similarly anticipate pure CO2 or H2O to appear as blue-white patches on the brown Martian surface. Hence, we first look at all the visible images and manually flag all the pixels that appear blue-white and which could be interpreted as frost. One of the key limits of this approach is that some thin frost layers might not appear blue-white on THEMIS images and would not be detected with our method. Here, we assume that water frost appears blue-white if its thickness is at least 20 micrometers. Such thickness is consistent with the work of \citeASvitek1990, who showed that the white surfaces appearing on Viking images are associated with such frost thicknesses, and with the laboratory work of \citeAYoldi2021, who showed that a thickness of 20 – 30 microns of water frost quintuples the reflectivity of the surface in the blue band and doubles it in the red band (see their Figure 7). We acknowledge that this empirical threshold limit should also depend on the size of the ice crystals, the dust content of the frost, and the emission angle of the observations, etc. [Pommerol \BOthers. (\APACyear2013)]. This might explain why our threshold is underestimated: As shown in section 3.1.1, according to the Mars PCM, frosts detected with THEMIS are mostly thicker than 100 m (with a few frosts in the 20 and 100 micron range).
Although frost/ice detection based on the bright blue-white color contrasting with the bare surface has been widely used in the past [<]e.g.,¿James1979, Schorghofer2006, CALVIN2015North, BAPST2015, Dundas2019gullies, Lange2022a, this technique has some important limitations worth mentioning. First, \citeAKhuller2021albeo have shown that the albedo of water snow/ice can be drastically reduced if it is contaminated by dust (e.g., less than 1% dust contamination). Hence, dusty frost could be missed with this approach because of the small contrast between this dirty ice and the bare ground. To mitigate this effect, we have stretched the visible images to enhance the color contrast and to help the detection of small patches of frost in relatively low-illuminated areas (e.g., pole-facing slope during the autumn). Second, as noted by \citeADundas2019gullies and \citeALange2022a, relatively blue lithic material can be misunderstood as frost with this approach. While most of the blue-white units we identified are confidently attributed to ice based on their sharp boundaries following topography, preferential slope orientation, or morphology, we leveraged the few uncertain detections by looking at summer images taken at the same locations to see if the blue-white patches were still present. Another possibility was to confirm the icy nature of these pixels by performing an analysis of the spectral properties with all THEMIS bands [<]for instance, as made by¿[with the High-Resolution Imaging Science Experiment dataset]Khuller2021ssice, but the large number of pixels analyzed here prevent a manual check of all the spectra. Finally, haze/clouds, which can also appear as blue-white on THEMIS visible images [<]see for instance¿McConnochie2010 sometimes induce false positive detections. However, in this case, these bright features appear to be independent of the surface topography, which enables their removal with confidence.
To flag pixels as frost, based on their color, we first apply an initial filter to isolate all pixels with a blue-white color. This method eliminates most of the non-frosted pixels. Next, ambiguous pixels (e.g., bright pixels on a slope exposed to sunlight that appear yellow-white) are eliminated manually. Finally, a last check is made between the raw image and the selected pixels to ensure that no frosted areas have been overlooked. However, we acknowledge that this may result in some frosted pixels being omitted.
At this step, 2,343 images (and nearly 9107 pixels) are flagged as images showing frost. The second step is to now distinguish between CO2 and H2O frost. As CO2 is the main component of the Martian atmosphere, the formation of CO2 frost is not diffusion limited. As such, CO2 frost is forming when the surface temperature reaches the temperature of condensation of CO2, [K], given by the Clapeyron law [James \BOthers. (\APACyear1992)]:
| (2) |
with the local CO2 partial pressure taken as 0.96 of the total surface pressure derived from the local topography and parameterized surface pressure observations [Withers (\APACyear2012)]. ranges from 130 K at the top of Olympus Mons to more than 153 K in Hellas basin [Piqueux \BOthers. (\APACyear2016)]. If CO2 ice is present on the surface, the temperature must be at . On the contrary, the formation of H2O frost is limited by diffusion and is controlled by the partial pressure of H2O at the surface and the near-surface atmosphere. Water frost can thus exhibit a surface temperature much higher than . Therefore, for each pixel flagged as frost, we compare its surface temperature given by the THEMIS infrared measurement with (Figure 2b). To account for the instrument noise and possible atmospheric contributions, we assign a 5 K tolerance on this criterion as in \citeALange2022a. In other words, a pixel is considered as water frost if its temperature is higher than + 5 K. In comparison, \citeAPilorget2013 used a 6 K margin, and \citeAKhuller2021albeo a 7 K margin. Using these tolerances yields a reduction of the number of water ice detections by 1.6% and 3.8% respectively. With this approach, we exclude water frost at very low temperatures that might be mixed with CO2 frost and thus consider only “pure” water frost (although dust might be incorporated). For this reason, frost/ice will now only refer to water frost/ice in the rest of this manuscript.
Occasionally, some temperature observations are associated with large uncertainties [<]e.g., all measurements above 170 K on the seasonal CO2 ice cap,¿Wagstaff2008. This overestimation is well-characterized and linked to the image calibration protocol that uses a reference image unsuitable at high latitude during winter / early spring [<]see a complete description of this issue in¿Wagstaff2008, and has been mitigated with the new calibration of PDS products since their work. Such images, where the CO2 ice cap is associated with unrealistic high temperatures (here taken as 160 K) are manually removed from our dataset.
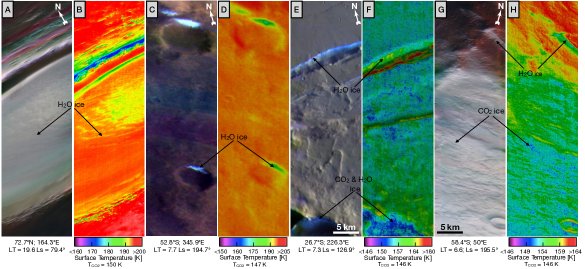
At the end of the processing, 2,006 images (and 5.3107 pixels) are found to be associated with water frost (e.g., Figure 2). The reader is referred to \citeAKhuller2021frost and \citeALange2022a for a mapping of CO2 frost with the THEMIS dataset. As a preliminary validation, we have checked that perennial water ice deposits (North Cap, Korolev crater, Lyot crater, etc.) are well identified by this method (e.g., Figures 2a, b). The good agreement between our detection method and the other datasets, as well as the PCM, allows us to be confident in the validity of our detection method (section 3).
2.3 The Mars Planetary Climate Model
Observational data are compared to the simulations from the Mars Planetary Climate Model, formally known as the LMD Mars Global Climate Model citeForget1999. In this study we use the version that models slope microclimates and simulates the condensation of CO2 and H2O on slopes [Lange, Forget, Dupont\BCBL \BOthers. (\APACyear2023)]. Surface properties (albedo, emissivity, thermal inertia) are set to the observations from TES [<]see Table 2 of ¿Lange2023Model. Seasonal dust opacity profiles are set to an average of the available observations of dust from MY 24, 25, 26, 28, 29, 30, and 31 outside the global dust storm period [Montabone \BOthers. (\APACyear2015)]. The representation of the water cycle, detailed in \citeANavarro2014 and \citeANaar2021, has been validated through comparison with TES data. A complete description of the surface energy budget, accounting for visible and infrared radiation, soil conduction, and sensible and latent heat fluxes can be found in \citeALange2023Model. The mass of H2O frost (kg m-2) is computed with:
| (3) |
where (kg m is the air density, (m s-1) is the wind velocity obtained by combining the large-scale (synoptic) wind near the surface with a wind gustiness induced by buoyancy [Colaïtis \BOthers. (\APACyear2013)], (kg/kg) is the mass mixing ratio of water vapor in the first layer of the model ( m), (kg/kg) is the saturation mass mixing ratio computed from the surface temperature (see Eq. (1) of [Pál \BOthers. (\APACyear2019)]). (unitless) is a moisture transfer coefficient given by [Colaïtis \BOthers. (\APACyear2013)]:
| (4) |
where (unitless) is a function of the Richardson number (unitless), (unitless) is the von Kármán constant set to 0.4; (m) is the aerodynamic roughness coefficient extracted from \citeAHebrard2012, (m) the moisture roughness length. amplifies the flux for an unstable atmosphere, while it reduces it for a stable atmosphere. Here, the stability of the atmosphere only depends on the thermal contrast between the atmosphere and the surface, and the instability induced by the difference of molar weight between H2O and CO2 [Ingersoll (\APACyear1970), Khuller \BBA Clow (\APACyear2024)] is not considered. represents the influence of molecular diffusion near the surface and reduces the flux of sublimation. Here, we assume that is equal to the thermal roughness length computed as a function of the near-surface flow parameters [<]Reynold, Prandlt numbers, etc., see appendix 5 of¿Colaitis2013.
3 Results
3.1 Distribution of Frost
3.1.1 Spatial Distribution
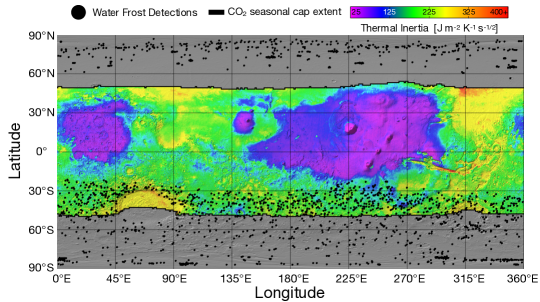
The spatial distribution of frost is presented in Figure 3. Water ice is detected down to 21.4°S, 48.4°N. 91% of the low-latitude detections (in the 45°N band) occur on pole-facing slopes, where water vapor preferentially condenses [Vincendon, Forget\BCBL \BBA Mustard (\APACyear2010), Lange, Forget, Dupont\BCBL \BOthers. (\APACyear2023)]. At higher latitudes, 64% of the detections are made on pole-facing slopes. In comparison, \citeACarrozzo2009 and \citeAVincendon2010water have detected water frost on pole-facing slopes down to 15°S and 13°S–32°N respectively using near-infrared data from OMEGA (Observatoire pour la Minéralogie, l’Eau, les Glaces et l’Activité) and CRISM (Compact Reconnaissance Imaging Spectrometer for Mars) onboard the Mars Reconnaissance Orbiter.
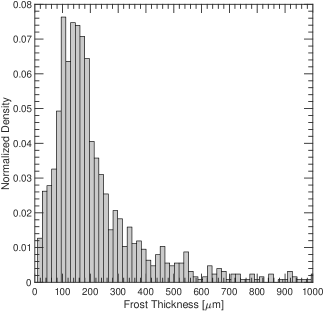
The difference in the latitudinal extent of the frost detected with THEMIS and OMEGA/CRISM can be explained by the intrinsic properties of each dataset and instrument. We have estimated the thickness of the frost detected with THEMIS on crater slopes between 50°S and 20°S using the PCM (Figure 4). THEMIS detects water ice with a median thickness of 180 m (minimum thickness estimated to near 18 m). Hence, our approach mainly detects thick frost layers (100 m thick), and our detection threshold estimated in section 2.2 may have been underestimated. In comparison, OMEGA and CRISM have an ice detection threshold of 2-5 m [Vincendon, Forget\BCBL \BBA Mustard (\APACyear2010), Vincendon (\APACyear2015)]. At latitudes 10°S–20°S, water ice should be thin [<]a few tens of microns, see Figure 12 of ¿Lange2023Model. Hence, THEMIS does not seem able to detect such thin ice at these low latitudes compared with OMEGA/CRISM.
Between 20° and 50° latitude, the spatial distribution of water frost is consistent with OMEGA/CRISM observations [Vincendon, Forget\BCBL \BBA Mustard (\APACyear2010)]. In the South, between 20°S and 30°S, two dry areas with no frost are found between 100°E and 160°E and 250°E and 360°E, one of which not observed by \citeAVincendon2010water. Most of the THEMIS observations obtained in this longitudinal band were acquired before Ls = 100°, where frost is expected to be very thin [<] 10 m thick according to models,¿Vincendon2010water, Lange2023Model and illumination low, especially on pole facing slopes (Figure 1). Hence, frost may be too thin to yield a detectable signature at visible wavelengths, preventing detection with our proposed method. For the 250°E–360°E band, two processes may explain the absence of frost. First, the 250°E–360°E area is characterized by smooth lava terrains with few slopes [Vincendon, Mustard\BCBL \BOthers. (\APACyear2010)], while water frost is only stable on steep pole-facing slopes between 20°S and 30°S [Vincendon, Forget\BCBL \BBA Mustard (\APACyear2010), Lange, Forget, Dupont\BCBL \BOthers. (\APACyear2023)]. Second, for the 300°E–360°E area, the absence of frost is a consequence of a drier atmosphere induced by a western jet on the eastern side of Tharsis [Joshi \BOthers. (\APACyear1994), Joshi \BOthers. (\APACyear1995), Vincendon, Forget\BCBL \BBA Mustard (\APACyear2010), Lange, Forget, Dupont\BCBL \BOthers. (\APACyear2023)]. Most of the deposits found between 20°S–30°S are located in the West of Hellas basin, where a southward wet flux of air converges [<]Figure 7 of¿Vincendon2010water, promoting the formation of water frost at this location. We also note that no frost detections are made within the Hellas basin. This is mostly due to a stationary wave induced by the strong topographic depression of Hellas, filling the basin with dry air and thus preventing the formation of frost [Vincendon, Forget\BCBL \BBA Mustard (\APACyear2010)]. Challenging conditions (for instance clouds [Langevin \BOthers. (\APACyear2007), Kahre \BOthers. (\APACyear2020)], suspended dust [Martin \BBA Zurek (\APACyear1993)], etc.) which prevent a clear view of the surface might also explain the absence of frost detections at this location with our method. For instance, \citeALangevin2007 have detected some water frost deposits in the South of the basin during spring with OMEGA/CRISM as they do not need a clear exposure of the surface to identify frost. In the North, only one detection is made below 50°N, but this is a consequence of the bias dataset used in this study and the sparse coverage of the Northern Hemisphere at mid-latitude during northern winter/spring (Figure 1). At high latitudes, in both hemispheres, no significant dry areas can be found.
3.1.2 Temporal Distribution
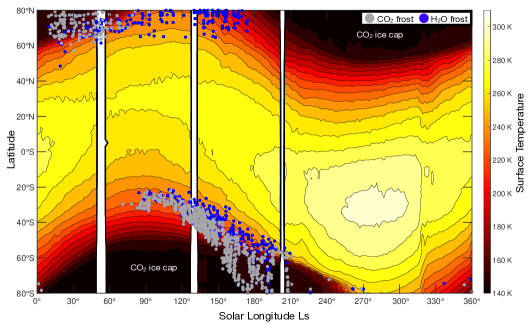
The temporal distribution of water frost is presented in Figure 5. For completeness, we also present CO2 ice frost detected with THEMIS data, i.e., pixels with a temperature lower than + 5 K. In the South, equatorward of 50°S, most of the water ice detections are made after the sublimation of the CO2 seasonal ice on pole-facing slopes. Water frost can survive 10–20° of Ls after the disappearance of CO2 ice. The same comparison is difficult to make in the North, due to the low number of detections. Summer water ice detections are made where perennial water ice is observed (water ice cap at the North Pole, Korolev crater, etc.).
BAPST2015 have exhibited a strong hemispheric asymmetry in the presence of water ice frost during autumn. They showed that widespread water ice deposits can be observed in the North during autumn (before Ls 270°), but none were detected in the South during southern autumn (before Ls 90°). We report here 27 occurrences (i.e., 1.3% of the dataset) of water frost detected during the autumn between 32°S and 23°S, mostly in the West of Hellas basin and at longitudes 200°E–250°E. All of these detections are made on pole-facing slopes. The same detections have been made by \citeAVincendon2010water. Yet these observations should not contradict \citeABAPST2015’s conclusions since 1) they are made on local sites with favorable thermal conditions (steep pole facing slopes) and 2) they take place at low latitudes, where \citeABAPST2015 were unable to observe ice/frost due to the resolution of TES, far from the CO2 seasonal ice cap where they noted this asymmetry.
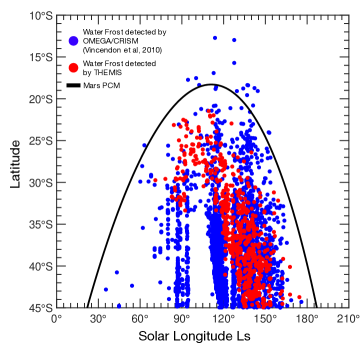
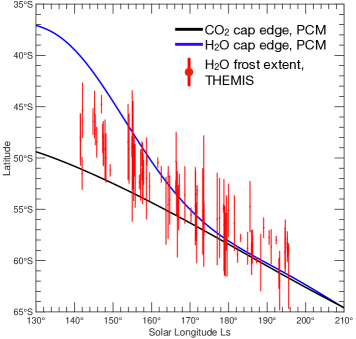
A focus on the water frost evolution at mid-latitudes in the South is presented in Figure 6. Again, this analysis is not performed in the North due to the bias in the distribution of the dataset. THEMIS and OMEGA/CRISM datasets have a similar temporal evolution during southern spring (Figure 6). Few detections have been made with THEMIS during the condensation of H2O (Ls 120°) mostly because of the sparse measurements made at this period (Figure 1). Also, at that time, pole-facing slopes are shadowed, preventing a clear exposure of the surface and thus detection of water frost. Finally, ice deposits are expected to be thin during this period (nearly 1-2 m). Therefore, this low thickness might reduce the albedo contrast between the frost and the defrosted surface, challenging the detection of frost based on our method. Vincendon et al. (2010) also noted that OMEGA/CRISM could only detect frost with a thickness larger than a few microns, possibly explaining the absence of frost detections at Ls 80°. The condensation and sublimation timing of H2O frost deposits detected with THEMIS is consistent with the PCM prediction [Lange, Forget, Dupont\BCBL \BOthers. (\APACyear2023)], although the PCM underestimates the sublimation of H2O by 10° of Ls. It is not clear if the earlier condensation of H2O frost in the PCM is due to a systematic error in the model or a bias due to the sparse number of detections made at that time.
3.1.3 Retreat of the Water Frost in the Southern Hemisphere
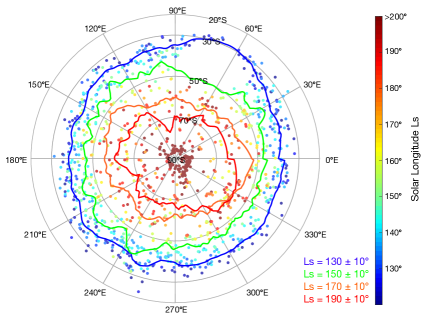
The seasonal evolution of the water frost boundary in the Southern Hemisphere is presented in Figure 7. At Ls130° the longitudinal extent of water frost is almost homogeneous (mean latitude of 38°S 0.9° at 1-), except in the west of Hellas which promotes the accumulation of frost as explained in section 3.1.1. At Ls150° water frost extends to 45°S 1.9° at at 1-. In the Hellas area, water frost is not present as a consequence of the dryer air in this region (see section 3.1.1) and observational bias. At Ls170° water frost extends to 58°S 2.9° at at 1-, except in Hellas where no frost is observed again. Finally, at Ls190°, water extends to 65°S 2.9° at at 1-. The high variability in the latitudinal extent for Ls = 170° and 190° is mostly due to the small number of detections for these Ls (twice less than the number of detections at Ls130°, 150°). For all solar longitudes, the latitudinal variability also results from the variability in surface properties (albedo, thermal inertia).
For both Ls170° and Ls190°, the latitudinal extent of the H2O frosts matches the extent of the seasonal CO2 ice cap [Piqueux \BOthers. (\APACyear2015)]. The presence of H2O ice deposits close to the CO2 ice cap edge can be explained by either the presence of small impurities of H2O ice within the CO2 ice cap or by a water ice annulus, which persists after the sublimation of the seasonal CO2 ice cap, as in the Northern Hemisphere [<]e.g.,¿Kieffer2001, Bibring2006, Wagstaff2008, Appr2011. Such a possibility is discussed in section 4.2.
3.2 Frost Temperature
The distribution of temperature of water ice measured by THEMIS is presented in Figure 8. The mean temperature of water ice measured is 170.9 17 K at 1-, with a maximum value of 253.3 K. The two peaks at 160 K and 200 K in the distribution of temperatures measured by THEMIS reflect the difference in the nature of the ices observed: The cold peak corresponds to seasonal frosts observed in the morning, after the disappearance of the CO2 ice, and the hotter peak to warm frosts observed at perennial deposit locations in summer (or to some seasonal frosts observed just before they disappear, at the end of the day).
In comparison, \citeAWagstaff2008 and \citeABAPST2015 found temperatures between 165 K and 210 K for the water ice deposits in the Northern Hemisphere and up to 240 K for the Southern Hemisphere [Bapst \BOthers. (\APACyear2015)]. The low ice temperature measured in this study is mostly an effect of the local time of the measurements: 75% of the water detections are made between 5 and 9 a.m. and 15% between 5 and 9 p.m. The last detections made during the rest of the day are confined to the South Pole. To quantify the bias induced by the local time, we have compared the measured temperature with the distribution of temperature predicted by the PCM for a complete MY (Figure 8). The water ice thermal properties in the model are a broadband albedo of 0.33, thermal inertia of 800 J m-2 K-1 s1/2, and an emissivity of 1 [Lange, Forget, Dupont\BCBL \BOthers. (\APACyear2023)]. For this computation, we extracted the temperature predicted in the PCM for a 30° pole-facing slope, equatorward-facing slope, and flat surface only if the model predicts a frost thickness higher than 1 m for these terrains. The PCM predicts water ice temperatures that are on average 180 21 K at 1-, with a maximum temperature of 264.3 K. Hence, frost temperature measured by THEMIS seems to be lower by 10 K compared to the model. In both cases no melting of pure water ice is expected as temperatures are below the triple point of water (273.15 K). A complete discussion on a possible melting is given in section 4.3.
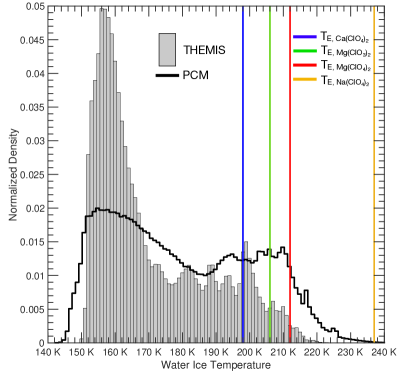
While pure water ice melting is incompatible with our results, a brine solution could form in the thermal conditions measured by THEMIS. Indeed, the presence of salts in the water ice mixture can reduce the temperature needed to melt to T = 198 K for Ca-perchlorate, T = 206 K for Mg-chlorate, T = 212 K for Mg-perchlorate, and T = 237 K for Na-perchlorate [Chevrier \BOthers. (\APACyear2022)]. As the widespread presence of salts and perchlorates on the surface of Mars has been demonstrated [Clark (\APACyear1981), Osterloo \BOthers. (\APACyear2008), Hecht \BOthers. (\APACyear2009), Osterloo \BOthers. (\APACyear2010), Glavin \BOthers. (\APACyear2013)], we can assume that these salts are present where we detect water ice. As shown by Figure 8, some water ice deposits have a temperature higher than eutectic temperatures of Ca-perchlorate (267 detections, e.g. Figures 2b, d), Mg-(per)chlorate (respectively 168 and 106 detections), and Na-perchlorate but to a less extent (7 detections). Their location, along with the maximum temperature of these ice deposits, are shown in Figure 9.
Except for 4 images (e.g., Figure 2d), all warm frosts are detected above 60° latitude during summer (e.g., Figure 2b). For each of these sites, we have investigated THEMIS, High-Resolution Imaging Science Experiment [<]HiRISE,¿McEwen2007 and Context Camera [<]CTX,¿Malin2007 data acquired during summer to search for possible indications of fluid flow where frost would have melted into brines. Yet, we do not find evidence of such flow where THEMIS identified hot frosts, even where \citeAKereszturi2010 and \citeAMohlmann2010 have identified flow-like phenomena on dark dune spots at high latitudes that they attributed to brines. Some dark streak features are observed on some crater slopes (e.g., South, Schmidt craters) but can be explained by other environmental factors such as wind for instance. We speculate that the lack of evidence of brine flow may be due to 1) the actual absence of brines and 2) if a brine does form, the amount of liquid may not be large enough to destabilize the surface material (either through lack of salt or immediate evaporation of the liquid). As water frosts are expected to be thin (from tens of micrometers to a few mm), it is hard to imagine that the brines would form a large flow, but should instead form a few droplets at the surface, which would percolate through the porous regolith.
If these ices were to form a brine, their stability would be very limited. As demonstrated by \citeARiveraValentn2020 and \citeAChevrier2022, brines would be stable for only a few hours a year at mid and high latitudes. Although their model does not consider the thermal effect of slopes, PCM simulations of the slope microclimates show that the temperature of water ice exceeds the eutectic temperature TE for only a few hours a day and on only a few sols (ranging from 1 to 10 sols). It should be noted that our criterion for stability is solely based on surface temperature, although it also depends on the water activity. A complete study of the stability of brines coupling a complete thermodynamic model and our GCM simulating slope microclimates is left for future work.
3.3 Near-surface Water Vapor Content
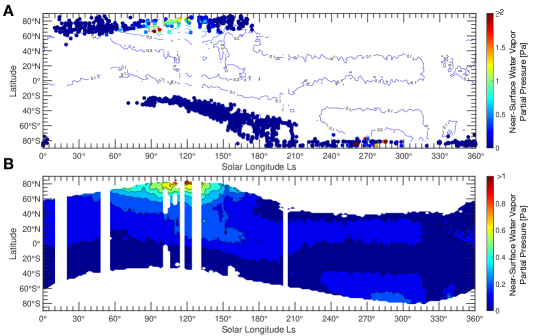
Here we present the near-surface water vapor measured by THEMIS. Once has been measured, we derive the near-surface water vapor with Eq. 1. Results are presented in Figure 10a. The mean partial pressure derived is 0.05 0.2 Pa at 1-. The highest partial pressures are found at the poles during summer when perennial water ice caps sublime. Otherwise, most of our near-surface water vapor values are low, mostly because measurements are made during the early stage of the ice sublimation, early in the morning or late afternoon, when ice temperatures are low.
We have nevertheless checked the consistency of our results with TES measurements of water vapor column-abundance [M\BPBID. Smith (\APACyear2002)]. These measurements first need to be interpolated from column-abundance to near-surface. However, such an operation is not easy as the vertical structure of the water vapor in the lowest layer of the atmosphere is not very well constrained [Tamppari \BBA Lemmon (\APACyear2020), Leung \BOthers. (\APACyear2024)]. We used here the data from \citeAKhuller2021frost) who derived near-surface water vapor content from TES data assuming a well-mixed, hydrostatic, and isothermal atmosphere up to the H2O condensation level [<]as done in¿Schorghofer2005. Values obtained are presented in Figure 10b. With this approach, the average surface water vapor for the Northern Hemisphere is 0.17 Pa and 0.09 Pa for the South [Schorghofer \BBA Aharonson (\APACyear2005)]. In comparison, the mean water vapor pressure derived from THEMIS temperature measurements is 0.12 Pa in the North and 0.0057 Pa in the South. Again, these measurements might be lower because of their time of acquisition (early morning / late afternoon) in comparison with the time of TES measurements (2 p.m., when the atmospheric water content is at maximum). Yet, the seasonal evolution of water vapor between TES and THEMIS is consistent: The maximum amount of water vapor is at the poles during the summer, and the atmosphere surrounding the seasonal CO2 ice cap is dry. For very specific locations (e.g., above 70°N, 80° Ls 110°, THEMIS measurements show that the near-surface is enriched with water vapor. Indeed, at this time of the year, the sublimation of massive water ice deposits at the surface is supplying the dry atmosphere with water vapor. However, the sparse number of such defections prevents any generalization on a near-surface enrichment of water vapor.
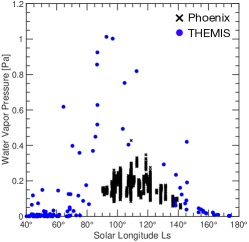
We also present for completeness the comparison between THEMIS and Phoenix humidity measurements [Fischer \BOthers. (\APACyear2019)] in Figure 11. As THEMIS does not specifically cover the Phoenix site (68.2°N, 234.3°E), we compare their measurements with those taken by THEMIS between 65°N and 75°N, without any longitude filter, assuming that it is representative of the Phoenix site. As THEMIS acquisitions were made between 6 a.m. and 8 a.m. and 6 p.m. and 8 p.m., we have isolated these data in the Phoenix dataset. Both datasets mostly overlap during the second half of the Phoenix mission, between Ls = 125° and Ls = 145°. In both cases, water vapor measurements are consistent, with values between 0.1 and 0.3 Pa, suggesting that our vapor pressure measurements are reliable. However, observational limitations (not always the same site observed, measurements procured at particular local times only when frost is present), prevent us from extending the intercomparison.
4 Discussion
4.1 Perennial v.s. Seasonal v.s. Diurnal water ice
Water ice deposits detected in this study could be either perennial, seasonal, or diurnal ice. Frosts detected at high latitudes during summer in the North are always found where massive ice deposits are observed and are thus considered perennial deposits (e.g., Figures 2a, b). At lower latitudes, frosts detected with THEMIS can be either diurnal or seasonal.
During the night, as the surface cools, a thin layer of water frost can form, which then sublimes during the morning. Phoenix’s in-situ imagery revealed such diurnal frost (estimated to be a few micrometers thick, according to our model), even though the ice signature on the surface was very weak [<]see Figure 3b of¿Smith2009. \citeASvitek1990 have also detected diurnal water frost during spring at the Viking 2 landing site, noting that the brighter areas were linked to the thickest frosts. Finally, \citeALandis2007 detected frost at the Opportunity rover landing sites, but it was located on the deck of the rover and not on the surface. On the other hand, at the Curiosity landing site (4.5°S), diurnal water frost was assumed to be present given the environmental conditions of temperature and water vapor [Martínez \BOthers. (\APACyear2016)] but was not formally detected with cameras and spectrometers [Schröder \BOthers. (\APACyear2015)].
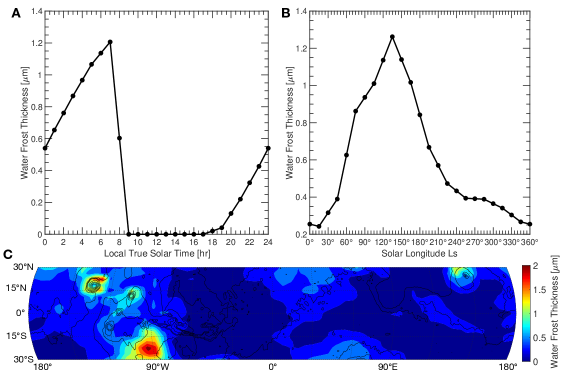
The Mars PCM predicts the formation of this diurnal frost during the night, quickly disappearing in the early morning(Figure 12a) during most of the year. For mid-to-high latitudes (above 45° latitude), the diurnal thickness of water frost is at a maximum m during the early spring and late autumn while being 1–2 m thick during summer. At low latitudes (30° latitude), frost is at a maximum during northern summer, when the atmosphere is enriched in H2O due to the sublimation of the northern perennial water ice cap [M\BPBID. Smith (\APACyear2002)] but is no thicker than 1-2 m (Figure 12b). The diurnal water frost thickness during northern summer (Ls = 120°) predicted by the PCM between latitude 30°N and 30°S is shown in Figure 12c. In comparison, diurnal CO2 frost is expected to be 10–100 m thick, i.e., ten times larger than water ice [Piqueux \BOthers. (\APACyear2016)]. We acknowledge that the H2O frost thicknesses computed by the PCM are upper limit since the model does not account for adsorption/desorption and exchange with the regolith. As shown by \citeASteele2017 and \citeASavijrvi2018, adsorption during the late afternoon should deplete the near-surface water vapor content, reducing the thickness of frost formed at night to less than one m.
Could THEMIS detect such diurnal frost from orbit? It seems very unlikely for two reasons. First, our method mostly detects thick frosts, at least 100 m thick (Figure 4, section 3.1.1), i.e., ten times more thick than what is predicted for diurnal water frost. Therefore, it is improbable that such frost produces an albedo contrast with the bare surface strong enough to be detected with our method. Second, almost all of the frosts we have detected outside the poles are located within the stability domain of seasonal frost (Figure 5) and not outside of it, suggesting again that they are seasonal rather than diurnal. Hence, although the frosts detected in this study are mostly observed during the early morning and might at first glance be considered diurnal frosts, we conclude that they are actually seasonal frosts.
One area of interest to detect diurnal frost with THEMIS would be at the top of volcanoes, where the contrast between atmospheric and surface temperatures is strong [Fan \BOthers. (\APACyear2023)], potentially creating a significant amount of frost every night (e.g., Figure 12). We have looked at the calderas of volcanoes in the 40° latitude band and were unable to find any clear evidence of frost deposits. Indeed, the main bluish patterns we observed did not seem to correlate with the topography and could correspond either to surface-fogs, or clouds in the atmosphere [<]e.g., ¿Inada2007, McConnochie2010.
4.2 On the Existence of a Water Annulus in the South
The presence of H2O ice deposits close to the CO2 ice cap edge (Figures 5, 7) can be explained by either small impurities of H2O ice within the CO2 ice cap, left as a lag when the CO2 sublimes or a water ice annulus created by the sublimation-recondensation process proposed by \citeAHouben1997. The latter has been widely observed in the North [Kieffer \BBA Titus (\APACyear2001), Bibring \BOthers. (\APACyear2006), Wagstaff \BOthers. (\APACyear2008), Appéré \BOthers. (\APACyear2011)]. In the South, its existence is less certain. \citeATitus2005 proposed the detection of an annulus at 85°S, and \citeABAPST2015 suggested, using TES data, the existence of an annulus in the Southern Hemisphere during spring at 45–60°S. However, \citeABAPST2015 acknowledged that their detection of a bright annulus might be due to the interpolation of their data or sub-grid pixel mixing and that high resolution thermal and visible data were needed to conclude the existence of such annulus. \citeALangevin2007, using OMEGA, did not observe large-scale expanses of water frost at the edge of the CO2 cap but rather local signatures of water ice in the seasonal cap, considered as impurities. The few signatures of H2O ice detected with OMEGA in the Southern Hemisphere at Ls 190° have either been interpreted as clouds or as frost confined in the South of Hellas \citeALangevin2007.
To test the existence of such an annulus, we have isolated the 441 detections made in the Southern Hemisphere during the receding phase of the seasonal CO2 cap, i.e. at latitudes 50°S and 90° Ls 270°, and discriminate the nature of these deposits between H2O ice impurities within the CO2 cap and bright deposits close to the seasonal cap that could be interpreted as an annulus. Among these 441 water ice detections, 230 were made uniquely on pole-facing slopes and not on flat terrains, more than 1–2° latitude from the CO2 ice cap. 112 detections show isolated water ice pixels within the CO2 cap, which can either be attributed to impurities or have been detected on equatorward-facing slopes where CO2 ice is barely stable. Other detections are large expanses of water ice ( 0.2° of latitudinal extent) close to the CO2 cap, which could be interpreted as an annulus or frost deposits (e.g., Figures 2 g-h). For each of these frost deposits, we measured their extent and reported them in Figure 13.
Contrary to \citeALangevin2007, and in agreement with \citeABAPST2015, we detect water ice during the first part of the sublimation of the seasonal cap (Ls 190°) (e.g., Figures 2c-d). These ice deposits have a small extent, on average 0.9° 1.3° at 1- of latitude, whereas the Northern annulus has an extent ranging from 5 to 10° [Kieffer \BBA Titus (\APACyear2001), Bibring \BOthers. (\APACyear2006), Wagstaff \BOthers. (\APACyear2008), Appéré \BOthers. (\APACyear2011)]. This asymmetry is mostly explained by the asymmetry in atmospheric humidity between the two hemispheres. During winter and early spring, water ice is protected from sublimation by the cold trap formed by CO2 ice. When the CO2 ice disappears, the water ice is subjected to violent heating [Costard \BOthers. (\APACyear2002), Schorghofer (\APACyear2020)], which causes it to disappear very quickly in a dry atmosphere, preventing the establishment of an extensive, stable annulus over time in the South. In comparison, in the North, the higher humidity stabilizes frost at the surface, preventing its rapid disappearance.
Can we confidently claim the existence of an annulus in the Southern Hemisphere? Water ices detected at the edge of the cap have an average temperature of 158.8 4.8 K, i.e., around 10 K higher than the condensation temperature of CO2. But, as noted by \citeAWagstaff2008, THEMIS observations at high latitudes can lead to measured CO2 temperatures of more than 170 K. As stated in section 2.2, we have manually eliminated these images and kept only those whose temperature is of the order of T 5 K where CO2 is expected according to other observations [<]e.g.,¿Piqueux2015 or the PCM. However, it still appears that the thermal contrast between CO2 and H2O ice is not as strong as that measured by \citeAWagstaff2008 (around 20 to 30 K). It is therefore possible that the low-temperature water ice is actually CO2 frost. Thus, we cannot conclude whether an annulus of water ice exists in the Southern Hemisphere during spring.
4.3 Inhibiting Ice Melt by the Release of Latent Heat
Section 3.2 has shown that neither ice temperatures measured by THEMIS, nor modeled by the PCM reach the melting point of 273.15 K. \citeAIngersoll1970 has shown that the cooling induced by the sublimation of ice was strong enough on Mars to prevent any melting. His computations were updated by \citeASchorghofer2020, who also showed that ice temperature never reached 273.15 K. In both of their models, the sublimation is only driven by the gradient of density between the CO2 atmosphere and the lighter H2O vapor at the surface, with an isothermal atmosphere. However, the surface and atmospheric temperatures are very different on Mars, leading to strong convection in the near-surface during daytime [Petrosyan \BOthers. (\APACyear2011)], which should regulate the sublimation of water ice. Our model (Eq. 3) accounts for this convection and the sublimation driven by wind. The effect of the gradient of density at the surface is, however, not considered in our model, and the sublimation rates predicted are thus lower limits.
We have tested whether our model predicts the melting of pure water ice in an ideal case. To do so, we ran 1D simulations of 30° south-facing slopes at 30° S. The albedo of the ice is set to 0.35 and its thermal inertia is set to 150 J m-2 K-1 s1/2 to maximize diurnal variation and the possibility of reaching the melting temperature of water. Simulations are run at Ls = 251°, at the perihelion. Surface pressure is set to 610 Pa and the opacity of the atmosphere to 0.2. The near-surface water vapor content is fixed at 10 precipitable microns, as observed by TES [M\BPBID. Smith (\APACyear2002)]. We imposed an infinite water ice reservoir at the surface to prevent the ice from disappearing entirely before it reached the melting point and ran simulations with and without the latent heat in the surface energy budget. Results obtained after 5 days of simulations, when convergence is achieved, are presented in Figure 14.
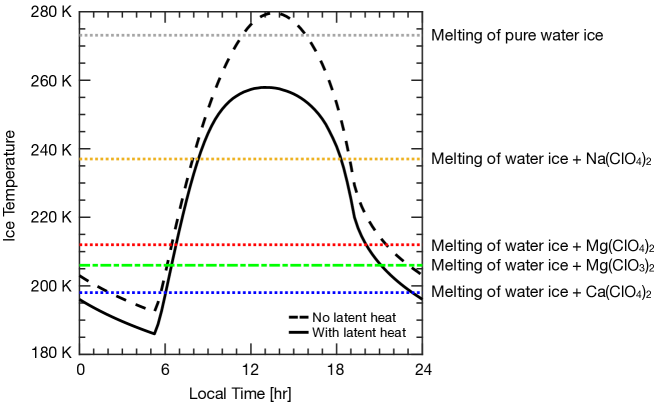
In the simulation without the latent heat, the ice temperature reaches 280K and ice can melt. With the latent heat, the maximum temperature falls to 260 K, and ice cannot melt. We have tested several input parameters (pressure going from 610 to 2000 Pa, opacity from 0 to 1, latitudes from 60°S to 0°), and conclusions remain unchanged. Hence, our experience also suggests that melting cannot occur on present-day Mars, as suggested by \citeAIngersoll1970 and \citeASchorghofer2020 because of the cooling by latent heat. Our conclusions are reinforced by: 1) the neglect of the effect of the density gradient between the surface and the atmosphere, which should amplify the sublimation flux and thus cool the ice; 2) the low thermal inertia used in our simulations that maximizes the amplitude of the diurnal cycle, whereas snow could compact and form pure ice with a higher inertia and thus reduce the maximum temperature expected; and 3) the prescription of an infinite water reservoir (this would only apply to perennial ice at the pole). Because frosts at mid-latitudes are thin, they would disappear completely before reaching high temperatures. Therefore, even in an idealized case, seasonal/perennial water ice cannot melt according to our model. Thus, the water frosts detected with THEMIS are unlikely to melt. However, even with the latent heat cooling, eutectic temperatures of Ca-perchlorate, Mg-(per)chlorate, and Na-perchlorate are still reached. Hence, the formation of brines is not inhibited with this mechanism.
Note that our experiment just shows that pure water ice cannot melt on present day Mars. On the other hand, \citeAClow1987 and \citeAWilliams2008 have shown that taking into account the presence of dust within the water ice (i.e., dirty snowpack model), a solid-state greenhouse effect occurs, which can lead to ice melting.
4.4 Effect of Frost on Subsurface Ice Stability
Massive quantities of ice have been discovered at high latitudes (above 55° of latitude) by the Mars Odyssey Neutron Spectrometer (MONS) neutron spectrometers [Boynton \BOthers. (\APACyear2002), Feldman \BOthers. (\APACyear2002), Diez \BOthers. (\APACyear2008)]. The widely accepted theory to explain their geographical distribution and depth is that this ice is in equilibrium with near-surface water vapor [Mellon \BBA Jakosky (\APACyear1993), Mellon \BOthers. (\APACyear2004), Schorghofer \BBA Aharonson (\APACyear2005)]. Following their approach, subsurface ice is stable at a depth z if:
| (5) |
where overbars indicate time-averages over a complete MY, (Pa) is the vapor pressure at the surface, (K), is the surface temperature, (Pa) is the saturation vapor pressure that is a function of the soil temperature (K) [Murphy \BBA Koop (\APACyear2005)]. During the night and during winter, the surface is saturated. To account for this effect, \citeAMellon2004 and \citeASchorghofer2005 compute as:
| (6) |
where (Pa) is the near-surface water vapor content in the atmosphere, derived from observations or models.
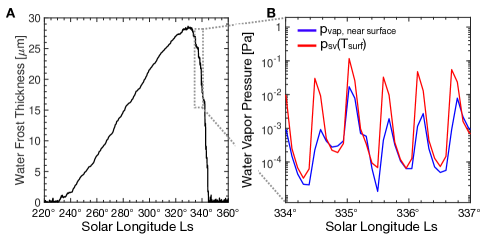
However, the discovery of mid-latitude ice via ice-excavating impact craters [Byrne \BOthers. (\APACyear2009), Dundas, Mellon\BCBL \BOthers. (\APACyear2021), Dundas \BOthers. (\APACyear2023)] has shown that the water vapor exchange theory does not explain the presence of this ice so low in latitude with the current atmospheric humidity. Models need to double/triple the humidity to explain the stability of subsurface ice at such low latitudes [Mellon \BOthers. (\APACyear2004), Lange, Forget, Vincendon\BCBL \BOthers. (\APACyear2023)], suggesting that models are either underestimating near-surface humidity or that this ice is currently unstable, very slowly sublimating towards the equilibrium depth. The same problem arises for permafrost in Antarctica’s dry valleys, where models predict a too-high sublimation rate of subsurface ice compared to observations [<]see a review in ¿Fisher2016. \citeAHagedorn2007 and \citeAMcKay2008 have shown that snow/frost on the surface could stabilize the subsurface ice by reducing the humidity gradient between the surface and the soil, inhibiting the sublimation loss from subsurface ice. \citeABAPST2015 suggested that this effect might help solve the discrepancy in the distribution of subsurface ice between the models and the observations. In theory, the effect of surface frost is partially considered with Eq. 6. However, this equation does not consider the case when a hot frost is sublimating, and one has: , i.e. when frost sublimation replenishes the atmosphere with water vapor (e.g., section 3.3). In this case, Eq. 6 underestimates the flux of water vapor coming from the surface. For an atmosphere with a water pressure of 0.2 Pa (typical of spring at mid-latitudes, Figure 10), this effect becomes apparent as soon as 200 K, a range of temperatures measured by THEMIS (Figure 8). GCM simulations show that this effect is mostly significant during the sublimation of seasonal/diurnal water ice (e.g., Figure 15) when hot frost acts as a significant source of water vapor in a dry atmosphere.
To quantify the effect of water frost on the stability of subsurface ice, we have changed the computation of the boundary condition given by Eq. 6 with:
| (7) |
We have chosen 10-7 m as the tolerance to avoid any effect of numerical noise. With this new boundary condition, we found that the mean annual humidity is higher by 20% between latitude 40°N and 60°N and similarly in the South, far from the +200% needed to model the same subsurface ice distribution as observed. In terms of depth, this means a change of mm/cm. This effect is thus not sufficient to explain the discrepancy between the ice-stability models based on Eq. 5 and observations [Lange, Forget, Vincendon\BCBL \BOthers. (\APACyear2023)].
Williams2015 have also studied the effect of surface frost on subsurface ice stability using a different approach. They have modeled the formation of subsurface ice solving the complete water vapor diffusion in the soil and found that frost has a significant impact on the depth of the stable ice table at the Viking 2 location (48°N). We cannot say whether the result comes directly from the effect of the frost (on the surface) or from their model (the frost then being transported to the subsurface). We are currently carrying out an intercomparison study between Eq. 5–based models and full diffusion models to better understand this difference.
4.5 Correlation Between Ice Detection and Gullies
Gullies are geomorphological surface features observed on Martian slopes at mid and high latitudes and are composed of an alcove, a channel, and a depositional apron [Malin \BBA Edgett (\APACyear2000)]. Because of their similarity to small terrestrial alluvial fans, gullies are particularly studied in the community to determine if they are evidence of liquid water flow on Mars [<]e.g.,¿Costard2002, Christensen2003gullies or are instead formed by dry processes involving CO2 or water ices [<]see¿[for a complete review]Diniega2021, Dundas2021. To better constrain the mechanism that triggers gullies, \citeAVincendon2015, Dundas2019gullies, Khuller2021frost have correlated the distribution of gullies (active or not) with the presence or absence of frost. \citeAVincendon2015 showed that 65.7% of active gullies between 20°S and 50°S were covered by CO2 frost during part of the year and 81.6% by water frost. \citeAKhuller2021frost showed that 47% of their CO2 ice detections overlapped with the gullies surveyed in \citeAHarrison2015 and 73% with only active gullies.
We also compare the correlation between water and CO2 ice presented in this study with gully sites. To do so, we first isolated overlapping gully sites identified by \citeAHarrison2015 and \citeADundas2019gullies and THEMIS observations, which were acquired in late winter / early spring. Hence, gully sites that were not observed with THEMIS or observed during the summer are therefore removed). A frost detection correlates a gully site if the THEMIS image showing frost overlaps the gully site; high-resolution monitoring has not been carried out. We found that 50% of all gully sites correlate with images showing water ice and 37% with CO2 ice. If we consider only active gullies, then 55% of all gully sites correlate with water frost detections and 43% with CO2 frost. More specifically in the South, where our dataset is the largest, 59% of active gullies sites correlate with water ice detection with THEMIS, 46% with CO2 ice.
However, although there is a stronger correlation between water frost detections and active gully locations, the temporality of gully activity shows that CO2 seems more responsible for their formation. Indeed, \citeAVincendon2015, using a high temporal and spatial resolution study, showed that the majority of gullies were active when CO2 was present and not when the CO2 had disappeared and only water ice remained. \citeADundas2019gullies proposed a similar argument, although the composition of the frost could not be constrained. So, despite a higher correlation between active sites and the presence of water frost during the year, the temporality of gully activity seems to show a predominant role for CO2 ice and not water ice. However, our dataset does not allow us to confirm this assertion: the number of detections of CO2 and water ice in our study is about 6 times lower than that of \citeAVincendon2010water and \citeAVincendon2015 and more temporally constricted for CO2 [<]by 5-10° of Ls, linked to a lower number of acquisitions at latitudes 30°-50°S in spring, Figure 1 in this article, Figure 2 in¿Lange2022a, which does not allow us to establish reliable correlations.
5 Conclusions
The objectives of this paper are to propose new detection of water ice on Mars using THEMIS images, derive their temperature, and propose a unique dataset of near-surface water vapor. The main conclusions of this investigation are:
-
1.
Cross-analysis of the pixels that appear bright blue-white in visible THEMIS images with infrared temperature measurements allows us to determine whether the ice is composed of CO2 or H2O (Figure 2).
- 2.
-
3.
The evolution of water-ice deposits through the year at mid-latitude in the South is consistent with OMEGA/CRISM observations from \citeAVincendon2010water and the Mars PCM (Figure 6).
-
4.
Like \citeAVincendon2010water, and contrary to \citeABAPST2015, we have been able to detect water ice in the Southern Hemisphere during autumn (Figure 6). Yet, these detections are only on pole-facing slopes at low latitudes, where \citeABAPST2015 could not survey because of the resolution of TES.
- 5.
-
6.
Near-surface vapor pressures derived from ice temperatures measured by THEMIS are lower than expected based on TES data, but this difference is mostly due to the difference in acquisition local times, thus biasing the comparison (Figure 10). A similar bias occurs when comparing THEMIS to Phoenix measurements (Figure 11).
-
7.
Water ice frosts detected in this study are most likely related to seasonal ice rather than diurnal ice, which may be too thin to be detected (Figure 12).
-
8.
We found water ice at the edge of the southern seasonal CO2 ice cap during its recession. However, We cannot conclude whether there is or is not an annulus present given the small thermal contrast between water ice at the edges of the seasonal cap and the CO2 ice cap itself (Figure 13).
-
9.
Melting of pure water ice is impossible on present-day Mars because of the sublimation cooling according to the PCM (Figure 14). However, this conclusion does not apply to dusty ice, where solid-state greenhouse effect can enable melting.
-
10.
Diurnal and seasonal water frost help to stabilize the subsurface ice by reducing the humidity gradient and acting as a source of vapor when frost sublimes. Yet, this effect is not sufficient to explain the stability of subsurface ice at mid-latitudes as revealed by impact craters excavating ice (Figure 15).
-
11.
55% of water frost detections occur at the location of active gully sites. However, the timing of their activity suggested that they are related to CO2 sublimation rather than H2O sublimation [Vincendon (\APACyear2015), Dundas \BOthers. (\APACyear2019)].
To better constrain exchanges between the surface and the atmosphere, future work could leverage additional THEMIS bands to spectrally characterize the properties of these ices and constrain their dust content, as for instance performed with HiRISE data \citeAKhuller2021albeo.
Open Research
The Mars PCM used in this work can be downloaded with documentation at https://svn.lmd.jussieu.fr/Planeto/trunk/LMDZ.MARS/. More information and documentation are available at http://www-planets.lmd.jussieu.fr. THEMIS visible and infrared images can be retrieved from the Planetary Data System (PDS) [P. Christensen (\APACyear2002), P\BPBIR. Christensen (\APACyear2002)]. MOLA topography map can be retrieved from the PDS [D. Smith \BOthers. (\APACyear1999)]. Data files for figures used in this analysis are available in a public repository, see \citeALange2024THEMIS_data.
Acknowledgements.
This project has received funding from the European Research Council (ERC) under the European Union’s Horizon 2020 research and innovation program (grant agreement No 835275, project ”Mars Through Time”). Mars PCM simulations were done thanks to the High-Performance Computing (HPC) resources of Centre Informatique National de l’Enseignement Supérieur (CINES) under the allocation n°A0100110391 made by Grand Equipement National de Calcul Intensif (GENCI). Part of this work was performed at the Jet Propulsion Laboratory, California Institute of Technology under a contract with NASA (80NM0018-D0004). US Government support is acknowledged. Copyright 2024. All rights reserved.References
- Appéré \BOthers. (\APACyear2011) \APACinsertmetastarAppr2011{APACrefauthors}Appéré, T., Schmitt, B., Langevin, Y., Douté, S., Pommerol, A., Forget, F.\BDBLBibring, J\BHBIP. \APACrefYearMonthDay2011. \BBOQ\APACrefatitleWinter and spring evolution of northern seasonal deposits on Mars from OMEGA on Mars Express Winter and spring evolution of northern seasonal deposits on Mars from OMEGA on Mars Express.\BBCQ \APACjournalVolNumPagesJournal of Geophysical Research116E5. {APACrefDOI} 10.1029/2010je003762 \PrintBackRefs\CurrentBib
- Bapst \BOthers. (\APACyear2015) \APACinsertmetastarBAPST2015{APACrefauthors}Bapst, J., Bandfield, J\BPBIL.\BCBL \BBA Wood, S\BPBIE. \APACrefYearMonthDay2015. \BBOQ\APACrefatitleHemispheric asymmetry in Martian seasonal surface water ice from MGS TES Hemispheric asymmetry in Martian seasonal surface water ice from MGS TES.\BBCQ \APACjournalVolNumPagesIcarus260396-408. {APACrefDOI} 10.1016/j.icarus.2015.07.025 \PrintBackRefs\CurrentBib
- Bapst \BOthers. (\APACyear2019) \APACinsertmetastarBapst2019{APACrefauthors}Bapst, J., Byrne, S., Bandfield, J\BPBIL.\BCBL \BBA Hayne, P\BPBIO. \APACrefYearMonthDay2019. \BBOQ\APACrefatitleThermophysical Properties of the North Polar Residual Cap using Mars Global Surveyor Thermal Emission Spectrometer Thermophysical Properties of the North Polar Residual Cap using Mars Global Surveyor Thermal Emission Spectrometer.\BBCQ \APACjournalVolNumPagesJournal of Geophysical Research: Planets12451315-1330. {APACrefDOI} 10.1029/2018JE005786 \PrintBackRefs\CurrentBib
- Bennett \BOthers. (\APACyear2018) \APACinsertmetastarBennet2018{APACrefauthors}Bennett, K\BPBIA., Hill, J\BPBIR., Murray, K\BPBIC., Edwards, C\BPBIS., Bell III, J\BPBIF.\BCBL \BBA Christensen, P\BPBIR. \APACrefYearMonthDay2018. \BBOQ\APACrefatitleTHEMIS-VIS Investigations of Sand at Gale Crater THEMIS-VIS Investigations of Sand at Gale Crater.\BBCQ \APACjournalVolNumPagesEarth and Space Science58352-363. {APACrefDOI} 10.1029/2018EA000380 \PrintBackRefs\CurrentBib
- Bibring \BOthers. (\APACyear2006) \APACinsertmetastarBibring2006{APACrefauthors}Bibring, J\BHBIP., Langevin, Y., Mustard, J\BPBIF., Poulet, F., Arvidson, R., Gendrin, A.\BDBLNeukum, G. \APACrefYearMonthDay2006. \BBOQ\APACrefatitleGlobal Mineralogical and Aqueous Mars History Derived from OMEGA/Mars Express Data Global mineralogical and aqueous mars history derived from OMEGA/mars express data.\BBCQ \APACjournalVolNumPagesScience3125772400–404. {APACrefDOI} 10.1126/science.1122659 \PrintBackRefs\CurrentBib
- Boynton \BOthers. (\APACyear2002) \APACinsertmetastarBoynton2002{APACrefauthors}Boynton, W\BPBIV., Feldman, W\BPBIC., Squyres, S\BPBIW., Prettyman, T\BPBIH., Bruckner, J., Evans, L\BPBIG.\BDBLShinohara, C. \APACrefYearMonthDay2002. \BBOQ\APACrefatitleDistribution of Hydrogen in the Near Surface of Mars: Evidence for Subsurface Ice Deposits Distribution of Hydrogen in the Near Surface of Mars: Evidence for Subsurface Ice Deposits.\BBCQ \APACjournalVolNumPagesScience297557881–85. {APACrefDOI} 10.1126/science.1073722 \PrintBackRefs\CurrentBib
- Byrne \BOthers. (\APACyear2009) \APACinsertmetastarByrne2009{APACrefauthors}Byrne, S., Dundas, C\BPBIM., Kennedy, M\BPBIR., Mellon, M\BPBIT., McEwen, A\BPBIS., Cull, S\BPBIC.\BDBLSeelos, F\BPBIP. \APACrefYearMonthDay2009. \BBOQ\APACrefatitleDistribution of Mid-Latitude Ground Ice on Mars from New Impact Craters Distribution of Mid-Latitude Ground Ice on Mars from New Impact Craters.\BBCQ \APACjournalVolNumPagesScience32559481674–1676. {APACrefDOI} 10.1126/science.1175307 \PrintBackRefs\CurrentBib
- Calvin \BOthers. (\APACyear2015) \APACinsertmetastarCALVIN2015North{APACrefauthors}Calvin, W., James, P., Cantor, B.\BCBL \BBA Dixon, E. \APACrefYearMonthDay2015. \BBOQ\APACrefatitleInterannual and seasonal changes in the north polar ice deposits of Mars: Observations from MY 29–31 using MARCI Interannual and seasonal changes in the north polar ice deposits of Mars: Observations from MY 29–31 using MARCI.\BBCQ \APACjournalVolNumPagesIcarus251181-190. \APACrefnoteDynamic Mars {APACrefDOI} 10.1016/j.icarus.2014.08.026 \PrintBackRefs\CurrentBib
- Carrozzo \BOthers. (\APACyear2009) \APACinsertmetastarCarrozzo2009{APACrefauthors}Carrozzo, F\BPBIG., Bellucci, G., Altieri, F., D’Aversa, E.\BCBL \BBA Bibring, J\BPBIP. \APACrefYearMonthDay2009. \BBOQ\APACrefatitleMapping of water frost and ice at low latitudes on Mars Mapping of water frost and ice at low latitudes on Mars.\BBCQ \APACjournalVolNumPagesIcarus2032406-420. {APACrefDOI} 10.1016/j.icarus.2009.05.020 \PrintBackRefs\CurrentBib
- Chevrier \BOthers. (\APACyear2022) \APACinsertmetastarChevrier2022{APACrefauthors}Chevrier, V\BPBIF., Fitting, A\BPBIB.\BCBL \BBA Rivera-Valentín, E\BPBIG. \APACrefYearMonthDay2022. \BBOQ\APACrefatitleLimited Stability of Multicomponent Brines on the Surface of Mars Limited Stability of Multicomponent Brines on the Surface of Mars.\BBCQ \APACjournalVolNumPagesThe Planetary Science Journal35125. {APACrefDOI} 10.3847/psj/ac6603 \PrintBackRefs\CurrentBib
- P. Christensen (\APACyear2002) \APACinsertmetastarTHEMISPDS{APACrefauthors}Christensen, P. \APACrefYearMonthDay2002. \APACrefbtitleODYSSEY THEMIS-VIS GEO V2.0 [Dataset]. Odyssey THEMIS-VIS geo v2.0 [dataset]. \APACaddressPublisherNASA Planetary Data System. {APACrefURL} https://data.nasa.gov/Earth-Science/ODYSSEY-THEMIS-VIS-GEO-V2-0/w5ja-k5dq/about_data {APACrefDOI} 10.17189/1520386 \PrintBackRefs\CurrentBib
- P\BPBIR. Christensen (\APACyear2002) \APACinsertmetastarPDSThemisPBT{APACrefauthors}Christensen, P\BPBIR. \APACrefYearMonthDay2002. \APACrefbtitleODYSSEY THEMIS IR PBT V2.0 [Dataset]. ODYSSEY THEMIS IR PBT V2.0 [Dataset]. \APACaddressPublisherNASA Planetary Data System. {APACrefURL} https://pds.nasa.gov/ds-view/pds/viewDataset.jsp?dsid=ODY-M-THM-5-IRPBT-V2.0 {APACrefDOI} 10.17189/1520354 \PrintBackRefs\CurrentBib
- Christensen (\APACyear2003) \APACinsertmetastarChristensen2003gullies{APACrefauthors}Christensen, P\BPBIR. \APACrefYearMonthDay2003. \BBOQ\APACrefatitleFormation of recent martian gullies through melting of extensive water-rich snow deposits Formation of recent martian gullies through melting of extensive water-rich snow deposits.\BBCQ \APACjournalVolNumPagesNature422692745–48. {APACrefDOI} 10.1038/nature01436 \PrintBackRefs\CurrentBib
- Christensen \BOthers. (\APACyear2001) \APACinsertmetastarChristensen2001{APACrefauthors}Christensen, P\BPBIR., Bandfield, J\BPBIL., Hamilton, V\BPBIE., Ruff, S\BPBIW., Kieffer, H\BPBIH., Titus, T\BPBIN.\BDBLGreenfield, M. \APACrefYearMonthDay2001. \BBOQ\APACrefatitleMars Global Surveyor Thermal Emission Spectrometer experiment: Investigation description and surface science results Mars Global Surveyor Thermal Emission Spectrometer experiment: Investigation description and surface science results.\BBCQ \APACjournalVolNumPagesJournal of Geophysical Research: Planets106E1023823–23871. {APACrefDOI} 10.1029/2000je001370 \PrintBackRefs\CurrentBib
- Christensen \BOthers. (\APACyear2004) \APACinsertmetastarChristensen2004{APACrefauthors}Christensen, P\BPBIR., Jakosky, B\BPBIM., Kieffer, H\BPBIH., Malin, M\BPBIC., Harry Y. McSween, J., Nealson, K.\BDBLRavine, M. \APACrefYearMonthDay2004. \BBOQ\APACrefatitleThe Thermal Emission Imaging System (THEMIS) for the Mars 2001 Odyssey Mission The Thermal Emission Imaging System (THEMIS) for the Mars 2001 Odyssey mission.\BBCQ \APACjournalVolNumPagesSpace Science Reviews1101/285–130. {APACrefDOI} 10.1023/b:spac.0000021008.16305.94 \PrintBackRefs\CurrentBib
- Clark (\APACyear1981) \APACinsertmetastarClark1981{APACrefauthors}Clark, B. \APACrefYearMonthDay1981. \BBOQ\APACrefatitleThe salts of Mars The salts of Mars.\BBCQ \APACjournalVolNumPagesIcarus452370–378. {APACrefDOI} 10.1016/0019-1035(81)90041-5 \PrintBackRefs\CurrentBib
- Clow (\APACyear1987) \APACinsertmetastarClow1987{APACrefauthors}Clow, G\BPBID. \APACrefYearMonthDay1987. \BBOQ\APACrefatitleGeneration of liquid water on Mars through the melting of a dusty snowpack Generation of liquid water on Mars through the melting of a dusty snowpack.\BBCQ \APACjournalVolNumPagesIcarus72195–127. {APACrefDOI} 10.1016/0019-1035(87)90123-0 \PrintBackRefs\CurrentBib
- Colaïtis \BOthers. (\APACyear2013) \APACinsertmetastarColaitis2013{APACrefauthors}Colaïtis, A., Spiga, A., Hourdin, F., Rio, C., Forget, F.\BCBL \BBA Millour, E. \APACrefYearMonthDay2013. \BBOQ\APACrefatitleA thermal plume model for the Martian convective boundary layer A thermal plume model for the Martian convective boundary layer.\BBCQ \APACjournalVolNumPagesJournal of Geophysical Research: Planets11871468-1487. {APACrefDOI} doi.org/10.1002/jgre.20104 \PrintBackRefs\CurrentBib
- Costard \BOthers. (\APACyear2002) \APACinsertmetastarCostard2002{APACrefauthors}Costard, F., Forget, F., Mangold, N.\BCBL \BBA Peulvast, J\BPBIP. \APACrefYearMonthDay2002. \BBOQ\APACrefatitleFormation of Recent Martian Debris Flows by Melting of Near-Surface Ground Ice at High Obliquity Formation of Recent Martian Debris Flows by Melting of Near-Surface Ground Ice at High Obliquity.\BBCQ \APACjournalVolNumPagesScience2955552110–113. {APACrefDOI} 10.1126/science.1066698 \PrintBackRefs\CurrentBib
- Curran \BOthers. (\APACyear1973) \APACinsertmetastarCurran1973{APACrefauthors}Curran, R\BPBIJ., Conrath, B\BPBIJ., Hanel, R\BPBIA., Kunde, V\BPBIG.\BCBL \BBA Pearl, J\BPBIC. \APACrefYearMonthDay1973. \BBOQ\APACrefatitleMars: Mariner 9 Spectroscopic Evidence for H20 Ice Clouds Mars: Mariner 9 Spectroscopic Evidence for H20 Ice Clouds.\BBCQ \APACjournalVolNumPagesScience1824110381–383. {APACrefDOI} 10.1126/science.182.4110.381 \PrintBackRefs\CurrentBib
- Diez \BOthers. (\APACyear2008) \APACinsertmetastarDIEZ2008{APACrefauthors}Diez, B., Feldman, W., Maurice, S., Gasnault, O., Prettyman, T., Mellon, M.\BDBLSchorghofer, N. \APACrefYearMonthDay2008. \BBOQ\APACrefatitleH layering in the top meter of Mars H layering in the top meter of Mars.\BBCQ \APACjournalVolNumPagesIcarus1962409-421. \APACrefnoteMars Polar Science IV {APACrefDOI} 10.1016/j.icarus.2008.02.006 \PrintBackRefs\CurrentBib
- Diniega \BOthers. (\APACyear2021) \APACinsertmetastarDiniega2021{APACrefauthors}Diniega, S., Bramson, A\BPBIM., Buratti, B., Buhler, P., Burr, D\BPBIM., Chojnacki, M.\BDBLWidmer, J\BPBIM. \APACrefYearMonthDay2021. \BBOQ\APACrefatitleModern Mars’ geomorphological activity, driven by wind, frost, and gravity Modern Mars’ geomorphological activity, driven by wind, frost, and gravity.\BBCQ \APACjournalVolNumPagesGeomorphology380107627. {APACrefDOI} 10.1016/j.geomorph.2021.107627 \PrintBackRefs\CurrentBib
- Dundas, Becerra\BCBL \BOthers. (\APACyear2021) \APACinsertmetastarDundas2021{APACrefauthors}Dundas, C\BPBIM., Becerra, P., Byrne, S., Chojnacki, M., Daubar, I\BPBIJ., Diniega, S.\BDBLValantinas, A. \APACrefYearMonthDay2021. \BBOQ\APACrefatitleActive Mars: A Dynamic World Active Mars: A Dynamic World.\BBCQ \APACjournalVolNumPagesJournal of Geophysical Research: Planets1268e2021JE006876. {APACrefDOI} 10.1029/2021JE006876 \PrintBackRefs\CurrentBib
- Dundas \BOthers. (\APACyear2019) \APACinsertmetastarDundas2019gullies{APACrefauthors}Dundas, C\BPBIM., McEwen, A\BPBIS., Diniega, S., Hansen, C\BPBIJ., Byrne, S.\BCBL \BBA McElwaine, J\BPBIN. \APACrefYearMonthDay2019. \BBOQ\APACrefatitleThe formation of gullies on Mars today The formation of gullies on Mars today.\BBCQ \APACjournalVolNumPagesGeological Society of London Special Publications46767-94. {APACrefDOI} 10.1144/SP467.5 \PrintBackRefs\CurrentBib
- Dundas, Mellon\BCBL \BOthers. (\APACyear2021) \APACinsertmetastarDundas2021ice{APACrefauthors}Dundas, C\BPBIM., Mellon, M\BPBIT., Conway, S\BPBIJ., Daubar, I\BPBIJ., Williams, K\BPBIE., Ojha, L.\BDBLPathare, A\BPBIV. \APACrefYearMonthDay2021. \BBOQ\APACrefatitleWidespread Exposures of Extensive Clean Shallow Ice in the Midlatitudes of Mars Widespread Exposures of Extensive Clean Shallow Ice in the Midlatitudes of Mars.\BBCQ \APACjournalVolNumPagesJournal of Geophysical Research: Planets1263. {APACrefDOI} 10.1029/2020je006617 \PrintBackRefs\CurrentBib
- Dundas \BOthers. (\APACyear2023) \APACinsertmetastarDundas2023{APACrefauthors}Dundas, C\BPBIM., Mellon, M\BPBIT., Posiolova, L\BPBIV., Miljković, K., Collins, G\BPBIS., Tornabene, L\BPBIL.\BDBLSpeth, G. \APACrefYearMonthDay2023. \BBOQ\APACrefatitleA Large New Crater Exposes the Limits of Water Ice on Mars A Large New Crater Exposes the Limits of Water Ice on Mars.\BBCQ \APACjournalVolNumPagesGeophysical Research Letters502e2022GL100747. {APACrefDOI} 10.1029/2022GL100747 \PrintBackRefs\CurrentBib
- Fan \BOthers. (\APACyear2023) \APACinsertmetastarFan2023{APACrefauthors}Fan, B., Jansen, M\BPBIF., Mischna, M\BPBIA.\BCBL \BBA Kite, E\BPBIS. \APACrefYearMonthDay2023. \BBOQ\APACrefatitleWhy Are Mountaintops Cold? The Transition of Surface Lapse Rate on Dry Planets Why Are Mountaintops Cold? The Transition of Surface Lapse Rate on Dry Planets.\BBCQ \APACjournalVolNumPagesGeophysical Research Letters5023. {APACrefDOI} 10.1029/2023gl106683 \PrintBackRefs\CurrentBib
- Feldman \BOthers. (\APACyear2002) \APACinsertmetastarFeldman2002{APACrefauthors}Feldman, W\BPBIC., Boynton, W\BPBIV., Tokar, R\BPBIL., Prettyman, T\BPBIH., Gasnault, O., Squyres, S\BPBIW.\BDBLReedy, R\BPBIC. \APACrefYearMonthDay2002. \BBOQ\APACrefatitleGlobal Distribution of Neutrons from Mars: Results from Mars Odyssey Global Distribution of Neutrons from Mars: Results from Mars Odyssey.\BBCQ \APACjournalVolNumPagesScience297557875–78. {APACrefDOI} 10.1126/science.1073541 \PrintBackRefs\CurrentBib
- Fergason \BOthers. (\APACyear2006) \APACinsertmetastarFergason2006{APACrefauthors}Fergason, R\BPBIL., Christensen, P\BPBIR.\BCBL \BBA Kieffer, H\BPBIH. \APACrefYearMonthDay2006. \BBOQ\APACrefatitleHigh-resolution thermal inertia derived from the Thermal Emission Imaging System (THEMIS): Thermal model and applications High-resolution thermal inertia derived from the Thermal Emission Imaging System (THEMIS): Thermal model and applications.\BBCQ \APACjournalVolNumPagesJournal of Geophysical Research: Planets111E12. {APACrefDOI} 10.1029/2006JE002735 \PrintBackRefs\CurrentBib
- Fischer \BOthers. (\APACyear2019) \APACinsertmetastarFischer2019{APACrefauthors}Fischer, E., Martínez, G\BPBIM., Rennó, N\BPBIO., Tamppari, L\BPBIK.\BCBL \BBA Zent, A\BPBIP. \APACrefYearMonthDay2019. \BBOQ\APACrefatitleRelative Humidity on Mars: New Results From the Phoenix TECP Sensor Relative Humidity on Mars: New Results From the Phoenix TECP Sensor.\BBCQ \APACjournalVolNumPagesJournal of Geophysical Research: Planets124112780-2792. {APACrefDOI} 10.1029/2019JE006080 \PrintBackRefs\CurrentBib
- Fisher \BOthers. (\APACyear2016) \APACinsertmetastarFisher2016{APACrefauthors}Fisher, D\BPBIA., Lacelle, D., Pollard, W., Davila, A.\BCBL \BBA McKay, C\BPBIP. \APACrefYearMonthDay2016. \BBOQ\APACrefatitleGround surface temperature and humidity, ground temperature cycles and the ice table depths in University Valley, McMurdo Dry Valleys of Antarctica Ground surface temperature and humidity, ground temperature cycles and the ice table depths in University Valley, McMurdo Dry Valleys of Antarctica.\BBCQ \APACjournalVolNumPagesJournal of Geophysical Research: Earth Surface121112069–2084. {APACrefDOI} 10.1002/2016jf004054 \PrintBackRefs\CurrentBib
- Flanner \BOthers. (\APACyear2021) \APACinsertmetastarFlanner2021{APACrefauthors}Flanner, M\BPBIG., Arnheim, J\BPBIB., Cook, J\BPBIM., Dang, C., He, C., Huang, X.\BDBLZender, C\BPBIS. \APACrefYearMonthDay2021. \BBOQ\APACrefatitleSNICAR-ADv3: a community tool for modeling spectral snow albedo SNICAR-ADv3: a community tool for modeling spectral snow albedo.\BBCQ \APACjournalVolNumPagesGeoscientific Model Development14127673–7704. {APACrefDOI} 10.5194/gmd-14-7673-2021 \PrintBackRefs\CurrentBib
- Forget \BOthers. (\APACyear1999) \APACinsertmetastarForget1999{APACrefauthors}Forget, F., Hourdin, F., Fournier, R., Hourdin, C., Talagrand, O., Collins, M.\BDBLHuot, J\BHBIP. \APACrefYearMonthDay1999. \BBOQ\APACrefatitleImproved general circulation models of the Martian atmosphere from the surface to above 80 km Improved general circulation models of the Martian atmosphere from the surface to above 80 km.\BBCQ \APACjournalVolNumPagesJournal of Geophysical Research: Planets104E1024155-24175. {APACrefDOI} 10.1029/1999JE001025 \PrintBackRefs\CurrentBib
- Glavin \BOthers. (\APACyear2013) \APACinsertmetastarGlavin2013{APACrefauthors}Glavin, D\BPBIP., Freissinet, C., Miller, K\BPBIE., Eigenbrode, J\BPBIL., Brunner, A\BPBIE., Buch, A.\BDBLMahaffy, P\BPBIR. \APACrefYearMonthDay2013. \BBOQ\APACrefatitleEvidence for perchlorates and the origin of chlorinated hydrocarbons detected by SAM at the Rocknest aeolian deposit in Gale Crater Evidence for perchlorates and the origin of chlorinated hydrocarbons detected by SAM at the Rocknest aeolian deposit in Gale Crater.\BBCQ \APACjournalVolNumPagesJournal of Geophysical Research: Planets118101955–1973. {APACrefDOI} 10.1002/jgre.20144 \PrintBackRefs\CurrentBib
- Haberle \BOthers. (\APACyear2008) \APACinsertmetastarHaberle2008{APACrefauthors}Haberle, R\BPBIM., Forget, F., Colaprete, A., Schaeffer, J., Boynton, W\BPBIV., Kelly, N\BPBIJ.\BCBL \BBA Chamberlain, M\BPBIA. \APACrefYearMonthDay2008. \BBOQ\APACrefatitleThe effect of ground ice on the Martian seasonal CO2 cycle The effect of ground ice on the Martian seasonal CO2 cycle.\BBCQ \APACjournalVolNumPagesPlanetary and Space Science562251–255. {APACrefDOI} 10.1016/j.pss.2007.08.006 \PrintBackRefs\CurrentBib
- Hagedorn \BOthers. (\APACyear2007) \APACinsertmetastarHagedorn2007{APACrefauthors}Hagedorn, B., Sletten, R\BPBIS.\BCBL \BBA Hallet, B. \APACrefYearMonthDay2007. \BBOQ\APACrefatitleSublimation and ice condensation in hyperarid soils: Modeling results using field data from Victoria Valley, Antarctica Sublimation and ice condensation in hyperarid soils: Modeling results using field data from Victoria Valley, Antarctica.\BBCQ \APACjournalVolNumPagesJournal of Geophysical Research: Earth Surface112F3. {APACrefDOI} 10.1029/2006jf000580 \PrintBackRefs\CurrentBib
- Harri \BOthers. (\APACyear2014) \APACinsertmetastarHarri2014{APACrefauthors}Harri, A., Genzer, M., Kemppinen, O., Gomez‐Elvira, J., Haberle, R., Polkko, J.\BDBLUrqui, R. \APACrefYearMonthDay2014. \BBOQ\APACrefatitleMars Science Laboratory relative humidity observations: Initial results Mars Science Laboratory relative humidity observations: Initial results.\BBCQ \APACjournalVolNumPagesJournal of Geophysical Research: Planets11992132–2147. {APACrefDOI} 10.1002/2013je004514 \PrintBackRefs\CurrentBib
- Harrison \BOthers. (\APACyear2015) \APACinsertmetastarHarrison2015{APACrefauthors}Harrison, T\BPBIN., Osinski, G\BPBIR., Tornabene, L\BPBIL.\BCBL \BBA Jones, E. \APACrefYearMonthDay2015. \BBOQ\APACrefatitleGlobal documentation of gullies with the Mars Reconnaissance Orbiter Context Camera and implications for their formation Global documentation of gullies with the Mars Reconnaissance Orbiter Context Camera and implications for their formation.\BBCQ \APACjournalVolNumPagesIcarus252236–254. {APACrefDOI} 10.1016/j.icarus.2015.01.022 \PrintBackRefs\CurrentBib
- Hébrard \BOthers. (\APACyear2012) \APACinsertmetastarHebrard2012{APACrefauthors}Hébrard, E., Listowski, C., Coll, P., Marticorena, B., Bergametti, G., Määttänen, A.\BDBLForget, F. \APACrefYearMonthDay2012. \BBOQ\APACrefatitleAn aerodynamic roughness length map derived from extended Martian rock abundance data An aerodynamic roughness length map derived from extended Martian rock abundance data.\BBCQ \APACjournalVolNumPagesJournal of Geophysical Research (Planets)117E4E04008. {APACrefDOI} 10.1029/2011JE003942 \PrintBackRefs\CurrentBib
- Hecht \BOthers. (\APACyear2009) \APACinsertmetastarHecht2009{APACrefauthors}Hecht, M\BPBIH., Kounaves, S\BPBIP., Quinn, R\BPBIC., West, S\BPBIJ., Young, S\BPBIM\BPBIM., Ming, D\BPBIW.\BDBLSmith, P\BPBIH. \APACrefYearMonthDay2009. \BBOQ\APACrefatitleDetection of Perchlorate and the Soluble Chemistry of Martian Soil at the Phoenix Lander Site Detection of Perchlorate and the Soluble Chemistry of Martian Soil at the Phoenix Lander Site.\BBCQ \APACjournalVolNumPagesScience325593664–67. {APACrefDOI} 10.1126/science.1172466 \PrintBackRefs\CurrentBib
- Houben \BOthers. (\APACyear1997) \APACinsertmetastarHouben1997{APACrefauthors}Houben, H., Haberle, R\BPBIM., Young, R\BPBIE.\BCBL \BBA Zent, A\BPBIP. \APACrefYearMonthDay1997. \BBOQ\APACrefatitleModeling the Martian seasonal water cycle Modeling the Martian seasonal water cycle.\BBCQ \APACjournalVolNumPagesJournal of Geophysical Research: Planets102E49069–9083. {APACrefDOI} 10.1029/97je00046 \PrintBackRefs\CurrentBib
- Inada \BOthers. (\APACyear2007) \APACinsertmetastarInada2007{APACrefauthors}Inada, A., Richardson, M\BPBII., McConnochie, T\BPBIH., Strausberg, M\BPBIJ., Wang, H.\BCBL \BBA Bell, J\BPBIF. \APACrefYearMonthDay2007. \BBOQ\APACrefatitleHigh-resolution atmospheric observations by the Mars Odyssey Thermal Emission Imaging System High-resolution atmospheric observations by the Mars Odyssey Thermal Emission Imaging System.\BBCQ \APACjournalVolNumPagesIcarus1922378–395. {APACrefDOI} 10.1016/j.icarus.2007.07.020 \PrintBackRefs\CurrentBib
- Ingersoll (\APACyear1970) \APACinsertmetastarIngersoll1970{APACrefauthors}Ingersoll, A\BPBIP. \APACrefYearMonthDay1970. \BBOQ\APACrefatitleMars: Occurrence of Liquid Water Mars: Occurrence of liquid water.\BBCQ \APACjournalVolNumPagesScience1683934972–973. {APACrefDOI} 10.1126/science.168.3934.972 \PrintBackRefs\CurrentBib
- James \BOthers. (\APACyear1979) \APACinsertmetastarJames1979{APACrefauthors}James, P\BPBIB., Briggs, G., Barnes, J.\BCBL \BBA Spruck, A. \APACrefYearMonthDay1979. \BBOQ\APACrefatitleSeasonal recession of Mars' south polar cap as seen by Viking Seasonal recession of Mars' south polar cap as seen by Viking.\BBCQ \APACjournalVolNumPagesJournal of Geophysical Research84B62889. {APACrefDOI} 10.1029/jb084ib06p02889 \PrintBackRefs\CurrentBib
- James \BOthers. (\APACyear1992) \APACinsertmetastarJammes1992{APACrefauthors}James, P\BPBIB., Kieffer, H\BPBIH.\BCBL \BBA Paige, D\BPBIA. \APACrefYearMonthDay1992. \BBOQ\APACrefatitleThe seasonal cycle of carbon dioxide on Mars. The seasonal cycle of carbon dioxide on Mars.\BBCQ \BIn \APACrefbtitleMars Mars (\BPG 934-968). \APACaddressPublisherUniversity of Arizona Press. \PrintBackRefs\CurrentBib
- Joshi \BOthers. (\APACyear1994) \APACinsertmetastarJoshi1994{APACrefauthors}Joshi, M\BPBIM., Lewis, S\BPBIR., Read, P\BPBIL.\BCBL \BBA Catling, D\BPBIC. \APACrefYearMonthDay1994. \BBOQ\APACrefatitleWestern boundary currents in the atmosphere of Mars Western boundary currents in the atmosphere of Mars.\BBCQ \APACjournalVolNumPagesNature3676463548–551. {APACrefDOI} 10.1038/367548a0 \PrintBackRefs\CurrentBib
- Joshi \BOthers. (\APACyear1995) \APACinsertmetastarJoshi1995{APACrefauthors}Joshi, M\BPBIM., Lewis, S\BPBIR., Read, P\BPBIL.\BCBL \BBA Catling, D\BPBIC. \APACrefYearMonthDay1995. \BBOQ\APACrefatitleWestern boundary currents in the Martian atmosphere: Numerical simulations and observational evidence Western boundary currents in the Martian atmosphere: Numerical simulations and observational evidence.\BBCQ \APACjournalVolNumPagesJournal of Geophysical Research: Planets100E35485-5500. {APACrefDOI} 10.1029/94JE02716 \PrintBackRefs\CurrentBib
- Kahre \BOthers. (\APACyear2020) \APACinsertmetastarKahre2020{APACrefauthors}Kahre, M., Haberle, R., Hollingsworth, J.\BCBL \BBA Wolff, M. \APACrefYearMonthDay2020. \BBOQ\APACrefatitleMARCI-observed clouds in the Hellas Basin during northern hemisphere summer on Mars: Interpretation with the NASA/Ames Legacy Mars Global Climate Model MARCI-observed clouds in the Hellas Basin during northern hemisphere summer on Mars: Interpretation with the NASA/Ames Legacy Mars Global Climate Model.\BBCQ \APACjournalVolNumPagesIcarus338113512. {APACrefDOI} 10.1016/j.icarus.2019.113512 \PrintBackRefs\CurrentBib
- Kereszturi \BOthers. (\APACyear2010) \APACinsertmetastarKereszturi2010{APACrefauthors}Kereszturi, A., Möhlmann, D., Berczi, S., Ganti, T., Horvath, A., Kuti, A.\BDBLSzathmary, E. \APACrefYearMonthDay2010. \BBOQ\APACrefatitleIndications of brine related local seepage phenomena on the northern hemisphere of Mars Indications of brine related local seepage phenomena on the northern hemisphere of Mars.\BBCQ \APACjournalVolNumPagesIcarus2071149–164. {APACrefDOI} 10.1016/j.icarus.2009.10.012 \PrintBackRefs\CurrentBib
- Kereszturi \BOthers. (\APACyear2011) \APACinsertmetastarKereszturi2011{APACrefauthors}Kereszturi, A., Vincendon, M.\BCBL \BBA Schmidt, F. \APACrefYearMonthDay2011. \BBOQ\APACrefatitleWater ice in the dark dune spots of Richardson crater on Mars Water ice in the dark dune spots of Richardson crater on Mars.\BBCQ \APACjournalVolNumPagesPlanetary and Space Science59126–42. {APACrefDOI} 10.1016/j.pss.2010.10.015 \PrintBackRefs\CurrentBib
- Khuller \BBA Christensen (\APACyear2021) \APACinsertmetastarKhuller2021ssice{APACrefauthors}Khuller, A\BPBIR.\BCBT \BBA Christensen, P\BPBIR. \APACrefYearMonthDay2021. \BBOQ\APACrefatitleEvidence of Exposed Dusty Water Ice within Martian Gullies Evidence of Exposed Dusty Water Ice within Martian Gullies.\BBCQ \APACjournalVolNumPagesJournal of Geophysical Research: Planets1262. {APACrefDOI} 10.1029/2020je006539 \PrintBackRefs\CurrentBib
- Khuller, Christensen, Harrison\BCBL \BBA Diniega (\APACyear2021) \APACinsertmetastarKhuller2021frost{APACrefauthors}Khuller, A\BPBIR., Christensen, P\BPBIR., Harrison, T\BPBIN.\BCBL \BBA Diniega, S. \APACrefYearMonthDay2021. \BBOQ\APACrefatitleThe Distribution of Frosts on Mars: Links to Present-Day Gully Activity The Distribution of Frosts on Mars: Links to Present-Day Gully Activity.\BBCQ \APACjournalVolNumPagesJournal of Geophysical Research: Planets1263e2020JE006577. \APACrefnotee2020JE006577 2020JE006577 {APACrefDOI} 10.1029/2020JE006577 \PrintBackRefs\CurrentBib
- Khuller, Christensen\BCBL \BBA Warren (\APACyear2021) \APACinsertmetastarKhuller2021albeo{APACrefauthors}Khuller, A\BPBIR., Christensen, P\BPBIR.\BCBL \BBA Warren, S\BPBIG. \APACrefYearMonthDay2021. \BBOQ\APACrefatitleSpectral Albedo of Dusty Martian H2O Snow and Ice Spectral Albedo of Dusty Martian H2O Snow and Ice.\BBCQ \APACjournalVolNumPagesJournal of Geophysical Research: Planets1269e2021JE006910. {APACrefDOI} 10.1029/2021JE006910 \PrintBackRefs\CurrentBib
- Khuller \BBA Clow (\APACyear2024) \APACinsertmetastarKhuller2024{APACrefauthors}Khuller, A\BPBIR.\BCBT \BBA Clow, G\BPBID. \APACrefYearMonthDay2024. \BBOQ\APACrefatitleTurbulent Fluxes and Evaporation/Sublimation Rates on Earth, Mars, Titan, and Exoplanets Turbulent fluxes and evaporation/sublimation rates on earth, mars, titan, and exoplanets.\BBCQ \APACjournalVolNumPagesJournal of Geophysical Research: Planets1294e2023JE008114. \APACrefnotee2023JE008114 2023JE008114 {APACrefDOI} 10.1029/2023JE008114 \PrintBackRefs\CurrentBib
- Kieffer (\APACyear2013) \APACinsertmetastarKieffer2013{APACrefauthors}Kieffer, H\BPBIH. \APACrefYearMonthDay2013. \BBOQ\APACrefatitleThermal model for analysis of Mars infrared mapping Thermal model for analysis of Mars infrared mapping.\BBCQ \APACjournalVolNumPagesJournal of Geophysical Research: Planets1183451-470. {APACrefDOI} 10.1029/2012JE004164 \PrintBackRefs\CurrentBib
- Kieffer \BBA Titus (\APACyear2001) \APACinsertmetastarKieffer2001{APACrefauthors}Kieffer, H\BPBIH.\BCBT \BBA Titus, T\BPBIN. \APACrefYearMonthDay2001. \BBOQ\APACrefatitleTES Mapping of Mars’ North Seasonal Cap TES Mapping of Mars’ North Seasonal Cap.\BBCQ \APACjournalVolNumPagesIcarus1541162-180. {APACrefDOI} 10.1006/icar.2001.6670 \PrintBackRefs\CurrentBib
- Landis (\APACyear2007) \APACinsertmetastarLandis2007{APACrefauthors}Landis, G\BPBIA. \APACrefYearMonthDay2007. \BBOQ\APACrefatitleObservation of frost at the equator of Mars by the Opportunity rover Observation of frost at the equator of Mars by the Opportunity rover.\BBCQ. {APACrefURL} https://www.lpi.usra.edu/meetings/lpsc2007/pdf/2423.pdf \APACrefnoteThe Lunar and Planetary Science Conference \PrintBackRefs\CurrentBib
- Lange, Forget, Dupont\BCBL \BOthers. (\APACyear2023) \APACinsertmetastarLange2023Model{APACrefauthors}Lange, L., Forget, F., Dupont, E., Vandemeulebrouck, R., Spiga, A., Millour, E.\BDBLBierjon, A. \APACrefYearMonthDay2023. \BBOQ\APACrefatitleModeling Slope Microclimates in the Mars Planetary Climate Model Modeling Slope Microclimates in the Mars Planetary Climate Model.\BBCQ \APACjournalVolNumPagesJournal of Geophysical Research: Planets12810e2023JE007915. {APACrefDOI} 10.1029/2023JE007915 \PrintBackRefs\CurrentBib
- Lange, Forget, Vincendon\BCBL \BOthers. (\APACyear2023) \APACinsertmetastarLange2023ice{APACrefauthors}Lange, L., Forget, F., Vincendon, M., Spiga, A., Vos, E., Aharonson, O.\BDBLVandemeulebrouck, R. \APACrefYearMonthDay2023. \BBOQ\APACrefatitleA Reappraisal of Subtropical Subsurface Water Ice Stability on Mars A Reappraisal of Subtropical Subsurface Water Ice Stability on Mars.\BBCQ \APACjournalVolNumPagesGeophysical Research Letters5021e2023GL105177. {APACrefDOI} 10.1029/2023GL105177 \PrintBackRefs\CurrentBib
- Lange \BOthers. (\APACyear2024) \APACinsertmetastarLange2024THEMIS_data{APACrefauthors}Lange, L., Piqueux, S., Edwards, C., Forget, F., Naar, J., Vos, E.\BCBL \BBA Szantai, A. \APACrefYearMonthDay2024. \APACrefbtitleReplication Data for: Observations of Water Frost on Mars with THEMIS: Application to the Presence of Brines and the Stability of (Sub)Surface Water Ice [Dataset]. Replication Data for: Observations of Water Frost on Mars with THEMIS: Application to the Presence of Brines and the Stability of (Sub)Surface Water Ice [Dataset]. \APACaddressPublisherHarvard Dataverse. {APACrefURL} https://dataverse.harvard.edu/citation?persistentId=doi:10.7910/DVN/3OMRM2 {APACrefDOI} 10.7910/DVN/3OMRM2 \PrintBackRefs\CurrentBib
- Lange \BOthers. (\APACyear2022) \APACinsertmetastarLange2022a{APACrefauthors}Lange, L., Piqueux, S.\BCBL \BBA Edwards, C\BPBIS. \APACrefYearMonthDay2022. \BBOQ\APACrefatitleGardening of the Martian Regolith by Diurnal CO2 Frost and the Formation of Slope Streaks Gardening of the Martian Regolith by Diurnal CO2 Frost and the Formation of Slope Streaks.\BBCQ \APACjournalVolNumPagesJournal of Geophysical Research: Planets1274e2021JE006988. {APACrefDOI} 10.1029/2021JE006988 \PrintBackRefs\CurrentBib
- Langevin \BOthers. (\APACyear2007) \APACinsertmetastarLangevin2007{APACrefauthors}Langevin, Y., Bibring, J\BHBIP., Montmessin, F., Forget, F., Vincendon, M., Douté, S.\BDBLGondet, B. \APACrefYearMonthDay2007. \BBOQ\APACrefatitleObservations of the south seasonal cap of Mars during recession in 2004–2006 by the OMEGA visible/near-infrared imaging spectrometer on board Mars Express Observations of the south seasonal cap of Mars during recession in 2004–2006 by the OMEGA visible/near-infrared imaging spectrometer on board Mars Express.\BBCQ \APACjournalVolNumPagesJournal of Geophysical Research. Planets112E8E08S12. {APACrefDOI} 10.1029/2006JE002841 \PrintBackRefs\CurrentBib
- Leighton \BBA Murray (\APACyear1966) \APACinsertmetastarLeighton1966{APACrefauthors}Leighton, R\BPBIB.\BCBT \BBA Murray, B\BPBIC. \APACrefYearMonthDay1966. \BBOQ\APACrefatitleBehavior of Carbon Dioxide and Other Volatiles on Mars Behavior of Carbon Dioxide and Other Volatiles on Mars.\BBCQ \APACjournalVolNumPagesScience1533732136–144. {APACrefDOI} 10.1126/science.153.3732.136 \PrintBackRefs\CurrentBib
- Leung \BOthers. (\APACyear2024) \APACinsertmetastarLeung2024{APACrefauthors}Leung, C\BPBIW., Tamppari, L\BPBIK., Kass, D\BPBIM., Martínez, G., Fischer, E.\BCBL \BBA Smith, M\BPBID. \APACrefYearMonthDay2024. \BBOQ\APACrefatitleSeasonal vertical water vapor distribution at the Mars Phoenix Lander site Seasonal vertical water vapor distribution at the Mars Phoenix Lander site.\BBCQ \APACjournalVolNumPagesIcarus408115820. {APACrefDOI} 10.1016/j.icarus.2023.115820 \PrintBackRefs\CurrentBib
- Madeleine \BOthers. (\APACyear2012) \APACinsertmetastarMadeleine2012{APACrefauthors}Madeleine, J\BHBIB., Forget, F., Millour, E., Navarro, T.\BCBL \BBA Spiga, A. \APACrefYearMonthDay2012. \BBOQ\APACrefatitleThe influence of radiatively active water ice clouds on the Martian climate The influence of radiatively active water ice clouds on the Martian climate.\BBCQ \APACjournalVolNumPagesGeophysical Research Letters3923. {APACrefDOI} 10.1029/2012gl053564 \PrintBackRefs\CurrentBib
- Malin \BOthers. (\APACyear2007) \APACinsertmetastarMalin2007{APACrefauthors}Malin, M\BPBIC., Bell III, J\BPBIF., Cantor, B\BPBIA., Caplinger, M\BPBIA., Calvin, W\BPBIM., Clancy, R\BPBIT.\BDBLWolff, M\BPBIJ. \APACrefYearMonthDay2007. \BBOQ\APACrefatitleContext Camera Investigation on board the Mars Reconnaissance Orbiter Context Camera Investigation on board the Mars Reconnaissance Orbiter.\BBCQ \APACjournalVolNumPagesJournal of Geophysical Research: Planets112E5. {APACrefDOI} 10.1029/2006JE002808 \PrintBackRefs\CurrentBib
- Malin \BBA Edgett (\APACyear2000) \APACinsertmetastarMalin2000{APACrefauthors}Malin, M\BPBIC.\BCBT \BBA Edgett, K\BPBIS. \APACrefYearMonthDay2000. \BBOQ\APACrefatitleEvidence for Recent Groundwater Seepage and Surface Runoff on Mars Evidence for recent groundwater seepage and surface runoff on Mars.\BBCQ \APACjournalVolNumPagesScience28854752330–2335. {APACrefDOI} 10.1126/science.288.5475.2330 \PrintBackRefs\CurrentBib
- Martin \BBA Zurek (\APACyear1993) \APACinsertmetastarMartin1993{APACrefauthors}Martin, L\BPBIJ.\BCBT \BBA Zurek, R\BPBIW. \APACrefYearMonthDay1993. \BBOQ\APACrefatitleAn analysis of the history of dust activity on Mars An analysis of the history of dust activity on Mars.\BBCQ \APACjournalVolNumPagesJournal of Geophysical Research: Planets98E23221–3246. {APACrefDOI} 10.1029/92je02937 \PrintBackRefs\CurrentBib
- Martínez \BOthers. (\APACyear2016) \APACinsertmetastarMARTINEZ2016{APACrefauthors}Martínez, G., Fischer, E., Rennó, N., Sebastián, E., Kemppinen, O., Bridges, N.\BDBLGómez-Elvira, J. \APACrefYearMonthDay2016. \BBOQ\APACrefatitleLikely frost events at Gale crater: Analysis from MSL/REMS measurements Likely frost events at Gale crater: Analysis from MSL/REMS measurements.\BBCQ \APACjournalVolNumPagesIcarus28093-102. \APACrefnoteMicroMars to MegaMars {APACrefDOI} 10.1016/j.icarus.2015.12.004 \PrintBackRefs\CurrentBib
- McConnochie \BOthers. (\APACyear2010) \APACinsertmetastarMcConnochie2010{APACrefauthors}McConnochie, T\BPBIH., Bell, J\BPBIF., Savransky, D., Wolff, M\BPBIJ., Toigo, A\BPBID., Wang, H.\BDBLChristensen, P\BPBIR. \APACrefYearMonthDay2010. \BBOQ\APACrefatitleTHEMIS-VIS observations of clouds in the martian mesosphere: Altitudes, wind speeds, and decameter-scale morphology THEMIS-VIS observations of clouds in the martian mesosphere: Altitudes, wind speeds, and decameter-scale morphology.\BBCQ \APACjournalVolNumPagesIcarus2102545-565. {APACrefDOI} 10.1016/j.icarus.2010.07.021 \PrintBackRefs\CurrentBib
- McEwen \BOthers. (\APACyear2007) \APACinsertmetastarMcEwen2007{APACrefauthors}McEwen, A\BPBIS., Hansen, C\BPBIJ., Delamere, W\BPBIA., Eliason, E\BPBIM., Herkenhoff, K\BPBIE., Keszthelyi, L.\BDBLWray, J\BPBIJ. \APACrefYearMonthDay2007. \BBOQ\APACrefatitleA Closer Look at Water-Related Geologic Activity on Mars A Closer Look at Water-Related Geologic Activity on Mars.\BBCQ \APACjournalVolNumPagesScience31758451706-1709. {APACrefDOI} 10.1126/science.1143987 \PrintBackRefs\CurrentBib
- McKay (\APACyear2009) \APACinsertmetastarMcKay2008{APACrefauthors}McKay, C\BPBIP. \APACrefYearMonthDay2009. \BBOQ\APACrefatitleSnow recurrence sets the depth of dry permafrost at high elevations in the McMurdo Dry Valleys of Antarctica Snow recurrence sets the depth of dry permafrost at high elevations in the McMurdo Dry Valleys of Antarctica.\BBCQ \APACjournalVolNumPagesAntarctic Science21189–94. {APACrefDOI} 10.1017/s0954102008001508 \PrintBackRefs\CurrentBib
- Mellon \BOthers. (\APACyear2004) \APACinsertmetastarMellon2004{APACrefauthors}Mellon, M\BPBIT., Feldman, W\BPBIC.\BCBL \BBA Prettyman, T\BPBIH. \APACrefYearMonthDay2004. \BBOQ\APACrefatitleThe presence and stability of ground ice in the southern hemisphere of Mars The presence and stability of ground ice in the southern hemisphere of Mars.\BBCQ \APACjournalVolNumPagesIcarus1692324–340. {APACrefDOI} 10.1016/j.icarus.2003.10.022 \PrintBackRefs\CurrentBib
- Mellon \BBA Jakosky (\APACyear1993) \APACinsertmetastarMellon1993{APACrefauthors}Mellon, M\BPBIT.\BCBT \BBA Jakosky, B\BPBIM. \APACrefYearMonthDay1993. \BBOQ\APACrefatitleGeographic variations in the thermal and diffusive stability of ground ice on Mars Geographic variations in the thermal and diffusive stability of ground ice on Mars.\BBCQ \APACjournalVolNumPagesJournal of Geophysical Research: Planets98E23345–3364. {APACrefDOI} 10.1029/92je02355 \PrintBackRefs\CurrentBib
- Möhlmann \BBA Kereszturi (\APACyear2010) \APACinsertmetastarMohlmann2010{APACrefauthors}Möhlmann, D.\BCBT \BBA Kereszturi, A. \APACrefYearMonthDay2010. \BBOQ\APACrefatitleViscous liquid film flow on dune slopes of Mars Viscous liquid film flow on dune slopes of Mars.\BBCQ \APACjournalVolNumPagesIcarus2072654–658. {APACrefDOI} 10.1016/j.icarus.2010.01.002 \PrintBackRefs\CurrentBib
- Montabone \BOthers. (\APACyear2015) \APACinsertmetastarMONTABONE201565{APACrefauthors}Montabone, L., Forget, F., Millour, E., Wilson, R., Lewis, S., Cantor, B.\BDBLWolff, M. \APACrefYearMonthDay2015. \BBOQ\APACrefatitleEight-year climatology of dust optical depth on Mars Eight-year climatology of dust optical depth on Mars.\BBCQ \APACjournalVolNumPagesIcarus25165-95. \APACrefnoteDynamic Mars {APACrefDOI} 10.1016/j.icarus.2014.12.034 \PrintBackRefs\CurrentBib
- Montmessin \BOthers. (\APACyear2017) \APACinsertmetastarMontmessin2017{APACrefauthors}Montmessin, F., Smith, M\BPBID., Langevin, Y., Mellon, M\BPBIT.\BCBL \BBA Fedorova, A. \APACrefYearMonthDay2017. \BBOQ\APACrefatitleThe Water Cycle The Water Cycle.\BBCQ \BIn R\BPBIM. Haberle, R\BPBIT. Clancy, F. Forget, M\BPBID. Smith\BCBL \BBA R\BPBIW. Zurek (\BEDS), \APACrefbtitleAsteroids, Comets, Meteors - ACM2017 Asteroids, comets, meteors - acm2017 (\BPG 295-337). \APACaddressPublisherCambridge University Press. {APACrefDOI} 10.1017/9781139060172.011 \PrintBackRefs\CurrentBib
- Murchie \BOthers. (\APACyear2019) \APACinsertmetastarMurchie2019{APACrefauthors}Murchie, S\BPBIL., Bibring, J\BHBIP., Arvidson, R\BPBIE., Bishop, J\BPBIL., Carter, J., Ehlmann, B\BPBIL.\BDBLViviano, C\BPBIE. \APACrefYearMonthDay2019. \BBOQ\APACrefatitleVisible to Short-Wave Infrared Spectral Analyses of Mars from Orbit Using CRISM and OMEGA Visible to short-wave infrared spectral analyses of mars from orbit using CRISM and OMEGA.\BBCQ \BIn \APACrefbtitleRemote Compositional Analysis: Techniques for Understanding Spectroscopy, Mineralogy, and Geochemistry of Planetary Surfaces. Remote compositional analysis: Techniques for understanding spectroscopy, mineralogy, and geochemistry of planetary surfaces. (\BPGS 453–483). \APACaddressPublisherCambridge University Press. {APACrefDOI} 10.1017/9781316888872.025 \PrintBackRefs\CurrentBib
- Murphy \BBA Koop (\APACyear2005) \APACinsertmetastarMurphy2005{APACrefauthors}Murphy, D\BPBIM.\BCBT \BBA Koop, T. \APACrefYearMonthDay2005. \BBOQ\APACrefatitleReview of the vapour pressures of ice and supercooled water for atmospheric applications Review of the vapour pressures of ice and supercooled water for atmospheric applications.\BBCQ \APACjournalVolNumPagesQuarterly Journal of the Royal Meteorological Society1316081539-1565. {APACrefDOI} 10.1256/qj.04.94 \PrintBackRefs\CurrentBib
- Murray \BOthers. (\APACyear2016) \APACinsertmetastarMurray2016{APACrefauthors}Murray, K\BPBIC., Christensen, P\BPBIR.\BCBL \BBA Mehall, G\BPBIL. \APACrefYearMonthDay2016. \BBOQ\APACrefatitleTHEMIS Geometric Processing User’s Guide Themis geometric processing user’s guide.\BBCQ \APACaddressPublisherNASA, Planetary Data System, ODY-M-THM-5-VISGEO-V2.0. {APACrefURL} https://static.mars.asu.edu/pds/ODTGEO_v2/document/geometry.pdf \PrintBackRefs\CurrentBib
- Naar \BOthers. (\APACyear2021) \APACinsertmetastarNaar2021{APACrefauthors}Naar, J., Forget, F., Vals, M., Millour, E., Bierjon, A., González-Galindo, F.\BCBL \BBA Richard, B. \APACrefYearMonthDay2021. \BBOQ\APACrefatitleModeling the global water cycle on Mars with improved physical parametrization Modeling the global water cycle on Mars with improved physical parametrization.\BBCQ \BIn \APACrefbtitleEuropean Planetary Science Congress European planetary science congress (\BPG EPSC2021-559). {APACrefDOI} 10.5194/epsc2021-559 \PrintBackRefs\CurrentBib
- Navarro \BOthers. (\APACyear2014) \APACinsertmetastarNavarro2014{APACrefauthors}Navarro, T., Madeleine, J\BHBIB., Forget, F., Spiga, A., Millour, E., Montmessin, F.\BCBL \BBA Määttänen, A. \APACrefYearMonthDay2014. \BBOQ\APACrefatitleGlobal climate modeling of the Martian water cycle with improved microphysics and radiatively active water ice clouds Global climate modeling of the Martian water cycle with improved microphysics and radiatively active water ice clouds.\BBCQ \APACjournalVolNumPagesJournal of Geophysical Research: Planets11971479-1495. {APACrefDOI} 10.1002/2013JE004550 \PrintBackRefs\CurrentBib
- Osterloo \BOthers. (\APACyear2010) \APACinsertmetastarOsterloo2010{APACrefauthors}Osterloo, M\BPBIM., Anderson, F\BPBIS., Hamilton, V\BPBIE.\BCBL \BBA Hynek, B\BPBIM. \APACrefYearMonthDay2010. \BBOQ\APACrefatitleGeologic context of proposed chloride‐bearing materials on Mars Geologic context of proposed chloride‐bearing materials on Mars.\BBCQ \APACjournalVolNumPagesJournal of Geophysical Research: Planets115E10. {APACrefDOI} 10.1029/2010je003613 \PrintBackRefs\CurrentBib
- Osterloo \BOthers. (\APACyear2008) \APACinsertmetastarOsterloo2008{APACrefauthors}Osterloo, M\BPBIM., Hamilton, V\BPBIE., Bandfield, J\BPBIL., Glotch, T\BPBID., Baldridge, A\BPBIM., Christensen, P\BPBIR.\BDBLAnderson, F\BPBIS. \APACrefYearMonthDay2008\APACmonth03. \BBOQ\APACrefatitleChloride-Bearing Materials in the Southern Highlands of Mars Chloride-Bearing Materials in the Southern Highlands of Mars.\BBCQ \APACjournalVolNumPagesScience31958701651–1654. {APACrefDOI} 10.1126/science.1150690 \PrintBackRefs\CurrentBib
- Pál \BOthers. (\APACyear2019) \APACinsertmetastarPal2019{APACrefauthors}Pál, B., Kereszturi, Á., Forget, F.\BCBL \BBA Smith, M\BPBID. \APACrefYearMonthDay2019. \BBOQ\APACrefatitleGlobal seasonal variations of the near-surface relative humidity levels on present-day Mars Global seasonal variations of the near-surface relative humidity levels on present-day Mars.\BBCQ \APACjournalVolNumPagesIcarus333481-495. {APACrefDOI} 10.1016/j.icarus.2019.07.007 \PrintBackRefs\CurrentBib
- Petrosyan \BOthers. (\APACyear2011) \APACinsertmetastarPetrosyan2011{APACrefauthors}Petrosyan, A., Galperin, B., Larsen, S\BPBIE., Lewis, S\BPBIR., Määttänen, A., Read, P\BPBIL.\BDBLVázquez, L. \APACrefYearMonthDay2011. \BBOQ\APACrefatitleThe Martian Atmospheric Boundary Layer The Martian Atmospheric Boundary Layer.\BBCQ \APACjournalVolNumPagesReviews of Geophysics493. {APACrefDOI} 10.1029/2010rg000351 \PrintBackRefs\CurrentBib
- Pilorget \BOthers. (\APACyear2013) \APACinsertmetastarPilorget2013{APACrefauthors}Pilorget, C., Edwards, C\BPBIS., Ehlmann, B\BPBIL., Forget, F.\BCBL \BBA Millour, E. \APACrefYearMonthDay2013. \BBOQ\APACrefatitleMaterial ejection by the cold jets and temperature evolution of the south seasonal polar cap of Mars from THEMIS/CRISM observations and implications for surface properties Material ejection by the cold jets and temperature evolution of the south seasonal polar cap of Mars from THEMIS/CRISM observations and implications for surface properties.\BBCQ \APACjournalVolNumPagesJournal of Geophysical Research (Planets)118122520–2536. {APACrefDOI} 10.1002/2013je004513 \PrintBackRefs\CurrentBib
- Piqueux \BOthers. (\APACyear2019) \APACinsertmetastarPiqueux2019{APACrefauthors}Piqueux, S., Buz, J., Edwards, C\BPBIS., Bandfield, J\BPBIL., Kleinböhl, A., Kass, D\BPBIM.\BDBLthe MCS team \APACrefYearMonthDay2019. \BBOQ\APACrefatitleWidespread Shallow Water Ice on Mars at High Latitudesand Midlatitudes Widespread Shallow Water Ice on Mars at High Latitudesand Midlatitudes.\BBCQ \APACjournalVolNumPagesGeophysical Research Letters462414290–14298. {APACrefDOI} 10.1029/2019gl083947 \PrintBackRefs\CurrentBib
- Piqueux \BOthers. (\APACyear2008) \APACinsertmetastarPiqueux2008{APACrefauthors}Piqueux, S., Edwards, C\BPBIS.\BCBL \BBA Christensen, P\BPBIR. \APACrefYearMonthDay2008. \BBOQ\APACrefatitleDistribution of the ices exposed near the south pole of Mars using Thermal Emission Imaging System (THEMIS) temperature measurements Distribution of the ices exposed near the south pole of Mars using Thermal Emission Imaging System (THEMIS) temperature measurements.\BBCQ \APACjournalVolNumPagesJournal of Geophysical Research: Planets113E8. {APACrefDOI} 10.1029/2007je003055 \PrintBackRefs\CurrentBib
- Piqueux \BOthers. (\APACyear2023) \APACinsertmetastarPiqueux2023timap{APACrefauthors}Piqueux, S., Kass, D\BPBIM., Kleinböhl, A., Slipski, M., Hayne, P\BPBIO., McCleese, D\BPBIJ.\BDBLHeavens, N. \APACrefYearMonthDay2023. \BBOQ\APACrefatitleMars thermal inertia and surface temperatures by the Mars Climate Sounder Mars thermal inertia and surface temperatures by the Mars Climate Sounder.\BBCQ \APACjournalVolNumPagesIcarus115851. {APACrefDOI} 10.1016/j.icarus.2023.115851 \PrintBackRefs\CurrentBib
- Piqueux \BOthers. (\APACyear2015) \APACinsertmetastarPiqueux2015{APACrefauthors}Piqueux, S., Kleinböhl, A., Hayne, P\BPBIO., Kass, D\BPBIM., Schofield, J\BPBIT.\BCBL \BBA McCleese, D\BPBIJ. \APACrefYearMonthDay2015. \BBOQ\APACrefatitleVariability of the martian seasonal CO2 cap extent over eight Mars Years Variability of the martian seasonal CO2 cap extent over eight Mars Years.\BBCQ \APACjournalVolNumPagesIcarus251164-180. {APACrefDOI} 10.1016/j.icarus.2014.10.045 \PrintBackRefs\CurrentBib
- Piqueux \BOthers. (\APACyear2016) \APACinsertmetastarPiqueux2016{APACrefauthors}Piqueux, S., Kleinböhl, A., Hayne, P\BPBIO., Heavens, N\BPBIG., Kass, D\BPBIM., McCleese, D\BPBIJ.\BDBLShirley, J\BPBIH. \APACrefYearMonthDay2016. \BBOQ\APACrefatitleDiscovery of a widespread low-latitude diurnal CO2 frost cycle on Mars Discovery of a widespread low-latitude diurnal CO2 frost cycle on Mars.\BBCQ \APACjournalVolNumPagesJournal of Geophysical Research: Planets12171174-1189. {APACrefDOI} 10.1002/2016JE005034 \PrintBackRefs\CurrentBib
- Polkko \BOthers. (\APACyear2023) \APACinsertmetastarPolkko2023{APACrefauthors}Polkko, J., Hieta, M., Harri, A., Tamppari, L., Martínez, G., Viúdez‐Moreiras, D.\BDBLVicente‐Retortillo, A. \APACrefYearMonthDay2023. \BBOQ\APACrefatitleInitial Results of the Relative Humidity Observations by MEDA Instrument Onboard the Mars 2020 Perseverance Rover Initial Results of the Relative Humidity Observations by MEDA Instrument Onboard the Mars 2020 Perseverance Rover.\BBCQ \APACjournalVolNumPagesJournal of Geophysical Research: Planets1282. {APACrefDOI} 10.1029/2022je007447 \PrintBackRefs\CurrentBib
- Pommerol \BOthers. (\APACyear2013) \APACinsertmetastarPommerol2013{APACrefauthors}Pommerol, A., Thomas, N., Jost, B., Beck, P., Okubo, C.\BCBL \BBA McEwen, A\BPBIS. \APACrefYearMonthDay2013. \BBOQ\APACrefatitlePhotometric properties of Mars soils analogs Photometric properties of Mars soils analogs.\BBCQ \APACjournalVolNumPagesJournal of Geophysical Research: Planets118102045–2072. {APACrefDOI} 10.1002/jgre.20158 \PrintBackRefs\CurrentBib
- Putzig \BOthers. (\APACyear2005) \APACinsertmetastarPutzig2005{APACrefauthors}Putzig, N\BPBIE., Mellon, M\BPBIT., Kretke, K\BPBIA.\BCBL \BBA Arvidson, R\BPBIE. \APACrefYearMonthDay2005. \BBOQ\APACrefatitleGlobal thermal inertia and surface properties of Mars from the MGS mapping mission Global thermal inertia and surface properties of Mars from the MGS mapping mission.\BBCQ \APACjournalVolNumPagesIcarus1732325-341. {APACrefDOI} 10.1016/j.icarus.2004.08.017 \PrintBackRefs\CurrentBib
- Rivera-Valentín \BOthers. (\APACyear2020) \APACinsertmetastarRiveraValentn2020{APACrefauthors}Rivera-Valentín, E\BPBIG., Chevrier, V\BPBIF., Soto, A.\BCBL \BBA Martínez, G. \APACrefYearMonthDay2020. \BBOQ\APACrefatitleDistribution and habitability of (meta)stable brines on present-day Mars Distribution and habitability of (meta)stable brines on present-day Mars.\BBCQ \APACjournalVolNumPagesNature Astronomy48756–761. {APACrefDOI} 10.1038/s41550-020-1080-9 \PrintBackRefs\CurrentBib
- Savijärvi \BOthers. (\APACyear2018) \APACinsertmetastarSavijrvi2018{APACrefauthors}Savijärvi, H., Paton, M.\BCBL \BBA Harri, A\BHBIM. \APACrefYearMonthDay2018. \BBOQ\APACrefatitleNew column simulations for the Viking landers: Winds, fog, frost, adsorption? New column simulations for the Viking landers: Winds, fog, frost, adsorption?\BBCQ \APACjournalVolNumPagesIcarus31048–53. {APACrefDOI} 10.1016/j.icarus.2017.11.007 \PrintBackRefs\CurrentBib
- Schmidt \BOthers. (\APACyear2009) \APACinsertmetastarSchmidt2009{APACrefauthors}Schmidt, F., Douté, S., Schmitt, B., Vincendon, M., Bibring, J\BHBIP., Langevin, Y.\BCBL \BBA Omega Team. \APACrefYearMonthDay2009. \BBOQ\APACrefatitleAlbedo control of seasonal South Polar cap recession on Mars Albedo control of seasonal South Polar cap recession on Mars.\BBCQ \APACjournalVolNumPagesIcarus2002374-394. {APACrefDOI} 10.1016/j.icarus.2008.12.014 \PrintBackRefs\CurrentBib
- Schorghofer (\APACyear2020) \APACinsertmetastarSchorghofer2020{APACrefauthors}Schorghofer, N. \APACrefYearMonthDay2020. \BBOQ\APACrefatitleMars: Quantitative Evaluation of Crocus Melting behind Boulders Mars: Quantitative Evaluation of Crocus Melting behind Boulders.\BBCQ \APACjournalVolNumPagesThe Astrophysical Journal890149. {APACrefDOI} 10.3847/1538-4357/ab612f \PrintBackRefs\CurrentBib
- Schorghofer \BBA Aharonson (\APACyear2005) \APACinsertmetastarSchorghofer2005{APACrefauthors}Schorghofer, N.\BCBT \BBA Aharonson, O. \APACrefYearMonthDay2005. \BBOQ\APACrefatitleStability and exchange of subsurface ice on Mars Stability and exchange of subsurface ice on Mars.\BBCQ \APACjournalVolNumPagesJournal of Geophysical Research: Planets110E5. {APACrefDOI} 10.1029/2004JE002350 \PrintBackRefs\CurrentBib
- Schorghofer \BBA Edgett (\APACyear2006) \APACinsertmetastarSchorghofer2006{APACrefauthors}Schorghofer, N.\BCBT \BBA Edgett, K\BPBIS. \APACrefYearMonthDay2006. \BBOQ\APACrefatitleSeasonal surface frost at low latitudes on Mars Seasonal surface frost at low latitudes on Mars.\BBCQ \APACjournalVolNumPagesIcarus1802321–334. {APACrefDOI} 10.1016/j.icarus.2005.08.022 \PrintBackRefs\CurrentBib
- Schröder \BOthers. (\APACyear2015) \APACinsertmetastarSchroder2015{APACrefauthors}Schröder, S., Meslin, P\BHBIY., Gasnault, O., Maurice, S., Cousin, A., Wiens, R.\BDBLVaniman, D. \APACrefYearMonthDay2015. \BBOQ\APACrefatitleHydrogen detection with ChemCam at Gale crater Hydrogen detection with ChemCam at Gale crater.\BBCQ \APACjournalVolNumPagesIcarus24943–61. {APACrefDOI} 10.1016/j.icarus.2014.08.029 \PrintBackRefs\CurrentBib
- Singh \BBA Flanner (\APACyear2016) \APACinsertmetastarSingh2016{APACrefauthors}Singh, D.\BCBT \BBA Flanner, M\BPBIG. \APACrefYearMonthDay2016. \BBOQ\APACrefatitleAn improved carbon dioxide snow spectral albedo model: Application to Martian conditions An improved carbon dioxide snow spectral albedo model: Application to martian conditions.\BBCQ \APACjournalVolNumPagesJournal of Geophysical Research: Planets121102037–2054. {APACrefDOI} 10.1002/2016je005040 \PrintBackRefs\CurrentBib
- Singh \BOthers. (\APACyear2018) \APACinsertmetastarSingh2018{APACrefauthors}Singh, D., Flanner, M\BPBIG.\BCBL \BBA Millour, E. \APACrefYearMonthDay2018. \BBOQ\APACrefatitleImprovement of Mars Surface Snow Albedo Modeling in LMD Mars GCM With SNICAR Improvement of Mars Surface Snow Albedo Modeling in LMD Mars GCM With SNICAR.\BBCQ \APACjournalVolNumPagesJournal of Geophysical Research: Planets1233780-791. {APACrefDOI} 10.1002/2017JE005368 \PrintBackRefs\CurrentBib
- D. Smith \BOthers. (\APACyear1999) \APACinsertmetastarSmith1999{APACrefauthors}Smith, D., Neumann, G., Ford, P., Arvidson, R., Guinness, E\BPBIA.\BCBL \BBA Slavney, S. \APACrefYearMonthDay1999. \APACrefbtitleMars Global Surveyor Laser Altimeter Precision Experiment Data Record [Dataset]. Mars Global Surveyor Laser Altimeter Precision Experiment Data Record [Dataset]. \APACaddressPublisherNASA Planetary Data System, MGS-M-MOLA-3-PEDR-L1A-V1.0, 1999. {APACrefURL} https://pds.nasa.gov/ds-view/pds/viewProfile.jsp?dsid=MGS-M-MOLA-5-MEGDR-L3-V1.0 \PrintBackRefs\CurrentBib
- M\BPBID. Smith (\APACyear2002) \APACinsertmetastarSmith2002{APACrefauthors}Smith, M\BPBID. \APACrefYearMonthDay2002. \BBOQ\APACrefatitleThe annual cycle of water vapor on Mars as observed by the Thermal Emission Spectrometer The annual cycle of water vapor on Mars as observed by the Thermal Emission Spectrometer.\BBCQ \APACjournalVolNumPagesJournal of Geophysical Research: Planets107E1125-1-25-19. {APACrefDOI} 10.1029/2001JE001522 \PrintBackRefs\CurrentBib
- M\BPBID. Smith (\APACyear2004) \APACinsertmetastarSmith2004{APACrefauthors}Smith, M\BPBID. \APACrefYearMonthDay2004. \BBOQ\APACrefatitleInterannual variability in TES atmospheric observations of Mars during 1999-2003 Interannual variability in TES atmospheric observations of Mars during 1999-2003.\BBCQ \APACjournalVolNumPagesIcarus1671148–165. {APACrefDOI} 10.1016/j.icarus.2003.09.010 \PrintBackRefs\CurrentBib
- P\BPBIH. Smith \BOthers. (\APACyear2009) \APACinsertmetastarSmith2009{APACrefauthors}Smith, P\BPBIH., Tamppari, L\BPBIK., Arvidson, R\BPBIE., Bass, D., Blaney, D., Boynton, W\BPBIV.\BDBLZent, A\BPBIP. \APACrefYearMonthDay2009. \BBOQ\APACrefatitleH2O at the Phoenix Landing Site H2O at the Phoenix Landing Site.\BBCQ \APACjournalVolNumPagesScience325593658–61. {APACrefDOI} 10.1126/science.1172339 \PrintBackRefs\CurrentBib
- Stcherbinine \BOthers. (\APACyear2023) \APACinsertmetastarStcherbinine2023{APACrefauthors}Stcherbinine, A., Edwards, C\BPBIS., Smith, M\BPBID., Wolff, M\BPBIJ., Haberle, C., Al Tunaiji, E.\BDBLChristensen, P\BPBIR. \APACrefYearMonthDay2023. \BBOQ\APACrefatitleDiurnal and Seasonal Mapping of Martian Ices With EMIRS Diurnal and seasonal mapping of martian ices with emirs.\BBCQ \APACjournalVolNumPagesGeophysical Research Letters5012e2023GL103629. {APACrefDOI} 10.1029/2023GL103629 \PrintBackRefs\CurrentBib
- Steele \BOthers. (\APACyear2017) \APACinsertmetastarSteele2017{APACrefauthors}Steele, L\BPBIJ., Balme, M\BPBIR., Lewis, S\BPBIR.\BCBL \BBA Spiga, A. \APACrefYearMonthDay2017. \BBOQ\APACrefatitleThe water cycle and regolith–atmosphere interaction at Gale crater, Mars The water cycle and regolith–atmosphere interaction at Gale crater, Mars.\BBCQ \APACjournalVolNumPagesIcarus28956–79. {APACrefDOI} 10.1016/j.icarus.2017.02.010 \PrintBackRefs\CurrentBib
- Svitek \BBA Murray (\APACyear1990) \APACinsertmetastarSvitek1990{APACrefauthors}Svitek, T.\BCBT \BBA Murray, B. \APACrefYearMonthDay1990. \BBOQ\APACrefatitleWinter frost at Viking Lander 2 site Winter frost at Viking Lander 2 site.\BBCQ \APACjournalVolNumPagesJournal of Geophysical Research: Solid Earth95B21495–1510. {APACrefDOI} 10.1029/jb095ib02p01495 \PrintBackRefs\CurrentBib
- Tamppari \BBA Lemmon (\APACyear2020) \APACinsertmetastarTamppari2020{APACrefauthors}Tamppari, L\BPBIK.\BCBT \BBA Lemmon, M\BPBIT. \APACrefYearMonthDay2020. \BBOQ\APACrefatitleNear-surface atmospheric water vapor enhancement at the Mars Phoenix lander site Near-surface atmospheric water vapor enhancement at the Mars Phoenix lander site.\BBCQ \APACjournalVolNumPagesIcarus343113624. {APACrefDOI} 10.1016/j.icarus.2020.113624 \PrintBackRefs\CurrentBib
- Titus (\APACyear2005) \APACinsertmetastarTitus2005{APACrefauthors}Titus, T\BPBIN. \APACrefYearMonthDay2005. \BBOQ\APACrefatitleThermal infrared and visual observations of a water ice lag in the Mars southern summer Thermal infrared and visual observations of a water ice lag in the Mars southern summer.\BBCQ \APACjournalVolNumPagesGeophysical Research Letters3224. {APACrefDOI} 10.1029/2005GL024211 \PrintBackRefs\CurrentBib
- Titus \BOthers. (\APACyear2003) \APACinsertmetastarTitus2003{APACrefauthors}Titus, T\BPBIN., Kieffer, H\BPBIH.\BCBL \BBA Christensen, P\BPBIR. \APACrefYearMonthDay2003. \BBOQ\APACrefatitleExposed Water Ice Discovered near the South Pole of Mars Exposed Water Ice Discovered near the South Pole of Mars.\BBCQ \APACjournalVolNumPagesScience29956091048–1051. {APACrefDOI} 10.1126/science.1080497 \PrintBackRefs\CurrentBib
- Vincendon (\APACyear2015) \APACinsertmetastarVincendon2015{APACrefauthors}Vincendon, M. \APACrefYearMonthDay2015. \BBOQ\APACrefatitleIdentification of Mars gully activity types associated with ice composition Identification of Mars gully activity types associated with ice composition.\BBCQ \APACjournalVolNumPagesJournal of Geophysical Research: Planets120111859–1879. {APACrefDOI} 10.1002/2015je004909 \PrintBackRefs\CurrentBib
- Vincendon, Forget\BCBL \BBA Mustard (\APACyear2010) \APACinsertmetastarVincendon2010water{APACrefauthors}Vincendon, M., Forget, F.\BCBL \BBA Mustard, J. \APACrefYearMonthDay2010. \BBOQ\APACrefatitleWater ice at low to midlatitudes on Mars Water ice at low to midlatitudes on Mars.\BBCQ \APACjournalVolNumPagesJournal of Geophysical Research (Planets)115E10E10001. {APACrefDOI} 10.1029/2010JE003584 \PrintBackRefs\CurrentBib
- Vincendon, Mustard\BCBL \BOthers. (\APACyear2010) \APACinsertmetastarVincendon2010{APACrefauthors}Vincendon, M., Mustard, J., Forget, F., Kreslavsky, M., Spiga, A., Murchie, S.\BCBL \BBA Bibring, J\BHBIP. \APACrefYearMonthDay2010. \BBOQ\APACrefatitleNear-tropical subsurface ice on Mars Near-tropical subsurface ice on Mars.\BBCQ \APACjournalVolNumPagesGeophysical Research Letters371. {APACrefDOI} 10.1029/2009gl041426 \PrintBackRefs\CurrentBib
- Wagstaff \BOthers. (\APACyear2008) \APACinsertmetastarWagstaff2008{APACrefauthors}Wagstaff, K\BPBIL., Titus, T\BPBIN., Ivanov, A\BPBIB., Castaño, R.\BCBL \BBA Bandfield, J\BPBIL. \APACrefYearMonthDay2008. \BBOQ\APACrefatitleObservations of the north polar water ice annulus on Mars using THEMIS and TES Observations of the north polar water ice annulus on Mars using THEMIS and TES.\BBCQ \APACjournalVolNumPagesPlanetary and Space Science562256–265. {APACrefDOI} 10.1016/j.pss.2007.08.008 \PrintBackRefs\CurrentBib
- Williams \BOthers. (\APACyear2015) \APACinsertmetastarWilliams2015{APACrefauthors}Williams, K., McKay, C\BPBIP.\BCBL \BBA Heldmann, J. \APACrefYearMonthDay2015. \BBOQ\APACrefatitleModeling the effects of martian surface frost on ice table depth Modeling the effects of martian surface frost on ice table depth.\BBCQ \APACjournalVolNumPagesIcarus26158–65. {APACrefDOI} 10.1016/j.icarus.2015.08.005 \PrintBackRefs\CurrentBib
- Williams \BOthers. (\APACyear2008) \APACinsertmetastarWilliams2008{APACrefauthors}Williams, K\BPBIE., Toon, O\BPBIB., Heldmann, J\BPBIL., McKay, C.\BCBL \BBA Mellon, M\BPBIT. \APACrefYearMonthDay2008. \BBOQ\APACrefatitleStability of mid-latitude snowpacks on Mars Stability of mid-latitude snowpacks on Mars.\BBCQ \APACjournalVolNumPagesIcarus1962565-577. {APACrefDOI} 10.1016/j.icarus.2008.03.017 \PrintBackRefs\CurrentBib
- Wilson \BOthers. (\APACyear2008) \APACinsertmetastarWilson2008{APACrefauthors}Wilson, R\BPBIJ., Lewis, S\BPBIR., Montabone, L.\BCBL \BBA Smith, M\BPBID. \APACrefYearMonthDay2008. \BBOQ\APACrefatitleInfluence of water ice clouds on Martian tropical atmospheric temperatures Influence of water ice clouds on Martian tropical atmospheric temperatures.\BBCQ \APACjournalVolNumPagesGeophysical Research Letters357. {APACrefDOI} 10.1029/2007GL032405 \PrintBackRefs\CurrentBib
- Wilson \BOthers. (\APACyear2007) \APACinsertmetastarWilson2007{APACrefauthors}Wilson, R\BPBIJ., Neumann, G\BPBIA.\BCBL \BBA Smith, M\BPBID. \APACrefYearMonthDay2007. \BBOQ\APACrefatitleDiurnal variation and radiative influence of Martian water ice clouds Diurnal variation and radiative influence of Martian water ice clouds.\BBCQ \APACjournalVolNumPagesGeophysical Research Letters342. {APACrefDOI} 10.1029/2006GL027976 \PrintBackRefs\CurrentBib
- Withers (\APACyear2012) \APACinsertmetastarWithers2012{APACrefauthors}Withers, P. \APACrefYearMonthDay2012. \BBOQ\APACrefatitleEmpirical Estimates of Martian Surface Pressure in Support of the Landing of Mars Science Laboratory Empirical Estimates of Martian Surface Pressure in Support of the Landing of Mars Science Laboratory.\BBCQ \APACjournalVolNumPagesSpace Science Reviews1701-4837-860. {APACrefDOI} 10.1007/s11214-012-9876-2 \PrintBackRefs\CurrentBib
- Yoldi \BOthers. (\APACyear2021) \APACinsertmetastarYoldi2021{APACrefauthors}Yoldi, Z., Pommerol, A., Poch, O.\BCBL \BBA Thomas, N. \APACrefYearMonthDay2021. \BBOQ\APACrefatitleReflectance study of ice and Mars soil simulant associations – I. H2O ice Reflectance study of ice and Mars soil simulant associations – I. H2O ice.\BBCQ \APACjournalVolNumPagesIcarus358114169. {APACrefDOI} 10.1016/j.icarus.2020.114169 \PrintBackRefs\CurrentBib
- Zent \BOthers. (\APACyear2010) \APACinsertmetastarZent2010{APACrefauthors}Zent, A\BPBIP., Hecht, M\BPBIH., Cobos, D\BPBIR., Wood, S\BPBIE., Hudson, T\BPBIL., Milkovich, S\BPBIM.\BDBLMellon, M\BPBIT. \APACrefYearMonthDay2010. \BBOQ\APACrefatitleInitial results from the thermal and electrical conductivity probe (TECP) on Phoenix Initial results from the thermal and electrical conductivity probe (TECP) on Phoenix.\BBCQ \APACjournalVolNumPagesJournal of Geophysical Research: Planets115E3. {APACrefDOI} 10.1029/2009je003420 \PrintBackRefs\CurrentBib
- Zuber \BOthers. (\APACyear1992) \APACinsertmetastarZuber1992{APACrefauthors}Zuber, M\BPBIT., Smith, D\BPBIE., Solomon, S\BPBIC., Muhleman, D\BPBIO., Head, J\BPBIW., Garvin, J\BPBIB.\BDBLBufton, J\BPBIL. \APACrefYearMonthDay1992. \BBOQ\APACrefatitleThe Mars Observer laser altimeter investigation The Mars Observer laser altimeter investigation.\BBCQ \APACjournalVolNumPagesJournal of Geophysical Research: Planets97E57781-7797. {APACrefDOI} 10.1029/92JE00341 \PrintBackRefs\CurrentBib