Mining_triadic_interactions_supplementary_material.pdf
Mining higher-order triadic interactions
Abstract
Complex systems often present higher-order interactions which require us to go beyond their description in terms of pairwise networks. Triadic interactions are a fundamental type of higher-order interaction that occurs when one node regulates the interaction between two other nodes. Triadic interactions are a fundamental type of higher-order networks, found in a large variety of biological systems, from neuron-glia interactions to gene-regulation and ecosystems. However, triadic interactions have been so far mostly neglected. In this article, we propose a theoretical principle to model and mine triadic interactions from node metadata, and we apply this framework to gene expression data finding new candidates for triadic interactions relevant for Acute Myeloid Leukemia. Our work reveals important aspects of higher-order triadic interactions often ignored, which can transform our understanding of complex systems and be applied to a large variety of systems ranging from biology to the climate.
I Introduction
Higher-order networks [1, 2, 3, 4, 5] are key to capture many-body interactions present in complex systems. Inferring higher-order interactions from real, pairwise network datasets is recognised as one of the central challenges in the study of higher-order networks [2]. Despite the increasing attention given to the inference of higher-order interactions [6, 7, 8, 9, 10, 11, 12, 13, 14], the detection of triadic interactions, which are prevalent in a wide variety of complex systems, has been addressed only in few works [15, 16, 17]
and remains an important scientific challenge.
Triadic interactions [18] are a fundamental type of signed higher-order interaction. A triadic interaction occurs when one or more nodes regulate the interaction between two other nodes. The regulator nodes may either enhance or inhibit the interaction between the other two nodes. Triadic interactions are known to be important in various systems such as ecosystems [19, 20, 21] where one species can regulate the interaction between two species, neuronal networks [22] where glial cells regulate synaptic transmission between neurons thereby regulating brain information processing, and gene regulation networks [16, 23] where a modulator can promote or silence the interaction between a transcription factor and a target gene.
Despite evidence of triadic interactions in specific disciplines (neuroscience, ecology, molecular biology), the relevance of triadic interactions as a universal type of higher-order interactions with a well-defined mathematical definition has only recently been recognised [18, 24, 25, 26, 27].
In this article, we explore the fundamental dynamical properties of networks with triadic interactions between continuous variables. We formulate a general model of networks with triadic interactions, and propose an information theory framework and the Triaction algorithm that is able to mine triadic interactions from data. The Triaction algorithm leverages the induced variability of the mutual information between a pair of variables when conditioned on a third regulatory variable. Using our method, we show that triadic interactions are important in gene-expression data where genes can be involved in ‘trigenic’ processes [28]. We apply the Triaction algorithm to a gene-expression network data, and are able to detect known interactions as well as propose a set of new candidate interactions that can then be validated experimentally.
II Triadic interactions
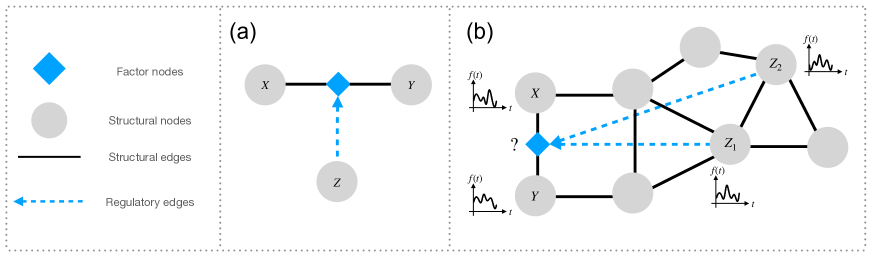
A triadic interaction occurs when one or more nodes modulate (or regulate) the interaction between two other nodes, either positively or negatively.
A triadic interaction network is a heterogeneous network composed of a structural network and a regulatory network encoding triadic interactions (Figure 1). The structural network is formed by a set of nodes and a set of edges. The regulatory network is a signed bipartite network with one set nodes given by (the nodes of the structural network), and another set of nodes given by (edges of the structural network) connected by the regulatory interactions of cardinality . The signed regulatory network can be encoded as an matrix where if node activates the structural edge , if node inhibits the structural edge and otherwise.
If , then the node is called a positive regulator of the edge , and if , then the node is called a negative regulator of the edge . It’s worth noting that node cannot serve as both a positive and negative regulator for the same edge at the same time. However, node can act as a positive regulator for edge while simultaneously functioning as a negative regulator for a different edge, denoted as , where .
III The continuous triadic interaction model
Here we formulate a general synthetic dynamical model for a network with triadic interactions between continuous variables. This model acts as a test benchmark to validate the Triaction algorithm that we propose to detect triadic interactions from continuous data. We assume that each node of the network is associated with a dynamical variable , and that the dynamical state of the entire network is encoded in the state vector . The topology of the structural network is encoded in the graph Laplacian matrix with elements
| (1) |
where is the adjacency matrix of the network, and is a coupling constant. In the absence of triadic interactions, we assume that the dynamics of the network is associated with a Gaussian process implemented as the Langevin equation
| (2) |
associated with the Hamiltonian
| (3) |
where , , and indicates an uncorrelated Gaussian noise with
| (4) |
The resulting Langevin dynamics is given by
| (5) |
We remark that the Hamiltonian has a minimum for , and its depth increases as the value of increases. In a deterministic version of the model (), the effect of the structural interactions will not be revealed at stationarity. However, the Langevin dynamics with encodes for the topology on the network. Indeed, at stationarity the correlation matrix is given by
| (6) |
In other words from the correlation matrix between the dynamical variable it is possible to infer the Laplacian, and hence the connectivity of the network. We now introduce triadic interactions in the model. As explained earlier, triadic interactions occur when one or more nodes modulate the structural interactions between another two nodes. To incorporate triadic interactions into the network dynamics, we modify the definition of the Laplacian operator present in the Langevin equation. Namely, we consider the Langevin dynamics
| (7) |
obtained from Eq.(2) by substituting the graph Laplacian with the triadic Laplacian whose elements are given by
| (8) |
Moreover, we assume that the coupling constants are determined by a perceptron-like model that considers all the regulatory nodes of the link and the sign of the regulatory interactions. Specifically, if then we set ; if instead then we set , with and . In other words, we set
| (9) |
where is the Heaviside function ( if and if ). Note that, in the presence of the triadic interactions, the stochastic differential equation is not associated with any Hamiltonian, and a stationary state of the dynamics is not guaranteed, making this dynamical process significantly more complex than the original Langevin dynamics in Eq.(2). This generic model of triadic interactions is related to the recently proposed model [27] to capture information propagation in multilayer networks but does not make use of a multilayer representation of the data. Moreover the model is significantly different from models of higher-order interactions previously proposed in the context of consensus dynamics [29, 30] or contagion dynamics [31, 32]. Indeed, in our framework, triadic interactions between continuous variables are not reducible to standard higher-order interactions because they involve the modulation of the interaction between pair of nodes. Moreover, this modulation of the interaction is not dependent on the properties of the interacting nodes and their immediate neighbours such as in [29, 30] or in the machine learning attention mechanism [33]. On the contrary, the modulation of the interaction is determined by a third regulatory node or a larger set of regulatory nodes encoded in the regulatory network
Our model of triadic interactions, therefore, shows that triadic interactions are higher-order interactions that cannot be reduced to pairs of pairwise interactions. An important problem that then arises is whether such interactions can be mined (extracted) from real data. To address this issue, we will formulate a new algorithm – that we call the Triaction algorithm – to identify triadic interactions from data, and we will test its performance on the data generated from the model described above.
IV Mining triadic interactions
IV.1 The Triaction algorithm
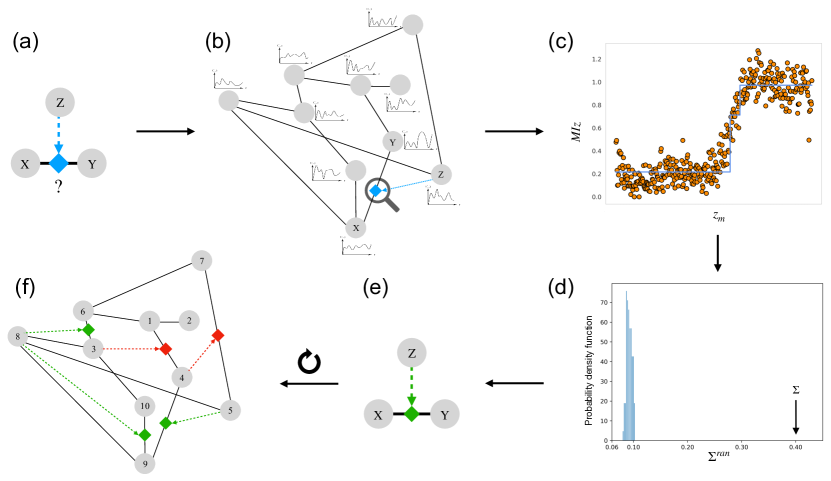
We propose the Triaction algorithm (see Figure 2) to mine triadic interactions among triples of nodes. To simplify the notation we will use the letters to indicate both nodes as well as their corresponding dynamical variables.
Given a structural edge between nodes and , our goal is to determine a confidence level for the existence of a triadic interaction involving an edge between node and node with respect to a potential regulator node . Specifically, we aim to determine whether the node regulates the edge between node and node , given the dynamical variables , and associated with these nodes. To do so, given a time series associated with node , we first sort the -values, and define bins in terms of -percentiles, chosen in such a way that each bin comprises the same number of data points (ranging in our analyses from to ). We indicate with the quantile of corresponding to the percentile . Therefore, each bin indicates data in which ranges in the interval . We indicate with and the probability density of the variable , and the joint probability density of the variables and in each -th bin.
A triadic interaction occurs when the node affects the strength of the interaction between the other two nodes and . Consequently, our starting point is to consider the mutual information between the dynamical variables and conditional to the specific value of the dynamical variable . We thus consider the quantity defined as
In order to estimate this quantity, we rely on non-parametric methods based on entropy estimation from -nearest neighbors [34, 35, 36]. For each triple of nodes, we visualize the mutual information computed as a function of the -th quantiles and fit this function with a decision tree comprising splits.
In the absence of triadic interactions, we expect to be approximately constant as a function of the -th quantiles , while, in the presence of triadic interactions, we expect this quantity to vary significantly as a function of . The discretized conditional mutual information CMI between and conditioned on can be written as
| (10) |
where indicates the probability that the value falls in the -th bin. This quantity is known to indicate important information about the interaction between the nodes and when combined with the information coming from the mutual information MI given by
where are the probability density functions for and and is the joint probability density functions of the variables and .
In particular, true interactions between and are typically associated with both high mutual information MI and high conditional mutual information CMI.
The conditional mutual information CMI, however, is not sensitive to variations in and does not therefore provide the information needed to detect triadic interactions.
In order to overcome this limitation, we define the following three quantities that measure how much the mutual information between and conditioned on changes as varies.
Specifically we consider:
-
(1)
the standard deviation of , defined as
(11) -
(2)
the difference between the maximum and minimum value of , given by
(12) -
(3)
the largest absolute difference of between consecutive bins, i.e.
(13) where
The quantities , , and collectively measure the strength of the triadic interaction under question and can thus can be used to mine triadic interactions in real data. In order to assess the significance of the putative triadic interaction, we compare the observed values of these variables to a null model obtained by shuffling the values, to give randomization of the data, i.e. we use surrogate data for testing [37, 38]. In order to determine if the observed values are significant, we compute the scores , , given by
| (14) |
and the -values
| (15) |
Note that since we consider realizations of the null model, we cannot estimate probabilities smaller than . Therefore, if in our null model we observe no value of larger than the true data , we set the conservative estimate . A similar procedure is applied also to and .
For each structural edge between node and node we can, of course, mine for triadic interactions involving different regulators nodes . To compare predictions, we rank these interactions from most to least likely via lowest to the highest -value, or alternatively from highest to lowest value and select the top ranked triadic interactions, or those above a predetermined significance level.
As we will discuss below, the algorithm performs well on our synthetic model. However, this algorithm focuses exclusively on triples of nodes, and so neglects potentially important network effects. Thus, the algorithm is expected to give better results for triples of nodes in which is not significantly correlated with either or .
IV.2 Validation of the Triaction algorithm on the triadic interaction model
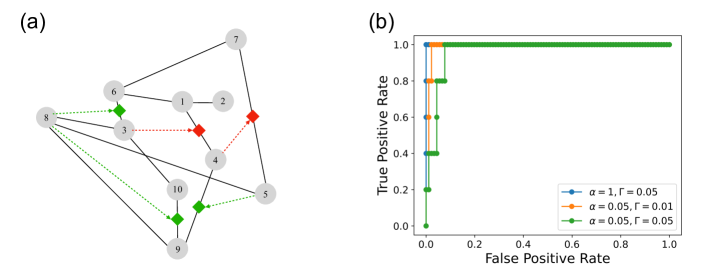
To demonstrate the efficacy of the Triaction algorithm we consider a single network (see Figure ) of nodes, edges and single triadic interactions (each formed by a single node regulating a single edge) on top of which we consider the triadic dynamical model proposed in Sec. III.
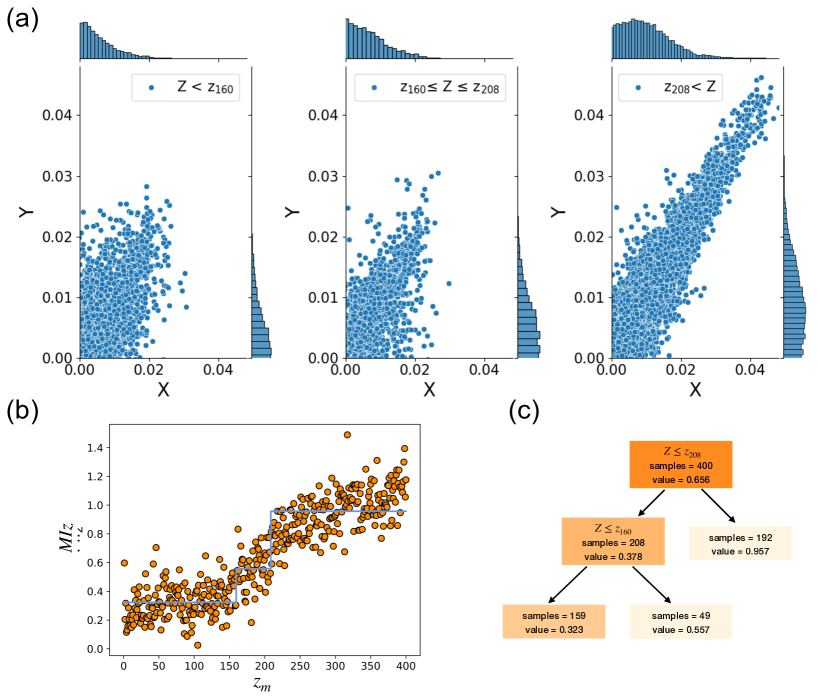
Simulations of Eq. (7) on this network show a strong dependence of on for the triples of nodes involved in triadic interactions, with greater significance for smaller values of . Figure 3 shows evidence of this interesting dynamical behavior in the case of a positive regulatory interaction. The function is fitted with a decision tree with two splits. In this way, three different intervals of values of are identified, each corresponding to a distinct functional behavior of the correlation functions between the variables and . Note that our analysis of the function also allows us to distinguish between positive and negative regulatory interactions. These are associated respectively by an increase in for larger values of or decrease of for larger values of . In the Supplementary Figures S1-S2, we display further examples of the function for triadic triples. We observe that as the parameter is raised, the noise increases, which is reflected also in the increased variability of the functional behavior.
In order to provide an overall assessment of the performance of Triaction in mining triadic interactions on this network, in Figure we display the Receiver Operating Characteristic curve (ROC curve) based on the score , which we found to perform well for a wide range of parameters. Our numerical results show a very good performance for larger values of , and smaller (see Figure ). As it is apparent from the ROC curve, the Triaction algorithm performs better for higher values of and smaller values of . For any values of the parameters, we notice that the false positives are more likely involving short-range triples, i.e. triples in which the regulator node has short (small) structural network distance with the two nodes and .
V Detecting triadic interactions in gene-expression data
Searching for trigenic interactions in gene-expression is a problem of major interest in biology. For instance, understanding the extent to which a modulator promotes or silences the interplay between a transcription factor and its target gene is crucial for deciphering gene regulation mechanisms. In order to address this question with our method, we considered gene-expression data from Acute Myeloid Leukemia (AML), extracted from the Grand Gene Regulatory Network Database [39, 40]. This dataset comprises genes and samples. Of course, this is for illustration and validation; the same analysis can be made on any gene expression data derived from human tissues, cancer, cell lines, or small molecule drugs as well as on any other dataset arising from different application domains such as climate data, where triadic interactions on networked data are relevant.
Exhaustive mining of all potential triadic interactions among each triple of nodes in the AML dataset is computationally very demanding (it would require testing of triplets). Instead, we focus on edges associated with known biophysical interactions, as identified in the human Protein-Protein Interaction network (PPI) [39]. To do so, we considered the subgraph of the human PPI network that contains all the genes/proteins included in the AML gene expression data. The number of edges in this subgraph is . We further refined our choice of candidate triples based on the pairwise information of the PPI network. We considered two random samples of short-range and longer-range triples formed by triples each (see the Supplementary Material for details). Here, range refers to the distance on the structural network between the regulator node and the nodes or .
Here we present the results obtained by our mining algorithm using as the significance score, bins, and assessed by running realizations of the null model. These results have strong correlations with the results obtained with the other measures (see Supplementary Figures S3-S4 for comparison).
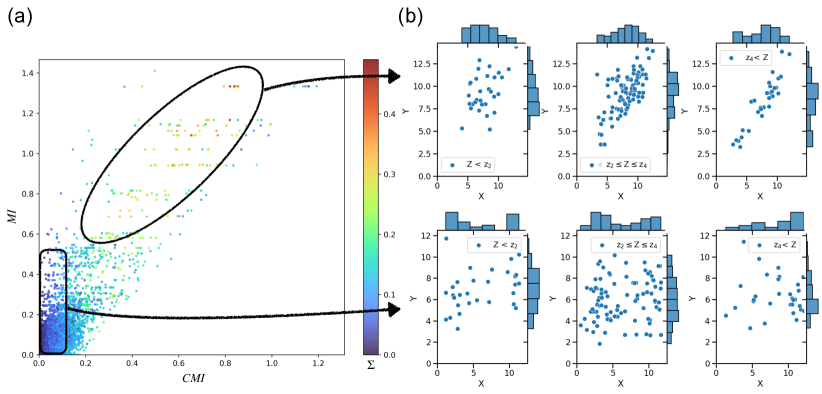
Figure displays the results of our algorithm for both for short-range and longer-range triples, involving a structural edge associated the mutual information MI and the conditional mutual information CMI between its two end-nodes. In the figure, each considered triple corresponds to a point, color coded according to the value of . Low values of correlate with low values of MI and low values of CMI, while the high values of are typically found for data corresponding to higher values of MI and CMI. Figure provides data from two exemplar triples: the top panels present evidence of a triadic interaction with high significance score (, ), while the bottom panels present evidence of a triadic interaction with low significance score (, ). The modulation of the strength of the interactions in the top panels is demonstrated by the significantly different conditional distributions of gene-expression and depending on the value of the gene-expression . On the other hand, in the bottom panels the conditional distributions do not change significantly depending on the value of the gene-expression . For further examples of results obtained on gene-expression triples, see the Supplementary Material.
From this analysis, we can extract a subnetwork (Figure S) formed by node triplets with a high significance score, in this case. Blue nodes and edges compose the structural network, that is, the PPI network. Structural edges are represented as black diamonds (factor nodes), while dashed lines illustrate triadic interactions between a regulatory node and a structural edge. We observe that the genes involved in the highest triadic interactions regulation are genes that play a critical role in AML (Figure S5 and Table 1): the HOX family [41], PBX3 [42], and MEIS1 [43]. We also investigated the triadic interactions involving a particular edge, such as HOXB5-HOXB6 shown on Table 1 and Figure S. In particular, most of the top regulatory nodes are consistent across all three measures ().
In the gene-expression literature, previous studies have proposed methods to detect modulation of interactions [16]. Our algorithm goes beyond this previous studies as it allows to detect not only strong monotonous positive and negative triadic interactions (see Supplementary Figure S6 and S7) but also strong triadic interactions with non monotonous functional behavior (see Supplementary Figure S8). The detected interactions strongly depart from triples with low significance score for which the does not vary significantly (see Supplementary Figure S9). Such results challenge the constraints of monotonic assumptions in existing measures within the gene expression literature. It is important to note that, while the monotonic assumption holds in the gene-expression context, non-monotonic behavior is a rare occurrence. However, in broader systems, the prevalence of mostly monotonic behavior, as observed in gene expression, cannot be assumed. Our measures can detect various functional behaviors, and are applicable to any context where triadic interactions may occur.
| Regulator | node1 | node2 | |||||||||
| MEIS1 | HOXB5 | HOXB6 | 1 | 6.94 | 0.0002 | 1 | 6.64 | 0.0002 | 1 | 6.66 | 0.0002 |
| ETS2 | HOXB5 | HOXB6 | 2 | 5.32 | 0.0002 | 2 | 5.93 | 0.0002 | 17 | 3.41 | 0.0028 |
| HOXA3 | HOXB5 | HOXB6 | 3 | 5.23 | 0.0002 | 3 | 5.81 | 0.0002 | 27 | 2.75 | 0.0096 |
| UNCX | HOXB5 | HOXB6 | 4 | 5.01 | 0.0002 | 5 | 4.86 | 0.0002 | 7 | 4.46 | 0.0002 |
| THRA | HOXB5 | HOXB6 | 5 | 4.92 | 0.0002 | 4 | 5.45 | 0.0002 | 2 | 6.02 | 0.0002 |
| HOXB7 | HOXB5 | HOXB6 | 11 | 4.14 | 0.0004 | 6 | 4.27 | 0.0006 | 4 | 4.86 | 0.0002 |
| FOSL1 | HOXB5 | HOXB6 | 12 | 4.06 | 0.0002 | 8 | 4.23 | 0.0002 | 3 | 4.90 | 0.0002 |
| HOXB8 | HOXB5 | HOXB6 | 14 | 3.93 | 0.0002 | 7 | 4.26 | 0.0002 | 5 | 4.82 | 0.0002 |
VI Conclusions
Our work proposes a comprehensive information theory approach to model and mine triadic interactions between continuous variables. The key observation is that the mutual information between two variables can be significantly modulated by a third regulatory node. Hence, detecting triadic interactions requires going beyond pairwise measures such as the mutual information and the conditional mutual information. The proposed approach is here used to mine triadic interactions in gene expression data, and we are able to detect known triadic interactions together with new candidate triplets. Our approach outperforms classical methods in the gene expression community, which assume that the CMI function should exhibit monotonicity with the evolution of the conditioning node [16], and extends the method for broader applications. These results are encouraging and may inspire further research in the field of gene regulation, particularly within the context of tissue specificity. Investigating the extent to which triadic interactions are tissue-specific, as well as whether certain regulatory patterns are conserved across different tissues, could yield valuable insights. In the future, the method could be applied to other type of data including times series which can be relevant in other scientific applications, such as climate research.
Code availability
The Python package Triaction is available on GitHub at the following link: https://github.com/anthbapt/triaction
Acknowledgments
This research utilized Queen Mary’s Apocrita HPC facility, supported by QMUL Research-IT, https://doi.org/10.5281/zenodo.438045. A.B., R. S.-G. and G. B. acknowledge support from the Turing-Roche North Star partnership. J. Y. acknowledges financial support from the ITO Foundation for International Education Exchange.
References
- [1] Ginestra Bianconi. Higher-Order Networks. Elements in the Structure and Dynamics of Complex Networks. Cambridge University Press, Cambridge, 2021.
- [2] Federico Battiston, Enrico Amico, Alain Barrat, Ginestra Bianconi, Guilherme Ferraz de Arruda, Benedetta Franceschiello, Iacopo Iacopini, Sonia Kéfi, Vito Latora, Yamir Moreno, Micah M. Murray, Tiago P. Peixoto, Francesco Vaccarino, and Giovanni Petri. The physics of higher-order interactions in complex systems. Nature Physics, 17(10):1093–1098, 2021.
- [3] Federico Battiston, Giulia Cencetti, Iacopo Iacopini, Vito Latora, Maxime Lucas, Alice Patania, Jean-Gabriel Young, and Giovanni Petri. Networks beyond pairwise interactions: structure and dynamics. Physics Reports, 874:1–92, 2020.
- [4] Leo Torres, Ann S Blevins, Danielle Bassett, and Tina Eliassi-Rad. The why, how, and when of representations for complex systems. SIAM Review, 63(3):435–485, 2021.
- [5] Christian Bick, Elizabeth Gross, Heather A. Harrington, and Michael T. Schaub. What are higher-order networks?, 2022.
- [6] Guido Previde Massara, Tiziana Di Matteo, and Tomaso Aste. Network filtering for big data: Triangulated maximally filtered graph. Journal of complex Networks, 5(2):161–178, 2016.
- [7] Jean-Gabriel Young, Giovanni Petri, and Tiago P. Peixoto. Hypergraph reconstruction from network data. Communications Physics, 4(1):135, 2021.
- [8] Martina Contisciani, Federico Battiston, and Caterina De Bacco. Inference of hyperedges and overlapping communities in hypergraphs. Nature Communications, 13(1):7229, 2022.
- [9] Federico Musciotto, Federico Battiston, and Rosario N Mantegna. Detecting informative higher-order interactions in statistically validated hypergraphs. Communications Physics, 4(1):218, 2021.
- [10] Robin Delabays, Giulia De Pasquale, Florian Dörfler, and Yuanzhao Zhang. Hypergraph reconstruction from dynamics. arXiv preprint arXiv:2402.00078, 2024.
- [11] Eckehard Olbrich, Nils Bertschinger, and Johannes Rauh. Information decomposition and synergy. Entropy, 17(5):3501–3517, 2015.
- [12] Fernando E Rosas, Pedro AM Mediano, Michael Gastpar, and Henrik J Jensen. Quantifying high-order interdependencies via multivariate extensions of the mutual information. Physical Review E, 100(3):032305, 2019.
- [13] Sebastiano Stramaglia, Tomas Scagliarini, Bryan C Daniels, and Daniele Marinazzo. Quantifying dynamical high-order interdependencies from the o-information: An application to neural spiking dynamics. Frontiers in Physiology, 11:595736, 2021.
- [14] Michele Tumminello, Tomaso Aste, Tiziana Di Matteo, and Rosario N Mantegna. A tool for filtering information in complex systems. Proceedings of the National Academy of Sciences, 102(30):10421–10426, 2005.
- [15] Juan Zhao, Yiwei Zhou, Xiujun Zhang, and Luonan Chen. Part mutual information for quantifying direct associations in networks. Proceedings of the National Academy of Sciences, 113(18):5130–5135, May 2016.
- [16] Kai Wang, Masumichi Saito, Brygida C. Bisikirska, Mariano J. Alvarez, Wei Keat Lim, Presha Rajbhandari, Qiong Shen, Ilya Nemenman, Katia Basso, Adam A. Margolin, Ulf Klein, Riccardo Dalla-Favera, and Andrea Califano. Genome-wide identification of post-translational modulators of transcription factor activity in human b cells. Nature Biotechnology, 27(9):829–837, 2009.
- [17] Dror Y. Kenett, Xuqing Huang, Irena Vodenska, Shlomo Havlin, and H. Eugene Stanley. Partial correlation analysis: applications for financial markets. Quantitative Finance, 15(4):569–578, April 2015.
- [18] Hanlin Sun, Filippo Radicchi, Jürgen Kurths, and Ginestra Bianconi. The dynamic nature of percolation on networks with triadic interactions. Nature Communications, 14(1):1308, 2023.
- [19] Eyal Bairey, Eric D. Kelsic, and Roy Kishony. High-order species interactions shape ecosystem diversity. Nature Communications, 7(1):12285, 2016.
- [20] Jacopo Grilli, György Barabás, Matthew J. Michalska-Smith, and Stefano Allesina. Higher-order interactions stabilize dynamics in competitive network models. Nature, 548(7666):210–213, 2017.
- [21] Andrew D. Letten and Daniel B. Stouffer. The mechanistic basis for higher-order interactions and non-additivity in competitive communities. Ecol Lett, 22(3):423–436, March 2019.
- [22] Woo-Hyun Cho, Ellane Barcelon, and Sung Joong Lee. Optogenetic glia manipulation: Possibilities and future prospects. Experimental Neurobiology, 25(5):197–204, October 2016.
- [23] Federico M. Giorgi, Gonzalo Lopez, Jung H. Woo, Brygida Bisikirska, Andrea Califano, and Mukesh Bansal. Inferring protein modulation from gene expression data using conditional mutual information. PLOS ONE, 9(10):e109569, October 2014.
- [24] Ana P Millán, Hanlin Sun, Joaquìn J Torres, and Ginestra Bianconi. Triadic percolation induces dynamical topological patterns in higher-order networks. arXiv preprint arXiv:2311.14877, 2023.
- [25] Lukas Herron, Pablo Sartori, and BingKan Xue. Robust retrieval of dynamic sequences through interaction modulation. PRX Life, 1(2):023012, 2023.
- [26] Leo Kozachkov, Jean-Jacques Slotine, and Dmitry Krotov. Neuron-astrocyte associative memory. arXiv preprint arXiv:2311.08135, 2023.
- [27] Giorgio Nicoletti and Daniel Maria Busiello. Information propagation in multilayer systems with higher-order interactions across timescales. Physical Review X, 14(2):021007, 2024.
- [28] Elena Kuzmin, Benjamin VanderSluis, Wen Wang, Guihong Tan, Raamesh Deshpande, Yiqun Chen, Matej Usaj, Attila Balint, Mojca Mattiazzi Usaj, Jolanda van Leeuwen, Elizabeth N. Koch, Carles Pons, Andrius J. Dagilis, Michael Pryszlak, Jason Zi Yang Wang, Julia Hanchard, Margot Riggi, Kaicong Xu, Hamed Heydari, Bryan-Joseph San Luis, Ermira Shuteriqi, Hongwei Zhu, Nydia Van Dyk, Sara Sharifpoor, Michael Costanzo, Robbie Loewith, Amy Caudy, Daniel Bolnick, Grant W. Brown, Brenda J. Andrews, Charles Boone, and Chad L. Myers. Systematic analysis of complex genetic interactions. Science, 360(6386):eaao1729, April 2018.
- [29] Leonie Neuhäuser, Renaud Lambiotte, and Michael T Schaub. Consensus dynamics and opinion formation on hypergraphs. In Higher-Order Systems, pages 347–376. Springer, 2022.
- [30] Leonie Neuhäuser, Andrew Mellor, and Renaud Lambiotte. Multibody interactions and nonlinear consensus dynamics on networked systems. Physical Review E, 101(3):032310, 2020.
- [31] Iacopo Iacopini, Giovanni Petri, Alain Barrat, and Vito Latora. Simplicial models of social contagion. Nature communications, 10(1):2485, 2019.
- [32] Guilherme Ferraz de Arruda, Giovanni Petri, and Yamir Moreno. Social contagion models on hypergraphs. Physical Review Research, 2(2):023032, 2020.
- [33] Petar Veličković, Guillem Cucurull, Arantxa Casanova, Adriana Romero, Pietro Lio, and Yoshua Bengio. Graph attention networks. arXiv preprint arXiv:1710.10903, 2017.
- [34] Lyudmyla F Kozachenko and Nikolai N Leonenko. Sample estimate of the entropy of a random vector. Problemy Peredachi Informatsii, 23(2):9–16, 1987.
- [35] Alexander Kraskov, Harald Stögbauer, and Peter Grassberger. Estimating mutual information. Physical review E, 69(6):066138, 2004.
- [36] Brian C Ross. Mutual information between discrete and continuous data sets. PloS one, 9(2):e87357, 2014.
- [37] J Kurths and H Herzel. An attractor in a solar time series. Physica D: Nonlinear Phenomena, 25(1-3):165–172, 1987.
- [38] James Theiler, Stephen Eubank, André Longtin, Bryan Galdrikian, and J Doyne Farmer. Testing for nonlinearity in time series: the method of surrogate data. Physica D: Nonlinear Phenomena, 58(1-4):77–94, 1992.
- [39] Marouen Ben Guebila, Camila M Lopes-Ramos, Deborah Weighill, Abhijeet Rajendra Sonawane, Rebekka Burkholz, Behrouz Shamsaei, John Platig, Kimberly Glass, Marieke L Kuijjer, and John Quackenbush. ”grand gene regulatory network database”, 2023.
- [40] Marouen Ben Guebila, Camila M. Lopes-Ramos, Deborah Weighill, Abhijeet Rajendra Sonawane, Rebekka Burkholz, Behrouz Shamsaei, John Platig, Kimberly Glass, Marieke L. Kuijjer, and John Quackenbush. Grand: a database of gene regulatory network models across human conditions. Nucleic Acids Res, 50(D1):D610–D621, January 2022.
- [41] R. A. Alharbi, R. Pettengell, H. S. Pandha, and R. Morgan. The role of hox genes in normal hematopoiesis and acute leukemia. Leukemia, 27(5):1000–1008, 2013.
- [42] Huidong Guo, Yajing Chu, Le Wang, Xing Chen, Yangpeng Chen, Hui Cheng, Lei Zhang, Yuan Zhou, Feng-chun Yang, Tao Cheng, Mingjiang Xu, Xiaobing Zhang, Jianfeng Zhou, and Weiping Yuan. Pbx3 is essential for leukemia stem cell maintenance in mll-rearranged leukemia. Int. J. Cancer, 141(2):324–335, July 2017.
- [43] Ping Xiang, Xining Yang, Leo Escano, Ishpreet Dhillon, Edith Schneider, Jack Clemans-Gibbon, Wei Wei, Jasper Wong, Simon Xufeng Wang, Derek Tam, Yu Deng, Eric Yung, Gregg B. Morin, Pamela A. Hoodless, Martin Hirst, Aly Karsan, Florian Kuchenbauer, R. Keith Humphries, and Arefeh Rouhi. Elucidating the importance and regulation of key enhancers for human meis1 expression. Leukemia, 36(8):1980–1989, 2022.