Ground- and excited-state properties of LiNb1-xTaxO3 solid solutions
Abstract
LiNb1-xTaxO3 solid solutions are investigated from first principles and by optical spectroscopy. The ground- and excited-state properties of the solid solutions are modelled within density functional theory as a function of the Ta concentration using special quasirandom structures spanning the entire composition range between LiNbO3 and LiTaO3. Deviations from a Vegard behavior are predicted for the lattice parameters, the heat capacity, the electronic bandgap, and consequently the absorption edge. The latter is measured for crystals of different composition by low temperature optical spectroscopy, qualitatively confirming the theoretical predictions. The LiNb0.11Ta0.89O3 composition is found to be a highly unusual crystal with a permanent macroscopic electric polarization and nonetheless zero birefringence.
I Introduction
Solid solutions are, according to the IUPAC definition [1], solids in which two or more components are compatible and form a unique phase. In this definition compatible means, that the components (also referred to as parent compounds, end compounds, or solute and solvent) obey the Hume-Rothery rules [2, 3]. They state that if the two end compounds have the same crystal structure, similar electronegativity, valency, and comparable atomic radii (15% or less difference), they may form a solid solution. This can occur if the particles of one component are accommodated into the space between the particles of the other (interstitial solid solutions), or if the solute substitutes the particles in the lattice of the solvent (substitutional solid solutions). In general, interstitial solid solutions form over a limited concentration range, while substitutional solid solutions may from with any composition between the two end compounds.
In both cases, the properties of the solvent are modified by the presence of foreign particles, which destroy, strictly speaking, the translational symmetry of the crystal, and thus the physical and electronic homogeneity on the microscopic scale. As a general rule of thumb, the material properties of the solid solutions such as the lattice parameters [4], the effective mass [5], the heat capacity, and the electronic bandgap [6] vary almost linearly with the composition. This behavior is described by the Vegard’s law [7, 8]. Yet, many exceptions exist, for which some property varies non linearly between those of the parent compounds [9, 10]. In this case, the considered property of the solid solutions might exceed that of both the end compounds for some concentration.
Solid solutions are extremely appealing for technological and industrial applications, as the mixed crystals often have superior properties with respect to the parent compounds. Moreover, the magnitude of the material properties can be tuned by composition and tailored for specific applications.
A prime example of solid solutions with a huge potential for technological applications are the ferroelectric LiNb1-xTaxO3 mixed crystals [11]. They combine the excellent piezoelectric, electro-optical, and electro-acoustic properties of lithium niobate (LiNbO3, LN) with the thermal stability of lithium tantalate (LiTaO3, LT) [12, 13]. Thus, they are very appealing for the realization of different sensors that might be operated in harsh environments, especially at high temperatures.
Below their ferroelectric Curie temperature, both LN and LT crystallize in the same rhombohedral structure belonging to the space group [14, 15]. In this structure, Nb and Ta ions are pentavalent. Due to the similarity of their ionic radii (both 0.78 Å for pentavalent, octahedrally coordinated ions [16]), and of their electronegativity (1.6 and 1.5 in Pauling units for Nb and Ta, respectively [16]), Nb and Ta can be readily exchanged. Accordingly, the substitutional LiNb1-xTaxO3 (LNT) solid solutions can be grown over the whole composition range [17]. According to the actual understanding of the solid solutions, Ta and Nb ions are expected to be randomly distributed on the Ta/Nb lattice sites to maximize the entropic contributions to the free energy [18].
Some properties of the LNT solid solutions, such as the birefringence [11], the lattice dynamics [19], the linear optical response [20], and the phase transition [21], have been investigated in the past. However, the overall knowledge of LNT mixed crystals is still scarce. Moreover, a theoretical characterization of the mixed crystals is missing up to date. Simplified approaches modelling a few compositions of the solid solutions as ordered crystals are available [22, 23], which, however, do not model the correct cation distribution in random alloys. In this work, we model LiNb1-xTaxO3 solid solutions from first principles using special quasirandom structures (SQS) [24, 25], which allow to model random alloys within periodic boundary conditions. We predict the dependence of ground and excited state properties such as lattice parameters, heat capacity, and electronic structure on the composition. Deviations from the Vegard behavior are predicted for the fundamental electronic bandgap, which is verified by specifically performed low temperature optical measurements. Moreover, the solid solution with LiNb0.11Ta0.89O3 composition is found to be a peculiar crystal with an unusual combination of permanent polarization and optical isotropy.
II Methodology
II.1 Special Quasirandom Structures
From the point of view of theorists, the lack of studies on LNT solid solutions is not surprising, as the atomistic modelling of non-ordered crystals is a conceptually challenging task. Ordered crystals and their properties are efficiently calculated within density functional theory (DFT), at least at 0 K, in conjunction with periodic boundary conditions. On the contrary, mixed crystals with random site occupation are not easily modeled within a unit cell that is periodically repeated in the three cartesian directions, as it models by definition a periodic crystal. The brute-force method, consisting in modelling many randomly generated distributions for the same composition and then averaging the calculated quantities, is not feasible due to the huge number of possible configurations. To cope with this problem, many approaches have been developed.
Within the Virtual Crystal Approximation, the ions are described by a virtual hybrid atom consisting of two or more species weighted according to the concentration [26]. Thus, a mixed crystal can be modeled at the same computational cost of the end compounds. Within the Coherent Potential Approximation, the potential within the solid solution is modelled as an ordered, composition dependent array of effective potentials [27]. Unfortunately, both methods are non-structural approaches, which neglect finer details of disordered structures such as local distortions, which, however, are crucial for the description, e.g., of polarons.
A further way to model non ordered crystals is the Cluster Expansion Method. Within this approach, it is assumed that scalar properties (e.g., the total energy) can be expanded in a series of structural motifs (clusters) [28, 29]. An effective Hamiltonian is then constructed by the sum of the interactions of given clusters. The parameters for the expansion are typically calculated within DFT, and the overall computational demand is quite high. Extensions of the method to tensor properties are available as well [30].
A pragmatic alternative, which we employ in the present work, is given by the special quasirandom structures (SQS). They are supercells that are optimized to provide the best representation of non-ordered systems within the supercell approach. Thereby, the site occupation is chosen such that the pair correlation functions are as close as possible to that of an ideal, infinite random solid solution. SQS are able to accurately predict thermodynamical properties at moderate computational cost [31, 25].
According to the original idea of Zunger and co-workers [24], the atomic lattice is discretized into figures labeled by , where is the number of vertices in the figure and is the maximum distance spanned by the figure edges. The latter is given in units of nearest-neighbor cells. In this formalism, an analytic expression for the lattice averaged correlation function of an ideal, truly random alloy is known:
| (1) |
which holds for finite figures () and impurity concentration . The label denotes randomness, true disorder.
The products of a spin variable which assumes the values and depending on which ion occupies a given lattice site:
| (2) |
can be used to define the lattice averaged correlation function of the cluster in the structure , averaging over all appearances of that cluster within the structure :
| (3) |
In this equation, which represents the correlation function of the cluster in the structure , denotes the multiplicity of the figure defined by its symmetry, and is the number of lattice points that can be occupied either by Nb or Ta. Finally, introducing the mean distance between vertices in a figure:
| (4) |
we are able to calculate the deviation of the averaged correlation function of a particular structure from the corresponding correlation function of a truly random, infinite alloy of the same composition :
| (5) |
as defined by equation 5 is referred to as error function in Ref. [25]. Larger clusters with more vertices and larger mean distance have a minor contribution to . This should mirror the fact that most physical properties stem mainly from short–ranged interactions, making correlation functions of small clusters more important for the choice of SQS. The exponent further determines the weight distribution between small and large clusters, as well as the unit of . It can be shown that the order of the best SQS does not vary for . So, we chose in this work, yielding in units of inverse square meters. We furthermore chose a cutoff distance of 11 Å, 9 Å, 7 Å and 7 Å for , , and , respectively. Where the configuration space allows it, about 105 randomly generated candidate structures were considered.
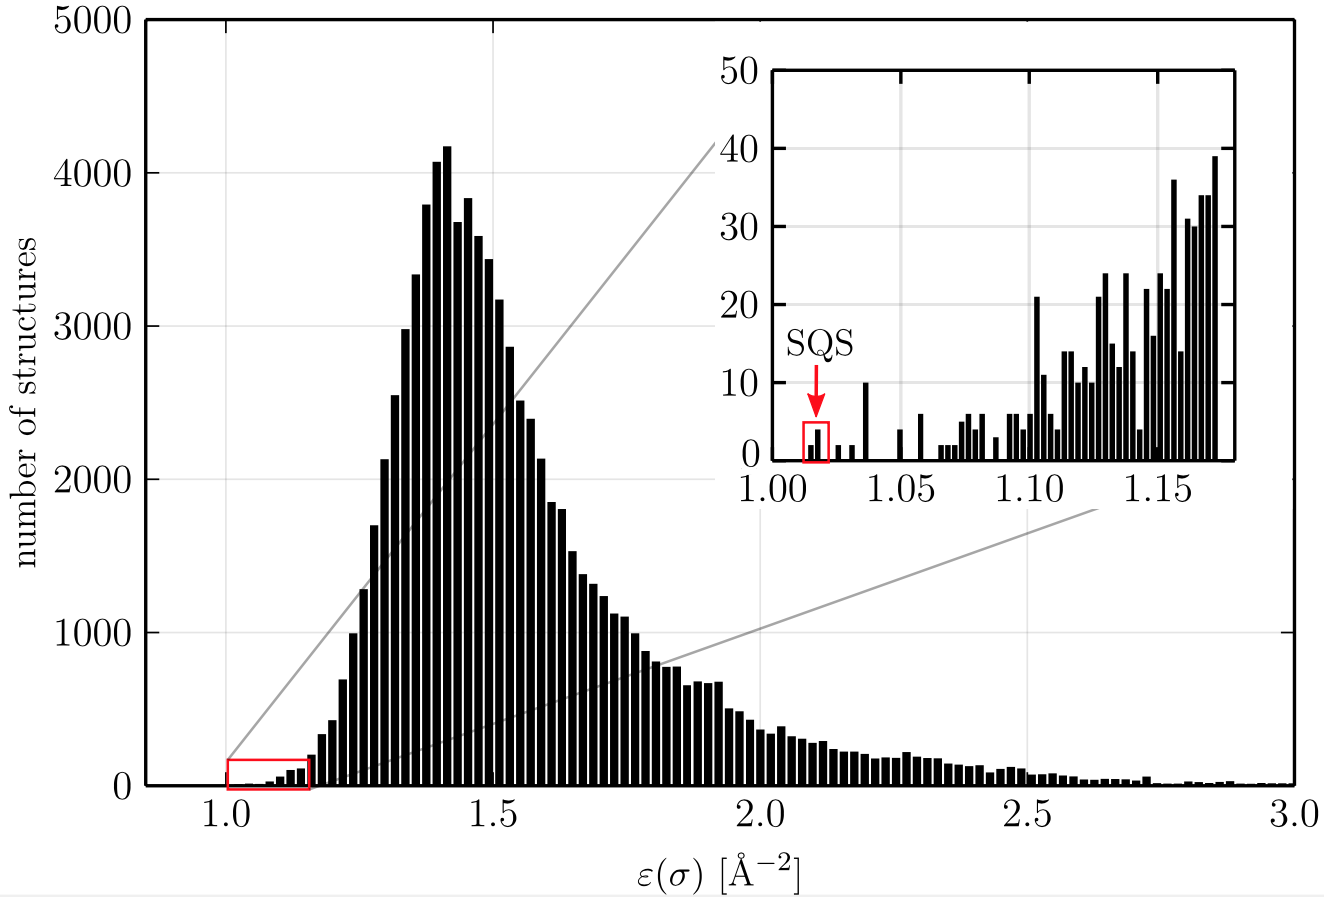
The best five SQS for each concentration (or at least three, where the configuration space is restricted) were selected for further investigation by means of DFT. This procedure is illustrated exemplarily for a LNT crystal with in figure 1.
II.2 Computational Details
Atomistic calculations are performed within the DFT as implemented in VASP [32, 33, 34]. PAW potentials [35, 36] with exchange-correlation functional in the PBEsol formulation [37] and electronic configurations 1s22s1, 4p64d35s2, 5s25p65d36s2 and 2s22p4 are employed for Li, Nb, Ta and O, respectively. Plane waves up to a cutoff energy of 450 eV are used as a basis for the expansion of the electronic wave functions. A Gaussian smearing with width 0.02 eV is applied to the occupancies of the electronic states. For the calculations, three sets of orthorhombic supercells are employed, corresponding to , and repetitions of the orthorhombic unit cell and containing 120 atoms in all cases. These allow to model LiNb1-xTaxO3 solid solutions with concentration steps . Equilibrium volumina are estimated fitting different calculated energy-volume pairs by the Murnaghan state equation [38]:
| (6) |
where and are the bulk modulus and its first pressure derivative, respectively, both evaluated at the equilibrium volume .
Corresponding to the supercell symmetry, , and -centered Monkhorst-Pack K-point meshes [39] are used. For the calculation of the density of states (DOS) the K-point mesh was expanded to include 3240 K-points. The ionic positions are optimized, such that the Hellmann-Feynman forces acting on the ions [40] are lower than 0.005 eV/Å.
Harmonic phonon frequencies are obtained by the finite-displacement method perfomed within phonopy [41, 42]. The orthorhombic SQS are doubled in one of the cartesian axes, such that the resulting supercells used for these calculations have roughly equal lattice constants in all directions. The K-point meshes are adjusted accordingly. Due to numerical issues, small imaginary frequencies in a restricted region around are present. These frequencies are assumed to be real for the thermodynamic calculations. Moreover, for the calculation of the thermodynamic properties, the phonon frequencies are interpolated onto a 202020 K-point mesh using the Parlinski-Li-Kawazoe method [43]. This yields an error of only about 3% for the considered property compared to a 50% denser K-point mesh.
Linear optical properties are calculated at different levels of approximation using the QuantumEspresso package [44], an energy cutoff of 100 Ryd, the previously introduced K-point meshes and optimized norm-conserving Vanderbilt pseudopotentials [45]. Within the independent particle approximation (IPA), the imaginary part of the dielectric function reads as
| (7) |
with cartesian indices and , conduction and valence band indices and , respectively, band energies at K-point , and the Bloch functions . In total, 800 states are considered for the summation, for all the considered LNT crystals. Furthermore, the K-point meshes are increased to twice their previous sizes in each direction, in order to achieve convergence of the dielectric function up to around 10 eV. The real part of is calculated via Kramers-Kronig relations. With the knowledge of the dielectric function, basic optical properties such as the frequency dependent refractive index can be calculated:
| (8) |
Quasiparticle energies are calculated within G0W0 approximation using the generalized plasmon pole model as implemented in the software package BerkeleyGW [46, 47]. We calculate the energy corrections for about 130 electronic bands centered around the highest valency band, using the same K-Point meshes as for the optical calculations in DFT. As these calculations are computationally quite demanding, we only consider one SQS for the selected Ta concentrations.
II.3 Experimental setup
LNT crystals in the composition range are measured experimentally by means of absorption spectroscopy in the ultraviolet (UV) and visible (VIS) spectral range, i.e. in the energy range from 1.0 eV to 5.0 eV, to verify the theoretical predictions. We use crystal samples polished on both sides to optical quality (/10) with thicknesses in the range of approx. 1 mm and dimensions of approx. 10 mm 10 mm. The samples were prepared from commercially available wafers (LN, LT from the Precision Microoptics USA Inc.) or from crystal boules which are grown as single crystals using the Czochralski method (LNT, IKZ Berlin). A commercial UV/VIS two-beam photospectrometer (UV-3600, Shimadzu Deutschland GmbH) is used for the measurement series, which was extended with a closed-cycle helium cryostat (RDK 10-320, Leybold GmbH) with optical quartz windows. Here, the samples are placed against a copper-pinhole on the cooling finger of the cryostat and are temperature modulated in the range of 30 K to 200 K in steps of 10 K. The combined use of a deuterium lamp (280 nm) and halogen lamp (280 nm) for probe light generation together with a multialkali photomultiplier tube for detection makes it possible to capture the spectral range in which the position of the optical absorption edge is expected for all crystal samples (spectral resolution of 5 nm FWHM). All spectra for each temperature point are corrected for optical losses induced by the cryostat setup via the difference spectra with and without a sample in the optical beam path.
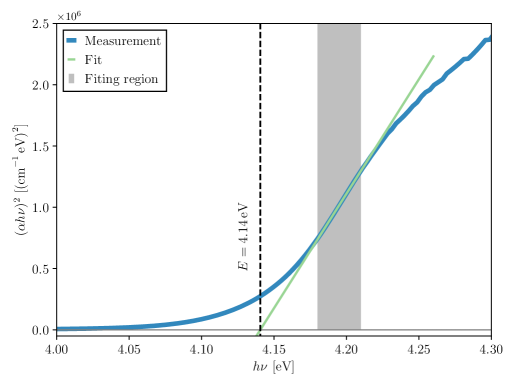
For analysis of the optical absorption gap, the spectra are linearized using the Tauc method [48, 49, 50, 51]
| (9) |
Where is chosen for the direct, moment conserving band to band transition and for transitions under participation of lattice phonons. The linearized region is fitted according to equation 9.
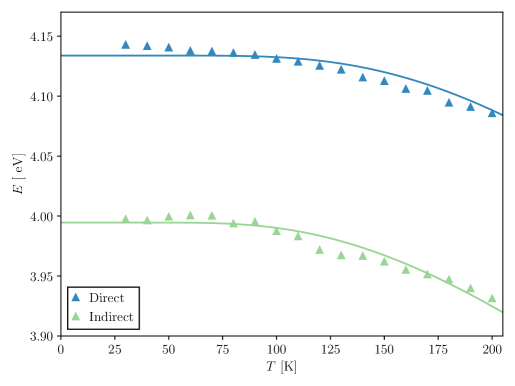
The procedure is exemplary depicted for the direct transition of lithium niobate in figure 2. Band gap energies are determined by extrapolation of the linear fit to the intercept with the abscissa, which thus defines the band gap. This analysis is performed for both transition types (direct and indirect) over all investigated temperatures and samples. The temperature dependence of the optical band gap is empirically modelled as described in Ref. [52] via:
| (10) |
where denotes a dimensionless electron-phonon coupling strength and a system average effective coupling phonon energy according to Huang and Rhys [53]. Optical band gap values for absolute zero are found by fitting of equation 10 to the experimental data as shown in figure 3. The procedure is equivalently performed for all investigated samples.
III Results
III.1 Structural properties
Crystals belonging to the trigonal group are usually described either by a hexagonal or by a rhombohedral unit cell. Moreover, a supercell of orthorhombic symmetry such as the SQS employed in this work is used for the specification of the materials properties that are described by tensors such as the electro-optic or piezoelectric coefficients [54]. In this work, we discuss the lattice paramters of the hexagonal structure, which can be readily converted into the rhombohedral lattice parameters as described in Ref. [15].
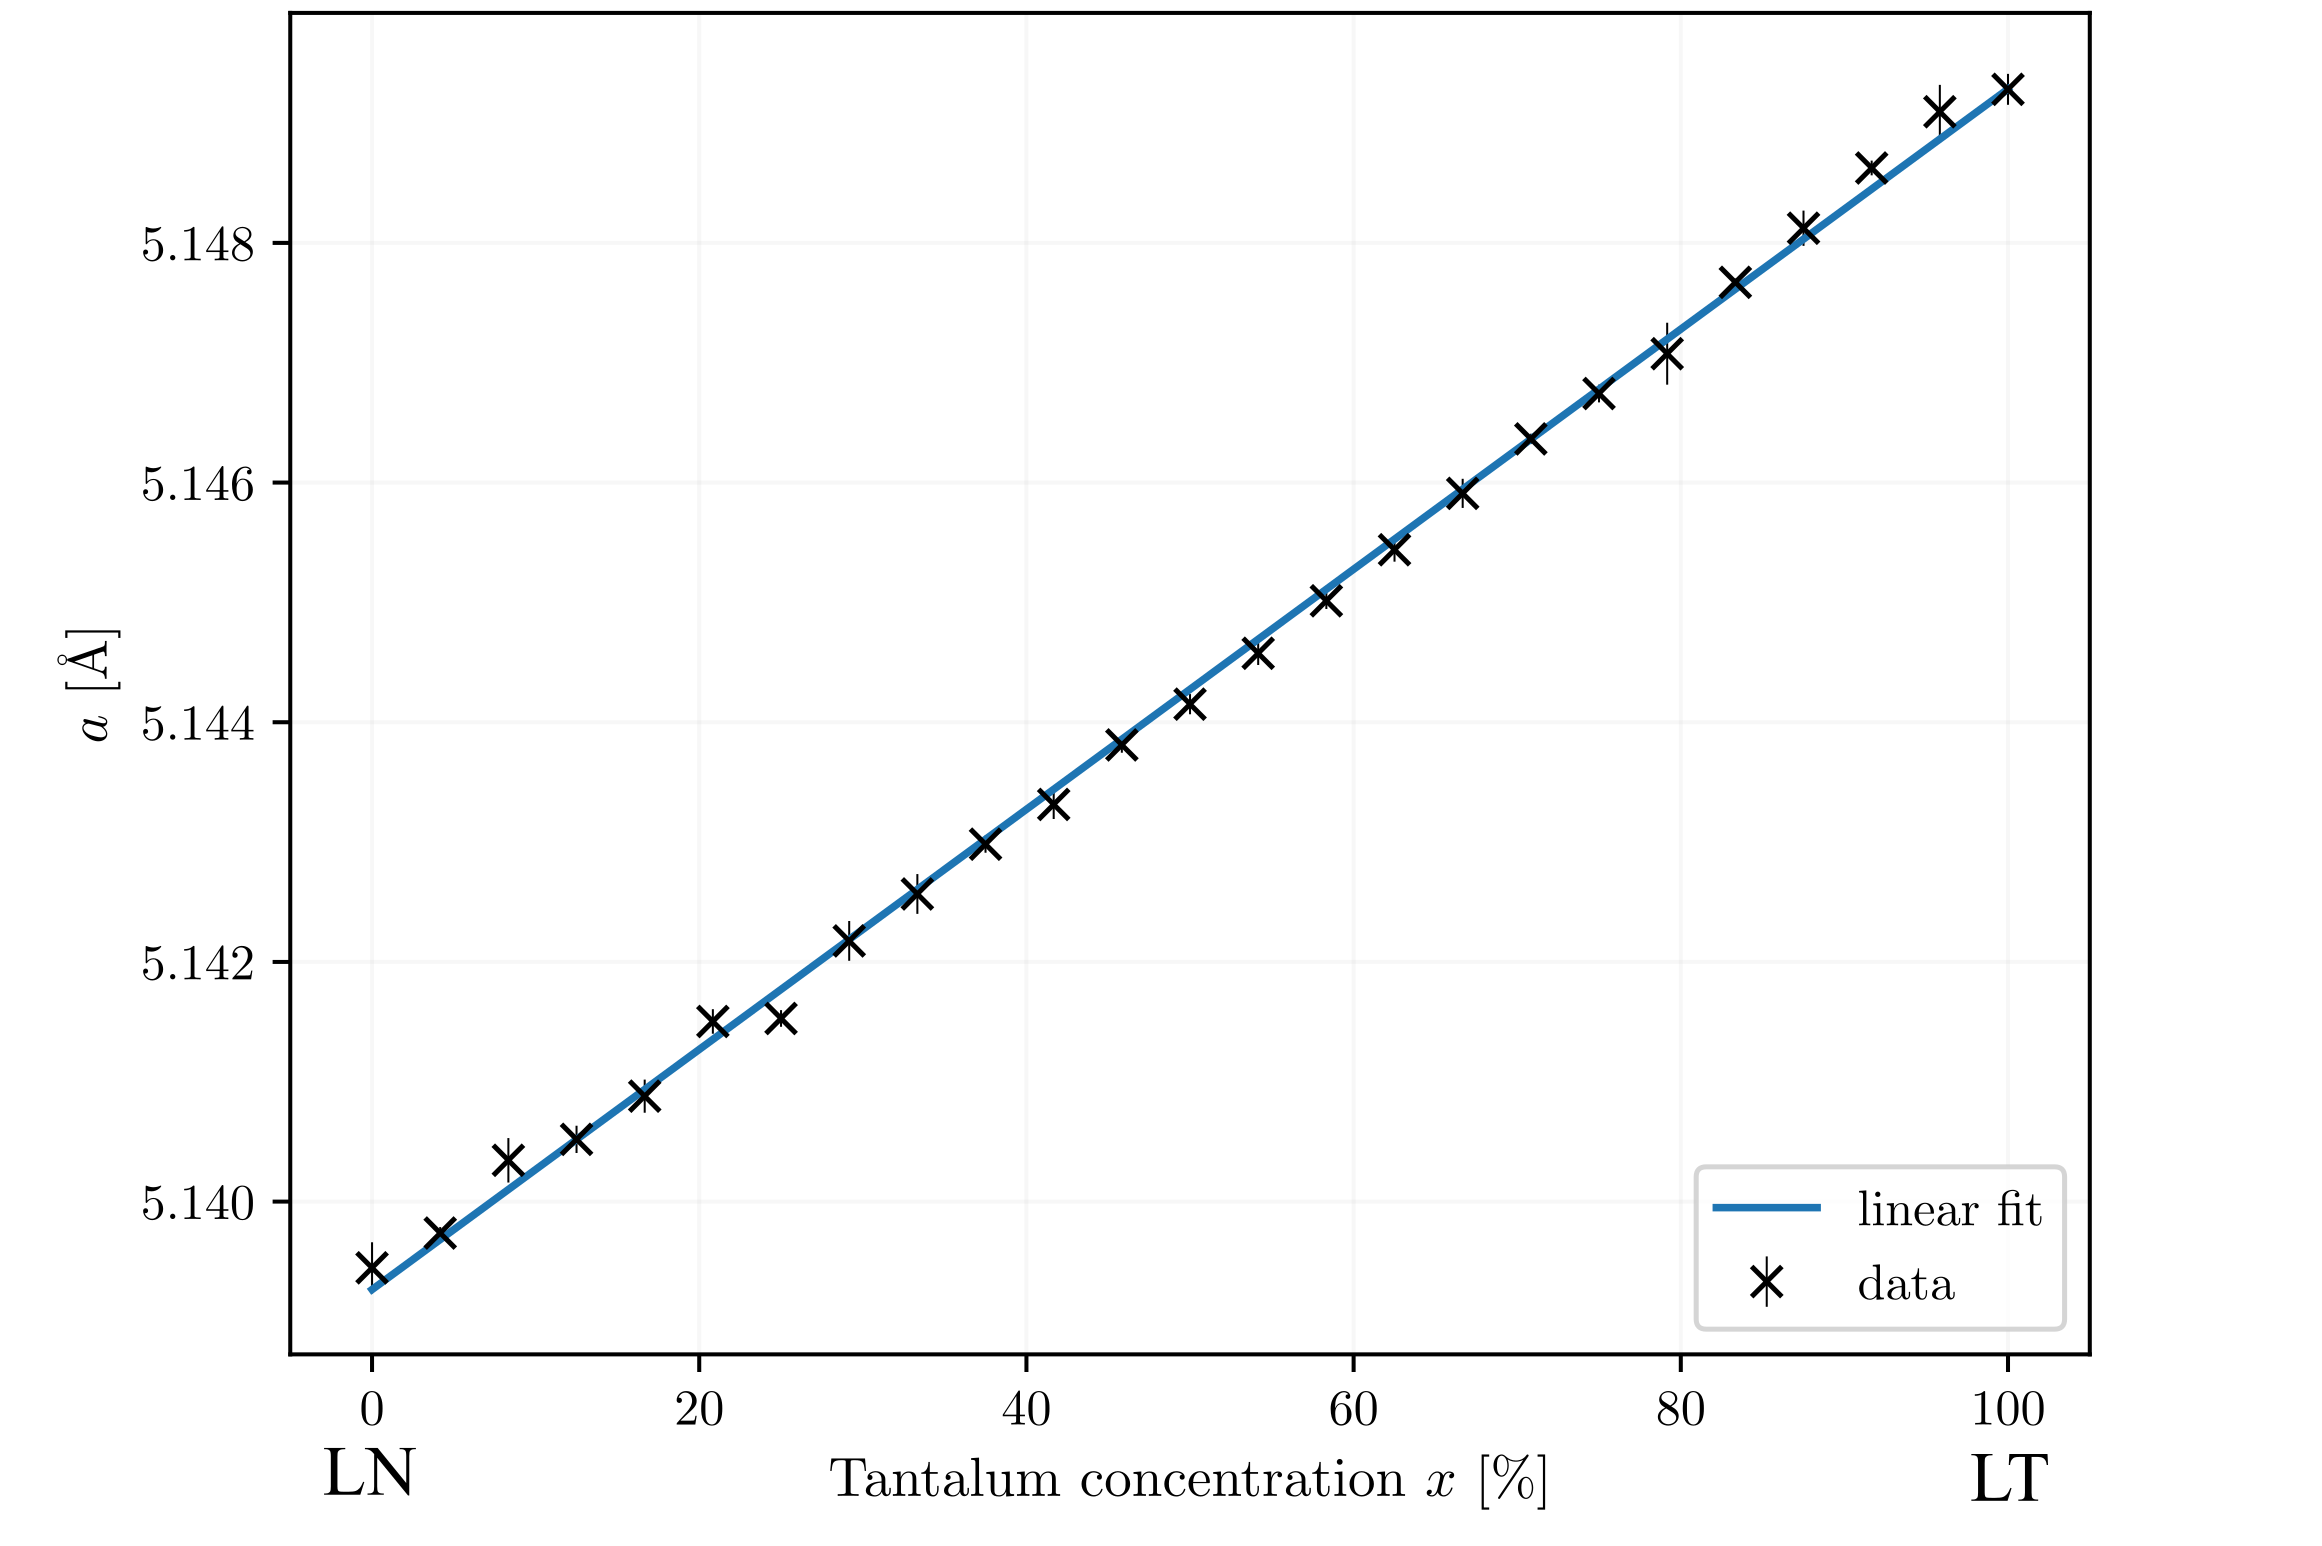
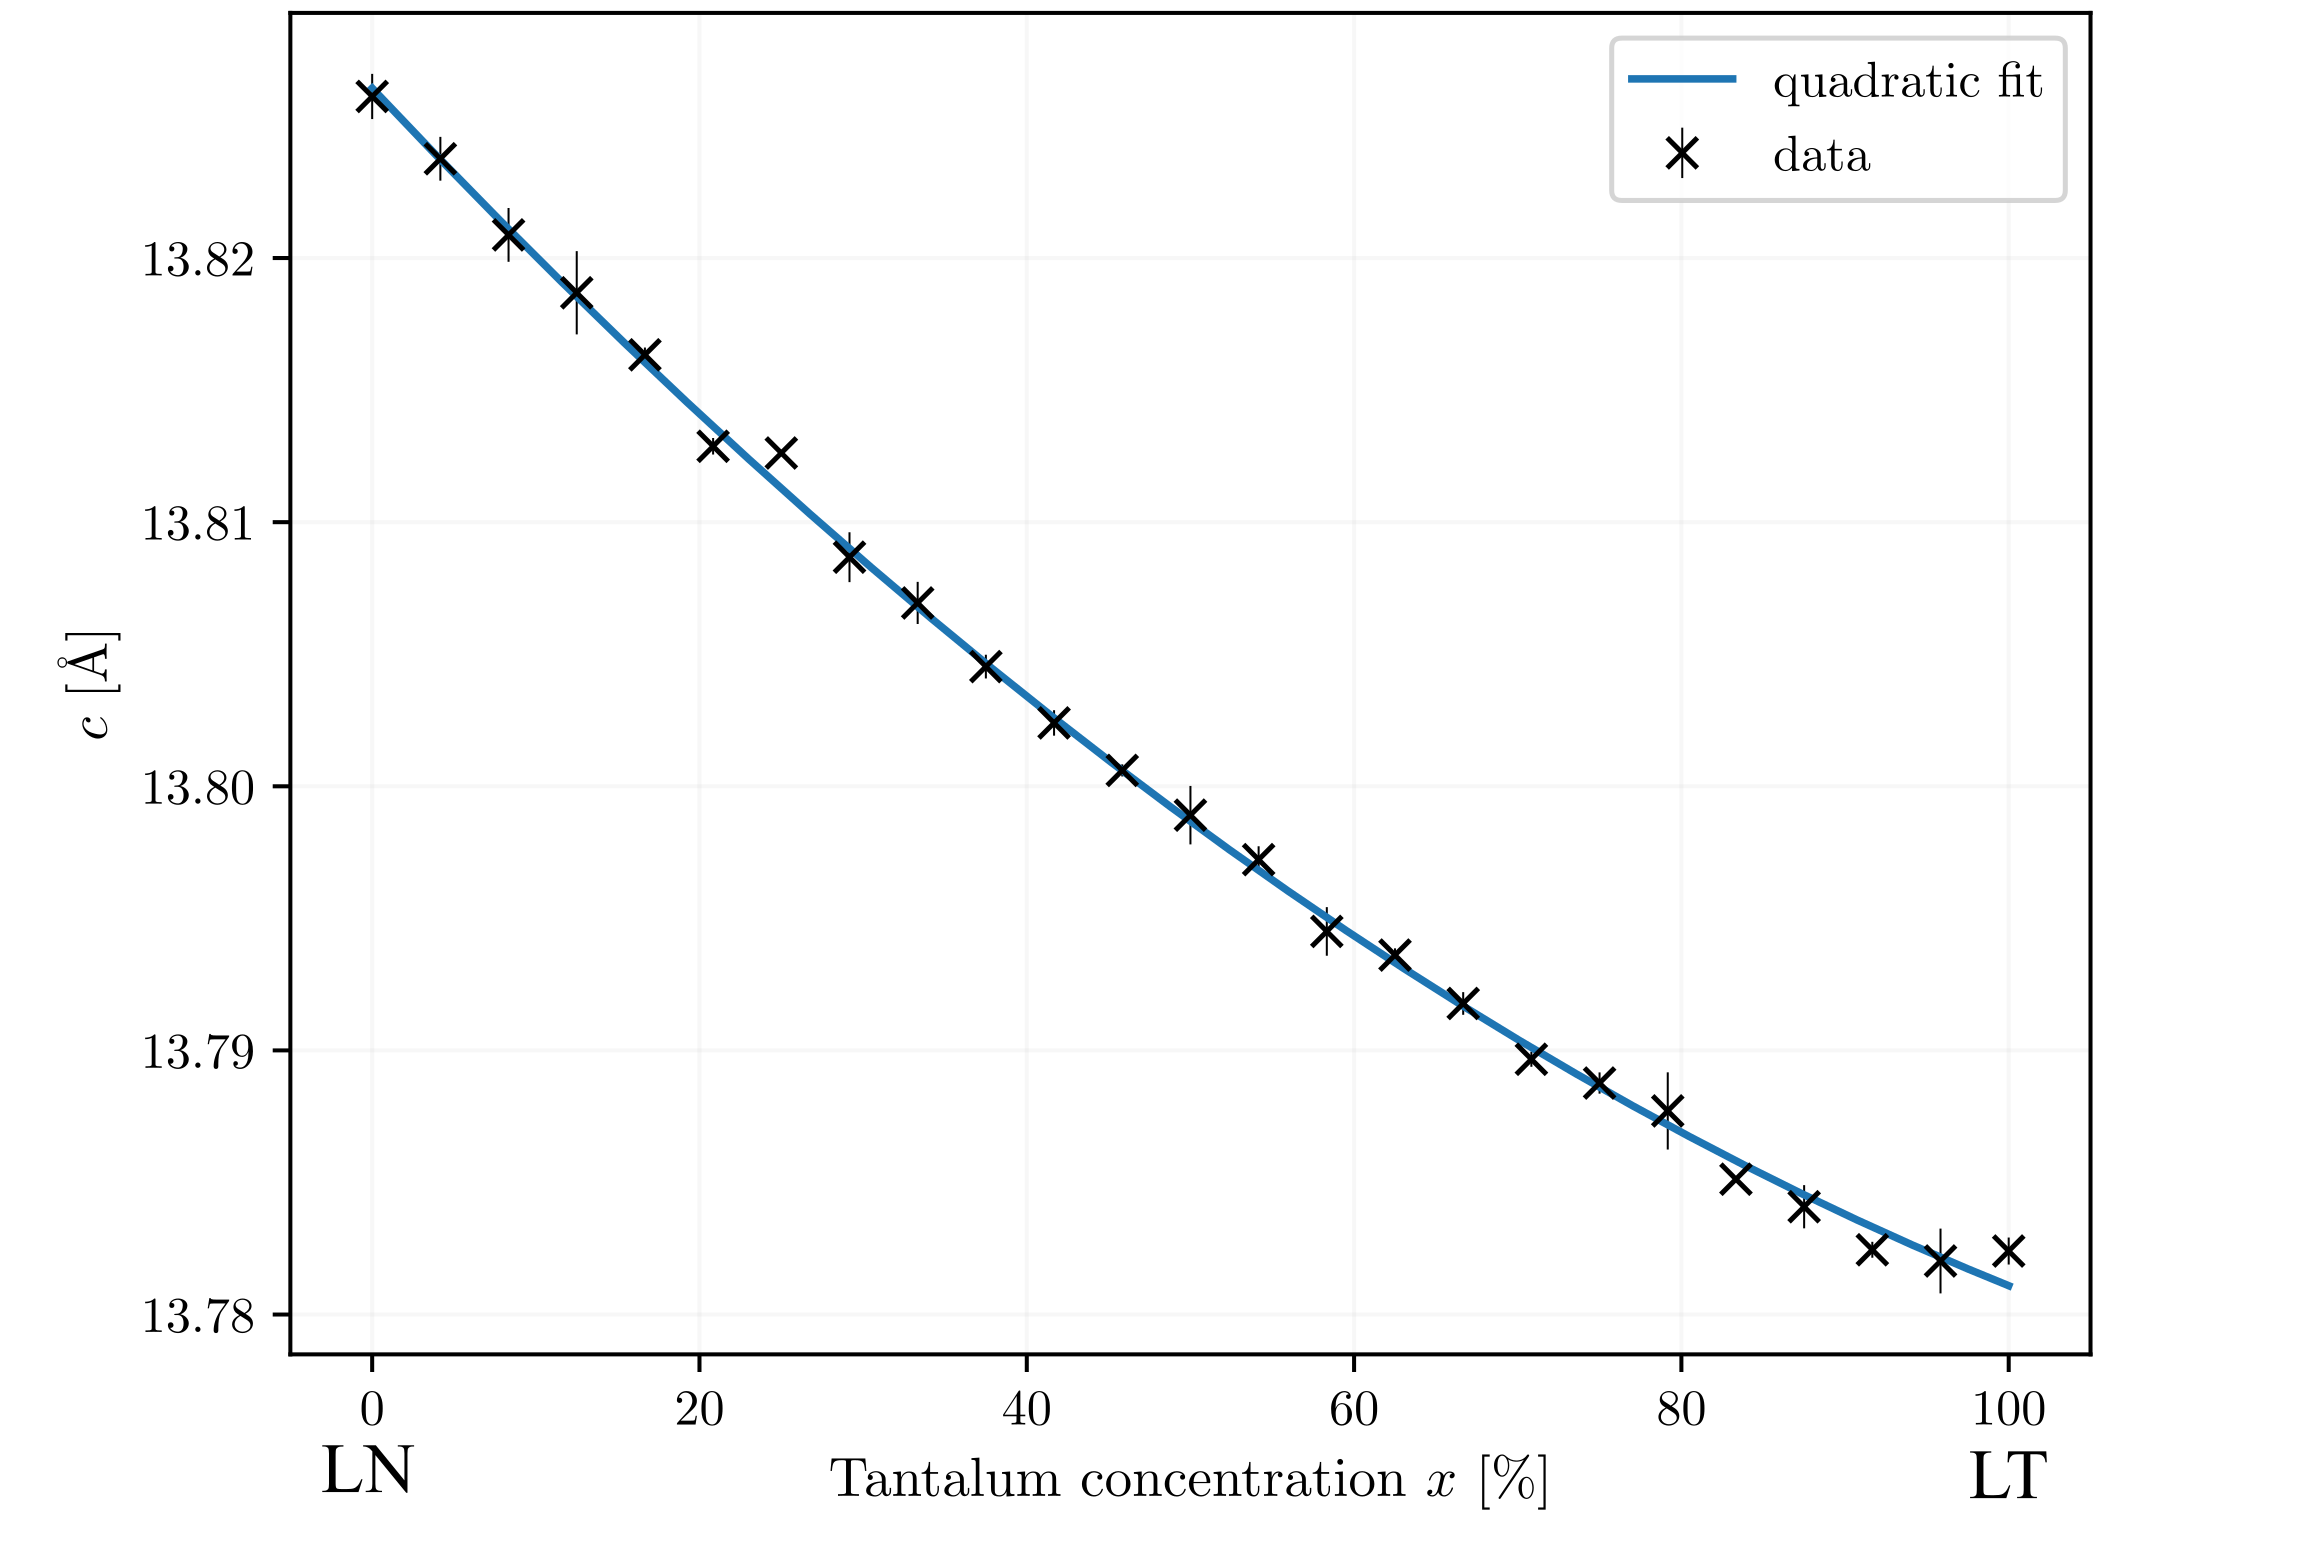
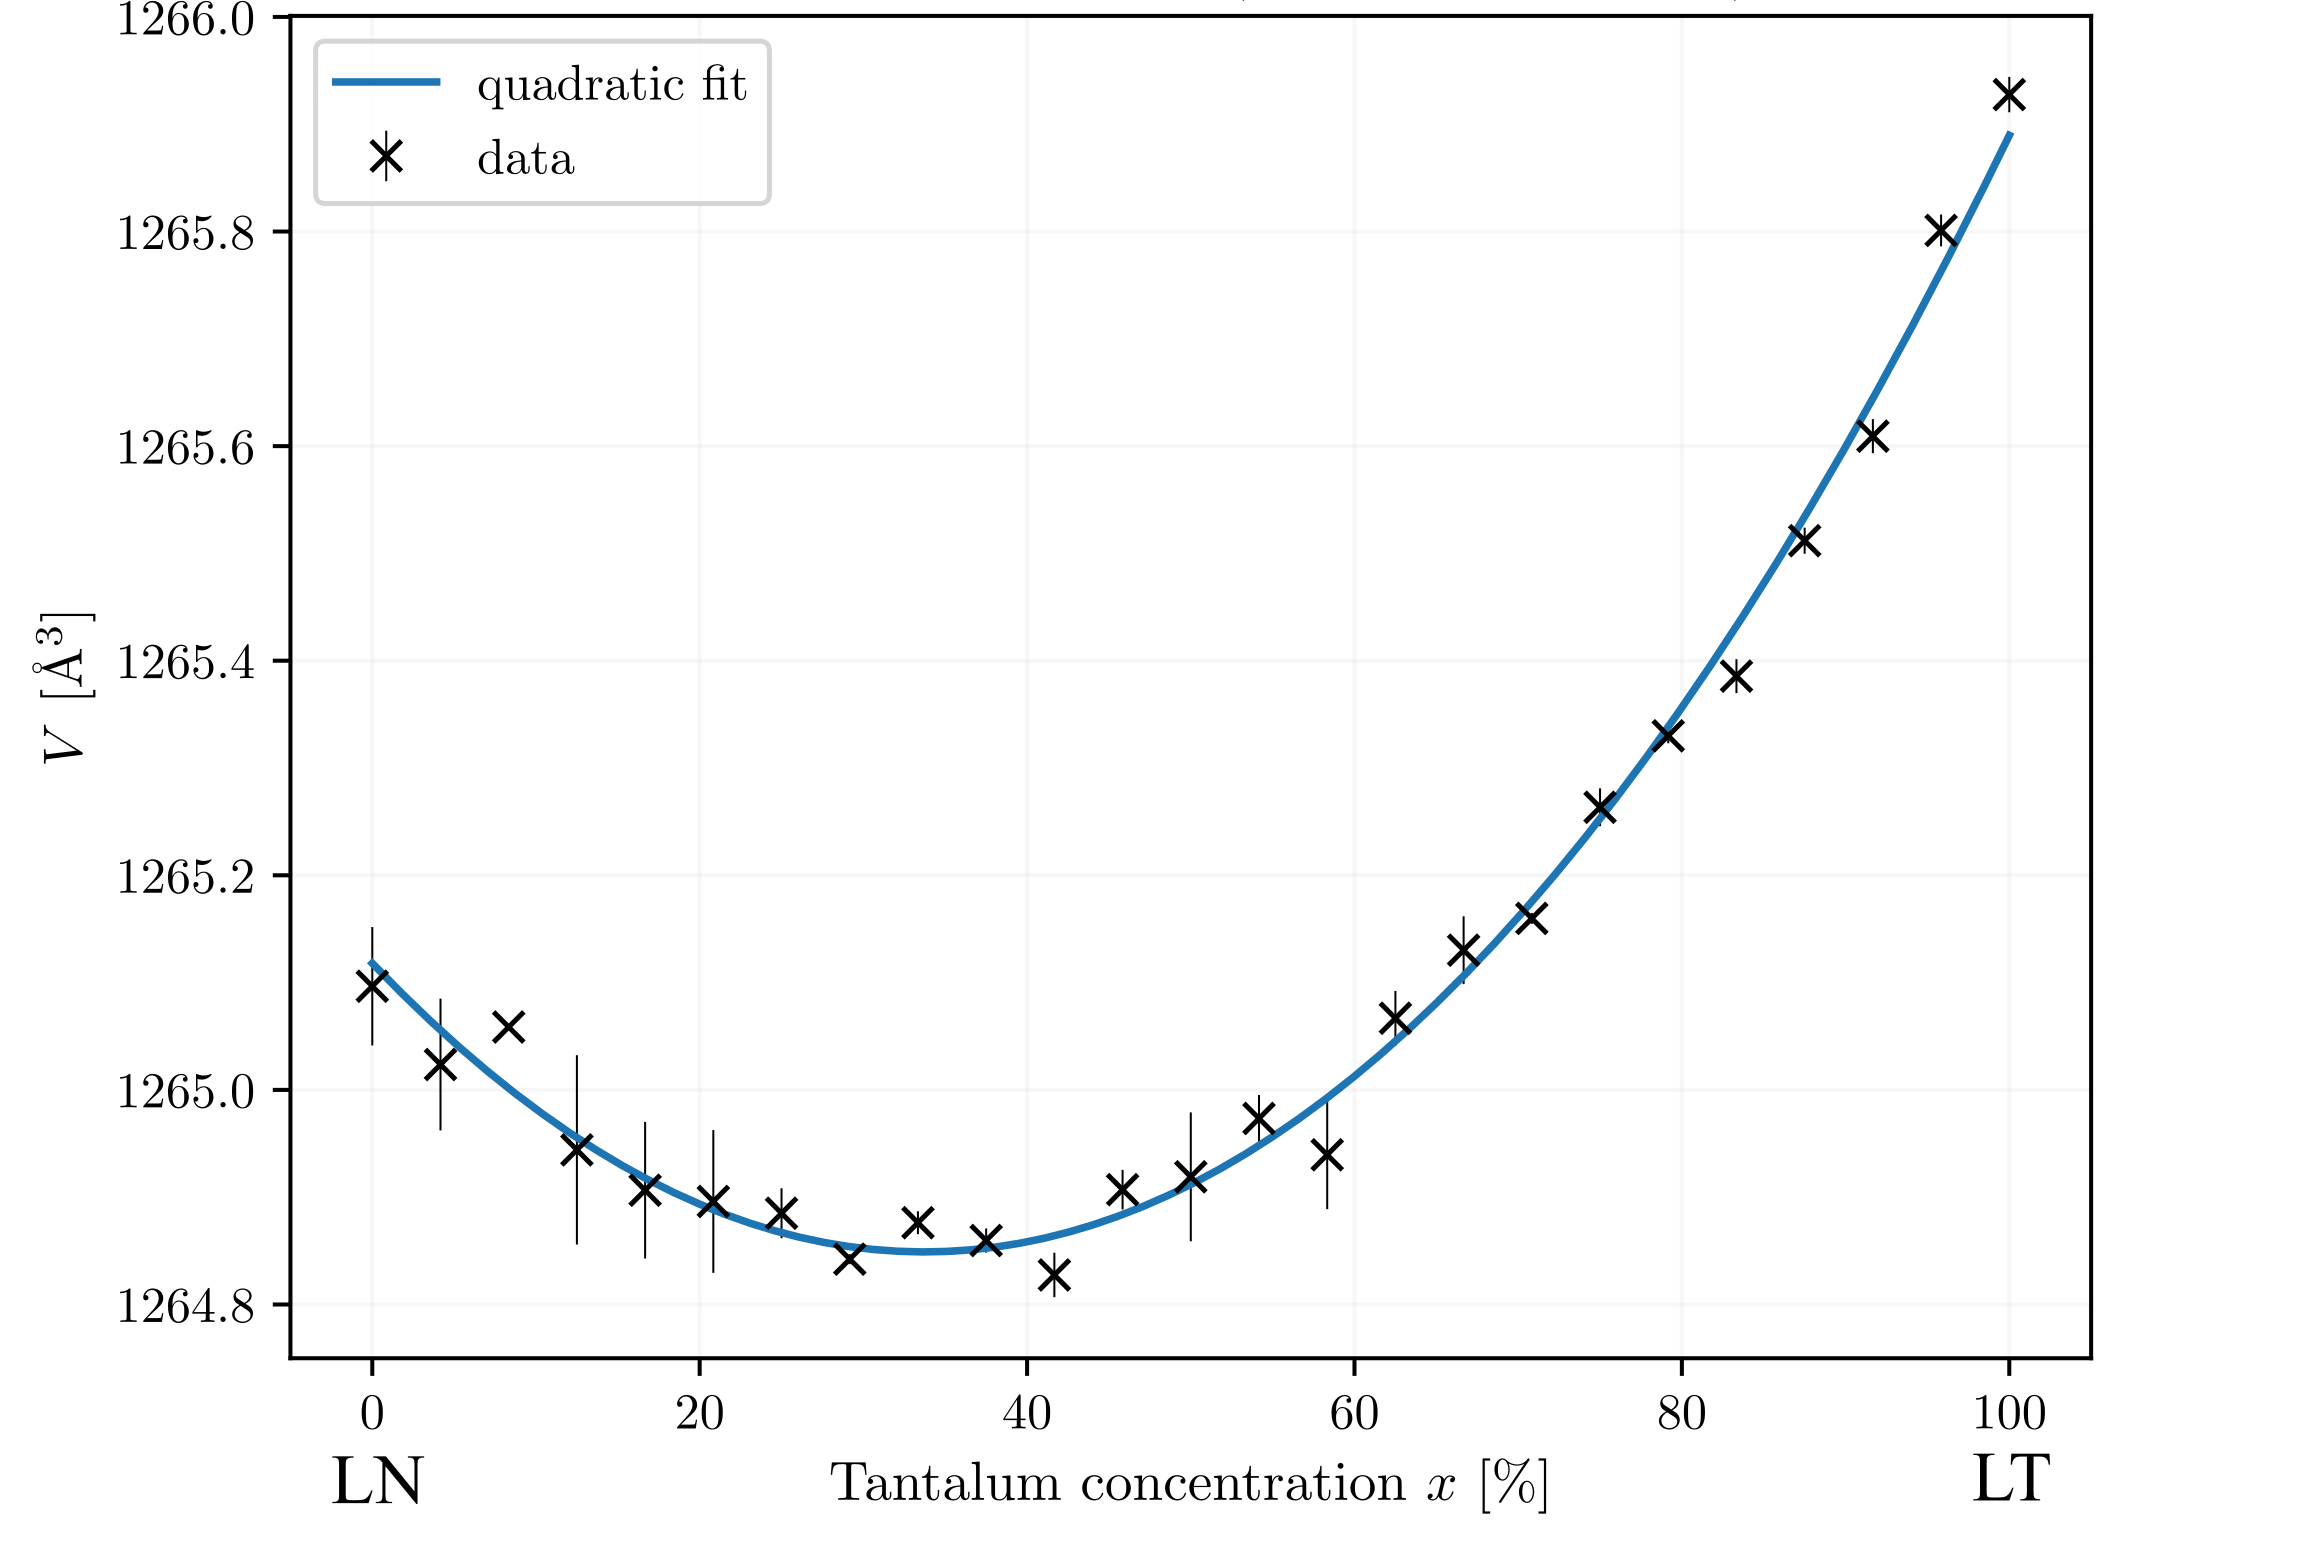
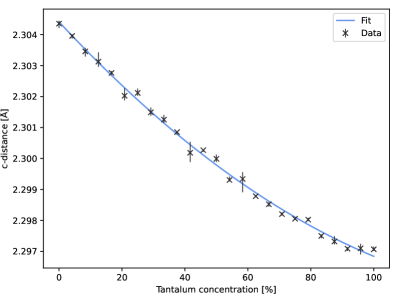
The structural properties of the LiNb1-xTaxO3 solid solutions as a function of the composition are shown in table 1 and figure 4. The values calculated with different SQS are slightly different, in particular if SQS of different supercell symmetry are employed. Therefore, we show in figure 4 the values averaged over all employed supercells of a given composition. The error bars show the largest deviations from the mean value obtained using different SQS.
The lattice parameter (figure 4, upper panel), which describes the basal plane of the hexagonal structure, varies only in a small range (about 0.2 %) and grows rather linearly with the composition, with a dependence which is nicely described by the Vegard law:
| (11) |
Thus, the composition can be exploited to a certain extent to optimize the in-plane lattice matching of LNT thin films on different substrates. The lattice parameter , describing the height of the hexagonal cell, decreases sub-linearly with the Ta content, instaed. The crystal volume (figure 4, lower panel) has a pronounced non-linear dependence on the composition. A minimum volume of ca. 316.19 Å3 per rhombohedral unit cell is calculated for solid solutions with a Ta content of about 40 %.
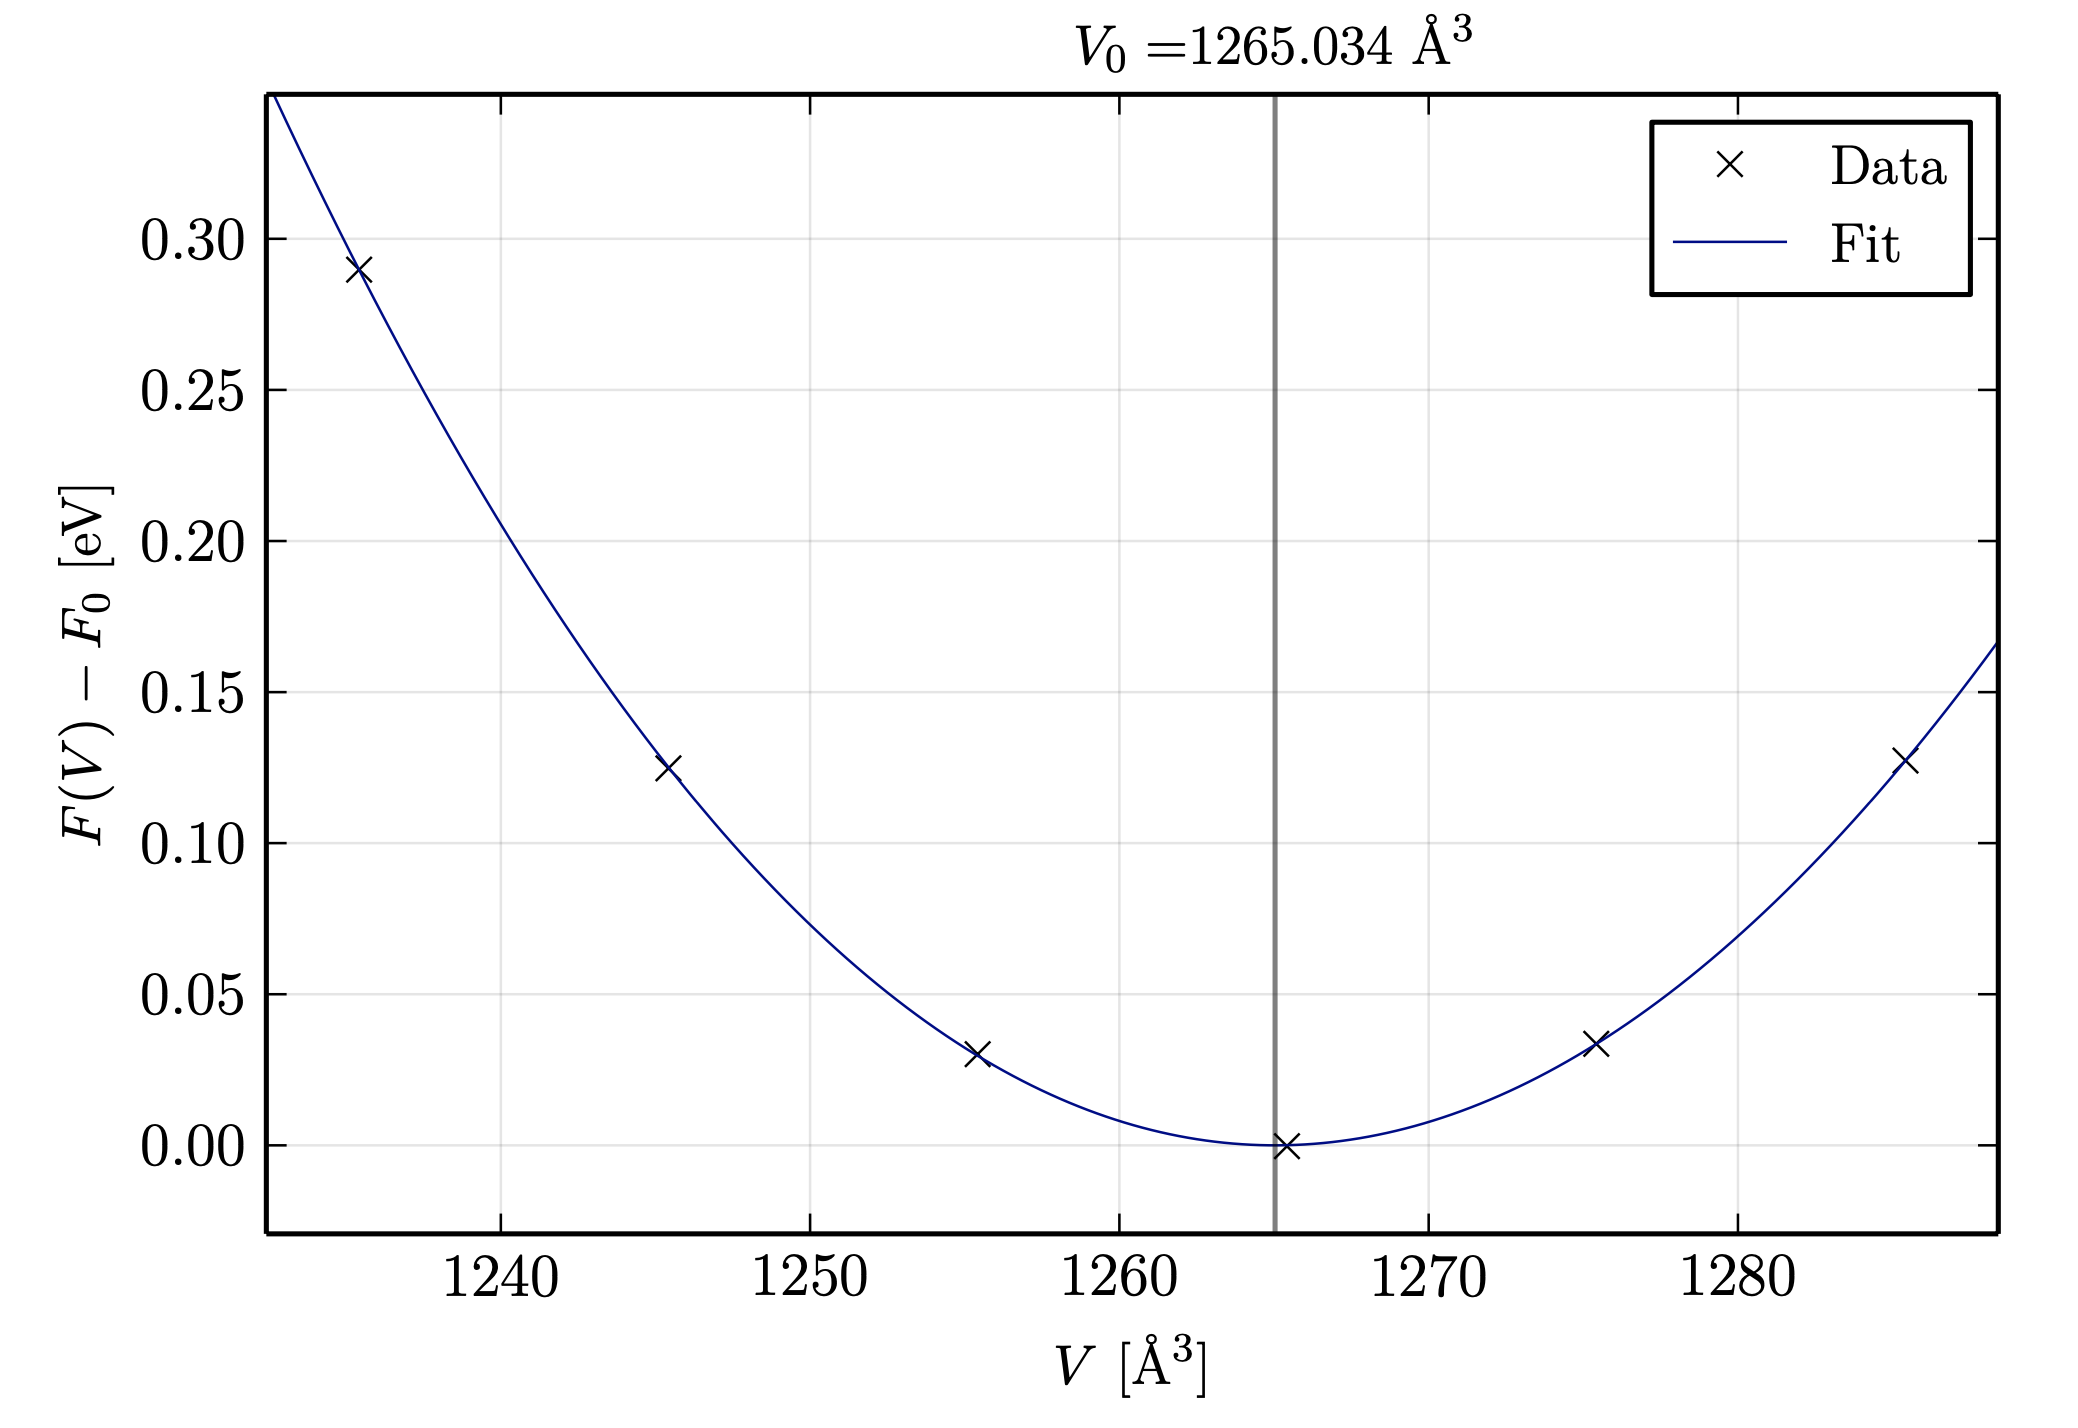
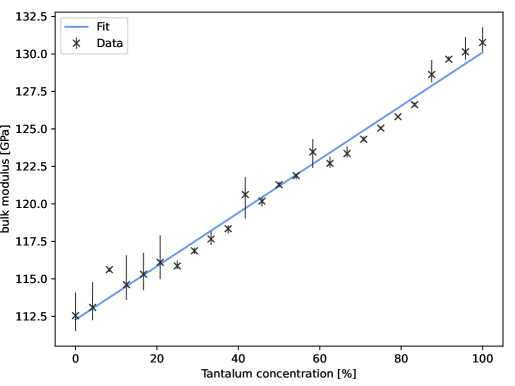
The bulk modulus and its first derivative with respect to the pressure are calculated by fitting the energy-volume curves (calculated at K) to the Murnaghan equation (see equation 6). This is shown exemplarily for (pure LiTaO3) in figure 5. The values calculated for the parent compounds (=130.8 GPa, =3.51 and =112.6 GPa, =5.9) are in good agreement with available experimental values [55] as well as with other theoretical results ( =124 GPa and =102 GPa [56]). Between the end compounds, the bulk modulus varies almost linearly with the composition, as shown in figure 6.
| 0.0 | 5.139 | 13.826 | 316.279 | 112.553 | 5.859 |
|---|---|---|---|---|---|
| 4.2 | 5.140 | 13.824 | 316.257 | 113.102 | 6.081 |
| 8.3 | 5.140 | 13.821 | 316.271 | 115.619 | 3.958 |
| 12.5 | 5.140 | 13.819 | 316.222 | 114.620 | 5.862 |
| 16.7 | 5.141 | 13.816 | 316.241 | 115.320 | 5.797 |
| 20.8 | 5.141 | 13.813 | 316.194 | 116.110 | 5.671 |
| 25.0 | 5.141 | 13.812 | 316.206 | 115.865 | 6.552 |
| 29.2 | 5.142 | 13.809 | 316.176 | 116.873 | 6.040 |
| 33.3 | 5.142 | 13.807 | 316.208 | 117.668 | 5.909 |
| 37.5 | 5.142 | 13.805 | 316.141 | 118.352 | 5.922 |
| 41.7 | 5.143 | 13.802 | 316.182 | 120.630 | 4.761 |
| 45.8 | 5.143 | 13.801 | 316.185 | 120.188 | 5.671 |
| 50.0 | 5.144 | 13.799 | 316.194 | 121.282 | 5.428 |
| 54.2 | 5.144 | 13.797 | 316.200 | 121.890 | 5.431 |
| 58.3 | 5.145 | 13.795 | 316.207 | 123.472 | 4.999 |
| 62.5 | 5.145 | 13.794 | 316.191 | 122.707 | 5.648 |
| 66.7 | 5.146 | 13.792 | 316.277 | 123.363 | 5.693 |
| 70.8 | 5.146 | 13.790 | 316.259 | 124.315 | 5.589 |
| 75.0 | 5.147 | 13.789 | 316.301 | 125.053 | 3.315 |
| 79.2 | 5.147 | 13.788 | 316.310 | 125.821 | 5.655 |
| 83.3 | 5.148 | 13.785 | 316.365 | 126.618 | 5.694 |
| 87.5 | 5.148 | 13.784 | 316.367 | 128.627 | 4.528 |
| 91.7 | 5.149 | 13.782 | 316.405 | 129.654 | 4.906 |
| 95.8 | 5.149 | 13.782 | 316.451 | 130.147 | 3.499 |
| 100.0 | 5.149 | 13.782 | 316.485 | 130.773 | 3.518 |
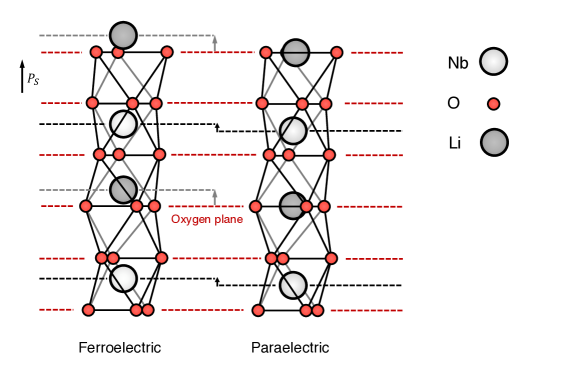
Strictly connected with the composition dependent change of the structural parameters is the spontaneous polarization of LiNbO3 and LiTaO3. originates from a separation of the centers of mass of the positive and negative charges, which results in an electric dipole moment in each unit cell (see figure 7). Although all the ions in the two oxides are nominally isovalent, the spontaneous polarization decreases from 71 C/cm2 for LiNbO3 [57] to 60 C/cm2 for LiTaO3 [58], respectively. This effect can be mainly traced back to the different relative position of anions and cations in the two materials. The latter is discussed in the following as a function of the composition.
The relative position of the ions within the solid solutions depends, as revealed by our models, on the composition. Figure 8 shows the average distance of the Nb ions (left panel) and of the Ta ions (right panel) from the closest oxygen layer perpendicular to the -axis as a function of the composition. The oxygen layer represents the top of the oxygen octahedra containing the Nb or Ta ions and higher distances from this layer correspond to points closer to the center of the octahedra. The latter represents the Ta and Nb positions in the paraelectric phase. For a given concentration, Ta ions are in general closer to the cage center than the Nb ions (see different scales of the plots in figure 8). This reflects the higher spontaneous polarization in LiNbO3 than in LiTaO3. The distances of both the Nb and Ta cations from the oxygen layer increase roughly linearly with the Ta concentration. This denotes a movement of both species towards the cage center and corresponds, again, to a decrease of the spontaneous polarization from LiNbO3 to LiTaO3.
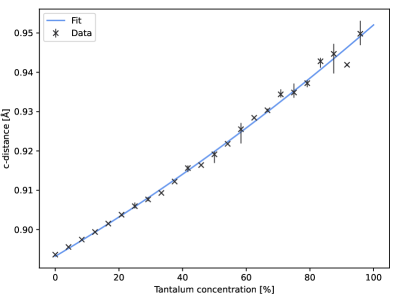
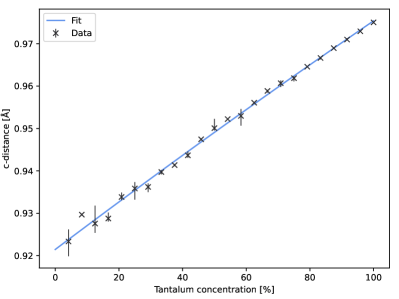
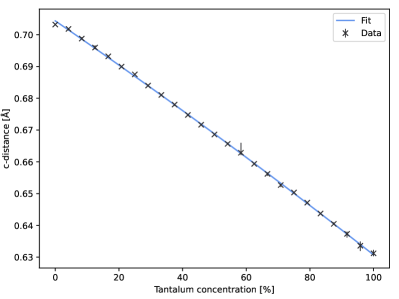
Figure 9 shows the average distance of the Li ions from the closest oxygen layer perpendicular to the -axis as a function of the Ta content. The roughly linearly decreasing distances thus denote a movement towards the oxygen layer, representing the average position of the Li atoms in the paraelectric phase. Also in this case the composition dependence of the average position points out a decreasing spontaneous polarization from LiNbO3 to LiTaO3.
Finally, figure 10 shows the average distance between the oxygen layers perpendicular to the -axis as a function of the composition. The interlayer distances are only slightly affected by the composition, although a very minor, sublinear decrease can be discriminated. This suggests that the oxygen octahedra are slightly more compressed for increasing Ta concentration.
Summarizing, the relative position of anions and cations in LiNb1-xTaxO3 solid solutions varies roughly linearly from LiNbO3 to LiTaO3 and explains, at least qualitatively, the corresponding decrease of the spontaneous polarization.
III.2 Electronic properties
Vegard’s law holds not only for the lattice parameters, but also for the fundamental electronic bandgap of many binary semiconducting systems at thermal equilibrium:
| (12) |
Previous calculations modelling a few compositions of LNT solid solutions as small, ordered crystals have predicted deviations from the behavior described by equation 12 [22]. Deviations from the Vegard’s law can be quantified by a bowing parameter , which can be negative (sub-Vegard behavior) or positive (super-Vegard behavior):
| (13) |
In Ref. [22], bowing factors of -0.6 eV and -0.3 eV are calculated within the independent particle approximation (IPA) and within the independent quasiparticle approximation (IQA), respectively. The SQS employed in this work allow to investigate this aspect more precisely.
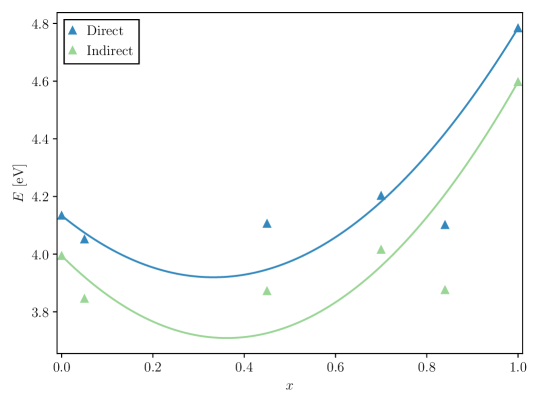
The electronic band structures of the solid solutions (not shown in this work), feature the same flat dispersion known for the end compounds LiNbO3 and LiTaO3 [59]. The direct bandgap (which is always located at the -point, independently on the concentration and on the particular SQS) and the indirect bandgap as calculated within DFT in the independent particle approximation are shown in figure 11. Deviations from Vegard’s behavior are evident, with a bowing factor quantified in -0.5 eV (both for the direct and indirect bandgap), in substantial agreement with Ref. [22]. The (indirect) bandgap minimum is predicted for solid LNT solutions with a Ta content of 34.3%.
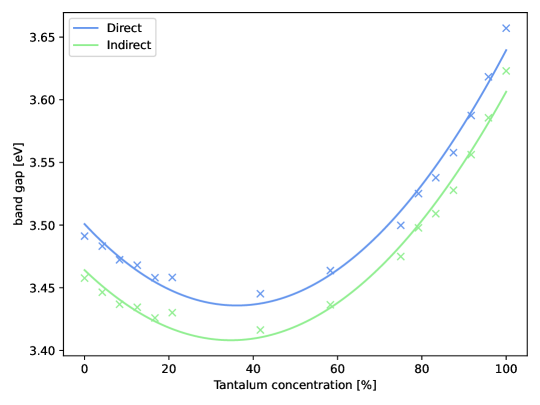
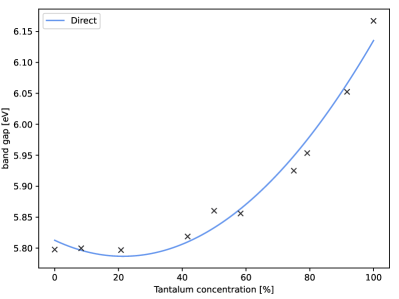
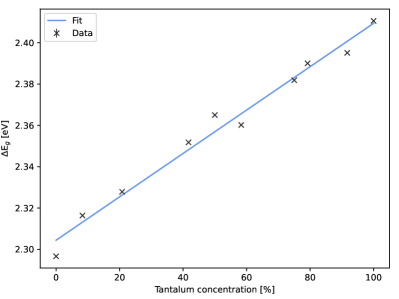
Figure 12 (lhs) shows the composition dependence of the fundamental gap if many-body effects are considered. As expected, the GWA yields a larger direct electronic band gap compared to the DFT-IPA calculations. The broadening of the gap depends linearly on the composition and is more pronounced for higher Ta concentrations, as shown in figure 12 (rhs). The linear dependence of the quasiparticle shifts on the concentration does not substantially modify the magnitude of the bowing parameter (-0.56 eV), however the minimum of the electronic bandgap is shifted to lower concentrations (21.2%).
The predicted nonlinear dependence of the direct and indirect bandgap on the Ta content is highly relevant, as it non trivially affects the optical response of LNT based electro-optic devices and waveguides. Although a similar dependence is known at high [60] or room temperatures from nanoparticles [61], we verify experimentally the theoretical predictions for single domain crystals in the limit of 0 K. Thereby we perform reflectance spectroscopy measurements at low temperatures and extrapolate the 0 K behavior as described in the experimental section.
The band gap values depicted in blue and green figure 13 show the values for the found direct and indirect electronic transitions, respectively. Although some uncertainty may derive from the chosen fitting procedure, the measurements clearly demonstrate a deviation from the Vegard behavior, confirming the DFT calulations. In further agreement with the theoretical results, the composition dependence of the direct and indirect bandgap is nearly identical, and the direct gap can be obtained in first approximation by a rigid vertical shift of about 0.3 eV of the indirect bandgap, almost irrespective of the concentration.
Differently from the theoretical predictions, which can be nicely fitted by a second order polynomial, the experimental data display a certain scattering. We trace the scattering to a inherently different crystal quality. Due to the highly challenging growth procedure, different samples may indeed feature, e.g., homogeneity differences.
When comparing theoretical and experimental values, a word of caution is in order. We remark that we are comparing the calculated electronic bandgap with the measured optical bandgap. The latter includes excitonic effects that are not considered in our theoretical models. Although the agreement between experimental and theoretical data mut be considered of qualitative nature, the measurements put the nonlinear dependence of the fundamental bandgap on the Ta content beyond any doubt. Unfortunately, they do not reveal the origin of the nonlinear dependence.
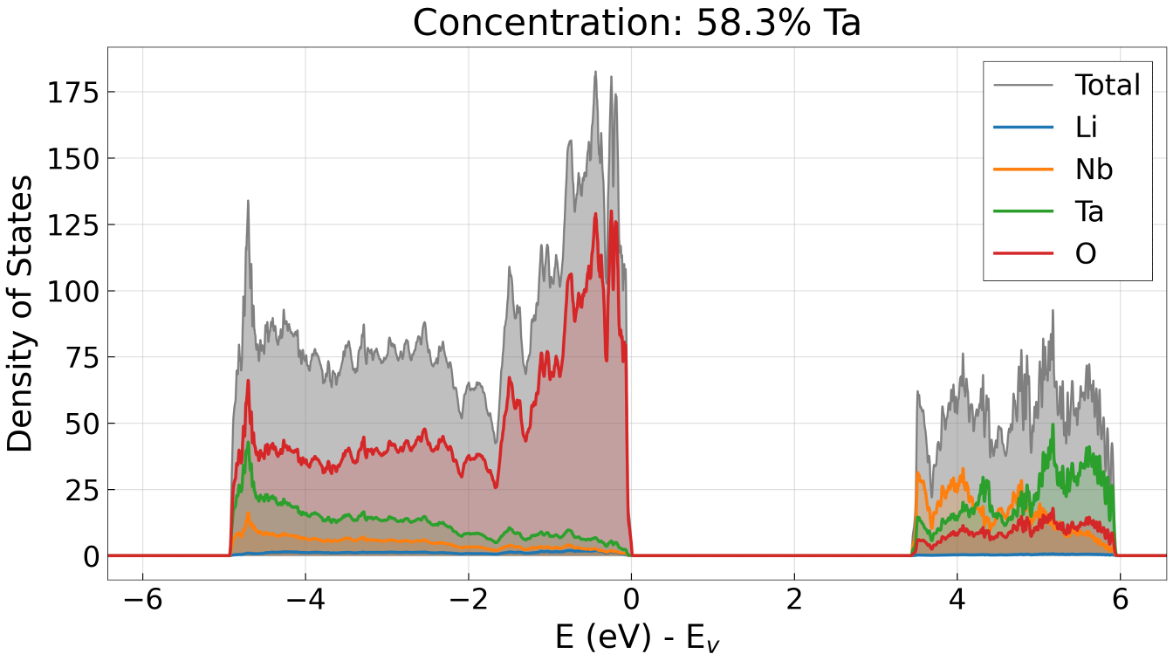
The density of states provides an interpretation for this behavior. The upper panel of Figure 14 shows the DOS exemplarily for the LiNb0.42Ta0.58O3 solid solution (grey line) as well as the site projected DOS, demonstrating the contribution of the single species in an energy region around the fundamental gap. The partial DOS is calculated by projection of the electronic wavefunction on spherical harmonics centered at ion . The DOS reveals that the valence band top has mainly O character, while the conduction band bottom is a O-Nb/Ta hybrid, as known for the parent compounds LN and LT [62],
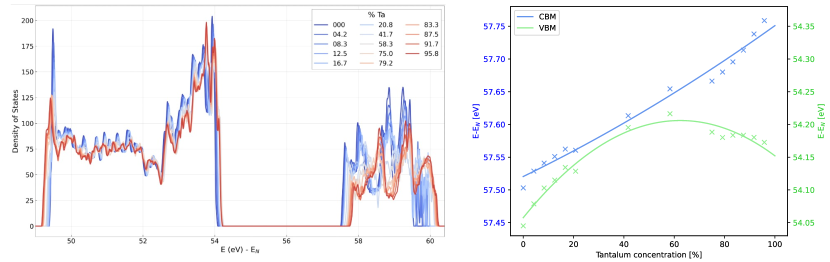
The lhs panel of Figure 15 shows the total DOS of LNT solid solutions as a function of the composition. Interestingly, the band edges shift toward higher energies with the Ta concentration. However, while the conduction band minimum shifts rather linearly, the position of the valence band maximum is a nonlinear function of the concentration. In particular, for low Ta content the valence band edge rapidly moves upwards, thus reducing the fundamental gap. For higher Ta content, the valence bad maximum hardly moves, while the conduction band minimum still linearly rises with the Ta concentration, so that the electronic bandgap becomes larger. This dependence is explicitly shown in the rhs panel of Figure 15.
III.3 Thermodynamical properties
Further thermodynamical properties of the solid solutions are derived from the lattice dynamics calculated as described in the methodological section. The phonon dispersion of the end compounds calculated within the described approach can be found elsewhere [62]. The heat capacity, e.g., can be computed in harmonic approximation from the dynamical properties (i.e., with the knowledge of the phonon dispersion) [63] according to equation 14:
| (14) |
where denotes the frequency of phonon mode at q-point , and and denote the Boltzmann constant and the temperature, respectively.
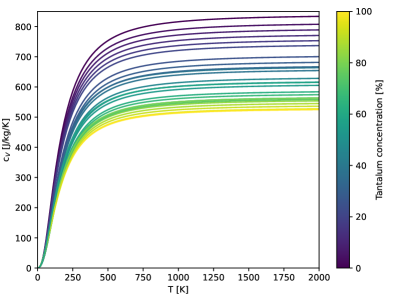
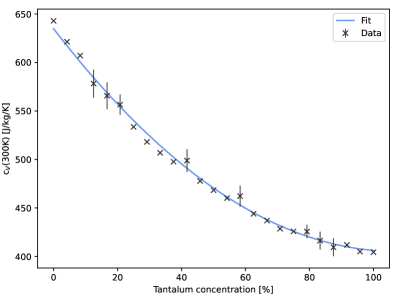
The heat capacity continuously decreases with the Ta content from LiNbO3 to LiTaO3, as shown in figure 16 (lhs). Considering at a given temperature, e.g., 300 K as shown in figure 16 (rhs), it becomes clear that the heat capacity decreases sub-linearly with the Ta content. The values calculated for the end compounds LiNbO3 (0.64 Jg-1K-1) and LiTaO3 (0.40 Jg-1K-1) are in very good agreement with experimental (0.70 Jg-1K-1 at 303 K for nearly stoichiometric LiNbO3 [64] and 0.42 Jg-1K-1 for LiTaO3 [65]) as well as theoretical results [63] available in the literature for .
In order to extract the Debye temperature from the calculated heat capacity, the result is fitted to the Debye model:
| (15) |
Due to the model character of equation 15, the numerical results strongly depend on the temperature range considered for the fit. Performing the fit between 0 and 20 K, e.g., a Debye Temperature K for LiNbO3 is obtained, which perfectly matches a previously calculated value of 574 K [63] and is in good agreement with the experimentally determined value of 593 K [66]. Moreover, our calculations show that the Debye temperature of the solid solutions grows roughly linearly with the Ta content.
III.4 Optical properties
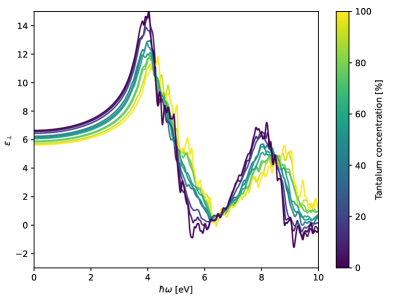
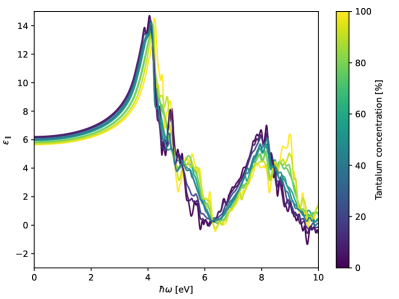
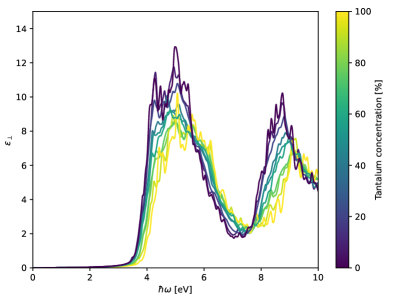
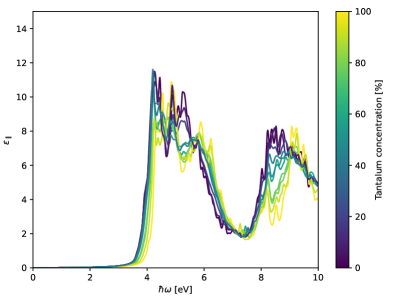
The linear optical response of the LNT solid solutions in their ferroelectric phase is discussed on the basis of the calculated dielectric function. The latter is displayed in figure 17 as a function of the composition. The upper row of figure 17 shows the real part and the bottom row the imaginary part of the IPA calculated dielectric function. As well, the panels on the left hand side show the ordinary optical direction () and the panels on the right hand side show the extraordinary optical direction (). The linear optical response of LiNbO3 at the IPA level of accuracy (black curve) features the two main absorption bands at about 5 eV and 8.5 eV known from previous investigations, e.g., Ref. [67]. Also the double peak structure of the main absorption band, with a different relative intensity of the two peaks in the ordinary and extraordinary optical direction, is in close agreement with previous investigations. LiTaO3 (yellow curves in figure 17) features an absorption spectrum that is rather similar to the absorption spectrum of LiNbO3, however with all spectral signatures shifted at higher energies due to the somewhat larger electronic bandgap. Between the two end compounds, the linear optical answer of the ferroelectric LiNb1-xTaxO3 mixed crystals substantially interpolates the features of LiNbO3 and LiTaO3, however, the energetically lowest absorption edge is given by solid solution with about 40% Ta content. This mirrors the deviations from the Vegard behavior of the fundamental bandgap previously discussed. Moreover, the experimentally determined absorption edge is underestimated due to the DFT underestimation of the electronic bandgap.
A more refined calculation of the optical answer can be obtained, e.g., including self-energy effects within the GW approximation. Unfortunately, a calculation of the full optical spectra for all concentrations and the employed cell size is beyond todays computational power. Nonetheless, to estimate magnitude of the many-body effects on the LNT mixed crystals we calculate the quasiparticle shifts of the IPA-calculated electronic eigenvalues. We discuss exemplarily as a spot check the LiNb0.42Ta0.58O3 composition. All other compositions, including the end compounds LiNbO3 and LiTaO3 behave very similarly.
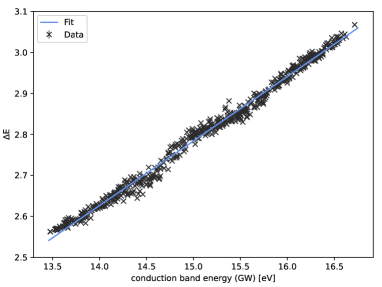
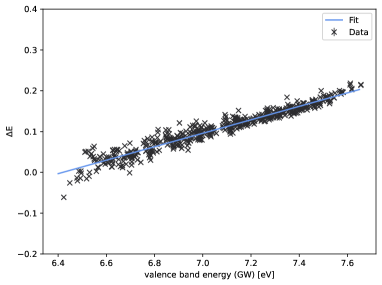
The energy shifts at each point of the Brillouin zone with respect to the band positions in the IPA are shown in figure 18. The quasiparticle shifts are nearly independent from the k-point, so that the bands are mainly rigidly translated. Valence bands are less affected by many-body effects than conduction bands. The magnitude of the translation is roughly proportional to the band energy, with the shift of the conduction band minimum of ca. 2.55 eV in agreement with available literature data [67].
The rigid shift of the single bands is not surprising, as the valence band and the conduction band edges have –witin a given composition– the same orbital nature over the whole Brillouin zone. As shown, e.g., in the DOS of figure 14, the valence band is dominated by oxygen states and the conduction band by Nb/Ta-O hybrids. The present calculations are very similar to our previous results for LiNbO3, where the self-energy was also evaluated within the frequency-dependent random-phase approximation employed here [67]. As the many-body effects mainly translate all spectral features to higher energies (independently from the composition), their effect on the adsorption edge might be correctly simulated by a computationally convenient scissors shift in upcoming calculations.
One of the peculiarities of the LNT solid solutions is their optical birefringence, defined as the difference between the extraordinary and ordinary refractive index:
| (16) |
Indeed, LiNbO3 shows negative birefringence, while LiTaO3 has a positive birefringence. This suggests the existence of some concentration with vanishing birefringence, resulting in a highly unusual combination of ferroelectricity and optical isotropy [11].
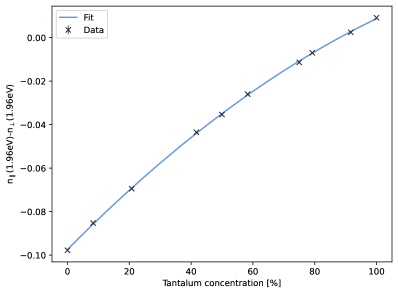
With the knowledge of the dielectric function as shown in figure 17 and equation 8, we calculate the birefringence of the LiNb1-xTaxO3 solid solutions as a function of for a wavelength of 633 nm (1.96 eV) typical for the commonly diffused He:Ne lasers. The corresponding data is shown in figure 19. The birefringence is a slightly super linear function of the concentration, as experimentally found by Wood et al. [11] and firstly predicted by Riefer et al. [67]. Our calculations reveal that zero birefringence occurs for a composition of . This is in qualitative agreement both with the room temperature measurements of LNT bulk by Wood et al. [11], who determined the accidentally-isotropic point at and with measurements on LiTaxNb1-xO3 thin films of by Kondo et al. [68], who reported the accidentally-isotropic composition at about (also for a laser wavelength of 633 nm). We remark that at this composition the crystal is electrically anisotropic (it still has a permanent, spontaneous macroscopic polarization directed along the crystallographic [0001] axis) and optically anisotropic, a seldom and unusual combination.
IV Conclusions
In order to theoretically characterize LiNb1-xTaxO3 solid solutions as a function of the composition, a set of special quasirandom structures spanning the whole composition range is created. With the help of the SQS, the structural parameters of the mixed crystals are calculated and deviations from the Vegard behavior are demonstrated. Moreover, the composition dependent positions of the cations within the oxygen octahedra qualitatively explain the differences in the spontaneous polarization. An analysis of the electronic structures also reveal deviations from the Vegard law. These arise from the fact that the conduction band shifts linearly with the Ta content, while valence band does not, resulting in an overall sublinear behavior. The predicted composition dependence of the fundamental bandgap is experimentally verified by specifically performed optical spectroscopy measurements, which are in qualitative agreement with the calculations. The determined value of the bowing parameter can be employed to design devices such as photodetectors based on the LiNb1-xTaxO3 solid solutions.
The linear optical answer of the mixed crystals is quantified by the calculation of the dielectric function (ordinary and extraordinary component). The latter are calculated in the independent particle approximation. The dielectric functions of the end compounds LiNbO3 and LiTaO3 are in agreement with existing results, while the intermediate compositions show a moderate dependence on the Ta content. The inclusion of self-energy effects within the GWA opens the bandgap by more than 2 eV. The birefringence of the mixed crystals is shown to depend in first approximation linearly on the Ta concentration and to increase from the negative values of the Nb rich samples to the positive values of the Ta rich samples. The particular composition with =0.89 is characterized by an optical isotropy that is quite peculiar for ferroelectrics. Thermodynamical quantities such as the specific heat or the Debye temperature of the LiNb1-xTaxO3 mixed crystals are calculated as a function of the composition as well. While increases roughly linearly with , decreases sub-linearly with the Ta content.
Although this work provides a rather comprehensive characterization of the LiNb1-xTaxO3 solid solutions, our knowledge of this appealing material class is far from being complete. Both the end compounds LiNbO3 and LiTaO3 are characterized by a strong Li deficiency, resulting in the so called congruent composition. The congruently grown crystals differ in many aspects from the stoichiometric samples. Whether the LNT solid solutions crystallize in a congruent composition remains to be settled. Similarly, little is known about the defect structure of the mixed crystals, both concerning intrinsic defects and doping, which are both known to massively impact the materials properties of LN and LT. A somewhat related point regards the homogeneity of the solid solutions. Within the SQS approach, we model by definition a random distribution of the cations. However, clustering of Ta or Nb in local regions with a composition similar to that of the end compounds is also conceivable. This and other aspects, including in particular excitonic effects in the linear optical response or the temperature dependence of the materials properties, must be explored in future investigations.
Acknowledgements.
We gratefully acknowledge financial support by the Deutsche Forschungsgemeinschaft (DFG) through the research group FOR5044 (Grant No. 426703838 [69], SA1948/3-1, IM37/12-1). Calculations for this research were conducted on the Lichtenberg high-performance computer of the TU Darmstadt and at the Höchstleistungrechenzentrum Stuttgart (HLRS). The authors furthermore acknowledge the computational resources provided by the HPC Core Facility and the HRZ of the Justus-Liebig-Universität Gießen.References
- Vert et al. [2012] M. Vert, Y. Doi, K.-H. Hellwich, M. Hess, P. Hodge, P. Kubisa, M. Rinaudo, and F. Schué, Terminology for biorelated polymers and applications (iupac recommendations 2012), Pure and Applied Chemistry 84, 377 (2012).
- Hume-Rothery and Powell [1935] W. Hume-Rothery and H. M. Powell, On the theory of super-lattice structures in alloys, Zeitschrift für Kristallographie - Crystalline Materials 91, 23 (1935).
- Hume-Rothery et al. [1969] W. Hume-Rothery, C. W. Haworth, and R. E. Smallman, The structure of metals and alloys [by] William Hume-Rothery, R.E. Smallman and C W. Haworth, 5th ed. (Institute of Metals and the Institution of Metallurgists London, 1969).
- Keloglu and Fedorko [1972] Y. P. Keloglu and A. S. Fedorko, Vegard’s law for some binary and pseudobinary semiconductor systems, in Chemical Bonds in Solids: Volume 4: Semiconductor Crystals, Glasses, and Liquids, edited by A. N. N. Sirota (Springer US, New York, NY, 1972) pp. 113–117.
- Polimeni et al. [2004] A. Polimeni, G. Baldassarri Höger von Högersthal, F. Masia, A. Frova, M. Capizzi, S. Sanna, V. Fiorentini, P. J. Klar, and W. Stolz, Tunable variation of the electron effective mass and exciton radius in hydrogenated GaAs1-xNx, Physical Review B - Condensed Matter and Materials Physics 69, 10.1103/PhysRevB.69.041201 (2004).
- Sanna and Fiorentini [2004] S. Sanna and V. Fiorentini, Lattice constant, effective mass, and gap recovery in hydrogenated GaAs1-xNx, Physical Review B - Condensed Matter and Materials Physics 69, 10.1103/PhysRevB.69.125208 (2004).
- Vegard [1921] L. Vegard, Die konstitution der mischkristalle und die raumfüllung der atome, Zeitschrift für Physik 5, 17 (1921).
- Denton and Ashcroft [1991] A. R. Denton and N. W. Ashcroft, Vegard’s law, Phys. Rev. A 43, 3161 (1991).
- Bombardi et al. [2003] A. Bombardi, F. d’Acapito, K. Mattenberger, O. Vogt, and G. H. Lander, Non-Vegard behavior of the system, Phys. Rev. B 68, 104414 (2003).
- Baidya et al. [2016] T. Baidya, P. Bera, O. Kröcher, O. Safonova, P. M. Abdala, B. Gerke, R. Pöttgen, K. R. Priolkar, and T. K. Mandal, Understanding the anomalous behavior of Vegard’s law in Ce1-xMxO2 (M = Sn and Ti; 0 x 0.5) solid solutions, Phys. Chem. Chem. Phys. 18, 13974 (2016).
- Wood et al. [2008] I. G. Wood, P. Daniels, R. H. Brown, and A. M. Glazer, Optical birefringence study of the ferroelectric phase transition in lithium niobate tantalate mixed crystals: , Journal of Physics: Condensed Matter 20, 235237 (2008).
- Yakhnevych et al. [2024] U. Yakhnevych, F. El Azzouzi, F. Bernhardt, C. Kofahl, Y. Suhak, S. Sanna, K.-D. Becker, H. Schmidt, S. Ganschow, and H. Fritze, Oxygen partial pressure and temperature dependent electrical conductivity of lithium- niobate-tantalate solid solutions, Solid State Ionics (2024), accepted.
- Gureva et al. [2023] P. Gureva, A. Kulikov, A. Mololkin, R. Fakhrtdinov, A. Artemev, A. Demkiv, Y. Pisarevsky, and N. Marchenkov, Local variations of the piezoelectric properties of an LiNb1-xTaxO3 crystal, Journal of Applied Crystallography 56, 539 (2023).
- Inbar and Cohen [1996] I. Inbar and R. E. Cohen, Comparison of the electronic structures and energetics of ferroelectric and , Phys. Rev. B 53, 1193 (1996).
- Weis and Gaylord [1985] R. S. Weis and T. K. Gaylord, Lithium niobate: Summary of physical properties and crystal structure, Applied Physics A 37, 191 (1985).
- of Sheffield [2023] T. U. of Sheffield, WebElements, https://www.webelements.com (2023), last accessed 10th January 2024.
- Bartasyte et al. [2012] A. Bartasyte, A. Glazer, F. Wondre, D. Prabhakaran, P. Thomas, S. Huband, D. Keeble, and S. Margueron, Growth of LiNb1-xTaxO3 solid solution crystals, Materials Chemistry and Physics 134, 728 (2012).
- Manzoor et al. [2018] A. Manzoor, S. Pandey, D. Chakraborty, S. R. Phillpot, and D. S. Aidhy, Entropy contributions to phase stability in binary random solid solutions, Computational Materials 4, 47 (2018).
- Rüsing et al. [2016] M. Rüsing, S. Sanna, S. Neufeld, G. Berth, W. G. Schmidt, A. Zrenner, H. Yu, Y. Wang, and H. Zhang, Vibrational properties of mixed crystals, Phys. Rev. B 93, 184305 (2016).
- Xue et al. [2000] D. Xue, K. Betzler, and H. Hesse, Dielectric properties of lithium niobate–tantalate crystals, Solid State Communications 115, 581 (2000).
- El Azzouzi et al. [2024] F. El Azzouzi, D. Klimm, L. M. Verhoff, N. A. Schäfer, S. Ganschow, K.-D. Becker, S. Sanna, and H. Fritze, Phase Transformation in Lithium Niobate-Lithium Tantalate Solid Solutions (LiNb1-xTaxO3), Phys. Stat. Sol. (a) (2024), submitted.
- Riefer et al. [2013a] A. Riefer, S. Sanna, and W. G. Schmidt, LiNb1-xTaxO3 Electronic Structure and Optical Response from First-Principles Calculations, Ferroelectrics 447, 78 (2013a).
- Sanna et al. [2013] S. Sanna, A. Riefer, S. Neufeld, W. G. Schmidt, G. Berth, M. Rüsing, A. Widhalm, and A. Zrenner, Vibrational Fingerprints of LiNbO3-LiTaO3 Mixed Crystals, Ferroelectrics 447, 63 (2013).
- Wei et al. [1990] S.-H. Wei, L. G. Ferreira, J. E. Bernard, and A. Zunger, Electronic properties of random alloys: Special quasirandom structures, Phys. Rev. B 42, 9622 (1990).
- von Pezold et al. [2010] J. von Pezold, A. Dick, M. Friák, and J. Neugebauer, Generation and performance of special quasirandom structures for studying the elastic properties of random alloys: Application to Al-Ti, Phys. Rev. B 81, 094203 (2010).
- Bellaiche and Vanderbilt [2000] L. Bellaiche and D. Vanderbilt, Virtual crystal approximation revisited: Application to dielectric and piezoelectric properties of perovskites, Phys. Rev. B 61, 7877 (2000).
- Soven [1967] P. Soven, Coherent-potential model of substitutional disordered alloys, Phys. Rev. 156, 809 (1967).
- Sanchez et al. [1984] J. Sanchez, F. Ducastelle, and D. Gratias, Generalized cluster description of multicomponent systems, Physica A: Statistical Mechanics and its Applications 128, 334 (1984).
- Laks et al. [1992] D. B. Laks, L. G. Ferreira, S. Froyen, and A. Zunger, Efficient cluster expansion for substitutional systems, Phys. Rev. B 46, 12587 (1992).
- van de Walle [2008] A. van de Walle, A complete representation of structure–property relationships in crystals, Nature materials 7, 455 (2008).
- Ghosh et al. [2008] G. Ghosh, A. van de Walle, and M. Asta, First-principles calculations of the structural and thermodynamic properties of bcc, fcc and hcp solid solutions in the al–tm (tm=ti, zr and hf) systems: A comparison of cluster expansion and supercell methods, Acta Materialia 56, 3202 (2008).
- Kresse and Hafner [1993] G. Kresse and J. Hafner, Ab initio molecular dynamics for liquid metals, Physical Review B 47, 558 (1993).
- Kresse and Furthmüller [1996a] G. Kresse and J. Furthmüller, Efficient iterative schemes for ab initio total-energy calculations using a plane-wave basis set, Physical Review B - Condensed Matter and Materials Physics 54, 11169 (1996a).
- Kresse and Furthmüller [1996b] G. Kresse and J. Furthmüller, Efficiency of ab-initio total energy calculations for metals and semiconductors using a plane-wave basis set, Computational Materials Science 6, 15 (1996b).
- Blöchl [1994] P. E. Blöchl, Projector augmented-wave method, Phys. Rev. B 50, 17953 (1994).
- Joubert [1999] D. Joubert, From ultrasoft pseudopotentials to the projector augmented-wave method, Physical Review B - Condensed Matter and Materials Physics 59, 1758 (1999).
- Perdew et al. [2008] J. P. Perdew, A. Ruzsinszky, G. I. Csonka, O. A. Vydrov, G. E. Scuseria, L. A. Constantin, X. Zhou, and K. Burke, Restoring the density-gradient expansion for exchange in solids and surfaces, Physical Review Letters 100, 1 (2008).
- Murnaghan [1944] F. D. Murnaghan, The compressibility of media under extreme pressures, Proceedings of the National Academy of Sciences 30, 244 (1944).
- Pack and Monkhorst [1977] J. D. Pack and H. J. Monkhorst, ”Special points for Brillouin-zone integrations” - a reply, Physical Review B 16, 1748 (1977).
- Feynman [1939] R. P. Feynman, Forces in molecules, Phys. Rev. 56, 340 (1939).
- Togo et al. [2023] A. Togo, L. Chaput, T. Tadano, and I. Tanaka, Implementation strategies in phonopy and phono3py, J. Phys. Condens. Matter 35, 353001 (2023).
- Togo [2023] A. Togo, First-principles phonon calculations with phonopy and phono3py, J. Phys. Soc. Jpn. 92, 012001 (2023).
- Parlinski et al. [1997] K. Parlinski, Z. Q. Li, and Y. Kawazoe, First-principles determination of the soft mode in cubic ZrO2, Physical Review Letters 78, 4063 (1997).
- Giannozzi et al. [2017] P. Giannozzi, O. Andreussi, T. Brumme, O. Bunau, M. B. Nardelli, M. Calandra, R. Car, C. Cavazzoni, D. Ceresoli, M. Cococcioni, N. Colonna, I. Carnimeo, A. D. Corso, S. de Gironcoli, P. Delugas, R. A. D. Jr, A. Ferretti, A. Floris, G. Fratesi, G. Fugallo, R. Gebauer, U. Gerstmann, F. Giustino, T. Gorni, J. Jia, M. Kawamura, H.-Y. Ko, A. Kokalj, E. Küçükbenli, M. Lazzeri, M. Marsili, N. Marzari, F. Mauri, N. L. Nguyen, H.-V. Nguyen, A. O. de-la Roza, L. Paulatto, S. Poncé, D. Rocca, R. Sabatini, B. Santra, M. Schlipf, A. P. Seitsonen, A. Smogunov, I. Timrov, T. Thonhauser, P. Umari, N. Vast, X. Wu, and S. Baroni, Advanced capabilities for materials modelling with quantum espresso, Journal of Physics: Condensed Matter 29, 465901 (2017).
- Hamann [2013] D. R. Hamann, Optimized norm-conserving vanderbilt pseudopotentials, Phys. Rev. B 88, 085117 (2013).
- Deslippe et al. [2012] J. Deslippe, G. Samsonidze, D. A. Strubbe, M. Jain, M. L. Cohen, and S. G. Louie, BerkeleyGW: A massively parallel computer package for the calculation of the quasiparticle and optical properties of materials and nanostructures, Computer Physics Communications 183, 1269 (2012).
- Hybertsen and Louie [1986] M. S. Hybertsen and S. G. Louie, Electron correlation in semiconductors and insulators: Band gaps and quasiparticle energies, Phys. Rev. B 34, 5390 (1986).
- Tauc et al. [1966] J. Tauc, R. Grigorovici, and A. Vancu, Optical properties and electronic structure of amorphous germanium, physica status solidi (b) 15, 627 (1966).
- Zanatta [2019] A. R. Zanatta, Revisiting the optical bandgap of semiconductors and the proposal of a unified methodology to its determination, Scientific Reports 9, 10.1038/s41598-019-47670-y (2019).
- Bock et al. [2019] S. Bock, C. Kijatkin, D. Berben, and M. Imlau, Absorption and remission characterization of pure, dielectric (nano-)powders using diffuse reflectance spectroscopy: An end-to-end instruction, Applied Sciences 9, 10.3390/app9224933 (2019).
- Bhatt et al. [2012] R. Bhatt, I. Bhaumik, S. Ganesamoorthy, A. K. Karnal, M. K. Swami, H. S. Patel, and P. K. Gupta, Urbach tail and bandgap analysis in near stoichiometric LiNbO3 crystals, physica status solidi (a) 209, 176 (2012).
- O’Donnell and Chen [1991] K. P. O’Donnell and X. Chen, Temperature dependence of semiconductor band gaps, Applied Physics Letters 58, 2924 (1991).
- Huang and Rhys [1950] K. Huang and A. Rhys, Theory of Light Absorption and Non-Radiative Transitions in F-Centres, Proceedings of the Royal Society of London Series A 204, 406 (1950).
- Sanna and Schmidt [2017] S. Sanna and W. G. Schmidt, surfaces from a microscopic perspective, Journal of Physics: Condensed Matter 29, 413001 (2017).
- Gaillac et al. [2016] R. Gaillac, P. Pullumbi, and F.-X. Coudert, Elate: an open-source online application for analysis and visualization of elastic tensors, Journal of Physics: Condensed Matter 28, 275201 (2016).
- Jain et al. [2013] A. Jain, S. P. Ong, G. Hautier, W. Chen, W. D. Richards, S. Dacek, S. Cholia, D. Gunter, D. Skinner, G. Ceder, and K. a. Persson, Commentary: The Materials Project: A materials genome approach to accelerating materials innovation, APL Materials 1, 011002 (2013).
- Chen et al. [2001] Y.-L. Chen, J.-J. Xu, X.-J. Chen, Y.-F. Kong, and G.-Y. Zhang, Domain reversion process in near-stoichiometric LiNbO3 crystals, Optics Communications 188, 359 (2001).
- Kitamura et al. [1998] K. Kitamura, Y. Furukawa, K. Niwa, V. Gopalan, and T. E. Mitchell, Crystal growth and low coercive field 180° domain switching characteristics of stoichiometric LiTaO3, Applied Physics Letters 73, 3073 (1998).
- Krampf et al. [2021] A. Krampf, M. Imlau, Y. Suhak, H. Fritze, and S. Sanna, Evaluation of similarities and differences of LiTaO3 and LiNbO3 based on high-t-conductivity, nonlinear optical fs-spectroscopy and ab initio modeling of polaronic structures, New Journal of Physics 23, 033016 (2021).
- Gaczynski et al. [2024] P. Gaczynski, Y. Suhak, S. Ganschow, S. Sanna, H. Fritze, and K.-D. Becker, A High-Temperature Optical Spectroscopy Study of the Fundamental Absorption Edge in LiNbO3 - LiTaO3 Solid Solutions, Physica Status Solidi a xx (2024).
- Klenen et al. [2024] J. Klenen, F. Sauerwein, L. Vittadello, K. Koempe, V. Hreb, V. Sydorchuk, U. Yakhnevych, D. Sugak, L. Vasylechko, and M. Imlau, Gap-free tuning of second and third harmonic generation in mechanochemically synthesized nanocrystalline LiNb1-xTaxO3 () studied by nonlinear diffuse femtosecond-pulse reflectometry, Nanomaterials xxx, xxx (2024).
- Bernhardt et al. [2024] F. Bernhardt, C. Fink, L. M. Verhoff, N. A. Schäfer, A. Kapp, W. A. Nachwati, U. Bashir, F. E. Azzouzi, U. Yakhnevych, Y. Suhak, K.-D. Becker, D. Klimm, S. Ganschow, H. Schmidt, H. Fritze, and S. Sanna, Phys. Rev. M (2024), submitted.
- Friedrich et al. [2015] M. Friedrich, A. Riefer, S. Sanna, W. G. Schmidt, and A. Schindlmayr, Phonon dispersion and zero-point renormalization of LiNbO3 from density-functional perturbation theory, Journal of Physics: Condensed Matter 27, 385402 (2015).
- Yao et al. [2008] S. Yao, J. Wang, H. Liu, X. Hu, H. Zhang, X. Cheng, and Z. Ling, Growth, optical and thermal properties of near-stoichiometric LiNbO3 single crystal, Journal of Alloys and Compounds 455, 501 (2008).
- Kor [2024] Korth Kristalle GmbH, https://www.korth.de/en/materials/detail/Lithium%20Tantalate (2024), accessed: 2024-02-05.
- Villar et al. [1986] R. Villar, E. Gmelin, and H. Grimm, Specific heat of crystalline ferroelectrics at low temperatures, Ferroelectrics 69, 165 (1986).
- Riefer et al. [2013b] A. Riefer, S. Sanna, A. Schindlmayr, and W. G. Schmidt, Optical response of stoichiometric and congruent lithium niobate from first-principles calculations, Phys. Rev. B 87, 195208 (2013b).
- Kondo et al. [1979] S. Kondo, K. Sugii, S. Miyazawa, and S. Uehara, LPE growth of Li(Nb,Ta)O3 solid-solution thin film waveguides on LiTaO3 substrates, Journal of Crystal Growth 46, 314 (1979).
- Ganschow et al. [2021] S. Ganschow, H. Schmidt, Y. Suhak, M. K. Imlau, M. Rüsing, L. M. Eng, H. Fritze, and S. Sanna, Periodic low-dimensional defect structures in polar oxides (2021).