The ALPINE-ALMA [CII] Survey: Dust emission effective radius up to 3 kpc in the Early Universe
Abstract
Aims. Measurements of the size of dust continuum emission are an important tool for constraining the spatial extent of star formation and hence the build-up of stellar mass. Compact dust emission has generally been observed at Cosmic Noon (). However, at earlier epochs, toward the end of the Reionization (), only the sizes of a handful of IR-bright galaxies have been measured. In this work, we derive the dust emission sizes of main-sequence galaxies at from the ALPINE survey.
Methods. We measure the dust effective radius in the uv-plane in Band 7 of ALMA for seven ALPINE galaxies with resolved emission and we compare it with rest-frame UV and [CII]158m measurements. We study the LIR scaling relation by considering our dust size measurements and all the data in literature at . Finally, we compare our size measurements with predictions from simulations.
Results. The dust emission in the selected ALPINE galaxies is rather extended ( kpc), similar to [CII]158m but a factor of 2 larger than the rest-frame UV emission. Putting together all the measurements at , spanning 2 decades in luminosity from L L☉ to L L☉, the data highlight a steeply increasing trend of the LIR relation at L L☉, followed by a downturn and a decreasing trend at brighter luminosities. Finally, simulations that extend up to the stellar masses of the ALPINE galaxies considered in the present work predict a sub-set of galaxies ( % at 1010 MM M☉) with sizes as large as those measured.
Key Words.:
galaxies: high-redshift — galaxies: ISM — ISM: dust1 Introduction
The size of dust continuum emission in the far-IR (FIR) rest-frame regime gives key information on the spatial extension of the dust-obscured star formation within galaxies, hence providing important constraints on their stellar build-up.
Nowadays, thanks to the Atacama Large Millimeter/Sub-millimeter array (ALMA), a significant number of studies of the far-IR emission sizes have been performed at the Cosmic Noon () pointing towards compact dust emission (effective radius kpc), typically more compact than the rest-frame optical/UV imaging (e.g. Barro et al. 2016; Tadaki et al. 2017, Talia et al. 2018, Franco et al. 2020). The compaction of the dust continuum sizes has been interpreted as a sign of dust-obscured build-up of a central dense stellar component, either through the secular funneling of gas towards the center (e.g. Dekel et al. 2013) or through gas-rich mergers (e.g. Puglisi et al. 2021). These studies focus mainly on dusty, massive and FIR-bright galaxies while there are some hints that at fainter luminosities dust emission is more extended (e.g. Rujopakarn et al. 2016, Cheng et al. 2020).
At very high redshift, measuring the dust emission size is very challenging due to limited spatial resolution and sensitivity. Few studies are available for sources emerging shortly after the Epoch of Reionization (). These studies include Gómez-Guijarro et al. (2022a), who studied 6 sources in the GOODS-ALMA 2.0 survey at 1.1 mm; Jin et al. (2022) who considered 6 galaxies from the super-deblended catalogues in COSMOS and GOODS-North (Jin et al. 2018, Liu et al. 2018) and Cooke et al. (2018), where the dust continuum sizes of 6 stacked luminous Sub-Millimeter Galaxies have been presented. These works support the very compact dust continuum sizes found at lower redshifts, however the samples still rely on poor statistics and only the bright IR tail of galaxies has been probed (Lm) ¿ L☉). An exception is the recent work from Witstok et al. (2022), which presented the properties of the ISM of 5 Lyman Break Galaxies (LBGs) at very high (), characterised by moderate IR luminosity (L L☉).
We aim to improve our understanding of the dust emission sizes at high () by taking advantage of the completed ALMA Large program to INvestigate [CII] at Early times (ALPINE, see Le Fèvre et al. 2020, Béthermin et al. 2020, Faisst et al. 2020). The goal of this program was to observe the prominent [CII] 158 m line and far-IR continuum emission for 118 UV-selected normal star-forming galaxies at . The present study increases the number of sources with measured dust continuum sizes at very high and, given the lower IR luminosity range spanned by the ALPINE galaxies, better constrains the -LIR scaling relation.
The paper is organised as follows. In Sect. 2 we describe our data analysis. We then present our result in Sect. 3. Finally, we discuss them and conclude in Sect. 4. Throughout the paper, we assume a flat CDM cosmology with , and .
2 Sample, observations and data analysis
.
The parent sample of galaxies analysed in this paper is the subset of 23 objects with a 158 m continuum detection in the ALPINE survey (Béthermin et al. 2020). The ALPINE survey aimed to study the 158 m [CII] and the rest-frame FIR continuum emission of 118 Main-Sequence (MS) rest-frame UV selected galaxies at , in the COSMOS (Scoville et al. 2007) and ECDFS (Giacconi et al. 2002) fields. For an overall description of the survey we refer to Le Fèvre et al. (2020); for the data reduction we refer to Béthermin et al. (2020); for the description of the ancillary spectra and photometric data and the physical properties obtained from the UV-to-optical SED-fitting, we refer to Faisst et al. (2020). The stellar masses (M⋆) and the star formation rates (SFR) of the ALPINE galaxies are in the range M M⊙ and M⊙/yr, respectively. The stellar masses M⋆ are from Table A1 of Faisst et al. (2020) and derived from the SED-fitting; as SFR we consider SFRUV+IR, i.e. the sum of the unobscured (SFRUV) and obscured (SFRIR) star formation. We derive SFRUV from the UV luminosity at Å (Faisst et al. 2020) uncorrected for dust, and SFRIR from the IR luminosity reported in Béthermin et al. (2020).
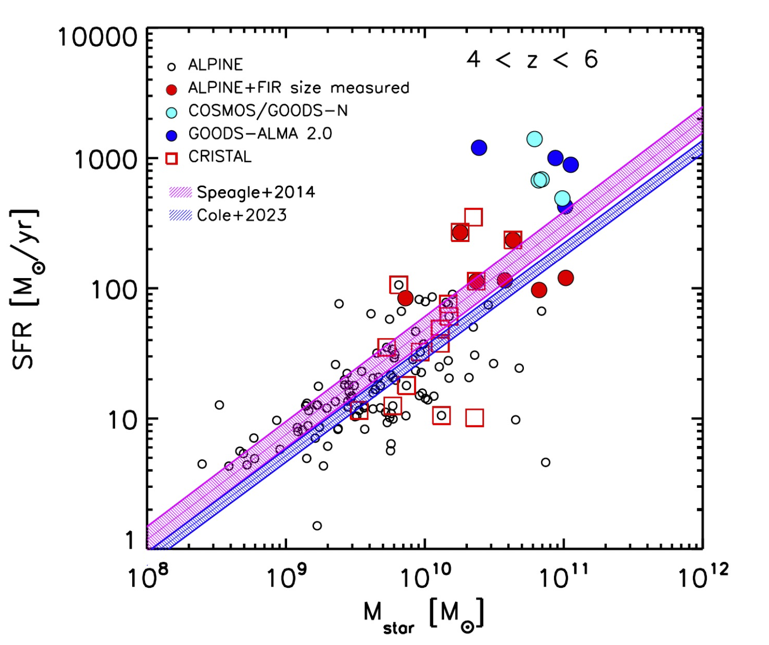
In Fig. 1 we report the ALPINE galaxies on the SFR plane. For the galaxies not detected in continuum, following Dessauges-Zavadsky et al. (2020), we consider only SFRUV. As found by Schaerer et al. (2020) by studying the UV-continuum slope, this assumption can underestimate the total SFR by a factor of 2. In Fig. 1, together with the ALPINE targets, we report the galaxies with measured continuum sizes in the redshift range (see Gómez-Guijarro et al. 2022a, Jin et al. 2022). Moreover, as a reference, we report the MS relation from Cole et al. (2023), recently derived using JWST data from Cosmic Evolution Early Release Science (CEERS, Finkelstein et al. 2022, Bagley et al. 2023) and consistent, within 1 with the preJWST derivation from Speagle et al. (2014). Over the 23 ALPINE continuum sources, 3 galaxies are classified in the continuum images as multi-components objects (VC5101209780,VE530029038, DC881725, see Béthermin et al. 2020 ). These systems can indicate the presence of a merger or a very patchy and disturbed galaxy where can be quite difficult to constrain a center of the system and the determination of the size. For this reason, we choose to remove these galaxies from our analysis. Therefore, our sample consists of 20 ALPINE galaxies. Among these sources, 18 over 20 are detected in [CII], while for 2 sources only upper limits in [CII] are available.
| Name | |||||||
|---|---|---|---|---|---|---|---|
| [kpc] | [kpc] | [kpc] | [log10(M/M⊙)] | [M⊙/yr] | |||
| CG19 | 4.500 | 1.40 | … | … | 9.83 | 66.5 | 5.4 |
| DC396844 | 4.540 | 2.131.10 | 2.560.33 | 0.580.20 | 9.86 | 83.9 | 5.6 |
| DC488399 | 5.678 | 1.17 | 1.320.16 | … | 10.20 | 89.8 | 9.3 |
| DC494057 | 5.540 | 1.16 | 2.480.25 | 0.590.17 | 10.15 | 77.8 | 7.1 |
| DC552206 | 5.514 | 3.08 1.25 | … | … | 10.58 | 114.9 | 4.5 |
| DC683613a | 5.536 | 1.65 | 1.820.33 | 0.570.24 | 10.17 | 75.6 | 5.1 |
| DC818760a | 4.554 | 2.70 0.55 | 2.590.16 | 1.070.21b | 10.63 | 235.1 | 9.5 |
| DC848185a | 5.284 | 1.90 0.30 | … | … | 10.37 | 113.0 | 7.1 |
| DC873756a | 4.548 | 1.58 0.20 | 2.360.11 | 1.080.43 | 10.25 | 268.7 | 21.7 |
| VC5100822662a | 4.523 | 1.16 | 2.590.37 | 1.320.33 | 10.17 | 60.8 | 6.5 |
| VC5101218326 | 4.568 | 1.830.40 | 2.370.15 | 1.460.32 | 11.01 | 120.0 | 6.5 |
| VC5180966608 | 4.529 | 2.600.60 | no data | 0.590.24b | 10.82 | 96.9 | 5.7 |
2.1 Size measurement
In order to measure the continuum sizes of the targets, we adopted the procedure outlined in Fujimoto et al. (2020) to measure the sizes of the [CII] emission of the ALPINE targets. First of all, we remove from the visibility data the channels containing the [CII] emission. We then produce the continuum maps with the CASA111Common Astronomy Software Application. https://casa.nrao.edu/(CASA Team et al. 2022) task TCLEAN and we run in CASA the task IMFIT to achieve a first guess of the target’s properties (positions, fluxes and sizes). These outputs, obtained in the image-plane, are used as first guess for the proper size measurements in the uv-plane, where we assume a 2-dimensional Gaussian model for the intensity profile and we measure the sizes with the CASA task UVMODELFIT. The latter returns the de-convolved FWHM along the major and minor axis (FWHMmaj, FWHMmin) that we circularise as FWHM). The effective radius , which represents the radius that encloses half of the total light, is then derived as FWHMcirc/2 (see Voigt & Bridle 2010 for a Gaussian profile corresponding to a Sérsic index =0.5). Fujimoto et al. (2020) describe how a Gaussian profile return an effective radius consistent at a 5 level with a more reliable exponential shape (corresponding to a Sérsic index =1). We applied the described procedure to sources detected in the continuum at to obtain reliable measurements. Given this cut in , our final sample is composed of 12 galaxies. All but one of the 12 galaxies have continuum (see Table 1), and this gives us confidence of meaningful size measurements (Fujimoto et al. 2020).
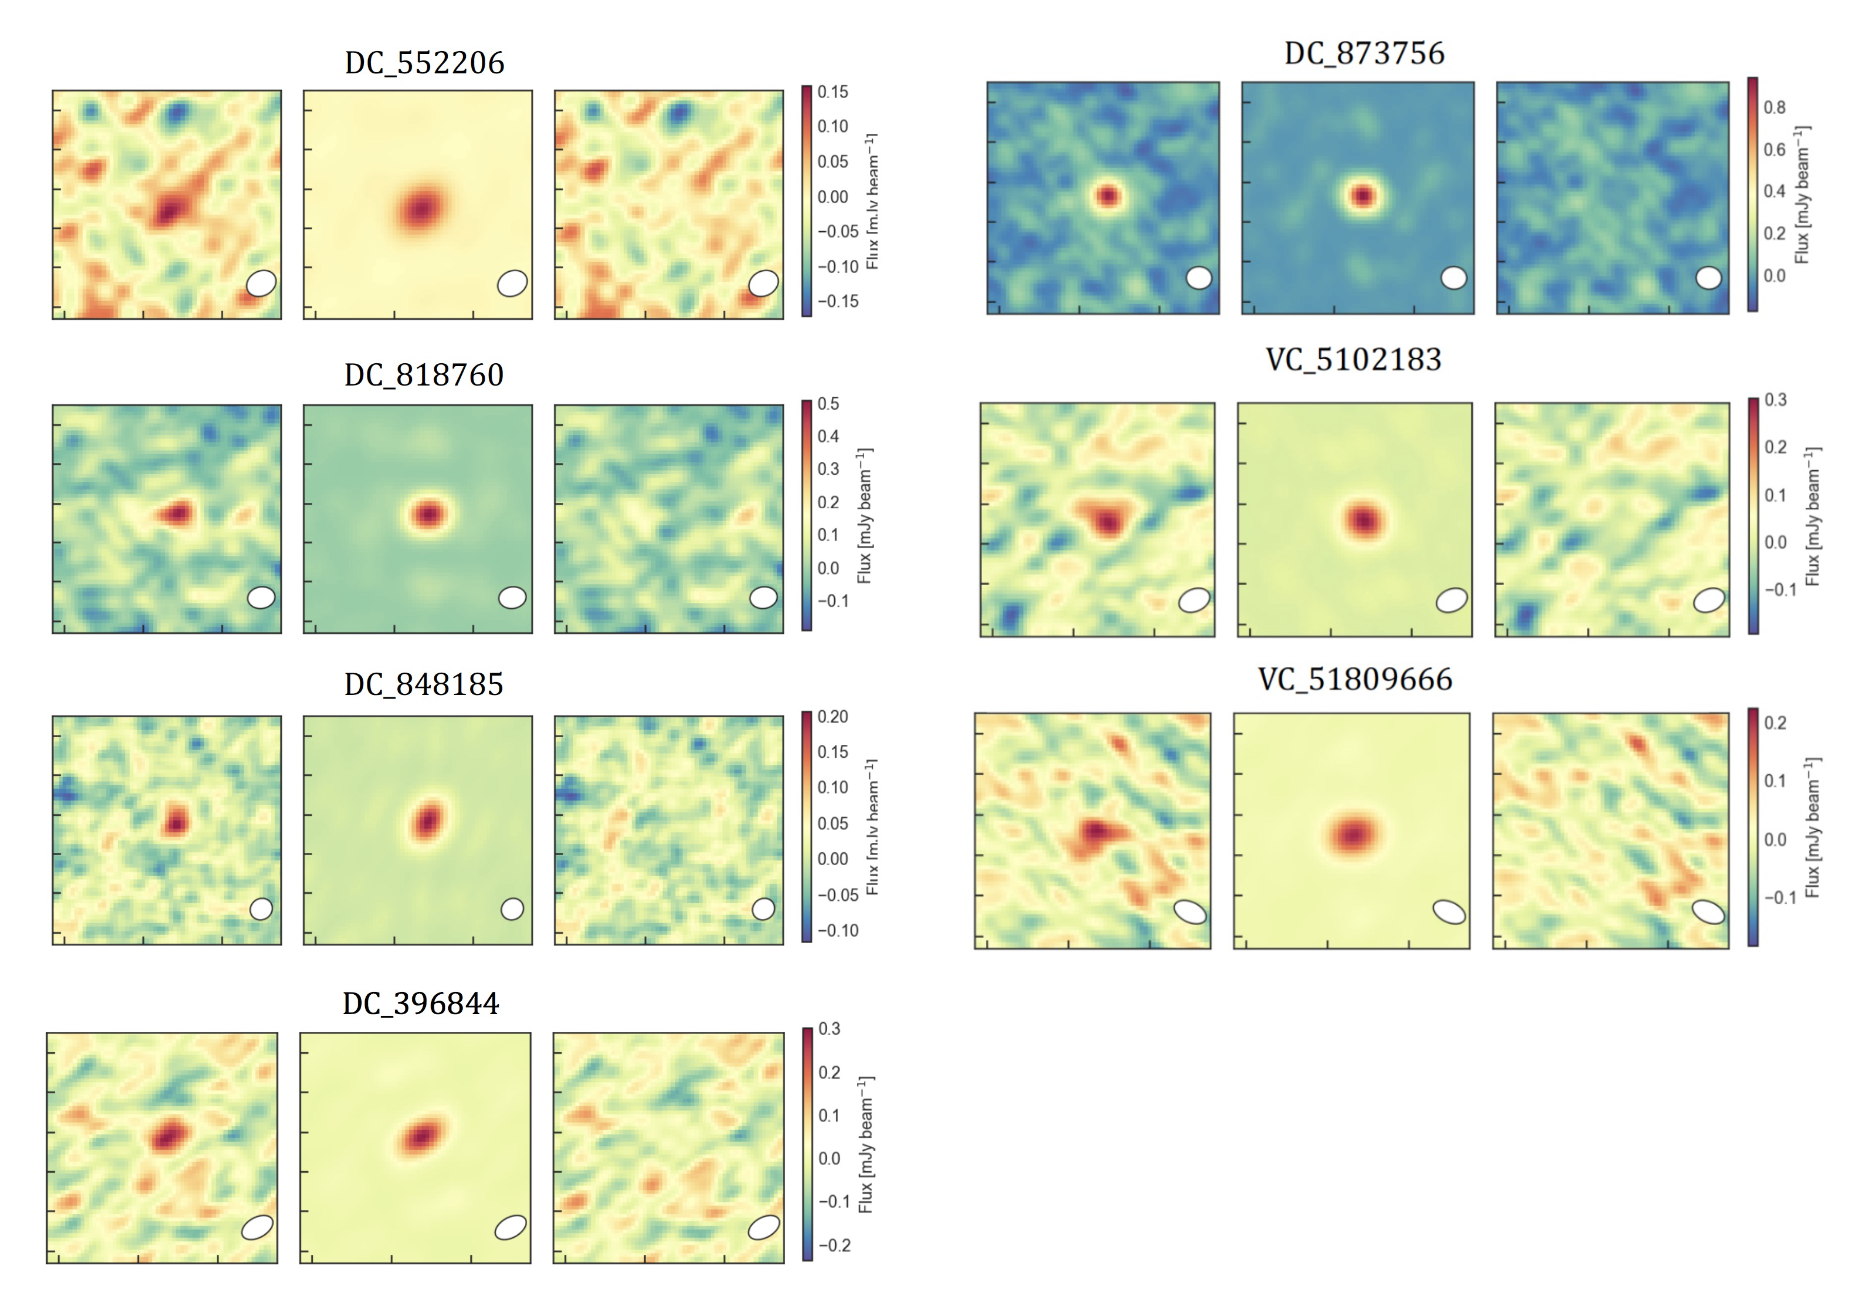
In Table 1 we report our size measurements. For 7 sources the fitting procedure returns a de-convolved FWHM along the minor and major axes, and we obtain a circularized effective radius (). We also visually check the observed, model and residual maps in the image plane to exclude multi-components below the scale of the beam (see Fig. 2). We note that for source DC818760, constituted by three galaxies (see Jones et al. 2020 and Devereaux et al. 2023), we measure and report the size of the central galaxy. For the remaining sources, since the fitting procedure reports de-convolved FWHM uncertainties larger or similar to the de-convolved FWHM measures, we estimate the size upper limit from the formula by Martí-Vidal et al. (2012) considering for the likelihood a value equal to 9 corresponding to a 3 cut-off. We note that 3 resolved sources (DC818760, DC848185, DC873756) are in common with the recent results from the CRISTAL survey (Mitsuhashi et al. 2023) and the size measurements are consistent within 1. Among the 5 unresolved sources, 2 sources (DC683613, VC5100822662) have a measured size in the CRISTAL sample consistent with our upper limits. The sources in common are highlighted in Table 1. In Table 1 along with , we report the circularized effective radius of the [CII] line emission () and of the rest-frame UV emission (). These radii were derived by Fujimoto et al. (2020) as follows: the [CII] radius from the ALMA ALPINE data using the CASA UVMODEL task described above; the rest-frame UV emission from the F814W HST map (Koekemoer et al. 2007) and the F160W HST maps (Koekemoer et al. 2011) using the GALFIT task (Peng et al. 2010). We only consider reliable size measurements (flag=0). Finally, in Table 1 we give the restframe optical radius derived from the empirical stellar masssize relation found recently by the JWST CEERS survey (Ward et al. 2023), given the stellar masses of our galaxies. We consider the masssize relation in the redshift range closer to our data (, see Table 1 in Ward et al. 2023).
3 Results
3.1 FIR, [CII] and UV sizes
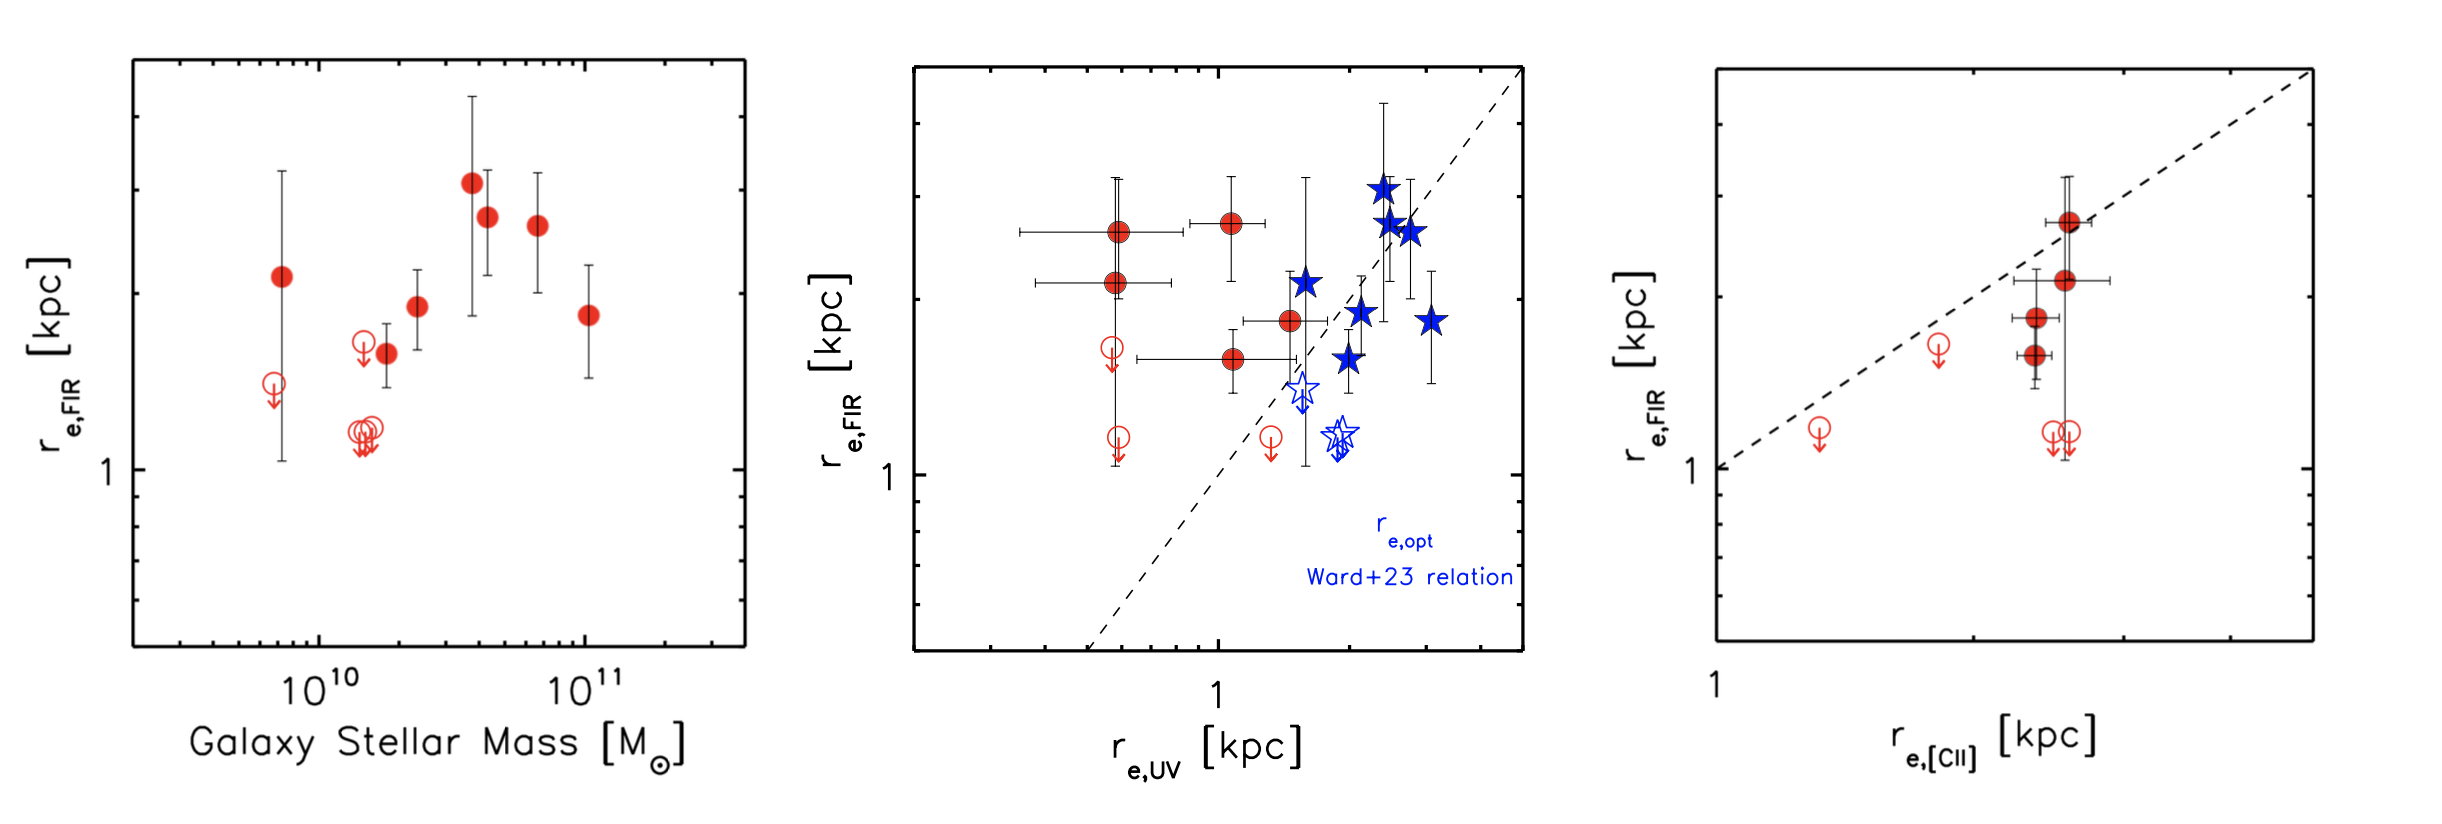
In Fig. 3 we report the of the 12 ALPINE targets considered in this work with a continuum detection (upper limits for the unresolved sources are displayed as open circles). In the left panel is presented as a function of M⋆, in the middle panel as a function of the rest-frame UV sizes and of the optical radius as derived by the JWST stellar masssize relation (Ward et al. 2023), and in the right panel as a function of the [CII] sizes .
We find the median value to be kpc, and the ratios and , calculated considering only the 7 rest-frame FIR resolved sources and the 5(4) galaxies with measured . The median ratio of the dust continuum sizes over the optical ones derived from the masssize relation is . The sizes are larger than those found for brighter FIR sources at similar redshifts (see the review from Hodge & da Cunha 2020 and references therein). They are slightly smaller than the [CII] sizes, tracing both the atomic and the molecular gas, and significantly larger (a factor of 2.5) than the rest-frame UV sizes, opposed to what has been found by other authors ( for galaxies at taken from the ALMA archive by Fujimoto et al. 2017; for a compilation of massive galaxies at in the GOODS-S by Franco et al. 2020) and in agreement with results from CRISTAL survey (Mitsuhashi et al. 2023). Moreover, our are significant smaller (up to a factor of 5-10) than the values predicted by the hydrodynamical cosmological simulations from Popping et al. (2022) and extrapolated at the stellar masses of our galaxies. This suggests that the model from Popping et al. (2022) could predict too compact FIR dust emission extension. Finally, we find that the dust continuum sizes are very close to the optical ones, as predicted from the JWST masssize relation, pointing towards a quite extended, disk-like star-formation region traced by the IR emission, very similar to the region traced by the rest-frame optical emission. We will discuss in Sect. 3.2 our findings in comparison with other results from literature and predictions from models.
3.2 FIR sizes versus IR luminosity and stellar masses
The study of scaling relations from infrared data stands as a cornerstone in astrophysics, offering a comprehensive perspective on the properties of galaxies related to their coldest components, i.e. neutral gas, molecular gas and dust (Calura et al. 2017; Herrera-Camus et al. 2018; Casasola et al. 2020; Pastrav 2020). A poorly explored, yet crucial quantity, is the size of dust emission in high-redshift galaxies. In this work, we aim to leverage this essential parameter to investigate pivotal scaling relations, i.e. the ones between size vs luminosity and size vs. stellar mass.
In Fig. 4, we report our measures of as a function of the IR luminosity LIR. Here, LIR has been computed from the rest-frame 158m emission assuming the Béthermin et al. (2017) SED.
Together with our measurements, we report all the available rest-frame FIR size measurements from the literature at similar redshifts (). To avoid bias introduced by the radial gradient in dust temperature (e.g. Calistro Rivera et al. 2018; Cochrane et al. 2019), we consider galaxies observed at nearly the same wavelengths of the ALPINE galaxies ( mm): this allows us to sample the rest-frame continuum emission at the same frequencies, given the same redshift range. In blue symbols we show the measurements from the GOODS-ALMA 2.0 survey (Gómez-Guijarro et al. 2022a). The GOODS-ALMA 2.0 survey is an ALMA blind survey at 1.1 mm covering an area of 72.42 arcmin2. The rest-frame FIR sizes were derived with a circular Gaussian model fit in the uv-plane, and combining the low and high-resolution observations, leading to an average resolution of 0.447′′ 0.418′′. Among the 88 blind detected sources in the GOODS-ALMA 2.0 survey, 4 sources satisfy our adopted selection criteria (), with the redshift estimated from photometry (Gómez-Guijarro et al. 2022a). In cyan symbols we report the dust continuum sizes of 6 galaxies from the super-deblended COSMOS and GOODS-North catalogues, selected for their very high photometric redshift ( ¿ 6, Jin et al. 2022). Thanks to the detection of [CI](1-0) and CO transitions, the authors were able to measure the spectroscopic redshifts and among the 6 sources, 4 sources satisfy our criteria (4 ¡ ¡ 6). The dust continuum sizes are derived from 870 m and 1 mm ALMA data.
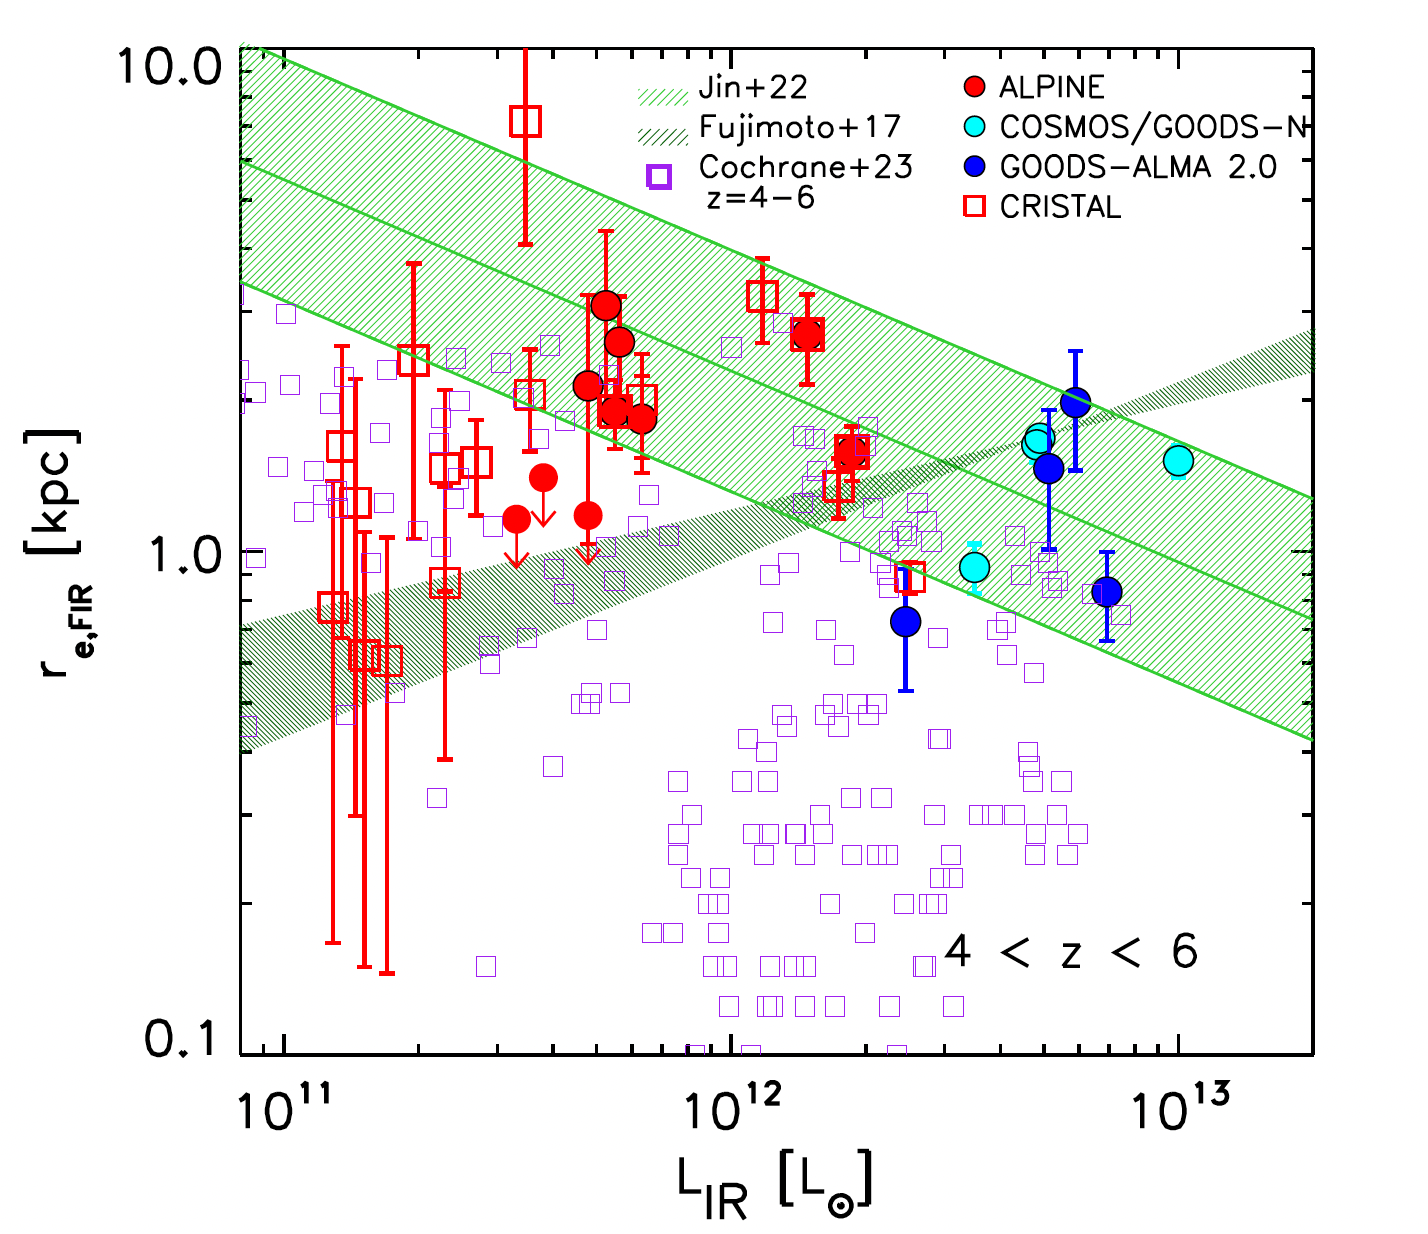
We also report as red open squares the recent measurements from Mitsuhashi et al. (2023) from the CRISTAL survey (see Herrera-Camus et al. in prep. for the survey paper). The CRISTAL survey is composed by 24 target galaxies, of which 20 from the ALPINE survey (5 in common with the sample analysed in the present work, see Table 1). This survey has been carried out at the same wavelengths of the ALPINE survey (Band 7: mm), but at higher spatial resolution (). As clear from Fig. 4, the CRISTAL sample probes the faintest galaxies studied so far, with FIR luminosities down to L, while our data probe a luminosity domain scarcely populated by the dataset of Mitsuhashi et al. (2023); in this regard, the CRISTAL sample and the ALPINE dust continuum resolved sources from the present work are complementary. The analysis of a dataset that probes bright galaxies alongside another one probing fainter counterparts, all at similar redshifts, provides us with a comprehensive understanding, allowing us to characterise different trends of the LIR relation in distinct regimes of luminosity and size.
In Fig. 4, we report for comparison 2 relations: the one found by Fujimoto et al. (2017) (dark-green shaded region, representing the 1 dispersion) and the one of Jin et al. (2022) (green line with its 1 dispersion displayed as shaded region). The result of Fujimoto et al. (2017) is based on a large sample of galaxies from the ALMA archive. Considering the sources all together (), these authors find a positive correlation between and LIR ( with ).
This correlation is confirmed by the authors also in the highest redshift range considered (2 ). Fujimoto et al. (2017) discussed that the origin of the LIR relation could be related to the formation of stellar disks, since the IR slope is similar to the slope observed in the UV band, the latter explained by the predictions of disk formation models (i.e. van der Wel et al. 2014). On the other side, the relation from Jin et al. (2022) is based on a different compilation of measurements at : the 6 galaxies analysed in their work, the galaxies from the GOODS-ALMA (Franco et al. 2020; Gómez-Guijarro et al. 2022a) and a sample of MS galaxies at (Valentino et al. 2020). Opposite to Fujimoto et al. (2017), in the latter work the authors find an anti-correlation between the dust size and LIR (log(FWHM size/kpc)= 0.38 log (L L☉)+1.42), indicating that galaxies with higher luminosities tend to have a more compact dust morphology.
In Fig. 4 we also show as pink empty squares the predictions from high-resolution, cosmological zoom-in simulations in a similar redshift range as sampled by the data (). These predictions are drawn from the FIRE (Hopkins et al. 2018) suite described in Cochrane et al. (2023) and were generated using the radiative transfer methods described by Cochrane et al. (2019), but extending the sample to lower FIR luminosities. To properly compare the model predictions to the data, we consider the observed-frame 850 m emission sizes.
Concerning the data, a positive correlation between and LIR is supported at faint luminosities by the ALMA-CRISTAL data. On the other hand, across a luminosity range wider than 1 dex and extending from L L☉ to L L☉, our measurements, together with the Jin et al. (2022) and Gómez-Guijarro et al. (2022b) data, support an anti-correlation between and LIR as found by Jin et al. (2022), at odd with the results from Fujimoto et al. (2017). We are aware of the small number of galaxies with a measured dust continuum size at high- () and high-LIR ( L☉); anyway, we caution the reader of possible observational biases which may affect the Fujimoto et al. (2017) relation, given the sample inhomogeneity in terms of spatial resolution and sensitivity and the use of photometric redshift for deriving sizes and LIR. Moreover, both the Jin et al. (2022) and Fujimoto et al. (2017) relations are obtained from samples including galaxies at lower than the range considered in this work (), and are both derived for IR-bright galaxies (L and L☉, respectively).
Altogether, our results might suggest a variable trend of FIR luminosity as a function of size, that ranges from an increase for faint objects, a downturn at some characteristic luminosity of the order of L☉, followed by a decreasing trend at brighter luminosities. A similar trend is shown also by the compilation of measures of Mitsuhashi et al. (2023), across a wider redshift range (). The predictions from the zoom-in simulations (Cochrane et al. 2023) cover a broader range in dust continuum sizes than the data but, as the measurements, they present a characteristic IR luminosity around L☉, above which the sizes decrease. Understanding the physical reason of this downturn and accounting for the characteristic luminosity value at which it occurs will be a major challenge for galaxy formation models.
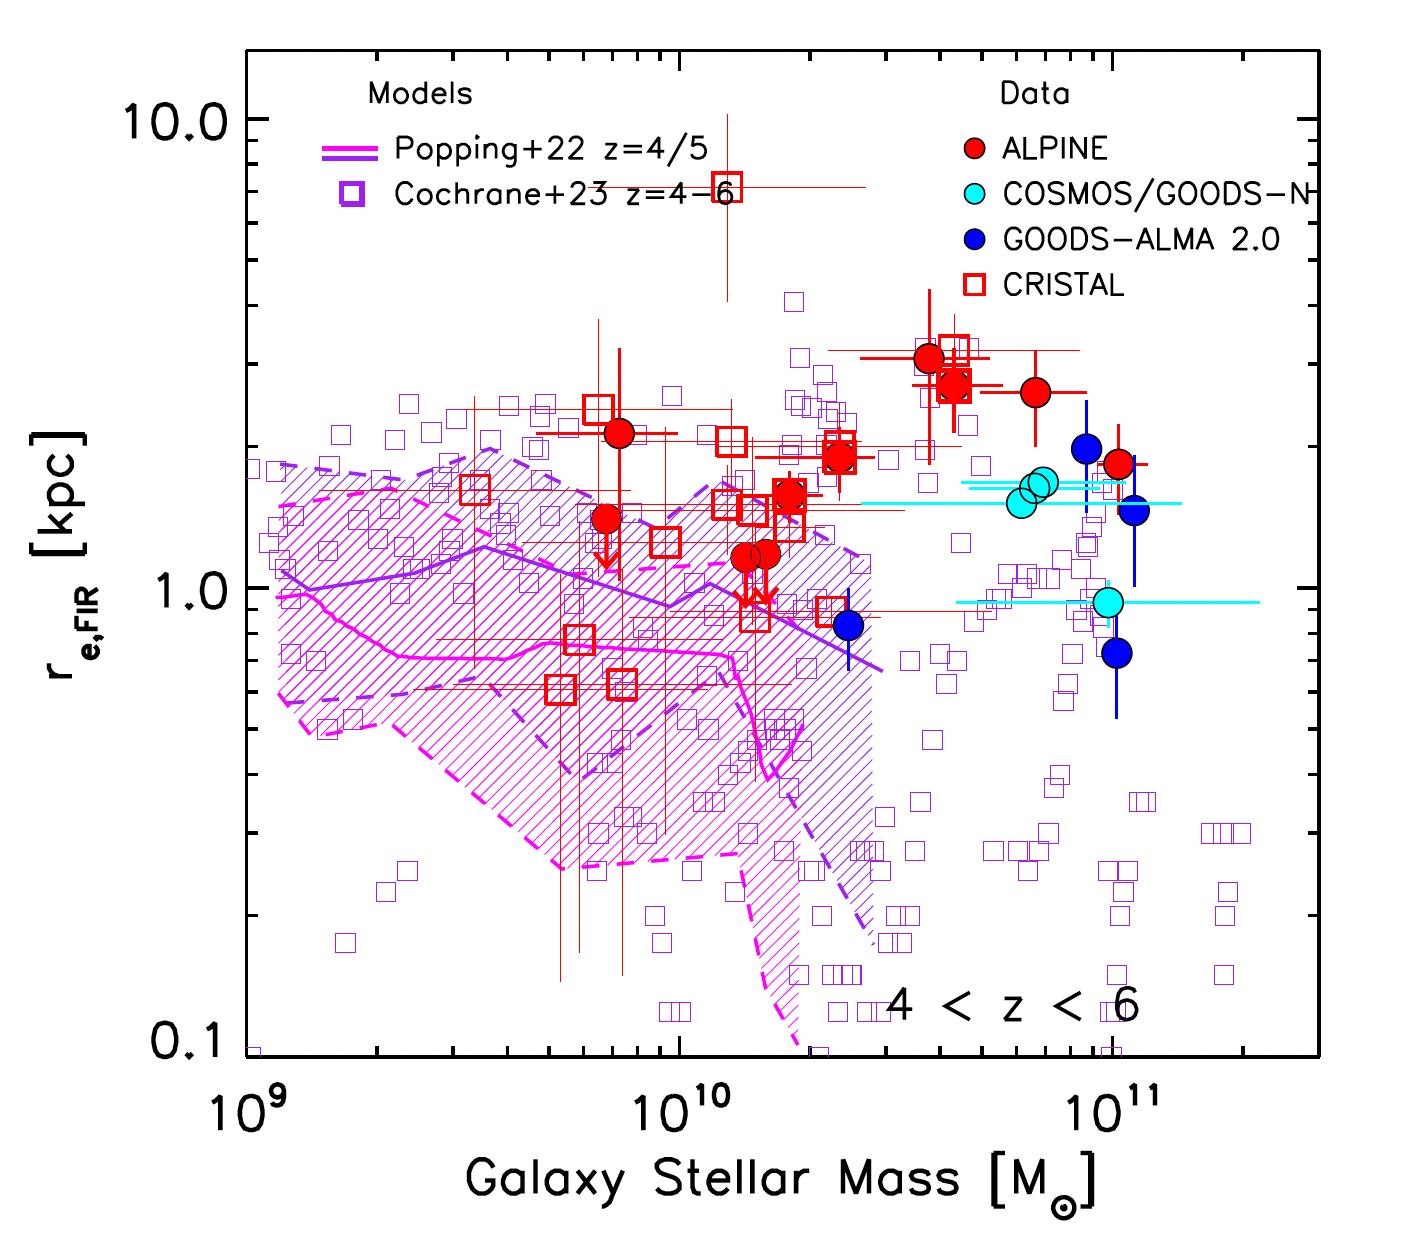
In Fig. 5 we report our as a function of the stellar mass M⋆. As in Fig. 4, along with our measurements, we show the other samples with dust continuum sizes measured in the literature at , from the GOODS-ALMA 2.0 survey (Gómez-Guijarro et al. 2022a), from the super deblended catalogues in the COSMOS and GOODS-North fields (Jin et al. 2022) and from the CRISTAL survey (Mitsuhashi et al. 2023).
In Fig. 5 together with the predictions from Cochrane et al. (2023) (pink empty squares for galaxies in the range 4 ) we also report the predictions from Popping et al. (2022) (magenta and violet lines with shaded regions marking the 1 scatter, for and galaxies, respectively). The predictions from Popping et al. (2022) are derived from the TNG50 simulations (Nelson et al. 2019; Pillepich et al. 2019), the highest resolution implementation of the magnetohydrodynamical cosmological simulation IllustrisTNG (see Springel et al. 2018; Marinacci et al. 2018). Also for these predictions, we consider the observed-frame 850 m emission sizes. Results for galaxy stellar masses up to and M☉ have been reported in the Popping et al. (2022) and Cochrane et al. (2019) simulations, respectively. The stellar mass range of our galaxies is not sampled in the volume of the Popping et al. (2022) simulation. At masses M☉, the model from Popping et al. (2022) predicts compact dust emission sizes ( kpc), similar to those observed in some CRISTAL galaxies (Mitsuhashi et al. 2023).
At masses M☉, a subset of model sources ( in the range 1010 MM M☉) from Cochrane et al. (2023) are predicted with large sizes, in the range of kpc, populating the upper envelope of the distribution and in agreement with the ALPINE galaxies analysed in the present work.
4 Discussion and Summary
Our study of the main-sequence ALPINE galaxies at shows effective radius of kpc, a factor of two larger than what is observed in brighter IR sources at similar . We confirm, in fact, the anti-correlation found by Jin et al. (2022) between the dust size and the IR luminosity in the LIR range between L☉ and L☉. A possible explanation for the anti-correlation is ascribed to galaxies caught at different phases of their star formation history, all within the scatter of the main-sequence (e.g. Sommovigo et al. 2021; Gómez-Guijarro et al. 2022b; Vallini et al. 2024). In this picture, the ALPINE galaxies are characterised by a mild SFR, a more extended (possibly disk-like) star formation region, while IR brighter galaxies are characterised by an enhanced SFR, short depletion time, and high dust temperatures. To validate this scenario, we consider the depletion times () and the gas fractions () for the ALPINE galaxies with a measured dust size, derived by Dessauges-Zavadsky et al. (2020) from the [CII] luminosities: Myrs and . These values are in agreement with those derived from Gómez-Guijarro et al. (2022b) for normal star-forming galaxies with an extended star-forming region, as opposite to the typical values of starburst galaxies, characterised by a more compact emission, shorter (of the order of 10-100 Myrs, see also Silverman et al. 2015, Scoville et al. 2023) and lower gas fraction (in the range 0.25-0.5, see Fig. 3 in Gómez-Guijarro et al. 2022b). Our finding is in line with the recent result obtained by Béthermin et al. (2023) on the Kennicutt-Schmidt (KS) relation at : they analysed 4 galaxies (3 in common with the present sample) at higher spatial resolution (), showing how MS galaxies have significantly lower , at a given , in comparison to high- starburst galaxies.
On the other hand, in fainter galaxies, the new CRISTAL sample (Mitsuhashi et al. 2023) supports a positive correlation between IR size and IR luminosity. Altogether, the data samples considered in this work, spanning 2 dex in IR luminosity, highlight a variable trend in the LIR relation, ranging from steeply increasing behaviour at L L☉, followed by a downturn and a decreasing trend at brighter luminosities.
Finally, we compare our dust emission sizes with the cosmological simulations of Cochrane et al. (2023) and Popping et al. (2022). Their results suggest smaller dust continuum sizes than our measurements but in Cochrane et al. (2023), the only simulation that extends up to our stellar masses, a tail of sizes as large as those observed in the ALPINE galaxies is predicted.
Future ALMA observations at higher resolution and in different bands will strengthen this result by enlarging the sample of galaxies with a measured size and by allowing the estimate of another key parameter: the dust temperature. Besides being crucial in the estimate of the dust mass (e.g. Bianchi 2013; Pozzi et al. 2021), this quantity is critically sensitive to the optical thickness of the dust-emitting region (e.g. Jin et al. 2022) and to the source physical area (hence its size, Gilli et al. 2022). Further elucidating the scaling relations presented here by means of improved observations and understanding the underlying physical mechanisms are important avenues for future investigation, and will provide fundamental insights in future galaxy evolution studies.
Acknowledgements.
This paper is dedicated to the memory of Olivier Le Fèvre, PI of the ALPINE survey. We thank the referee for their insightful comments. We acknowledge support from grant PRIN MIUR 2017- 20173ML3WW001. FP, VC, FE and FC acknowledge funding from the INAF Mini Grant 2022 program “Face-to-Face with the Local Universe: ISM’s Empowerment (LOCAL)”. FC acknowledges support from the INAF main-stream (1.05.01.86.31). EI acknowledges funding by ANID FONDECYT Regular 1221846.GEM acknowledges the Villum Fonden research grant 13160 “Gas to stars, stars to dust: tracing star formation across cosmic time,” grant 37440, “The Hidden Cosmos,” and the Cosmic Dawn Center of Excellence funded by the Danish National Research Foundation under the grant No. 140. MB acknowledges support from the French government through the France 2030 investment plan managed by the National Research Agency (ANR), as part of the Initiative of Excellence of Université Côte d’Azur under reference number ANR-15-IDEX-01.References
- Bagley et al. (2023) Bagley, M. B., Finkelstein, S. L., Koekemoer, A. M., et al. 2023, ApJ, 946, L12
- Barro et al. (2016) Barro, G., Kriek, M., Pérez-González, P. G., et al. 2016, ApJ, 827, L32
- Béthermin et al. (2023) Béthermin, M., Accard, C., Guillaume, C., et al. 2023, A&A, 680, L8
- Béthermin et al. (2020) Béthermin, M., Fudamoto, Y., Ginolfi, M., et al. 2020, A&A, 643, A2
- Béthermin et al. (2017) Béthermin, M., Wu, H.-Y., Lagache, G., et al. 2017, A&A, 607, A89
- Bianchi (2013) Bianchi, S. 2013, A&A, 552, A89
- Calistro Rivera et al. (2018) Calistro Rivera, G., Hodge, J. A., Smail, I., et al. 2018, ApJ, 863, 56
- Calura et al. (2017) Calura, F., Pozzi, F., Cresci, G., et al. 2017, MNRAS, 465, 54
- CASA Team et al. (2022) CASA Team, Bean, B., Bhatnagar, S., et al. 2022, PASP, 134, 114501
- Casasola et al. (2020) Casasola, V., Bianchi, S., De Vis, P., et al. 2020, A&A, 633, A100
- Cheng et al. (2020) Cheng, C., Ibar, E., Smail, I., et al. 2020, MNRAS, 499, 5241
- Cochrane et al. (2019) Cochrane, R. K., Hayward, C. C., Anglés-Alcázar, D., et al. 2019, MNRAS, 488, 1779
- Cochrane et al. (2023) Cochrane, R. K., Hayward, C. C., Anglés-Alcázar, D., & Somerville, R. S. 2023, MNRAS, 518, 5522
- Cole et al. (2023) Cole, J. W., Papovich, C., Finkelstein, S. L., et al. 2023, arXiv e-prints, arXiv:2312.10152
- Cooke et al. (2018) Cooke, E. A., Smail, I., Swinbank, A. M., et al. 2018, ApJ, 861, 100
- Dekel et al. (2013) Dekel, A., Zolotov, A., Tweed, D., et al. 2013, MNRAS, 435, 999
- Dessauges-Zavadsky et al. (2020) Dessauges-Zavadsky, M., Ginolfi, M., Pozzi, F., et al. 2020, A&A, 643, A5
- Devereaux et al. (2023) Devereaux, T., Cassata, P., Ibar, E., et al. 2023, arXiv e-prints, arXiv:2311.11493
- Faisst et al. (2020) Faisst, A. L., Schaerer, D., Lemaux, B. C., et al. 2020, ApJS, 247, 61
- Finkelstein et al. (2022) Finkelstein, S. L., Bagley, M. B., Arrabal Haro, P., et al. 2022, ApJ, 940, L55
- Franco et al. (2020) Franco, M., Elbaz, D., Zhou, L., et al. 2020, A&A, 643, A30
- Fujimoto et al. (2017) Fujimoto, S., Ouchi, M., Shibuya, T., & Nagai, H. 2017, ApJ, 850, 83
- Fujimoto et al. (2020) Fujimoto, S., Silverman, J. D., Bethermin, M., et al. 2020, ApJ, 900, 1
- Giacconi et al. (2002) Giacconi, R., Zirm, A., Wang, J., et al. 2002, ApJS, 139, 369
- Gilli et al. (2022) Gilli, R., Norman, C., Calura, F., et al. 2022, A&A, 666, A17
- Gómez-Guijarro et al. (2022a) Gómez-Guijarro, C., Elbaz, D., Xiao, M., et al. 2022a, A&A, 658, A43
- Gómez-Guijarro et al. (2022b) Gómez-Guijarro, C., Elbaz, D., Xiao, M., et al. 2022b, A&A, 659, A196
- Herrera-Camus et al. (2018) Herrera-Camus, R., Sturm, E., Graciá-Carpio, J., et al. 2018, ApJ, 861, 95
- Hodge & da Cunha (2020) Hodge, J. A. & da Cunha, E. 2020, Royal Society Open Science, 7, 200556
- Hopkins et al. (2018) Hopkins, P. F., Wetzel, A., Kereš, D., et al. 2018, MNRAS, 480, 800
- Jin et al. (2018) Jin, S., Daddi, E., Liu, D., et al. 2018, ApJ, 864, 56
- Jin et al. (2022) Jin, S., Daddi, E., Magdis, G. E., et al. 2022, A&A, 665, A3
- Jones et al. (2020) Jones, G. C., Béthermin, M., Fudamoto, Y., et al. 2020, MNRAS, 491, L18
- Koekemoer et al. (2007) Koekemoer, A. M., Aussel, H., Calzetti, D., et al. 2007, ApJS, 172, 196
- Koekemoer et al. (2011) Koekemoer, A. M., Faber, S. M., Ferguson, H. C., et al. 2011, ApJS, 197, 36
- Le Fèvre et al. (2020) Le Fèvre, O., Béthermin, M., Faisst, A., et al. 2020, A&A, 643, A1
- Liu et al. (2018) Liu, D., Daddi, E., Dickinson, M., et al. 2018, ApJ, 853, 172
- Marinacci et al. (2018) Marinacci, F., Vogelsberger, M., Pakmor, R., et al. 2018, MNRAS, 480, 5113
- Martí-Vidal et al. (2012) Martí-Vidal, I., Pérez-Torres, M. A., & Lobanov, A. P. 2012, A&A, 541, A135
- Mitsuhashi et al. (2023) Mitsuhashi, I., Tadaki, K.-i., Ikeda, R., et al. 2023, arXiv e-prints, arXiv:2311.17671
- Nelson et al. (2019) Nelson, D., Pillepich, A., Springel, V., et al. 2019, MNRAS, 490, 3234
- Pastrav (2020) Pastrav, B. A. 2020, MNRAS, 493, 3580
- Peng et al. (2010) Peng, C. Y., Ho, L. C., Impey, C. D., & Rix, H.-W. 2010, AJ, 139, 2097
- Pillepich et al. (2019) Pillepich, A., Nelson, D., Springel, V., et al. 2019, MNRAS, 490, 3196
- Popping et al. (2022) Popping, G., Pillepich, A., Calistro Rivera, G., et al. 2022, MNRAS, 510, 3321
- Pozzi et al. (2021) Pozzi, F., Calura, F., Fudamoto, Y., et al. 2021, A&A, 653, A84
- Puglisi et al. (2021) Puglisi, A., Daddi, E., Valentino, F., et al. 2021, MNRAS, 508, 5217
- Rujopakarn et al. (2016) Rujopakarn, W., Dunlop, J. S., Rieke, G. H., et al. 2016, ApJ, 833, 12
- Schaerer et al. (2020) Schaerer, D., Ginolfi, M., Béthermin, M., et al. 2020, A&A, 643, A3
- Scoville et al. (2007) Scoville, N., Aussel, H., Brusa, M., et al. 2007, ApJS, 172, 1
- Scoville et al. (2023) Scoville, N., Faisst, A., Weaver, J., et al. 2023, ApJ, 943, 82
- Silverman et al. (2015) Silverman, J. D., Daddi, E., Rodighiero, G., et al. 2015, ApJ, 812, L23
- Sommovigo et al. (2021) Sommovigo, L., Ferrara, A., Carniani, S., et al. 2021, MNRAS, 503, 4878
- Speagle et al. (2014) Speagle, J. S., Steinhardt, C. L., Capak, P. L., & Silverman, J. D. 2014, ApJS, 214, 15
- Springel et al. (2018) Springel, V., Pakmor, R., Pillepich, A., et al. 2018, MNRAS, 475, 676
- Tadaki et al. (2017) Tadaki, K.-i., Genzel, R., Kodama, T., et al. 2017, ApJ, 834, 135
- Talia et al. (2018) Talia, M., Pozzi, F., Vallini, L., et al. 2018, MNRAS, 476, 3956
- Valentino et al. (2020) Valentino, F., Magdis, G. E., Daddi, E., et al. 2020, ApJ, 890, 24
- Vallini et al. (2024) Vallini, L., Witstok, J., Sommovigo, L., et al. 2024, MNRAS, 527, 10
- van der Wel et al. (2014) van der Wel, A., Franx, M., van Dokkum, P. G., et al. 2014, ApJ, 788, 28
- Voigt & Bridle (2010) Voigt, L. M. & Bridle, S. L. 2010, Limitations of model-fitting methods for lensing shear estimation
- Ward et al. (2023) Ward, E. M., de la Vega, A., Mobasher, B., et al. 2023, arXiv e-prints, arXiv:2311.02162
- Witstok et al. (2022) Witstok, J., Smit, R., Maiolino, R., et al. 2022, MNRAS, 515, 1751