Chemical Diagnostics to Unveil Environments Enriched by First Stars
Abstract
Unveiling the chemical fingerprints of the first (Pop III) stars is crucial for indirectly studying their properties and probing their massive nature. In particular, very massive Pop III stars explode as energetic Pair-Instability Supernovae (PISNe), so their chemical products might escape in the diffuse medium around galaxies, opening the possibility to observe their fingerprints in distant gas clouds. Recently, three absorbers with abundances consistent with an enrichment from PISNe have been observed with JWST. In this Letter, we present novel chemical diagnostics to uncover environments mainly imprinted by PISNe. Furthermore, we revise the JWST low-resolution measurements by analysing the publicly available high-resolution X-Shooter spectra for two of these systems. Our results reconcile the chemical abundances of these absorbers with those from literature, which are found to be consistent with an enrichment dominated ( metals) by normal Pop II SNe. We show the power of our novel diagnostics in isolating environments uniquely enriched by PISNe from those mainly polluted by other Pop III and Pop II SNe. When the subsequent enrichment from Pop II SNe is included, however, we find that the abundances of PISN-dominated environments partially overlap with those predominantly enriched by other Pop III and Pop II SNe. We dub these areas confusion regions. Yet, the odd-even abundance ratios [Mg,Si/Al] are extremely effective in pinpointing PISNe-dominated environments and allowed us to uncover, for the first time, an absorber consistent with a PISN enrichment for all the six measured elements.
1 Introduction
Understanding the properties of the first (Pop III) stars and their impact on subsequent galaxy formation is a fundamental problem (e.g. Klessen & Glover, 2023). Discovering the chemical fingerprints of Pop III stars exploding as supernovae (SNe) is crucial to achieve this goal (e.g. Koutsouridou et al., 2023). Indeed, cosmological simulations show that Pop III stars were more massive than present-day stars (e.g. Hirano et al., 2014; Susa et al., 2014), an idea also supported by the persistent lack of metal-free stars (e.g. Rossi et al., 2021). Thus, most Pop III stars might have rapidly disappeared as SNe, promptly enriching the pristine gas with their newly formed chemical products.
Pop III SNe with various progenitor masses and explosion energies synthesize different heavy elements (e.g. Heger & Woosley, 2010; Kobayashi, 2012) thus producing distinctive chemical fingerprints (see Vanni et al., 2023a). These unique signatures can be observed in distant gaseous absorbers directly enriched by these pristine sources (Saccardi et al., 2023), or in long-lived metal-poor stars born in Pop III enriched environments (e.g. Frebel et al., 2019; Skúladóttir et al., 2021). Stellar evolution calculations for the chemical products of very massive pair instability SNe (PISNe, ) are extremely robust and predict unique abundance patterns, featuring a strong odd-even effect (Heger & Woosley, 2002; Takahashi, 2018).
Many efforts have been dedicated to seek out these unique PISN fingerprints (see Salvadori et al., 2019; Aguado et al., 2023; Caffau et al., 2023) and finally one possible pure PISN descendant has been found in the LAMOST survey (Xing et al., 2023). If predominantly enriched by PISN (see Jeena et al., 2024), this unique star will provide us with the first tight constraints on the initial mass function (IMF) of Pop III stars (Koutsouridou et al., 2024).
PISNe are very energetic ( erg), thus their metals can easily escape their hosting galaxies (e.g. Bromm et al., 2001; Smith et al., 2015) filling the diffuse circum-galactic and inter-galactic media (e.g. Pallottini et al., 2014). Thus, the long-waited discovery of this PISN descendant opens the concrete possibility to pinpoint the chemical fingerprint of PISNe in high- diffuse absorbers. Very recently, Christensen et al. (2023) reported chemical abundances consistent with a PISN enrichment for three absorbers observed in JWST QSO’s spectra. Indeed, they found that these systems have high [Si/O] values and only upper limits for [C/O] (see e.g. Ma et al., 2017; D’Odorico et al., 2023a).
In this letter, we aim at addressing the reliability of the JWST low-resolution measurements and the determination of the key abundance ratios that need to be measured in order to identify PISN-enriched environments. Our final goal is to provide new chemical diagnostics to pinpoint distant absorbers predominantly enriched by PISNe and other Pop III SNe.
2 Summary of the model
For this study we use the model first introduced by Salvadori et al. (2019) and then generalised by Vanni et al. (2023b). This simple and general parametric study investigates the chemical abundances (elements from C to Zn) of gaseous environments imprinted by a single Pop III SN and subsequently polluted by normal (Pop II) SNe. Pop III stars are indeed expected to predominantly form in isolation in low-mass mini-halos (e.g. Hirano et al., 2015). Furthermore, simulations show that in these proto-galaxies self-enrichment from a single Pop III SN can promptly trigger the formation of normal Pop II stars by enriching the inter-stellar medium (ISM) above the critical metallicity value (e.g. Ritter et al., 2012). The model is quite robust since our findings for ancient metal-poor stars (Vanni et al., 2023b; Skúladóttir et al., 2024) have been confirmed by more sophisticated cosmological chemical evolution models and simulations (Rossi et al., 2023; Koutsouridou et al., 2023). The model was used to unveil the Pop III star’s signature in distant gaseous absorbers (Salvadori et al., 2023, Sodini et al. submitted), which is a proof of its versatility.
The innovative aspects of our approach with respect to other simple models available in literature (e.g. Ishigaki et al., 2018; Welsh et al., 2021) are reported below.
A parametric study. The uncertainties related to early cosmic star-formation are enclosed in two free parameters:
the star-formation efficiency, , which quantifies the amount of cold gas turned into stars, and the dilution factor,
, which varies depending upon the amount of gas
available to dilute metals. A third parameter, , sets the fraction of metals in the ISM
provided by Pop III with respect to Pop II SNe.
The chemical abundances of the gas, [X/H], depend on the ratio and (see Vanni et al., 2023b),
and thus are evaluated by varying these unknowns in the full parameter space and . Conversely, the relative abundance ratios of different chemical elements, [X/Y], are strongly influenced by but they only indirectly depend on , which sets the initial metallicity of subsequent generations of Pop II stars (see Salvadori et al., 2019).
Exploring the properties of Pop III SNe. To investigate the whole range of unknown properties of Pop III SNe, we exploit the tabulated yields
of Heger & Woosley (2010), which represent the most complete datasets for Pop III SNe with progenitor masses between .
Indeed, the authors investigate the chemical products of these SNe, that can potentially explode with different energies: from the lowest-energy
faint SNe, erg, to the most energetic hypernovae, erg, adopting different mixing
parameters. Here we explore this full parameter space. For more massive, , Pop III stars exploding as energetic PISNe, erg, we adopt the yields by Heger & Woosley (2002).
Subsequent pollution by Pop II SNe. To study how the chemical abundances vary due to the further contribution of Pop II SNe,
we assume that Pop II stars are distributed according to a Larson’s IMF, with and compute the contribution of Pop II stars above different masses, which allow us to evaluate the effect of SNe
evolving on different time-scales (see Salvadori et al., 2019). For Pop II SNe we adopt the recent yields from Limongi & Chieffi (2018, non-rotating, set R).
3 Observational data
| QSO | UHS J0439+1634 | ULAS J1342+0928 | ULAS J1342+0928 |
|---|---|---|---|
| [Si/O] | |||
| – | – | ||
| – | – | ||
| – | – | ||
| – | – |
Our compiled literature sample consists of 50 different metal-poor absorption systems analysed in Cooke et al. (2011), Becker et al. (2012), Welsh et al. (2022), Saccardi et al. (2023) (only with [Fe/H]) and Christensen et al. (2023). The redshifts of the absorbers range between (Cooke et al., 2011) and (Christensen et al., 2023). These absorbers have different nature: 24 are Damped Lyman- systems (DLAs, Cooke et al., 2011; Welsh et al., 2022) and 19 more diffuse sub-DLAs and Lyman Limit systems (LLS, Saccardi et al., 2023). The systems at (Becker et al., 2012; Christensen et al., 2023) were selected from the presence of the O absorption, tracer of neutral gas, because the H content is hardly measurable at these redshifts. Therefore, they are DLAs or sub-DLAs, but their precise nature is unknown. The main elements whose abundances can be measured are C, O, Mg, Al, Si, and Fe, but these elements are simultaneously available for 9 absorbers only.
The two high-redshift QSOs UHS J0439+1634 () and ULAS J1342+0928 () have been observed recently with JWST/NIRSpec at low spectral resolution () and their spectra were analysed by Christensen et al. (2023). Both objects also have intermediate resolution () good signal-to-noise ratio VLT/X-Shooter data. The X-Shooter spectrum of UHS J0439+1634 was presented in D’Odorico et al. (2023b) and analysed in Davies et al. (2023). However, these authors do not identify the O 1302 transition associated with the system at , discussed by Christensen et al. (2023), because it falls in a spectral region already populated by other absorption lines (see Davies et al., 2023, for details). Our analysis of the system is reported in Appendix A.
The analysis of the X-shooter absorption spectrum of J1342+0928 is carried out in this work for the first time, and is briefly described in Appendix A. For the purpose of this paper, we analysed only the two O absorption systems at and for which Christensen et al. (2023) reported the chemical abundances. However, we carried out a first look analysis of the whole spectrum to verify that the transitions of the considered systems were not blended with lines from other systems.
Observed absorption features were identified and fitted with Voigt profiles to determine ionic column densities. Assuming that these systems are metal-poor DLAs, we derived chemical abundances from the ratio of the measured column densities (see e.g. Becker et al., 2012, Sodini et al. subm.) and adopting solar chemical abundances from Asplund et al. (2009). Measured column densities and plots of the absorption lines are reported in Appendix A.
3.1 New results
The abundances for the system in UHS J0439+1634 and the 2 systems in ULAS J1342+0928 as derived by Christensen et al. (2023) are shown in Fig. 1 with light red points. These points are connected with dashed lines to the revised abundances derived in this work (red stars), which are reported in Table 1. The new abundances derived from X-Shooter data agree with other systems in the literature, thanks to a decrease of the [Si/O] values of these absorbers of dex. The changes in relative abundances are generally due to an overestimate of the Si column densities in the NIRSpec spectra, possibly deriving from line blending. The only point from Christensen et al. (2023) that remains consistent with an enrichment from PISNe is due to the system at toward VDES J0020-3653, which at present does not have sufficient high-resolution observations to carry out the analysis of absorption lines.
4 Chemical diagnostics
In this Section, we introduce novel diagnostics to pinpoint systems predominantly enriched by PISNe.
4.1 Purely Pop III enriched environments
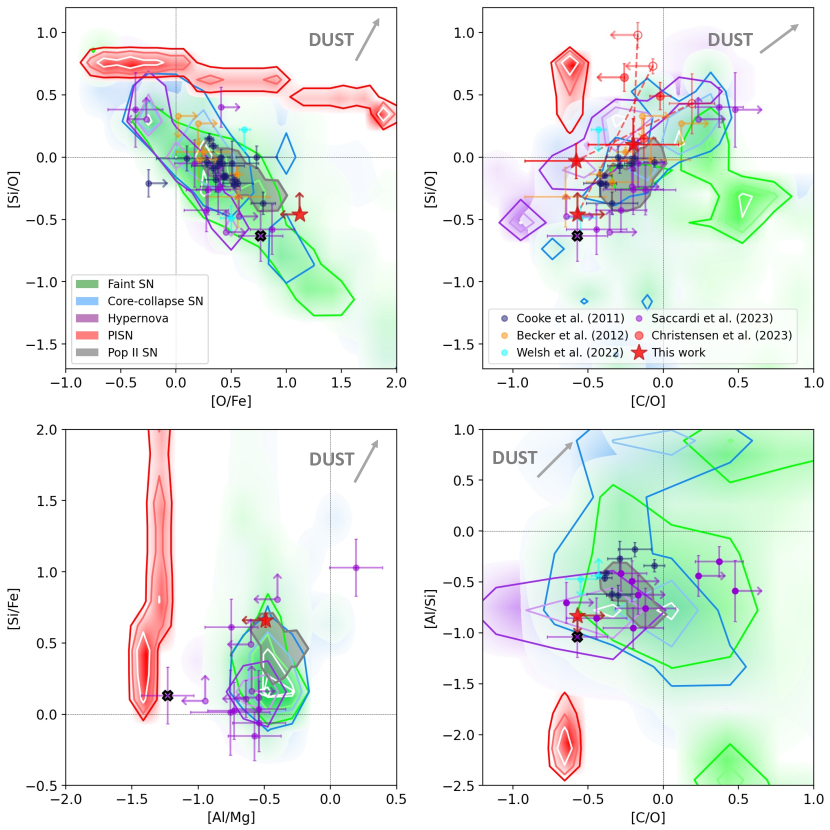
In Fig. 1, we compare the chemical abundance ratios measured in metal-poor absorbers with the predictions of our model for environments uniquely polluted by Pop III SNe, i.e., assuming and varying the mass and explosion energy of Pop III SNe (see Sec. 2). For reference we also show the predictions for environments polluted by normal Pop II SNe ().
The chemical diagnostics presented here were specifically selected to discern the environments enriched by PISNe from other SN types. Indeed, we see that PISN-polluted environments reside in very specific regions of the plots, having quite high [Si/O], low values of [C/O] and [Al/Si], and the lowest values of [Al/Mg]. Thus, the combination of the abundance ratios shown in Fig. 1 represents a powerful tool to pinpoint PISN-enriched environments. On the contrary, the environments enriched by the other types of Pop III SNe are not completely separated one from the other and their chemical abundance ratios partially overlap with those imprinted by normal Pop II SNe.
In Fig. 1 (top right), we see that only one of the systems presented in Christensen et al. (2023) remains consistent with an imprint from PISN. If the [Si/O] JWST measurement will be confirmed with higher resolution data, we predict the following ranges of abundances for other elements, which would imply that this absorber was truly and uniquely polluted by PISNe: [O/Fe], [Al/Si], [Si/Fe] and [Al/Mg].
Finally, we see that the different chemical abundances predicted for Pop III enriched environments and measured in various absorbers nicely follow the same trends, with several systems overlapping with the predicted abundances in the various chemical diagnostics. Does this mean that all these absorbers have been imprinted by Pop III SNe?
4.2 Pop II contribution: the confusion region
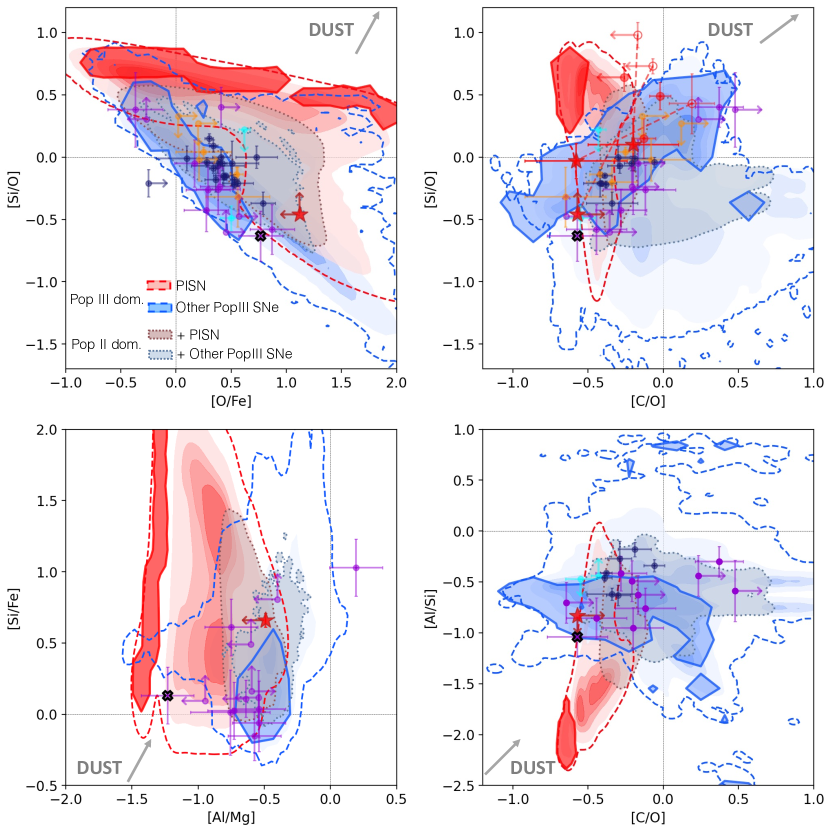
In Fig. 2 we show how the injection of heavy elements from Pop II SNe changes the chemical abundances of PISN- and other Pop III SN pre-enriched environments. To this end, we compute the probability density regions of environments solely ( metals), mainly (), and only partially () enriched by Pop III (PISNe or other SNe), thus varying . We see that the contribution of normal Pop II SNe enlarges the regions predominantly imprinted by PISNe, which partially overlap with those mainly enriched by other Pop III/II SNe. Furthermore, while there is still a partial separation between environments mainly polluted by PISNe and by other Pop III SNe, when Pop II SNe become the dominant contributors the two regions almost completely overlap, meaning that we are loosing the information about the pristine SNe that initially enriched these media.
In each diagnostic of Fig. 2, we notice the emergence of regions in which the chemical abundance ratios predicted for Pop III- (PISNe and other pristine SNe) and Pop II-dominated environments blend. We dub this area the confusion region, since environments dwelling in this specific zone might have been imprinted by very different sources: from a single Pop III SN, to a population of normal Pop II SNe. In Fig. 2, we see that the majority of the absorption systems present in the literature reside within the confusion regions and in particular, in most of the proposed diagnostics, they are consistent with an enrichment dominated by normal Pop II SNe, but not solely driven by Pop II SNe (see Fig. 1).
To pinpoint PISN- and other Pop III-enriched environments, we should thus look for absorbers that dwell outside of the confusion regions, i.e. in areas where the Pop III chemical fingerprints are preserved. To this end, we see that the odd-even abundance ratios are extremely effective in locating PISN dominated environments, for example [Al/Mg] and [Al/Si] . The absorption system at in the spectrum of J1018+0548 from Saccardi et al. (2023, black cross in Figs. 1,2,3) lies at [Al/Mg] and [Si/Fe] implying that it might be predominantly enriched by PISNe. However, when we consider its positions in other diagnostic plots, we see that this absorber is also consistent with being predominantly enriched by both PISNe and other Pop III SNe.
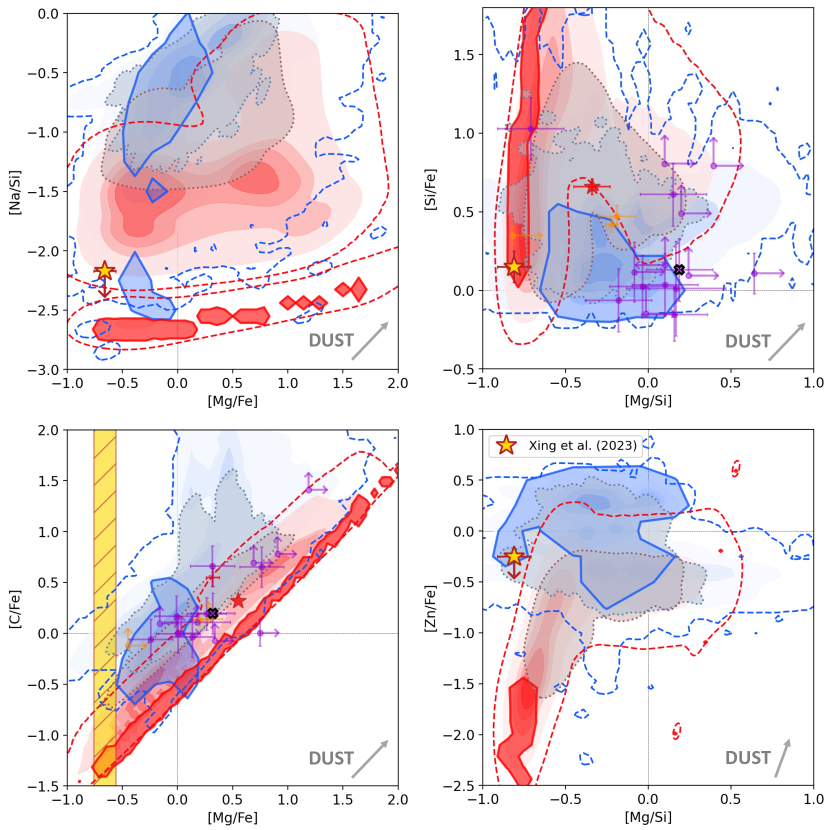
So far, we have confined our discussion to elements commonly measured in high- absorbers. However, in nearby stars, we typically measure other elements. For example, for the newly discovered LAMOST star likely imprinted by PISNe (J1010+2358, Xing et al., 2023), it was not possible to measure the abundances of C, O and Al, while they were determined for many elements heavier than Ca. In Fig. 3, we show other four chemical diagnostics for which the star J1010+2358 is always consistent with a PISN dominated enrichment. Measuring the C (or the Zn) abundance would be fundamental, since a value of [C/Fe] (or [Zn/Fe]) would imply an exclusive enrichment by PISNe.
4.3 A unique absorber
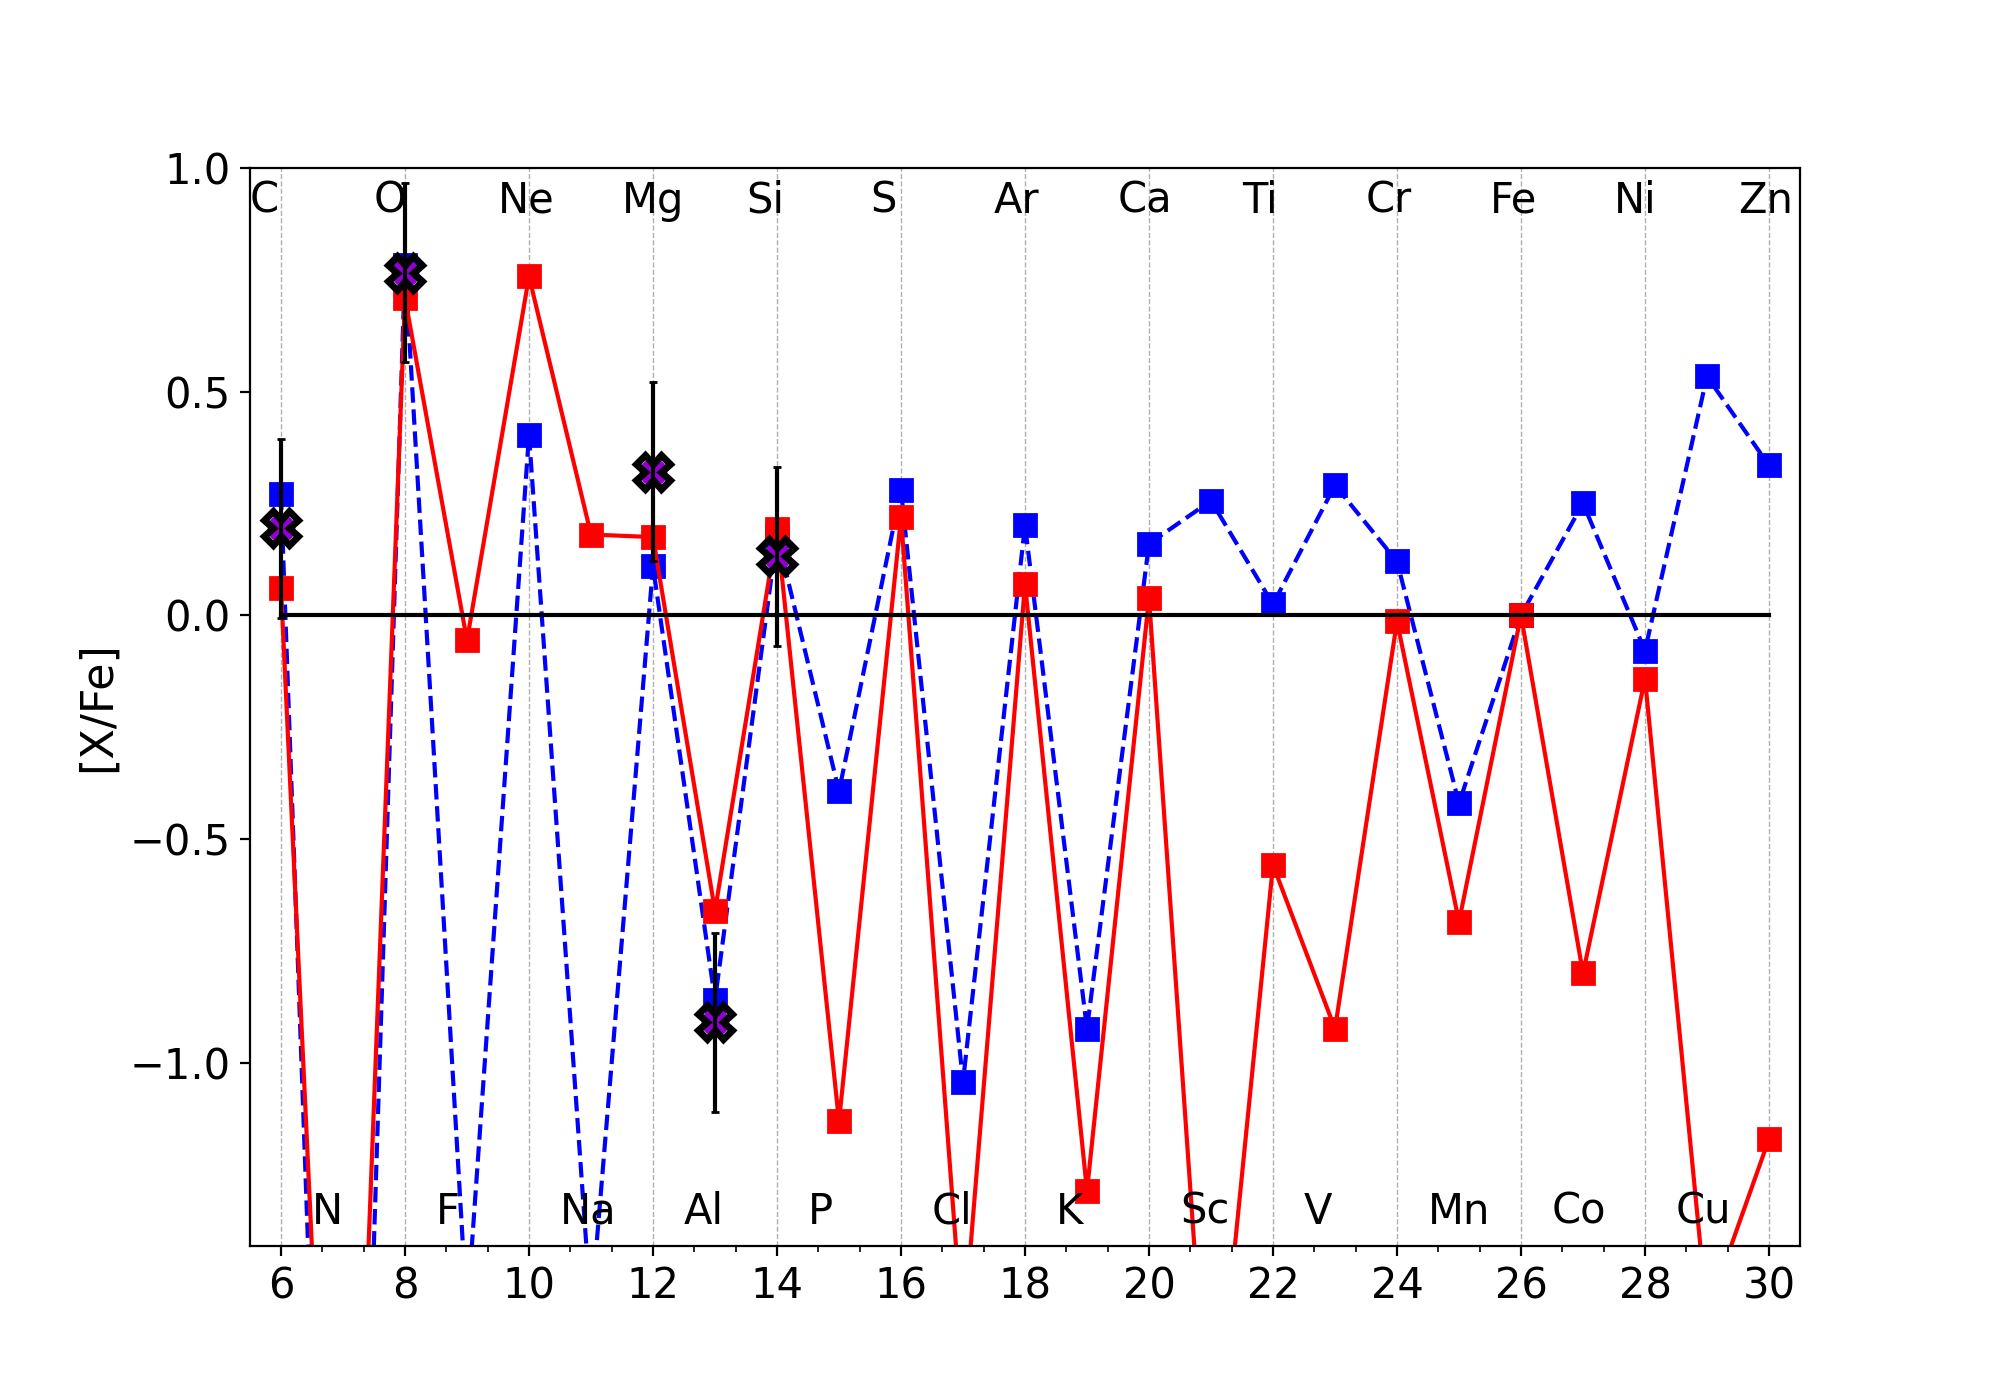
The absorber J1018+0548 agrees with an enrichment dominated by PISN or other Pop III SNe in all the proposed diagnostics (Fig. 2-3). By applying a chi square diagnostics (see Appendix B), we looked for the
models that best reproduce its abundance pattern (Fig. 4). The minimum
corresponds to an enrichment driven by two Pop III SNe ( erg).
However, a low 0.37, is also obtained when considering a pollution from a PISN
(contributing to 10% of the metals), and a Pop III SN with erg.
Both models fit very well the abundance ratios of the five light elements measured in the J1018+0548 absorber.
However they strongly differ for elements heavier than Ca, in particular [Zn/Fe] which is dex
lower for massive PISN enrichment.
5 Conclusions
In this Letter, we present novel chemical diagnostics to isolate PISN-enriched environments from those imprinted by other Pop III SNe and normal Pop II stars. To this end, we exploited the simple and general parametric model by Vanni et al. (2023b). We show that environments enriched by a single PISN dwell in well defined zones of the proposed chemical diagnostics. Indeed they cover dex in [X/Fe] but have characteristic values of [Al, Mg, Na/Si] and [Si, C/O], covering dex. However, when the contribution of normal Pop II SNe is accounted for, regions predominantly imprinted by PISNe ( of metals) grow and blend with those mainly enriched by other Pop III or Pop II SNe, creating the so-called confusion regions.
By comparing our model predictions with measurements in high- absorbers, we see that most systems in the literature have elemental abundances consistent with being mainly imprinted by normal Pop II SNe, in agreement with previous studies (e.g. Becker et al., 2012; Salvadori & Ferrara, 2012). Note that we do not account for dust depletion since most absorbers in our literature sample are metal-poor, meaning that dust should not affect substantially their chemical abundances (Vladilo et al., 2018; Saccardi et al., 2023). In Figs. 1, 2, 3, we show in which direction the predictions would shift if dust was present, using the prescriptions of Konstantopoulou et al. (2024).
Our analysis of the publicly available high-resolution X-Shooter spectra for two quasars presented by Christensen et al. (2023), reconcile the chemical abundances of two absorption systems with literature data, i.e., with an enrichment dominated by normal Pop II SNe. Only the system at along the sightline to VDES J0020–3653, for which high resolution spectra are not available, remains consistent with a PISN pollution for the three measured elements. Conversely, the Galactic halo star observed at high-resolution by Xing et al. (2023, 12 elements) is in agreement with an exclusive PISN-enrichment in all considered diagnostics. Still, more chemical elements (e.g., C) need to be measured to confirm a pure pollution by a massive PISN (see also Koutsouridou et al., 2024).
Our novel chemical diagnostics allowed us to uncover an absorption system ( in J1018+0548, Saccardi et al., 2023) that is consistent with being uniquely enriched by Pop III SNe (see Fig. 4). Notwithstanding the six chemical elements measured, to understand if this absorber was enriched by a PISN, it is crucial to measure zinc (Sec. 4.3). The high-resolution spectrograph ANDES for the ELT will allow us to achieve this goal, understanding the nature of this unique absorber (D’Odorico et al., 2023b).
Ultimately, armed with our novel chemical diagnostics and ANDES/ELT, we will be able to unveil these precious distant gas clouds, fully complementing stellar archaeology to shed light on the first stars and their role on early galaxy formation.
Acknowledgements
This project received funding from the ERC Starting Grant NEFERTITI H2020/808240 (PI: S. Salvadori). GDB was supported by the National Science Foundation through grant AST-1751404.
References
- Aguado et al. (2023) Aguado, D. S., Salvadori, S., Skúladóttir, Á., et al. 2023, MNRAS, 520, 866, doi: 10.1093/mnras/stad164
- Asplund et al. (2009) Asplund, M., Grevesse, N., Sauval, A. J., & Scott, P. 2009, ARA&A, 47, 481, doi: 10.1146/annurev.astro.46.060407.145222
- Becker et al. (2012) Becker, G. D., Sargent, W. L. W., Rauch, M., & Carswell, R. F. 2012, ApJ, 744, 91, doi: 10.1088/0004-637X/744/2/91
- Bromm et al. (2001) Bromm, V., Ferrara, A., Coppi, P. S., & Larson, R. B. 2001, MNRAS, 328, 969, doi: 10.1046/j.1365-8711.2001.04915.x
- Caffau et al. (2023) Caffau, E., Lombardo, L., Mashonkina, L., et al. 2023, MNRAS, 518, 3796, doi: 10.1093/mnras/stac3372
- Christensen et al. (2023) Christensen, L., Jakobsen, P., Willott, C., et al. 2023, A&A, 680, A82, doi: 10.1051/0004-6361/202347943
- Cooke et al. (2011) Cooke, R., Pettini, M., Steidel, C. C., Rudie, G. C., & Nissen, P. E. 2011, MNRAS, 417, 1534, doi: 10.1111/j.1365-2966.2011.19365.x
- Cupani et al. (2022) Cupani, G., D’Odorico, V., Cristiani, S., et al. 2022, in Astronomical Society of the Pacific Conference Series, Vol. 532, Astronomical Society of the Pacific Conference Series, ed. J. E. Ruiz, F. Pierfedereci, & P. Teuben, 207
- Davies et al. (2023) Davies, R. L., Ryan-Weber, E., D’Odorico, V., et al. 2023, MNRAS, 521, 289, doi: 10.1093/mnras/stac3662
- D’Odorico et al. (2023a) D’Odorico, V., Bolton, J. S., Christensen, L., et al. 2023a, arXiv e-prints, arXiv:2311.16803, doi: 10.48550/arXiv.2311.16803
- D’Odorico et al. (2023b) D’Odorico, V., Bañados, E., Becker, G. D., et al. 2023b, MNRAS, 523, 1399, doi: 10.1093/mnras/stad1468
- Frebel et al. (2019) Frebel, A., Ji, A. P., Ezzeddine, R., et al. 2019, ApJ, 871, 146, doi: 10.3847/1538-4357/aae848
- Hartwig et al. (2018) Hartwig, T., Yoshida, N., Magg, M., et al. 2018, MNRAS, 478, 1795, doi: 10.1093/mnras/sty1176
- Heger & Woosley (2002) Heger, A., & Woosley, S. E. 2002, ApJ, 567, 532, doi: 10.1086/338487
- Heger & Woosley (2010) —. 2010, ApJ, 724, 341, doi: 10.1088/0004-637X/724/1/341
- Hirano et al. (2015) Hirano, S., Hosokawa, T., Yoshida, N., Omukai, K., & Yorke, H. W. 2015, MNRAS, 448, 568, doi: 10.1093/mnras/stv044
- Hirano et al. (2014) Hirano, S., Hosokawa, T., Yoshida, N., et al. 2014, ApJ, 781, 60, doi: 10.1088/0004-637X/781/2/60
- Ishigaki et al. (2018) Ishigaki, M. N., Tominaga, N., Kobayashi, C., & Nomoto, K. 2018, ApJ, 857, 46, doi: 10.3847/1538-4357/aab3de
- Jeena et al. (2024) Jeena, S. K., Banerjee, P., & Heger, A. 2024, MNRAS, 527, 4790, doi: 10.1093/mnras/stad3498
- Klessen & Glover (2023) Klessen, R. S., & Glover, S. C. O. 2023, ARA&A, 61, 65, doi: 10.1146/annurev-astro-071221-053453
- Kobayashi (2012) Kobayashi, C. 2012, in Astronomical Society of the Pacific Conference Series, Vol. 458, Galactic Archaeology: Near-Field Cosmology and the Formation of the Milky Way, ed. W. Aoki, M. Ishigaki, T. Suda, T. Tsujimoto, & N. Arimoto, 113, doi: 10.48550/arXiv.1202.3356
- Konstantopoulou et al. (2024) Konstantopoulou, C., De Cia, A., Ledoux, C., et al. 2024, A&A, 681, A64, doi: 10.1051/0004-6361/202347171
- Koutsouridou et al. (2024) Koutsouridou, I., Salvadori, S., & Skúladóttir, Á. 2024, ApJL, 962, L26, doi: 10.3847/2041-8213/ad2466
- Koutsouridou et al. (2023) Koutsouridou, I., Salvadori, S., Skúladóttir, Á., et al. 2023, MNRAS, 525, 190, doi: 10.1093/mnras/stad2304
- Limongi & Chieffi (2018) Limongi, M., & Chieffi, A. 2018, ApJS, 237, 13, doi: 10.3847/1538-4365/aacb24
- Ma et al. (2017) Ma, Q., Maio, U., Ciardi, B., & Salvaterra, R. 2017, MNRAS, 472, 3532, doi: 10.1093/mnras/stx1839
- Nomoto et al. (2013) Nomoto, K., Kobayashi, C., & Tominaga, N. 2013, ARA&A, 51, 457, doi: 10.1146/annurev-astro-082812-140956
- Pallottini et al. (2014) Pallottini, A., Ferrara, A., Gallerani, S., Salvadori, S., & D’Odorico, V. 2014, MNRAS, 440, 2498, doi: 10.1093/mnras/stu451
- Ritter et al. (2012) Ritter, J. S., Safranek-Shrader, C., Gnat, O., Milosavljević, M., & Bromm, V. 2012, ApJ, 761, 56, doi: 10.1088/0004-637X/761/1/56
- Rossi et al. (2021) Rossi, M., Salvadori, S., & Skúladóttir, Á. 2021, MNRAS, 503, 6026, doi: 10.1093/mnras/stab821
- Rossi et al. (2023) Rossi, M., Salvadori, S., Skúladóttir, Á., & Vanni, I. 2023, MNRAS, 522, L1, doi: 10.1093/mnrasl/slad029
- Saccardi et al. (2023) Saccardi, A., Salvadori, S., D’Odorico, V., et al. 2023, ApJ, 948, 35, doi: 10.3847/1538-4357/acc39f
- Salvadori et al. (2019) Salvadori, S., Bonifacio, P., Caffau, E., et al. 2019, MNRAS, 487, 4261, doi: 10.1093/mnras/stz1464
- Salvadori et al. (2023) Salvadori, S., D’Odorico, V., Saccardi, A., Skúladóttir, Á., & Vanni, I. 2023, in Memorie della Societa Astronomica Italiana, Vol. 94, 215, doi: 10.36116/MEMSAIT_94N2.2023.215
- Salvadori & Ferrara (2012) Salvadori, S., & Ferrara, A. 2012, MNRAS, 421, L29, doi: 10.1111/j.1745-3933.2011.01200.x
- Skúladóttir et al. (2024) Skúladóttir, Á., Vanni, I., Salvadori, S., & Lucchesi, R. 2024, A&A, 681, A44, doi: 10.1051/0004-6361/202346231
- Skúladóttir et al. (2021) Skúladóttir, Á., Salvadori, S., Amarsi, A. M., et al. 2021, ApJL, 915, L30, doi: 10.3847/2041-8213/ac0dc2
- Smith et al. (2015) Smith, B. D., Wise, J. H., O’Shea, B. W., Norman, M. L., & Khochfar, S. 2015, MNRAS, 452, 2822, doi: 10.1093/mnras/stv1509
- Susa et al. (2014) Susa, H., Hasegawa, K., & Tominaga, N. 2014, ApJ, 792, 32, doi: 10.1088/0004-637X/792/1/32
- Takahashi (2018) Takahashi, K. 2018, ApJ, 863, 153, doi: 10.3847/1538-4357/aad2d2
- Vanni et al. (2023a) Vanni, I., Salvadori, S., & Skúladóttir, Á. 2023a, in Memorie della Societa Astronomica Italiana, Vol. 94, 84, doi: 10.36116/MEMSAIT_94N2.2023.84
- Vanni et al. (2023b) Vanni, I., Salvadori, S., Skúladóttir, Á., Rossi, M., & Koutsouridou, I. 2023b, MNRAS, 526, 2620, doi: 10.1093/mnras/stad2910
- Vladilo et al. (2018) Vladilo, G., Gioannini, L., Matteucci, F., & Palla, M. 2018, ApJ, 868, 127, doi: 10.3847/1538-4357/aae8dc
- Welsh et al. (2021) Welsh, L., Cooke, R., & Fumagalli, M. 2021, MNRAS, 500, 5214, doi: 10.1093/mnras/staa3342
- Welsh et al. (2022) Welsh, L., Cooke, R., Fumagalli, M., & Pettini, M. 2022, ApJ, 929, 158, doi: 10.3847/1538-4357/ac4503
- Xing et al. (2023) Xing, Q.-F., Zhao, G., Liu, Z.-W., et al. 2023, Nature, doi: 10.1038/s41586-023-06028-1
Appendix A Analysis of X-Shooter quasar spectra
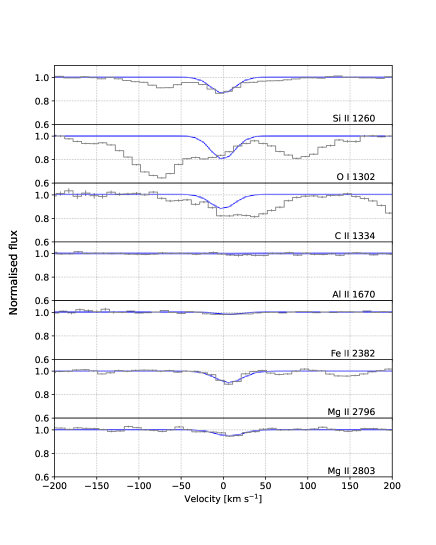
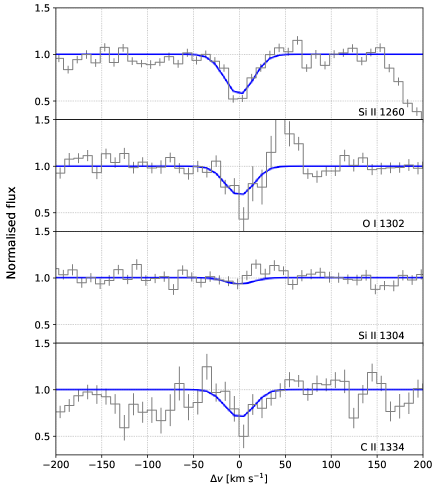
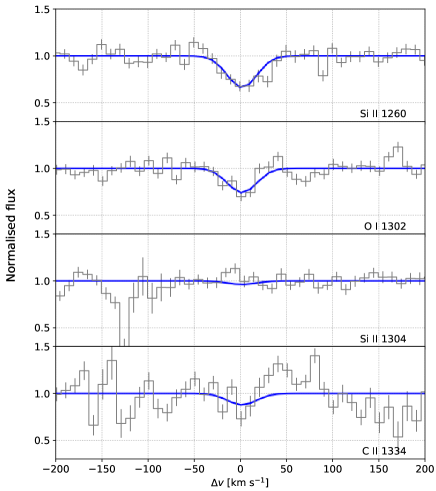
In this section, we report the results of the fit of three absorption systems discussed in Christensen et al. (2023) for which we analysed the corresponding X-Shooter spectra. The spectrum of UHS J0439+1628 is the one released by the XQR-30 collaboration (D’Odorico et al., 2023b), while the spectrum of ULAS J1342+0928 was reduced and analysed in this work. Briefly, ULAS J1342+0928 was observed with VLT/X-Shooter in 2017 and 2018 (PID 098.B-0537, 0100.A-0898) for h adopting a slit of 0.6” in the NIR arm. We retrieved the raw frames from the ESO archive and reduced them with the custom pipeline described in D’Odorico et al. (2023b). The combined spectrum has a nominal resolving power and a signal-to-noise ratio S/N per 10 km s-1 bin at rest frame. This value, converted to the JWST/NIRSpec wavelength bin at m ( km s-1) increases to S/N , comparable to the one of the spectra analysed by Christensen et al. (2023, S/N , see their Fig. 5).
The absorption lines have been fitted with Voigt profiles using the Python package Astrocook (Cupani et al., 2022). For the three analysed systems, we assumed that the Doppler parameters were the same for all observed transitions. In the case of the two systems along the spectrum of ULAS J1342+0928, we fixed the Doppler parameter to the minimum value allowed by the resolving power of the observations (see Sodini et al. subm.). Due to the limited NIR coverage of the X-Shooter spectrum with respect to the NIRSpec one, we do not cover the Mg doublet transitions for either system.
In the case of the system at in the spectrum of UHS J0439+1628, Christensen et al. (2023) identify as O 1302 at an absorption feature which Davies et al. (2023) fit in the X-Shooter spectrum as a C doublet at . For the purpose of this paper and in order to compare with the results by Christensen et al. (2023), we derived a conservative upper limit on the O column density fitting the observed absorption assuming the redshift and the Doppler parameter of the Si 1260 absorption line of this system, i.e. assuming . The very good quality of the X-Shooter spectrum allowed us also to measure the column density of a very weak Fe 2382 absorption line and to determine an upper limit to the transition of Al 1670 . The absorption lines and the Voigt profile fit for the three studied systems are shown in Fig. 5, 6 and 7; while the measured column densities are reported in Table 2.
Appendix B Fitting procedure
The is computed following the equation proposed by Heger & Woosley (2010), which is general and allows us to include the contribution of upper/lower limit measurements in the calculation:
| (B1) |
where and are the observed and theoretically predicted abundance ratios [Xi/Fe] and are their respective errors. In order to account for the uncertainties on the stellar yields, we assume , as suggested by Nomoto et al. (2013) and Hartwig et al. (2018). is the Heaviside function. The reduced chi-square, , is computed as , where N is the number of data points with finite measurements, L (U) is the number of data points with lower (upper) limits and M is the number of free parameters of the model (M with fixed mixing parameter of Pop III SNe).
To find the best model for the enrichment of the absorption system at in the sightline of the QSO J1018+0548 (Saccardi et al., 2023), we look for the minimum by considering all the models presented in Sec. 2 (see Fig. 1, 2, 3), i.e. by accounting for an enrichment: (i) uniquely driven by a single PISN or a Pop III SN with different mass/energy; (ii) mainly ( metals) driven by a single PISN/other Pop III SN with the contribution of Pop II SNe; (iii) only partially ( metals) driven by a single PISN/other Pop III SN with the contribution of Pop II SNe. Furthermore, we also consider an imprint from two Pop III SNe with various masses and energies, including PISNe. As shown in Fig. 4 these models provide the best fits.
| QSO | UHS J0439+1634 | ULAS J1342+0928 | ULAS J1342+0928 |
|---|---|---|---|
| [km s-1] | 8 | 8 | |
| C II | |||
| O I | |||
| Si II | |||
| Mg II | – | – | |
| Al II | – | – | |
| Fe II |