The DESI Early Data Release White Dwarf Catalogue
Abstract
The Early Data Release (EDR) of the Dark Energy Spectroscopic Instrument (DESI) comprises spectroscopy obtained from 2020 December 14 to 2021 June 10. White dwarfs were targeted by DESI both as calibration sources and as science targets and were selected based on Gaia photometry and astrometry. Here we present the DESI EDR white dwarf catalogue, which includes 2706 spectroscopically confirmed white dwarfs of which approximately 1630 ( per cent) have been spectroscopically observed for the first time, as well as 66 white dwarf binary systems. We provide spectral classifications for all white dwarfs, and discuss their distribution within the Gaia Hertzsprung–Russell diagram. We provide atmospheric parameters derived from spectroscopic and photometric fits for white dwarfs with pure hydrogen or helium photospheres, a mixture of those two, and white dwarfs displaying carbon features in their spectra. We also discuss the less abundant systems in the sample, such as those with magnetic fields, and cataclysmic variables. The DESI EDR white dwarf sample is significantly less biased than the sample observed by the Sloan Digital Sky Survey, which is skewed to bluer and therefore hotter white dwarfs, making DESI more complete and suitable for performing statistical studies of white dwarfs.
keywords:
white dwarfs – surveys – catalogues – techniques: spectroscopic1 Introduction
White dwarfs are the stellar remnants left over from the evolution of main sequence stars born with masses (Iben et al., 1997; Dobbie et al., 2006). Sustained against gravity by the pressure of degenerate electron gas, white dwarfs are Earth-sized and intrinsically faint objects. White dwarfs emerge from the giant branch evolution of their progenitors extremely hot, K, but in the absence of nuclear fusion, they gradually cool. Throughout their evolution, white dwarfs have similar optical colours as much more luminous and distant quasars and main sequence stars. Consequently, the selection of foreground white dwarfs has been difficult against the much more numerous background contaminants.
Early samples were based on proper motion searches (e.g. Giclas et al., 1965), and while they were fairly representative of the intrinsic white dwarf population, only yielded a few hundred confirmed white dwarfs. Photometric surveys for blue-excess objects and individual follow-up spectroscopy identified white dwarfs (Green et al., 1986; Homeier et al., 1998; Christlieb et al., 2001) – however, these samples were heavily biased towards hot ( K) and young ( Gyr) systems. Major progress was made possible by wide-area multi-object spectroscopic surveys, including the Two-degree-Field Galaxy Redshift Survey (2dF, Vennes et al. 2002), the Large Sky Area Multi-Object Fiber Spectroscopic Telescope Survey (LAMOST, Guo et al. 2015), and the Sloan Digital Sky Survey (SDSS, Kleinman et al. 2004, 2013; Eisenstein et al. 2006; Kepler et al. 2021), with the latter producing the largest and most homogeneous white dwarf sample to date. Yet, even the SDSS white dwarf sample was still subject to complex selection effects (Richards et al., 2002; Kleinman et al., 2004), as white dwarfs were targeted serendipitously.
An unbiased selection of white dwarfs became only possible with photometry and astrometry from Gaia, leading to a deep and homogeneous all-sky sample of high-confidence white dwarf candidates (Gentile Fusillo et al., 2019, 2021). Follow-up spectroscopy is essential to both confirm the white dwarf nature of these candidates, and determine their physical properties.
Research areas making use of large samples of white dwarfs with accurately determined characteristics include, but are not limited to:
- •
-
•
The composition and evolution of planetary systems (Zuckerman & Becklin, 1987; Jura, 2003; Zuckerman et al., 2007; Gänsicke et al., 2012; Zuckerman, 2015; Vanderburg et al., 2015; Swan et al., 2019; Schreiber et al., 2019; Hollands et al., 2021; Izquierdo et al., 2021; Kaiser et al., 2021; Klein et al., 2021; Trierweiler et al., 2023; Rogers et al., 2024; Swan et al., 2024).
- •
-
•
The physics of accretion discs in isolated and binary systems (Kraft, 1962; Tapia, 1977; Horne & Marsh, 1986; Marsh & Horne, 1988; Gänsicke et al., 2009b; Manser et al., 2016; Cauley et al., 2018; Manser et al., 2021; Steele et al., 2021; Cunningham et al., 2022; Inight et al., 2023; Okuya et al., 2023).
- •
Spectroscopic follow-up of the Gaia white dwarf candidate sample will be obtained as part of four of the next generation multi-object spectroscopic surveys. While the William Herschel Telescope Enhanced Area Velocity Explorer (WEAVE, Dalton et al. 2012, 2016 and the 4-metre Multi-Object Spectroscopic Telescope (4MOST, de Jong et al. 2016) are expected to come online in the near future, SDSS-V (Kollmeier et al., 2017; Almeida et al., 2023) and the Dark Energy Spectroscopic Instrument (DESI, DESI Collaboration et al. 2016a, b, 2023) survey are already collecting white dwarf spectra. The DESI survey obtained commissioning and survey validation observations from 2020 December 14 to 2021 June 10 (DESI Collaboration et al., 2024), which have been released as the DESI Early Data Release (EDR, DESI Collaboration et al. 2023). The data observed in this release include more than 4000 white dwarf candidates.
In this paper we present the DESI EDR sample of white dwarfs and associated systems. We describe the observations used in this work in Section 2. We then describe how we constructed the DESI EDR white dwarf sample in Section 3, and broadly describe the subsystems included along with a comparison to the Sloan Digital Sky Survey (SDSS) in Section 4. In Section 5 we give a more detailed discussion and analysis of white dwarf sub-types of interest, and conclude with our findings in Section 6.
2 Observations
2.1 DESI
DESI on the Mayall 4-m telescope at Kitt Peak National Observatory (KPNO) is a multi-object spectroscopic instrument capable of collecting fibre spectroscopy on up to targets per pointing (DESI Collaboration et al., 2022). The fibres are positioned by robot actuators and are grouped into ten petals which feed ten identical three-arm spectrographs, each spanning 3600 – 9824 Å at a full width at half maximum resolution of Å. The inter-exposure sequence which includes telescope slewing, spectrograph readout and focal plane reconfiguration can be completed in as little as min (DESI Collaboration et al., 2022). The acquired data is then wavelength- and flux-calibrated with the DESI processing and reduction pipeline (for a full description see Guy et al., 2023).
The DESI survey started main-survey operations on 2021 May 14 and will obtain spectroscopy of more than 40 million galaxies and quasars over five years to explore the nature of dark matter. During sub-optimal observing conditions (e.g., poor seeing or high lunar illumination), observations switch focus to nearby bright galaxies (Ruiz-Macias et al., 2020; Hahn et al., 2022) and stars (Allende Prieto et al., 2020; Cooper et al., 2023). As part of this ‘BRIGHT’ program, the DESI survey is targeting white dwarfs.
2.1.1 DESI targeting of white dwarfs
The target selection of white dwarfs for the DESI survey is described in Cooper et al. (2023) § 4.4.1. For the main survey, these selection criteria use Gaia DR2 photometry and Gaia EDR3 astrometry, and are based on equations defined in GF19. DESI EDR observations also follow these same criteria but use Gaia DR2 astrometry. Applying the white dwarf target selection within the DESI footprint results in 66 811 white dwarf candidates, where over 99 per cent of these targets are expected to be allocated a fibre during the main survey (see fig. 1 and table 2 of Cooper et al. 2023). However, as fibre assignment is done on the fly immediately before an observation is made, the details of what individual white dwarfs are observed by DESI is not predictable in advance (Schlafly et al., 2023).
Targets selected as white dwarf candidates can be easily identified by their target bitmask (as detailed in Myers et al. 2023 and DESI Collaboration et al. 2023), and 3437 of them were assigned fibres as part of the DESI EDR sample. We additionally cross-matched the entire DESI EDR sample with the GF19 Gaia DR2 white dwarf catalogue using the unique Gaia DR2 source ID to identify additional white dwarf candidates that may have been observed by other programs in the main survey. This resulted in an additional 627 targets, for a total number of 4064 DESI EDR white dwarf candidates.
The majority of white dwarfs targeted in the DESI EDR were observed more than once, and for the construction of the white dwarf catalogue we produced uncertainty-weighted co-adds using all the individual exposures for each white dwarf candidate and combined all spectra obtained in each of the three spectral arms. Across the 4064 white dwarf candidates targeted, a total of 31 842 single-object exposures were obtained. However, during commissioning and the early parts of survey validation some observed spectra were of poor quality, leading to 4852 exposures with a median signal-to-noise ratio in all three spectral arms. As a result, 391 white dwarf candidates observed during DESI EDR had unusable spectroscopy, resulting in a set of 3673 white dwarf candidates with usable spectra.
2.1.2 Known issues with DESI EDR spectral calibration
There are two known instrumental and processing issues that affect a small subset of DESI spectroscopy (Fig. 1):
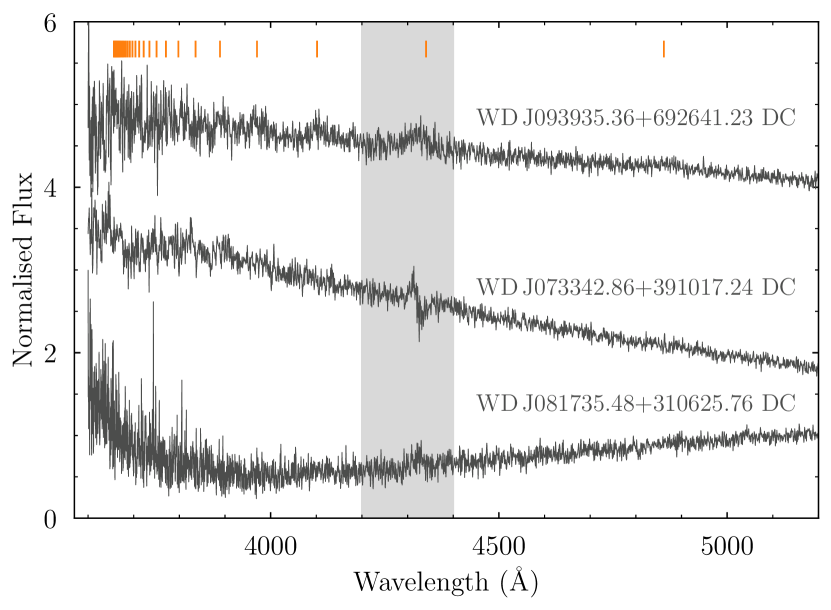
Sensitivity at Å: The reflectivity of the collimators in the blue arm of the DESI spectrographs is reduced in the wavelength range Å, resulting in a drop in sensitivity in that region (see fig. 24 of Guy et al. 2023). The exact shape of the reflectivity profile as a function of wavelength varies with the location in the mirror and with the incidence angle of the light. This sensitivity issue affects both the flux calibration and the sky subtraction and can result in the creation of non-physical continuum shapes in this region, such as in the DESI spectrum of WD J073342.86+391017.24 (Fig. 1).
Flux calibration: The flux calibration of DESI is performed using F-stars with a preference for low-metallicity halo stars. Guy et al. (2023) used hydrogen-atmosphere DA white dwarfs as an independent test of the flux calibration. For the majority of the DESI spectral range the average residuals are relatively flat at a level of per cent (see fig. 41 of Guy et al. 2023). However, around the Balmer and Paschen series emission and absorption features are present in the average residuals, which are suggestive of an imperfect fit to the spectral features of the standard stars. This is most notable at wavelengths Å, where a per cent jump coincides with the Balmer jump. For some very cool white dwarfs (i.e., the featureless DC white dwarfs) this increase in flux can appear quite dramatic and starts affecting the spectrum at redder wavelengths. While some features in the average residual from fitting DAs are likely due to imperfections in the white dwarf models, such as the very broad ( 100 Å) Paschen absorption features, many of the other features are reproduced in the continuum fitting of moderate redshift quasars observed by DESI, highlighting these as calibration issues (see fig. 5 of Ramírez-Pérez et al. 2023).
| Identifier | Definition |
|---|---|
| A | H i lines present |
| B | He i lines present |
| C | Featureless spectrum |
| O | He ii lines present |
| Q | C features present in atomic or molecular form |
| Z | Metal lines present a |
| P | Peculiar or unidentified features |
| H | Zeeman splitting present |
| e | Emission lines present |
| : | Tentative or uncertain classification |
| Some of these detections may include interstellar medium absorption | |
| features, which is more common for hotter white dwarfs at larger | |
| distances. | |
2.2 SDSS
The SDSS has been taking multi-band photometry and multi-fibre spectroscopy since 2000, using a 2.5-m telescope located at the Apache Point Observatory in New Mexico (Gunn et al., 2006). We retrieved archival SDSS spectroscopy (DR17, Abdurro’uf et al. 2022) and crossmatched these with the DESI EDR sample of white dwarf candidates, which resulted in 1427 unique sources common to both surveys and a total of 2149 SDSS spectra. We use these SDSS spectra to validate our fitting routines (Section 5) using different spectroscopic sources for the same target and comparing with previous literature results.
| Class | Number | Class | Number | Class | Number | Class | Number | Class | Number | Class | Number |
| White dwarfs | 2706 | DAH: | 12 | DBAZ | 4 | DAe: | 5 | DQZ | 1 | Contaminants | 817 |
| DA | 1958 | DQ | 50 | DBAZ: | 3 | DAHe | 2 | DZAP | 1 | EXGAL | 445 |
| DA: | 18 | DQ: | 5 | DH: | 6 | DAHe: | 2 | DZBA | 1 | STAR | 329 |
| DC | 197 | DZ | 49 | DZA | 6 | DAZe: | 1 | DZBA: | 2 | sdX | 42 |
| DC: | 23 | DBZ | 19 | DZAB | 4 | DAOH: | 1 | DZQ | 1 | sdX: | 1 |
| DB | 141 | DBA | 15 | DZB | 4 | DAQ: | 1 | WD | 20 | UNCLASS | 84 |
| DB: | 6 | DBA: | 1 | DCH: | 3 | DAZH: | 1 | Binaries | 66 | ||
| DAZ | 54 | DAO | 10 | DAP | 2 | DO | 1 | WD+MS | 53 | ||
| DAZ: | 11 | DAO: | 1 | DAB | 1 | DQA | 1 | CV | 12 | ||
| DAH | 53 | DBZA | 7 | DABZ | 1 | DQH | 1 | DA+DQ | 1 | ||
| In the text we present classifications such as D(AB), where bracketed sub-classifications collate any permutation of the spectral classifications, | |||||||||||
| e.g., D(AB) includes both DAB and DBA white dwarfs. | |||||||||||
2.3 Photometry
2.3.1 Multi-colour photometry
We retrieved photometric data from four catalogues, namely Gaia DR2, Gaia EDR3, SDSS DR18 and Pan-STARRS DR2 (Chambers et al., 2019). Zero-point corrections were applied to the SDSS u, i and z bands as suggested by Eisenstein et al. (2006) to convert to actual AB magnitudes. Gaia DR2 photometry and astrometry was used for the target selection in the DESI EDR and for our cross-match to identify potential white dwarf candidates observed through other target selections (see Section 3). Gaia EDR3 (or DR2 if the former was not available) photometry was employed to compare our internal photometric analysis with an independent test.
2.3.2 Zwicky Transient Facility (ZTF)
ZTF is a robotic time-domain survey using the Palomar 48-inch Schmidt Telescope (Bellm et al., 2019; Masci et al., 2019). Utilising a 47 field of view, ZTF can scan the entire sky in two days, making it a powerful survey for identifying photometrically variable sources at optical wavelengths. We obtained archival ZTF data from DR18 (Masci et al., 2019), which includes data up to 2023 May 7. We inspected the ZTF lightcurves of Cataclysmic Variables identified in the DESI EDR sample to assist in their classifications (Section 5.5).
3 White dwarf catalogue
3.1 Spectral Classification
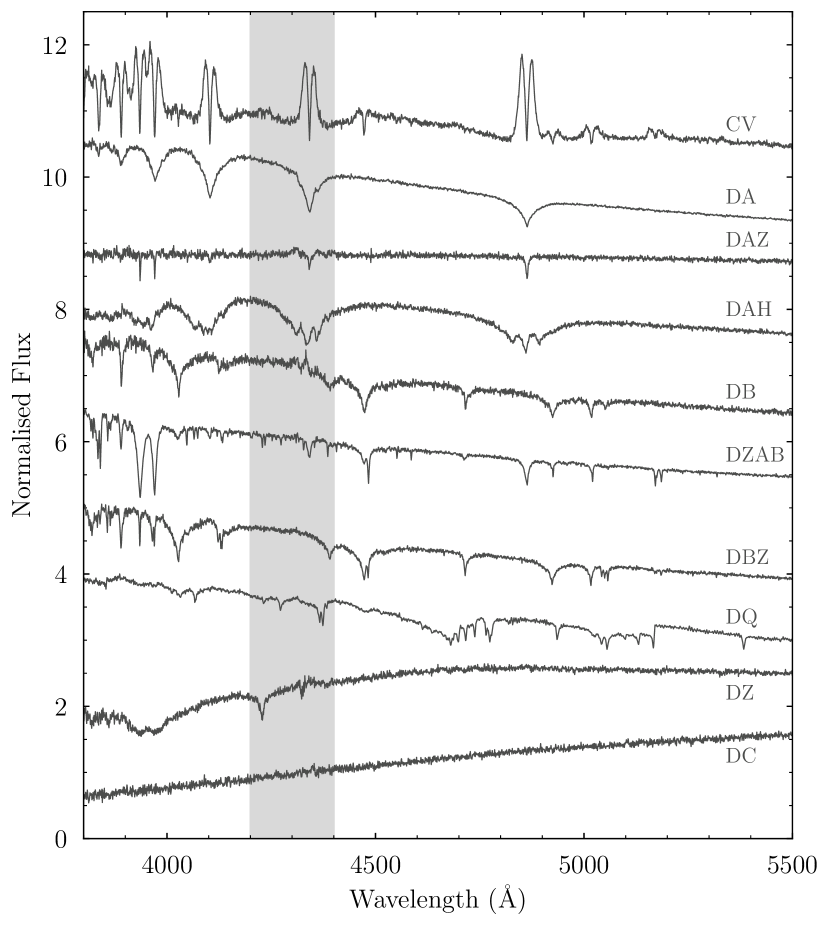
The spectral classification system for white dwarfs has been defined by Sion et al. (1983), and is purely based on the morphology of the spectroscopic data. We summarise in Table 1 the identifiers associated with specific features in the spectrum of a white dwarf, which relate both to the chemical composition of the atmosphere, as well as to other characteristic features that may be present in the spectra. The majority of white dwarfs in any magnitude or volume-limited sample are “DA” white dwarfs, i.e. their spectra only show Balmer absorption lines. Spectral identifiers can be combined if multiple features are identified, resulting in composite spectral types such as “DBAZ”. The original definition of Sion et al. (1983) defined that “weaker or secondary spectroscopic features” are used for additional spectral identifiers, leaving a fair amount of ambiguity with respect to deciding the sequencing of the spectral type. We adopted an overall weighted visual assessment of the different spectral features, rather than focusing on the strength of specific individual lines. It is important to note that the equivalent width of features of a specific element are not directly linked to its abundance within the atmosphere, hence care has to be taken not to mistake spectral types as a reflection of the dominant species within the atmosphere of a given white dwarf.
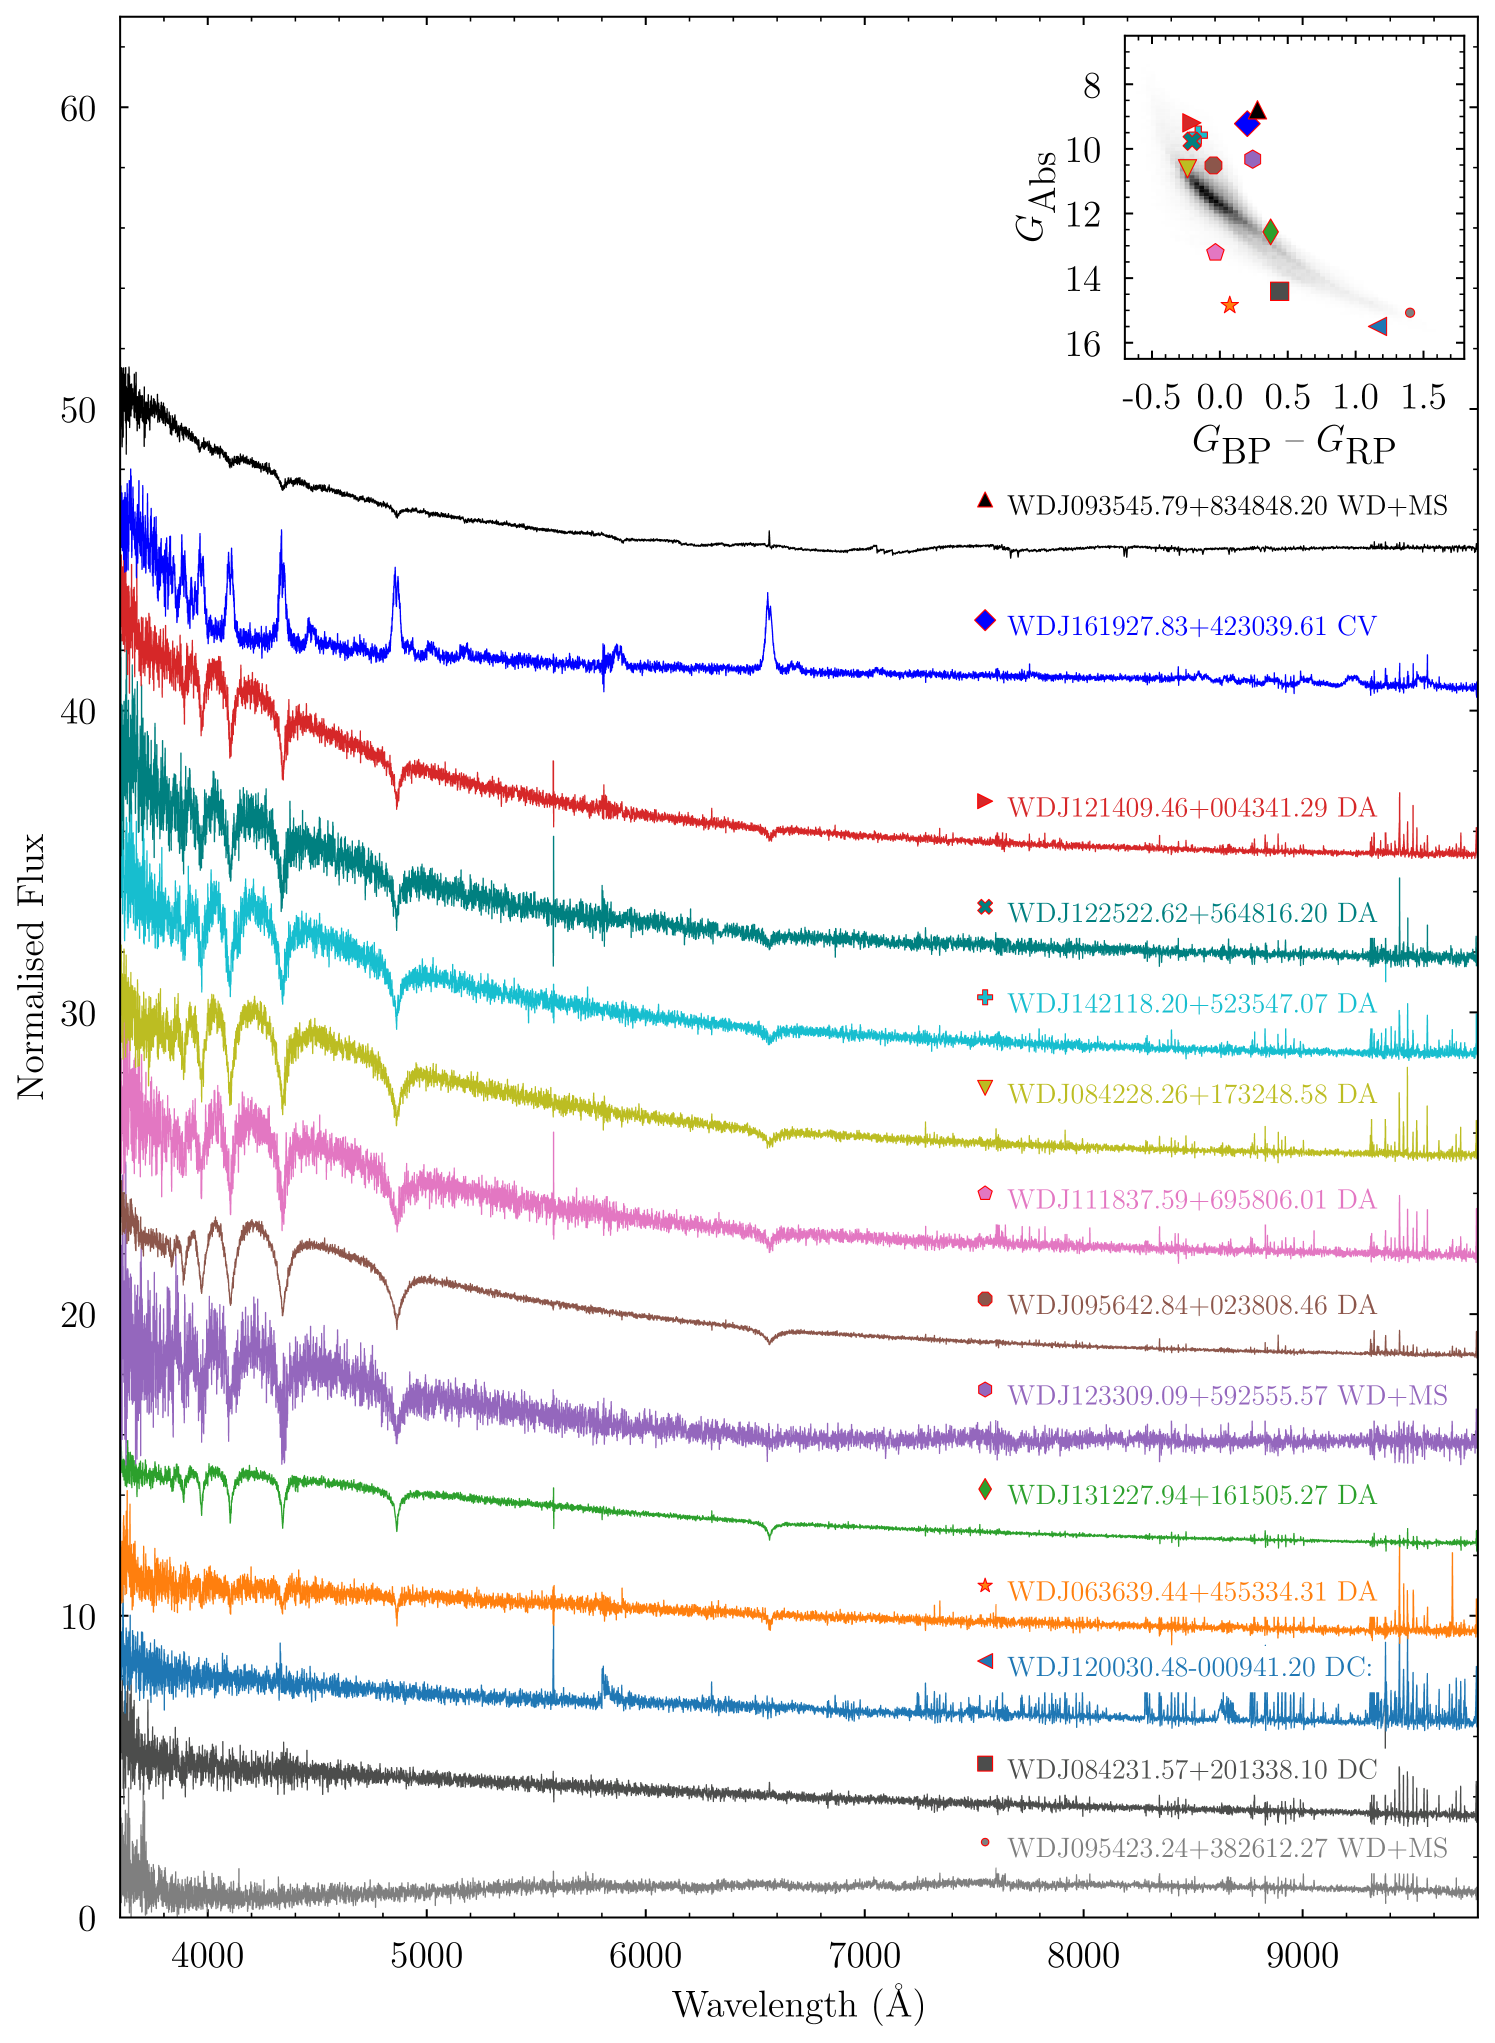
The 3673 DESI EDR spectra of white dwarf candidates were visually classified by three of the authors, who carefully reviewed all systems where their initial classifications were discrepant, followed by a final inspection of all spectra within any individual spectral class. In total, we spectroscopically confirm 2706 white dwarfs. We also provide classifications for 66 binary white dwarf systems, including white dwarf-main sequence binaries (WDMS), cataclysmic variables (CVs), and double degenerate binaries such as the DADQ system WD J092053.05+692645.36 (hereafter WD J0920+6926) are discussed in Section 4.2. We also identified 817 contaminant extragalactic sources, main-sequence stars and subdwarfs, with an additional 84 spectra that could not be confidently classified. These classifications are listed in Table 2, and some example DESI spectra of white dwarf systems are shown in Fig. 2.
The DESI EDR white dwarf catalogue is provided as a FITS file***This FITS file can be obtained at https://zenodo.org/records/10620344., with the details of the extensions included and the content of the individual columns described in detail in Appendix A. The first extension contains the full list of 4064 white dwarf candidates targeted by DESI with our spectral classifications (where applicable) and auxiliary data. The second extension includes the results of our cross-match between the DESI EDR sample and SDSS with 2149 entries giving the unique SDSS plate, modified Julian date (MJD), fibre identifiers for each SDSS spectrum, the separation between a given white dwarf candidate and the location associated with the SDSS spectrum, and the number of spectra associated with each object. Subsequent extensions include our best fit parameters to the DA, DB, DBA, and DQ systems.
3.2 New identifications vs. known systems
To determine the number of new white dwarfs the DESI EDR sample has identified, we cross-matched our sample with the Montreal White Dwarf Database (MWDD, Dufour et al. 2017) and the SIMBAD astronomical database (Wenger et al., 2000). The results of this cross-match are included in our DESI EDR catalogue (Table 3), and in the discussion of spectral types and sub-classes below we exclude systems within the DESI EDR with uncertain (:) classifications. For the largest sample of systems, i.e., DA, DB, DC white dwarfs, we use the results of our crossmatch to determine which white dwarfs have been identified as such for the first time. 1201 DAs (61 per cent), 151 DCs (77 per cent), 68 DBs (48 per cent), 5 DAB/DBAs (31 per cent), and 3 DAO/DOs (27 per cent) have been spectroscopically confirmed as a white dwarf for the first time with DESI, adding over 1400 new systems. This is somewhat expected from the cooler distribution of DESI white dwarfs compared to the SDSS sample (Fig. 8), where DCs and DAs are the dominant spectral types. As SDSS preferentially samples hotter white dwarfs, the DB, DAB/DBA and DAO/DO subclasses are better examined and fewer new systems have been identified by DESI.
We do a more in-depth literature search for four sub-groups of interest to us; DQ white dwarfs (Section 5.2, Table 12), metal-enriched systems (Section 5.3, Table 13), magnetic white dwarfs (Section 5.4, Table 2), and CVs (Section 5.5 , Table 3). In these searches, we identify whether DESI has newly discovered (or confirmed in the case of candidates in the literature) these white dwarfs as members of their given sub-classes, and discuss them in more depth in the given sections.
4 The DESI EDR white dwarf sample in the context of their location on the Gaia HRD
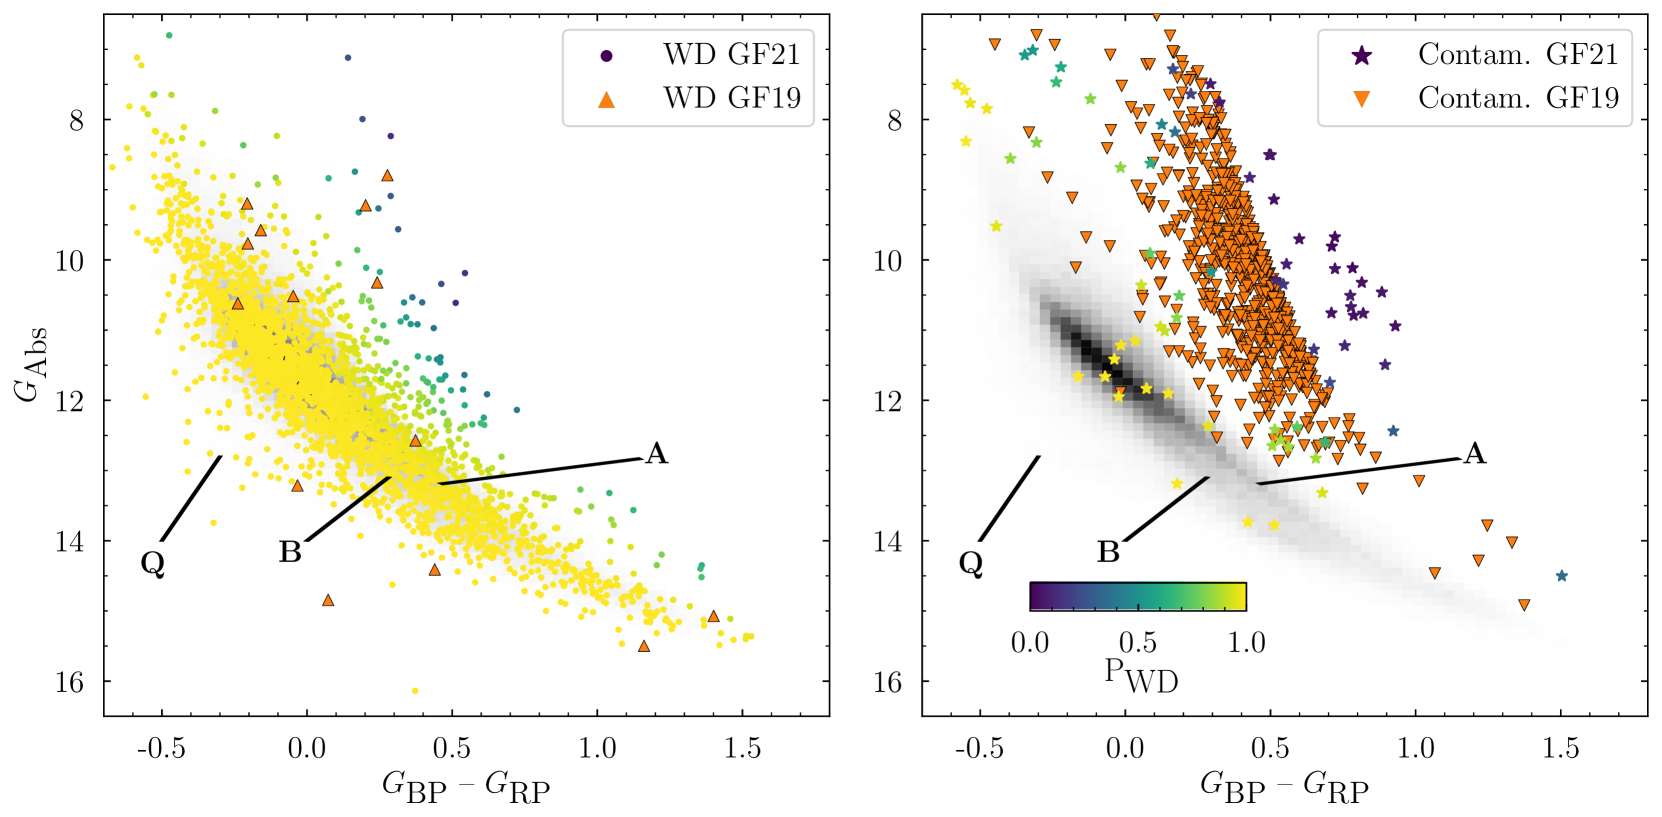
We illustrate the distribution of the DESI EDR white dwarf sample within the Gaia Hertzsprung-Russell Diagram (HRD) in Fig. 3 separated into spectroscopically confirmed white dwarf systems (including binaries, left) and contaminants (right), with the 84 unclassified systems (‘UNCLASS’) being omitted (see Table 2). The DESI EDR white dwarf sample closely follows the distribution of the magnitude limited sample of high confidence (probability of being a white dwarf ) white dwarfs identified in the Gaia EDR3 catalogue of GF21. The DESI white dwarf sample clearly reproduces the A and B branches, populated by standard-mass white dwarfs with H- and He-dominated photospheres, respectively (Gaia Collaboration et al., 2018). The Q-branch is also present in the sample (Gaia Collaboration et al., 2018), and is thought to be due to delayed cooling by crystallisation of high-mass white dwarfs (Tremblay et al., 2019), settling of 22Ne (Cheng et al., 2019), or white dwarf-subgiant mergers (Shen et al., 2023). The majority of white dwarf systems observed by DESI have high values in both GF19 and GF21. The variable was estimated based on the probability of a candidate being an isolated white dwarf, and so the binary sample that dominates the systems that sit above the white dwarf cooling track have a lower . The contaminants are similarly located above the white dwarf cooling track, with many of them having very small values. Additionally between the construction of the GF19 and GF21 catalogues, 714 (87.3 per cent) of the contaminant population have been excluded from the more reliable Gaia EDR3-based selection criteria of GF21 compared with that of DR2 used by GF19, whereas only 14 (0.5 per cent) of the confirmed white dwarf systems have dropped out of the GF21 white dwarf catalogue (Fig. 22). Overall, this showcases both the high fidelity of the selection methods and the robustness of the value calculated by GF19 and GF21.
In the following subsections we will describe the DESI EDR white dwarf sample within the Gaia HRD, split up into the various spectral classes (Table 2). The systems are loosely grouped to illustrate the evolution of hydrogen-dominated atmospheres (DA DC) and helium-dominated atmospheres (DO DB DC/DQ), as well as classes that share similar physical characteristics (e.g., metal enrichement, the presence of magnetic fields or binary companions). These groupings are not fully representative however, as some white dwarf classes may be populated by multiple evolutionary channels, such as DC white dwarfs evolving from both H- and He-dominated atmosphere white dwarfs (Bergeron, 2001; Kowalski & Saumon, 2006; Kilic et al., 2009; Caron et al., 2023), as well as different physical processes that can alter the spectral type of a white dwarf, such as convective mixing or accretion from various sources (Fontaine et al., 2001; Gentile Fusillo et al., 2017; Rolland et al., 2018; Cunningham et al., 2020; Rolland et al., 2020). Cooling tracks†††http://www.astro.umontreal.ca/~bergeron/CoolingModels for DA- and DB-type white dwarfs are presented to help give context to the samples, but are not applicable to all objects.
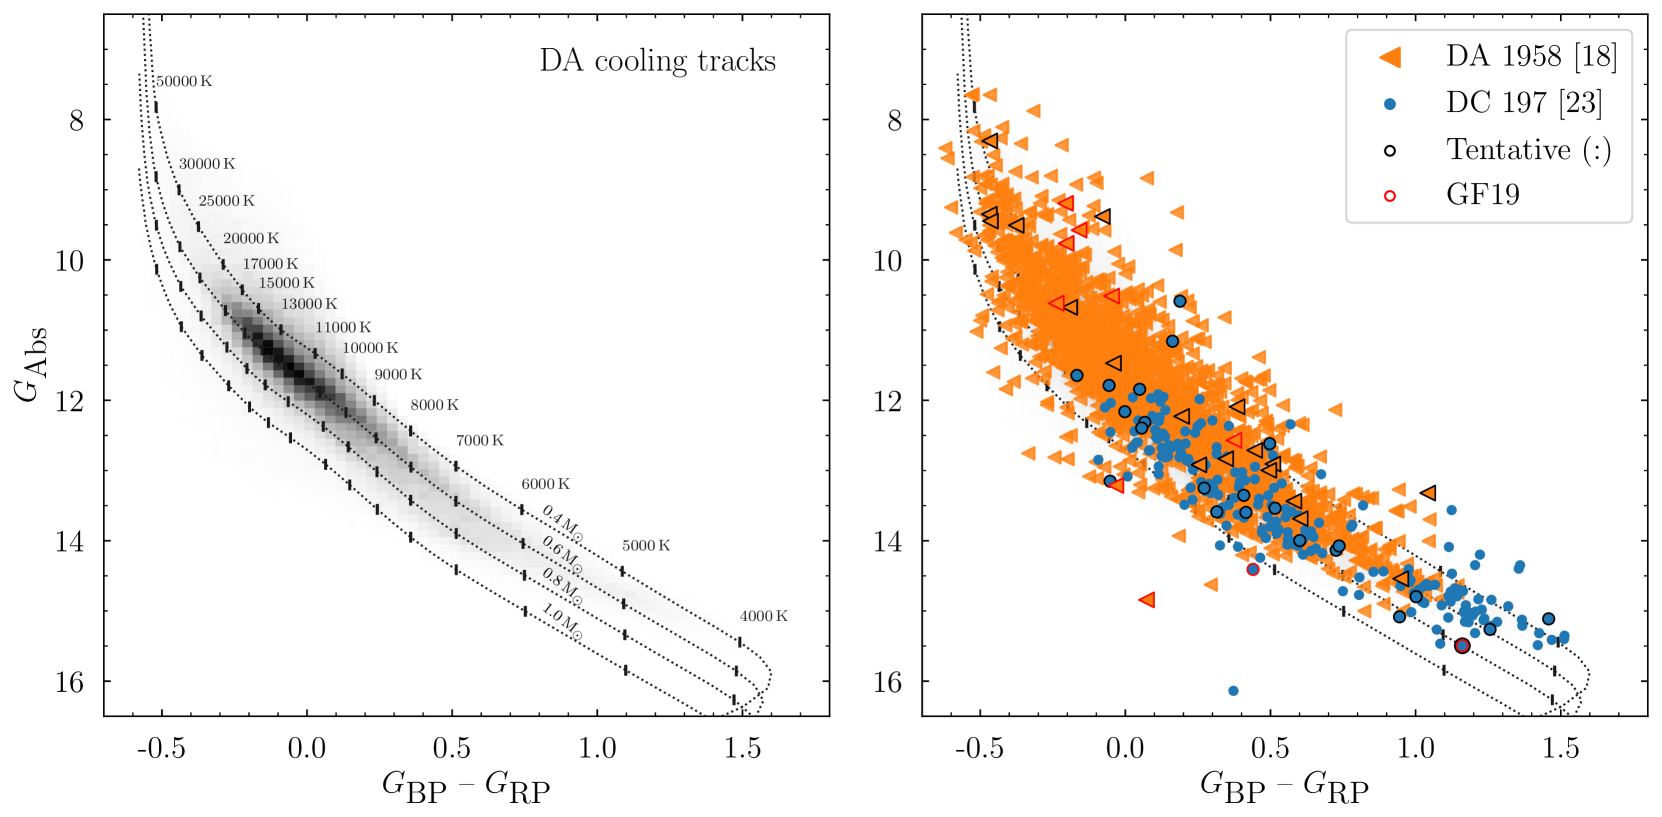
4.1 Typical white dwarfs
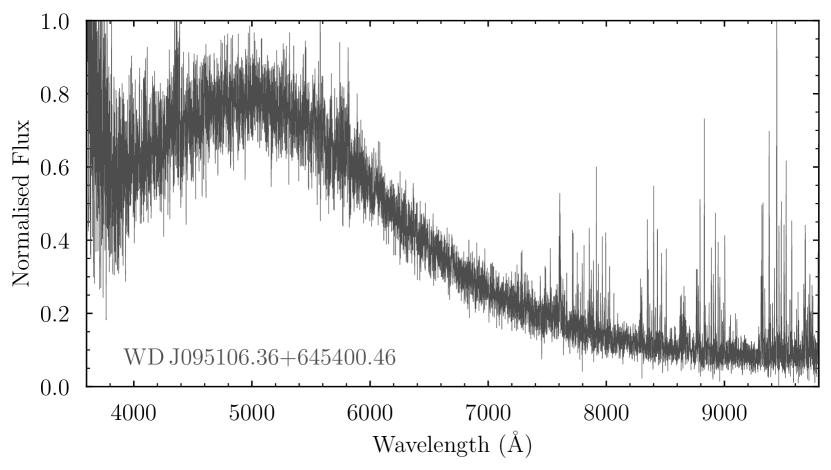
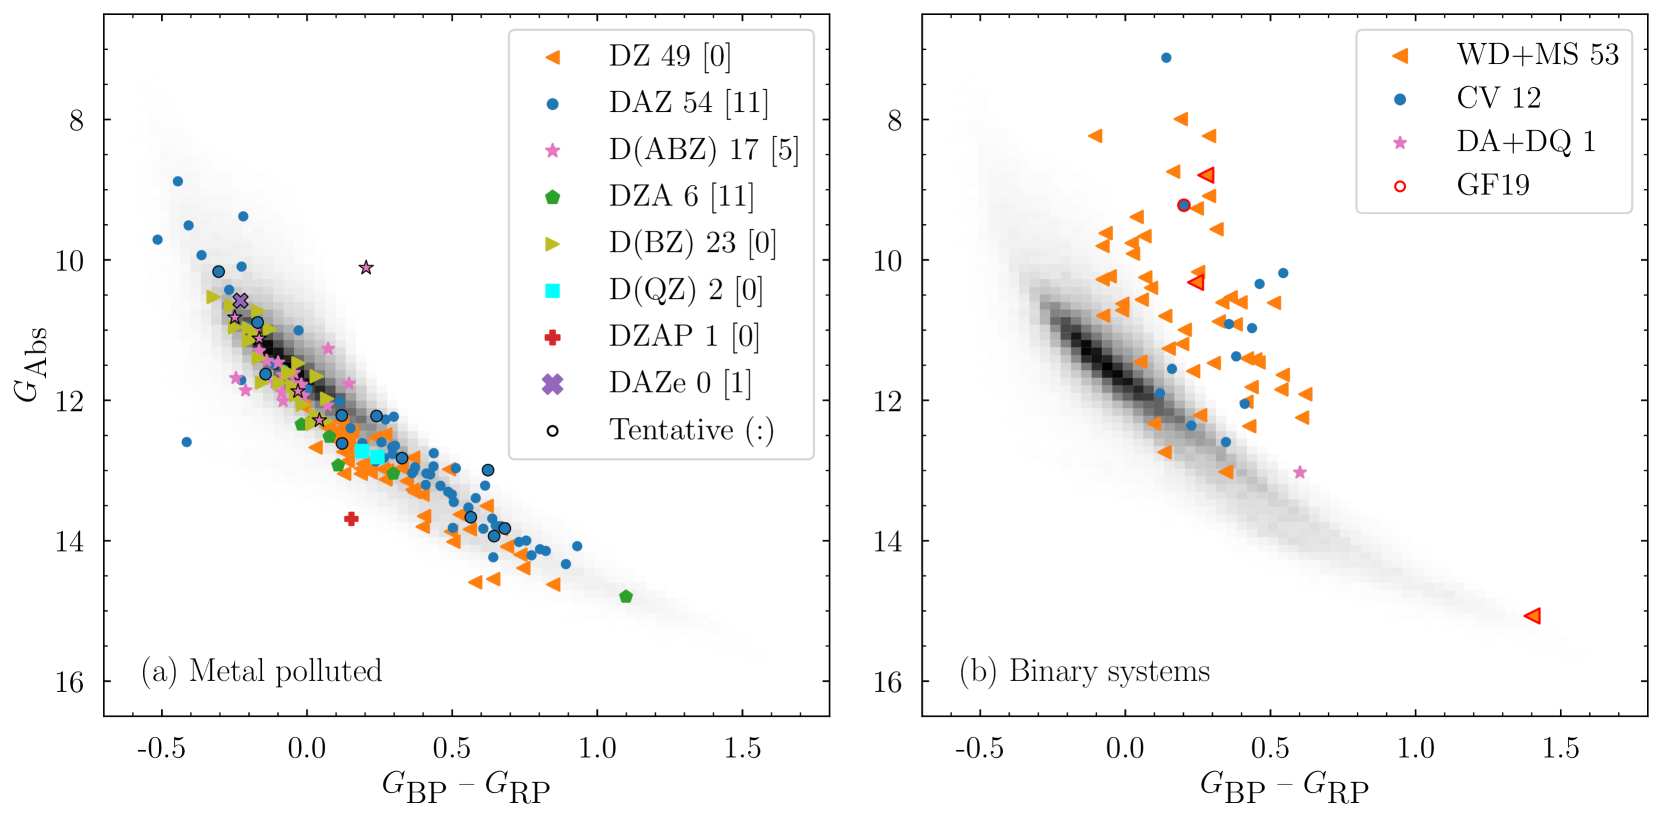
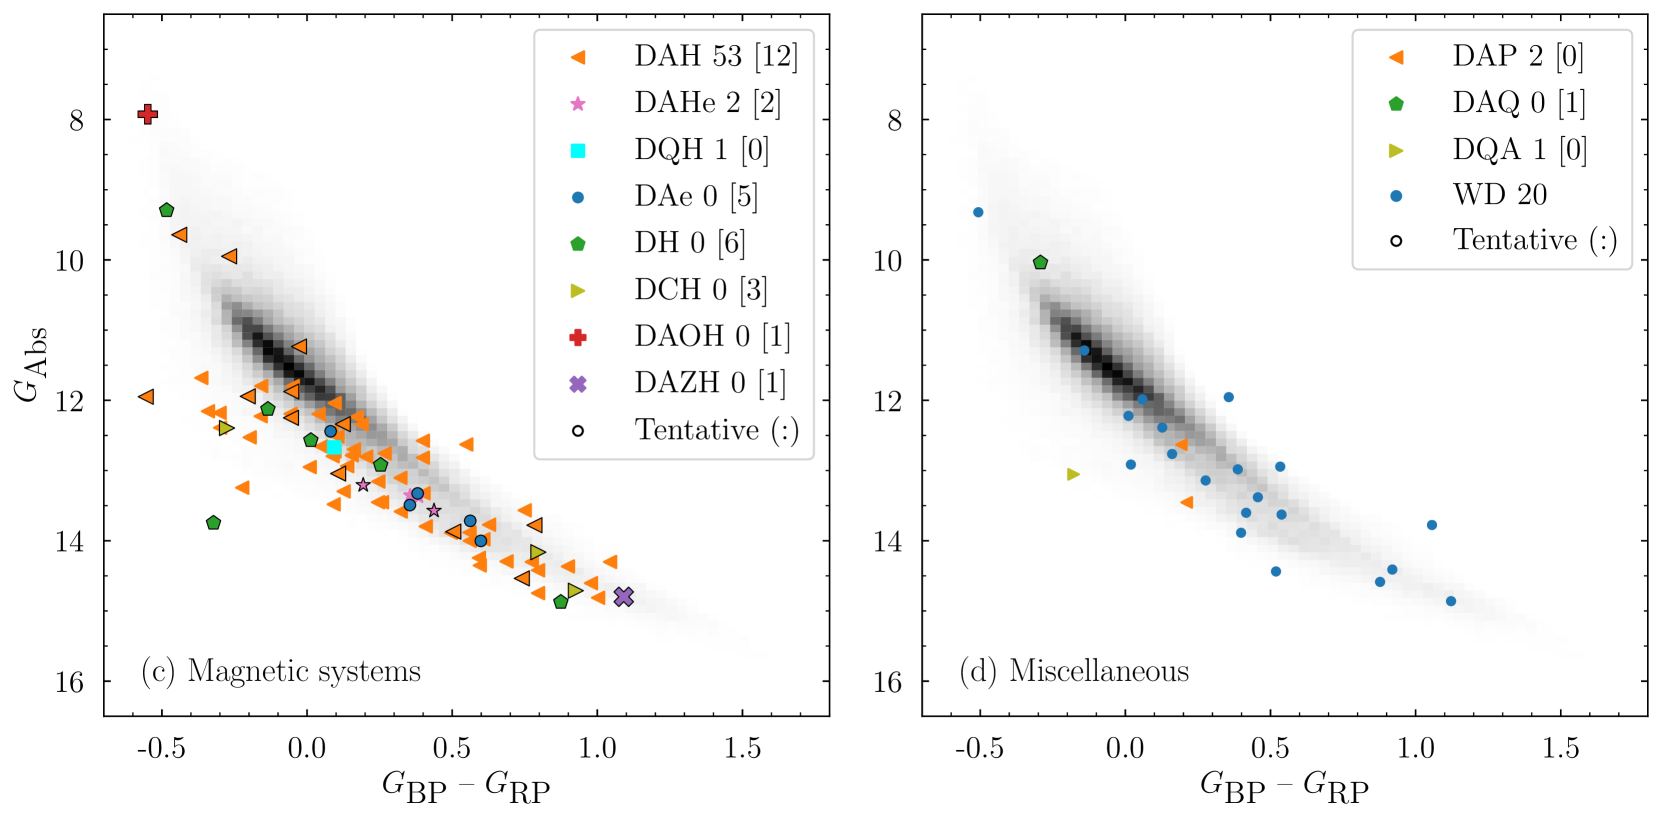
Figure 4 shows the majority of the white dwarf sample, which is dominated by the DA, DC, and DB spectral types, adding up to a total of 86.3 per cent of the DESI EDR confirmed white dwarfs. The DAs make up 72.8 per cent of the sample, and cover the majority of the cooling sequence. A small subset of high-mass DAs lie on the Q-branch described above. DA white dwarfs cool until they reach K where the Balmer lines become undetectable and these systems transition to featureless DCs.
While He-dominated atmosphere white dwarfs cool along a similar path in the Gaia HRD, their spectral evolution through this cooling sequence is more complex. The hottest pure He-atmosphere white dwarfs in our sample are the DO systems that show He ii lines in their spectra and are thought to form after a late shell flash in which the white dwarf progenitor burns all the remaining H in the envelope (Herwig et al., 1999; Althaus et al., 2005; Werner & Herwig, 2006) or through the convective dilution or convective mixing processes, in which a thin H layer is diluted by the deeper convective He one (Fontaine & Wesemael, 1987; Cunningham et al., 2020). As DO white dwarfs cool, they can either transition into a DB as He becomes neutral and produces He i features ( 1/3 of DOs follow this path) or into a DA, following the DO-to-DA transition due to the upward diffusion of leftover H (Wesemael & Fontaine, 1985; Fleming et al., 1986; Liebert, 1986). As DBs cool further (first path), He i features disappear below 10 000 K, and these white dwarfs then split into two categories; those with featureless DC spectra, and those showing the presence of C, i.e., DQ white dwarfs. The existence of C in the spectra of these white dwarfs is thought to be due to dredge-up, when the deepening He convection-zone reaches the C-rich core (Pelletier et al., 1986). Not all DQ white dwarfs appear to share this origin however, as a number sit on the Q-branch, suggesting they are both hotter and have a higher mass. These ‘warm’ or ‘hot’ DQs are thought to form instead from binary mergers (Dunlap & Clemens, 2015; Kawka et al., 2023). Many He-atmosphere white dwarfs also show spectroscopically detectable H in their atmospheres, such as the DAO/DOA and DAB/DBA white dwarfs. These systems by-and-large overlap with those that do not show the presence of H.
The DC white dwarfs appear to group in two regions, one group roughly between , with the other appearing cooler at . The bluer sample of DCs is likely dominated by white dwarfs with He-rich atmospheres, and overlap with the cool DQ systems. Like their DQ counterparts, these bluer DCs likely also have trace C in their atmospheres‡‡‡DC white dwarfs with evidence of trace C have been dubbed as ‘stealth-DQs’ and ‘DQ-manqué’: while by definition they have featureless optical spectra, a large fraction of DCs experience some form of C dredge-up during their lifetime. This dredge-up is evidenced by non-negligible changes in their optical spectral energy distribution due to the addition of extra electrons from C (Camisassa et al., 2023; Blouin et al., 2023a), in addition to a reduction of their flux in the ultraviolet from C absorption (Blouin et al., 2023b). The redder sample of DCs is thought to be dominated by H-dominated white dwarfs (Caron et al., 2023), although these DCs appear to deviate quite significantly from the DA cooling sequence, which is centred roughly on the 0.6 evolutionary track. This may suggest imperfections in the cooling sequences used at these cooler temperatures (Caron et al., 2023), but the origin of this deviation is unknown.
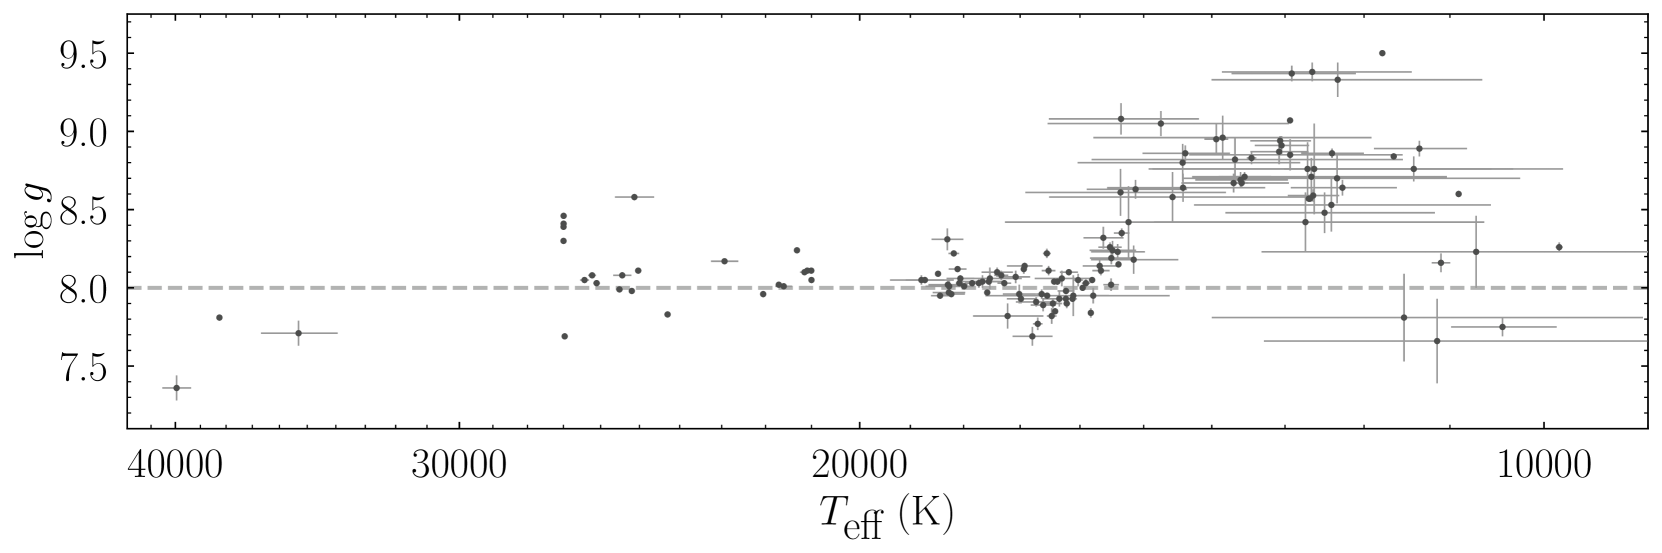
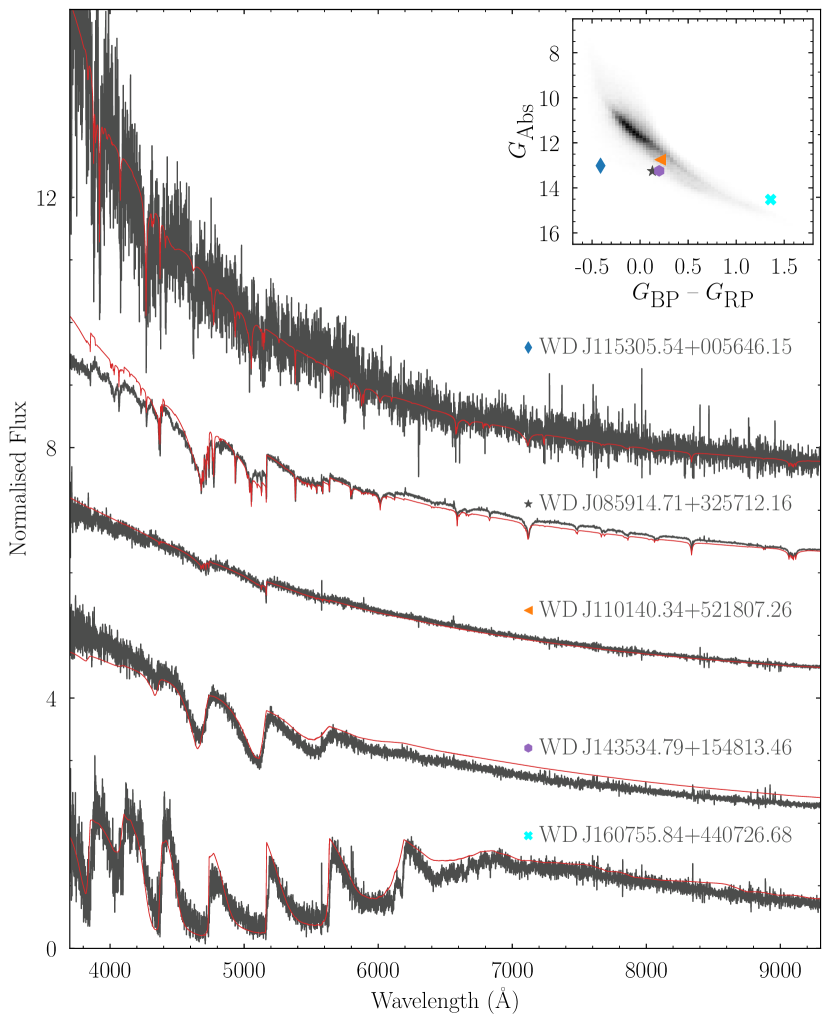
A single DC white dwarf, WD J095106.36+645400.46 (hereafter WD J0951+6454, Fig. 5), lies significantly below the main white dwarf cooling sequence and is the least luminous white dwarf in the DESI EDR white dwarf sample (, ). The system sits on the ultra-blue sequence of infra-red faint targets identified by Kilic et al. (2020) and Bergeron et al. (2022). These systems appear to be comprised of relatively cool ( 4000 K) white dwarfs. The spectra of these systems are unusual due to the presence of collisionally-induced absorption generated from molecular H colliding with He dominating the opacity (Borysow et al., 2001).
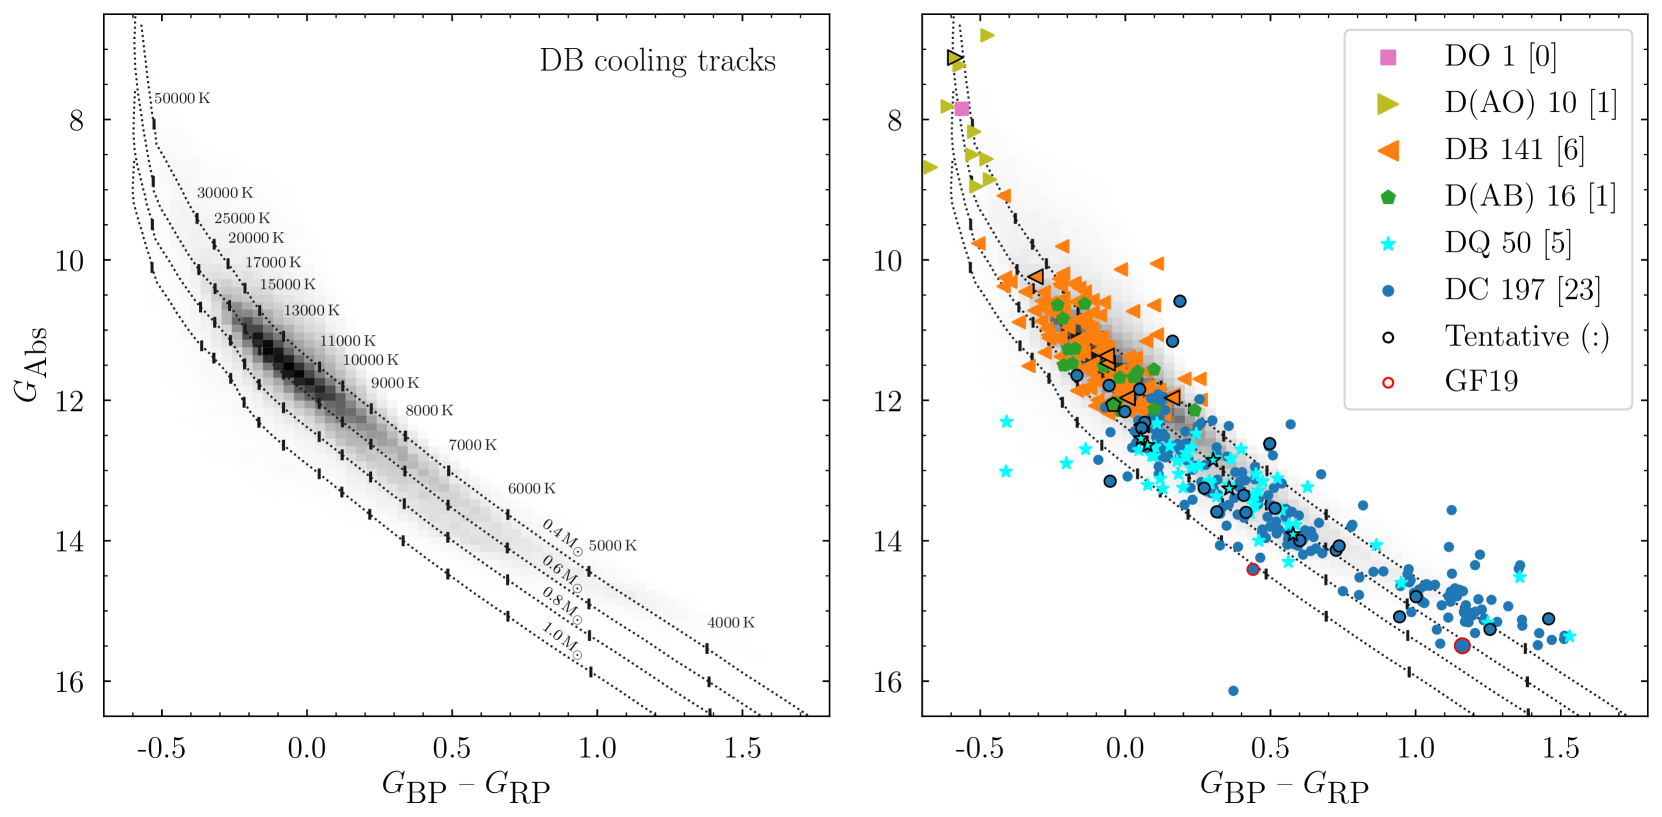
4.2 Exotic white dwarf systems
Figure 6 showcases the rarer white dwarf systems and spectral types arising from interactions with external bodies or additional physical characteristics beyond the thermal evolution of white dwarfs depicted in Fig. 4. The top left panel of Fig. 6 displays all systems where metals (Z) heavier than helium, and excluding carbon, are spotted. We identify a total of 152 metal-enriched white dwarfs, the vast majority of which are likely the result of the accretion of planetary material that survived the evolution of the post main sequence evolution planet-hosting main-sequence star (Zuckerman & Becklin, 1987; Graham et al., 1990; Debes & Sigurdsson, 2002; Jura, 2003; Zuckerman et al., 2003). White dwarfs redder than , corresponding to 12 000 K, dominate those with metal enrichment, which is more striking when additionally taking into account the magnitude-limited bias to hotter white dwarfs. The key reason for the apparent increase in the fraction of metal-enriched white dwarfs is the strength of the Ca H/K resonance lines, and the fact that Ca ii is gradually becoming more populated in cooler atmospheres – resulting in a spectroscopic detection of Ca even at low photospheric abundances (Dufour et al., 2007b; Koester et al., 2011; Hollands et al., 2017, 2018a). Observations of white dwarf samples at higher resolution and signal-to-noise ratios, and also in the far-ultraviolet (wavelengths below 2000 Å) where the detection of additional elements can be made, show that per cent of all white dwarfs are enriched with metals consistent with the accretion of planetary bodies (Zuckerman et al., 2003, 2007; Barstow et al., 2014; Koester et al., 2014).
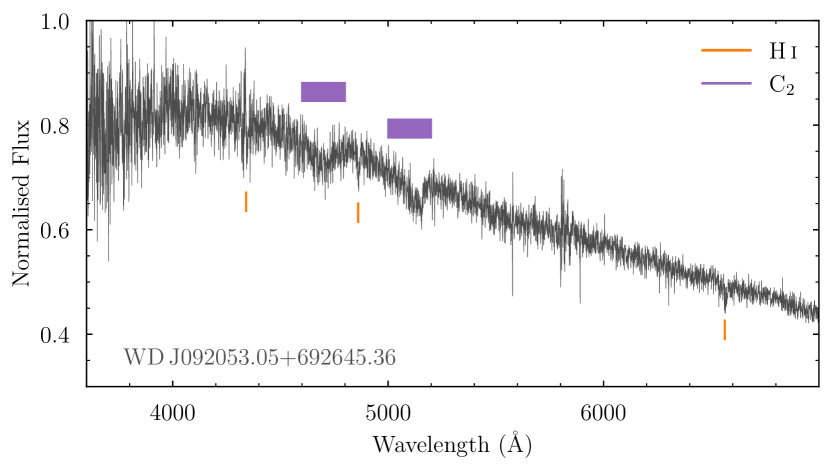
We also identify 66 white dwarf binary systems which occupy a region that lies above the white dwarf cooling sequence due to the contribution of flux from two stars rather than one increasing the systems (Fig. 6, top right panel). The majority of these systems are white dwarf-main sequence binaries, where contributions from largely blue white dwarfs and red M dwarfs can be seen simultaneously in the DESI EDR spectra. Twelve of these systems are of the accreting binary cataclysmic variable type, of which five are newly confirmed (see Section 5.5), and are largely dominated by disc emission. The last system in this sample is a double white dwarf binary WD J0920+6926 (Fig. 7). The spectra of white dwarfs with both H and C in their spectrum (DAQ/DQA white dwarfs) usually show atomic C i lines which arise in hotter atmospheres and are thought to be, similar to the warm DQs, the product of binary mergers (Koester & Kepler, 2019; Hollands et al., 2020). However, WD J0920+6926 displays both weak and narrow Balmer lines, in addition to the molecular C Swan bands which are corroborated by the of K we obtain from our spectroscopic fitting (see Section 5.2) that is much cooler than for the known DAQ/DQA systems. These arguments, along with its position above the white dwarf cooling sequence have led to our classification of this system as a DA+DQ system. Only one DA+DQ binary has previously been identified and characterised, NLTT 16249 (Vennes & Kawka, 2012; Vennes et al., 2012), making WD J0920+6926 an interesting target for follow-up observations.
The bottom left panel of Fig. 6 contains systems that either show evidence for Zeeman-splitting of spectral features or are associated with magnetic fields. Only 56 white dwarfs in the sample have a confident detection of magnetic fields, with all but three of them being classed as DAH white dwarfs. The population of magnetic white dwarfs is dimmer and redder than what would be expected if they uniformly sample the magnitude limited population of white dwarfs provided by Gaia, and is split into two populations. The first group of magnetic white dwarfs appears to follow the main white dwarf cooling track although slightly fainter suggesting that these white dwarfs are either bluer and/or heavier than their non-magnetic counterparts. The second population of magnetic white dwarfs lies close to, or on, the Q-branch. These systems appear to have higher masses than their redder counterparts and are likely the result of binary mergers (Regős & Tout, 1995; Tout et al., 2008; Nordhaus et al., 2011; García-Berro et al., 2012; Wickramasinghe et al., 2014).
In the bottom right panel of Fig. 6 we show the remaining white dwarf systems that did not nicely fall into the loose categories above, in addition to 20 systems we identified as white dwarfs but no further classification could be given.
4.3 Advantages over the SDSS white dwarf sample
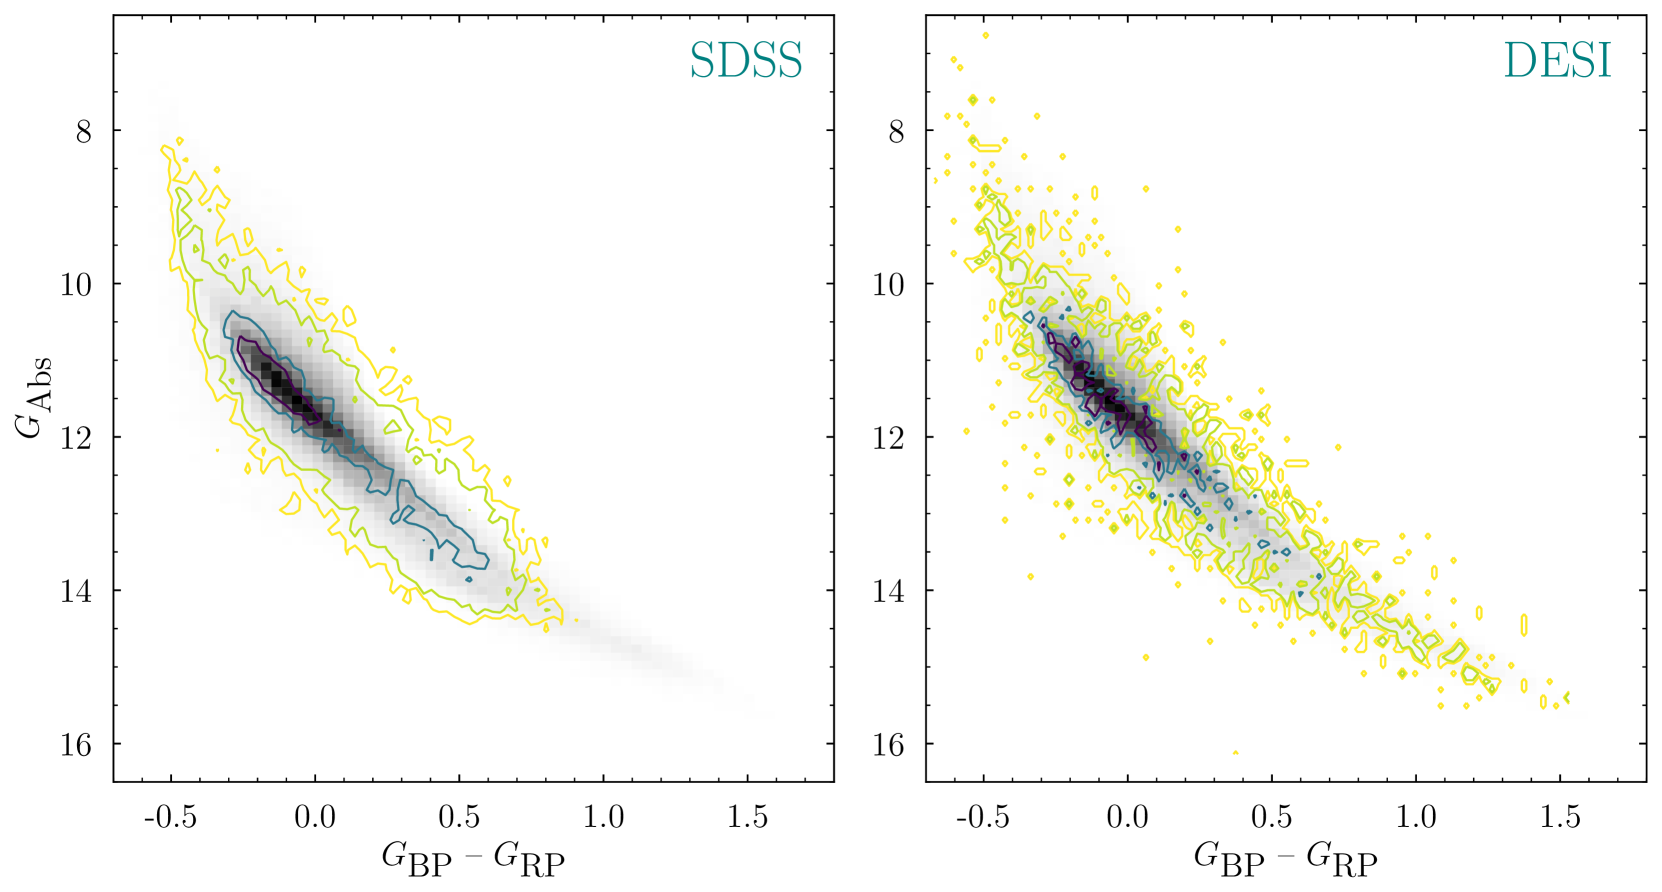
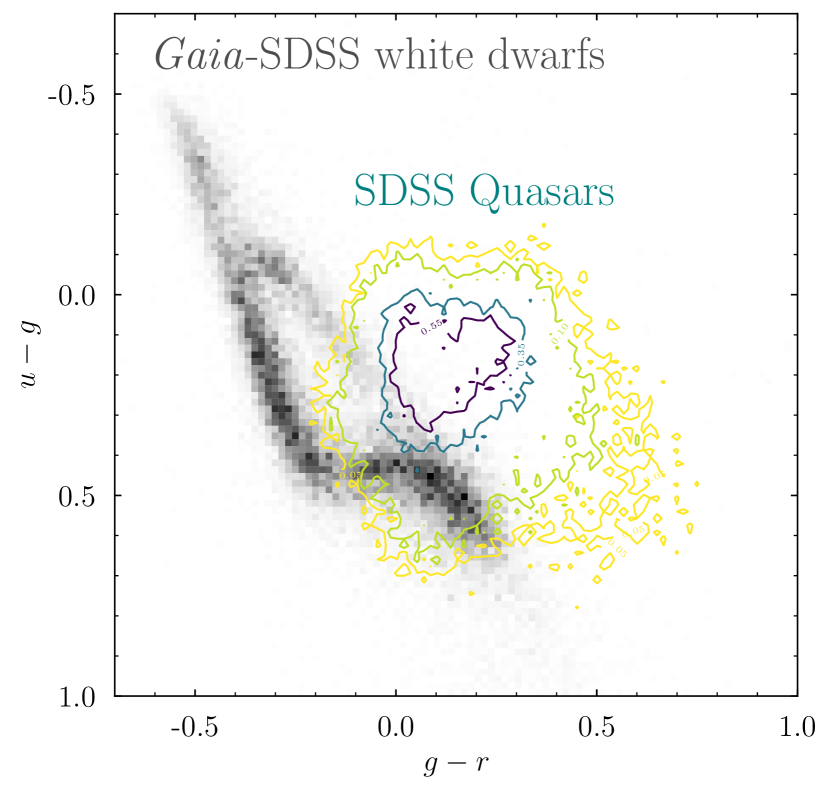
The DESI survey has already observed over 47 000 white dwarf candidates (Manser et al., 2023), making it one of the largest surveys of white dwarfs to date, surpassing the white dwarfs observed by the SDSS (Harris et al., 2003; Kleinman et al., 2004, 2013; Eisenstein et al., 2006; Gentile Fusillo et al., 2015; Gentile Fusillo et al., 2019, 2021; Kepler et al., 2021). Most of the SDSS white dwarfs were serendipitously targeted as quasar candidates or blue-excess objects, resulting in strong selection effects with respect to the underlying galactic population of white dwarfs. The left panel of Fig. 8 compares the distribution of the Gaia-SDSS sample of spectroscopically confirmed isolated white dwarfs from GF21 (as contour lines) with the entire magnitude limited sample of high-confidence ( white dwarf candidates from GF21 (gray 2D histogram). It can be clearly seen that the SDSS sample is heavily biased towards bluer, hotter white dwarfs, with very few systems extending past . Additionally, there is an over-density of white dwarfs in the Gaia-SDSS sample around . Conversely, the DESI EDR sample shows a much better agreement with the magnitude limited sample of high-confidence white dwarf candidates. This should not be surprising given the DESI EDR white dwarf target selection was based on the sample selected by GF21, but highlights the selection effects within the SDSS sample.
The biases present in the SDSS white dwarf sample have been previously reported in other studies (e.g., section 5.2.1 of Gänsicke et al. 2009b), and are mainly due to two broad selection effects.
(i) Serendipitous discoveries in the SDSS quasar search: the bulk of white dwarfs identified by SDSS were selected originally as blue quasar candidates, resulting in an excess of white dwarfs in the range , corresponding (roughly) to a range of effective temperatures K K. However, to reduce the total number of stars observed as part of the quasar search, the SDSS target selection adopted a number of exclusion boxes, which add further complexity to the biases affecting the SDSS sample (see sect. 3.5.1 in Richards et al. 2002 and sect. 5.2.1 in Gänsicke et al. 2009a).
(ii) Blue selection of white dwarfs: Blue and hot () were included as ancillary science targets for spectroscopy in SDSS III (Dawson et al., 2013) and, in smaller numbers as flux standards, in SDSS IV (Dawson et al., 2016), resulting in an additional selection biases.
In summary, whereas SDSS provided a large number of spectroscopic observations of white dwarfs, it was subject to selection effects that are extremely difficult to quantify. As DESI follows up Gaia white dwarf candidates, which are only subject to a magnitude-limit, the forthcoming large sample of DESI white dwarfs will be very well suited for detailed statistical studies of their physical properties.
5 White dwarf sub-type studies
5.1 DA/DB/D(AB) model atmospheres and fitting procedure
The properties of the population can be determined if their stellar parameters ( and ) are known. Nearly 80 per cent of the stars in the catalogue show spectral lines from only H or He (types DA, DAB, DB and DBA), allowing reliable determination of their parameters by fitting white dwarf models to their data using established techniques. The methods we use are described in detail in Appendix B. In summary, grids of synthetic spectra and photometry are generated using the atmosphere codes of Koester (2010), varying , , and (where appropriate) the H/He abundance, and applying reddening. Those variables are then fitted to the data in a Bayesian framework, treating distance as an additional free parameter constrained by the Gaia parallax and a prior tailored to a white dwarf population.
5.1.1 The DA sample
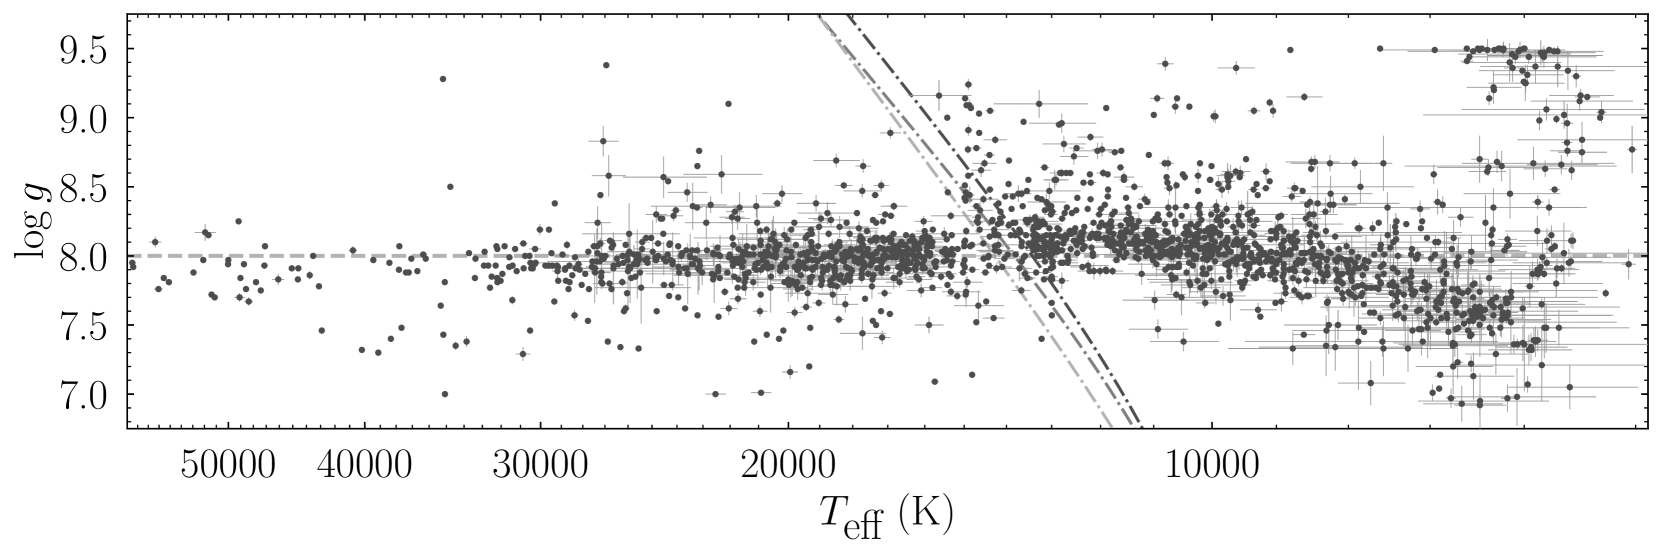
The distribution of as a function of drawn from the 1958 DAs within the DESI EDR spectra is presented in Fig.10 (top panel).
This distribution should largely be smooth and closely follow the canonical value of dex for DA white dwarfs. However, there are three clear deviations from this that we explain below: a scarcity of systems between 15 000 and 16 000 K, a small population of cool and massive systems, and a deviation from the canonical value of 8.0 dex for the cooler objects. These are both artefacts related to the analysis with no physical meaning.
The clear decrease in the number of systems between 15 000 and 16 000 K is also present in other population studies (see e.g., Gianninas et al., 2011; Genest-Beaulieu & Bergeron, 2019) and coincides with the boundary between hot and cold solutions. In fact, we are using the maximum EW of H line to choose between these two sets of solutions, but we have repeated this analysis for H and H. These two Balmer lines define new boundaries that move towards hotter temperatures, tentatively explaining the gap. A group of unusually cool and (apparently) massive white dwarfs exists in a region around K and dex. Inspection of these spectra show unusually broad Balmer features, and these systems are likely helium-dominated atmosphere DAs. Detailed modelling of these stars is beyond the scope of this study, and they do not affect the overall conclusions we draw from the main population of DA white dwarfs.
On the other hand, while the hotter white dwarfs are closely gathered around the canonical value of , their cooler counterparts ( K) suffer from the so-called high- problem (Tremblay et al., 2010). This deviation is an artefact related to the spectroscopic fitting approach, since white dwarfs are expected to cool at constant radii and the abrupt change in is not seen in photometric studies. Tremblay et al. (2013) presented a grid of pure-H 3D model atmospheres with a correct treatment of the convection, and they demonstrated that the high- problem is related to the use of the 1D mixing-length approximation. 3D model atmospheres are still too computationally expensive but Tremblay et al. (2013) derived analytical functions to convert spectroscopic 1D and to 3D atmospheric parameters. This correction was applied to the sample but there persists a small deviation from the canonical .
5.1.2 The DB and DBA samples
The spectroscopic parameters derived for the 141 DB white dwarfs within DESI EDR are displayed in Fig. 10 (bottom panel). The warmer stars ( K) are closely clustered around , the typical value for white dwarfs. This is not the case for the cooler objects where there is a known issue with the implementations of the broadening mechanisms for the neutral He, which results in fitted white dwarfs having unphysically high surface gravities (see e.g., Bergeron et al., 2011; Koester & Kepler, 2015; Cukanovaite et al., 2021). Above K the values exhibit larger scatter: the spectroscopic parameters are difficult to estimate in the region where the EWs of the He i transitions reach their maximum ( K) and this translates to less accurate parameters. Additionally, there are four objects with K, which corresponds to the top boundary of the cool models, and likely have hotter temperatures. Above 30 000 K, which coincides with the top end of the instability strip of DBs, we find three objects that have .
5.2 DQ white dwarfs
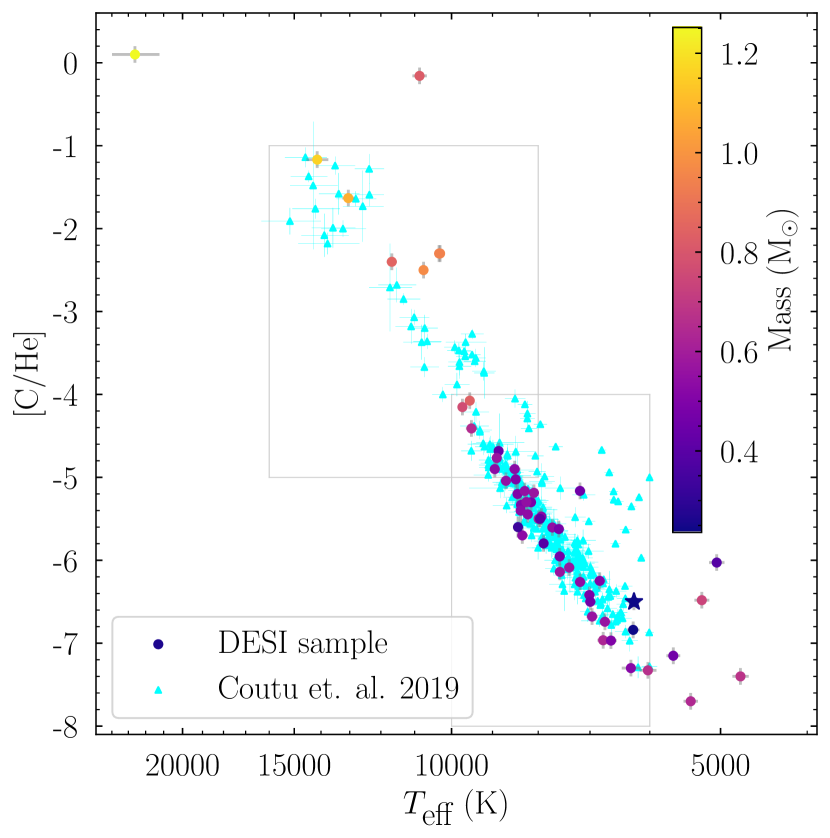
The DESI EDR sample contains 55 DQ white dwarfs (Table 12), of which 43 are new discoveries (78 per cent). We fitted all DQ spectra following the methods of Koester & Kepler (2019), and using the models computed with the code of Koester (2010) with updates described in Koester et al. (2020). The spectral appearance of DQ white dwarfs strongly depends on their effective temperature, with hotter white dwarfs showing atomic carbon lines and the cooler ones Swan bands (Fig. 11). Within the Gaia HRD, the hotter DQs are located on the Q-branch, and are correspondingly massive (, Table 12). In contrast, the cooler DQs largely lie on the standard cooling sequence, having average masses.
The carbon abundances show a strong anti-correlation with effective temperature (Fig. 12), following the trend found earlier by Coutu et al. (2019). It is noteworthy that the spectrum of the hottest DQ in the EDR sample, WD J085601.74+321354.51, is consistent with a carbon-dominated atmosphere.
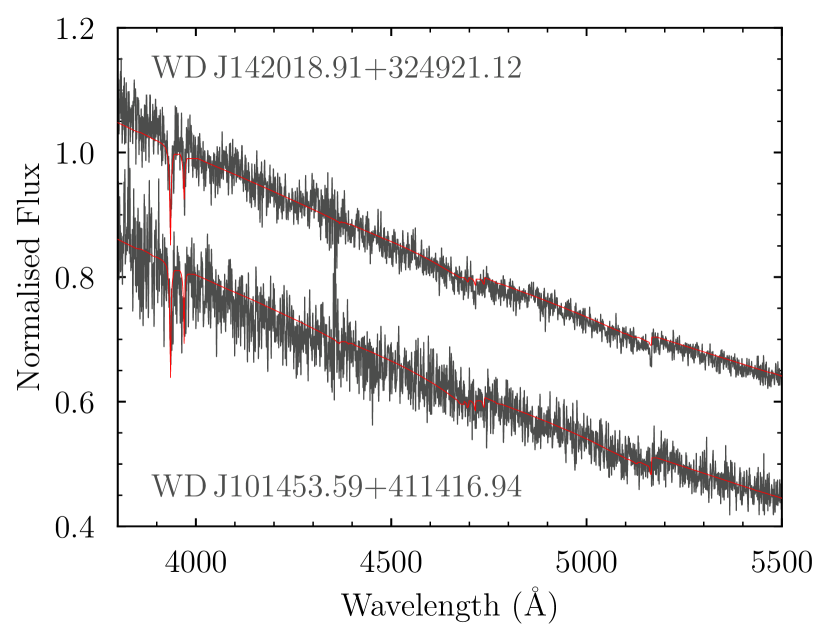
We also identified two DQs that show traces of photospheric metals in addition to carbon: WD J101453.59+411416.94 and WD J142018.91+324921.12 (hereafter WD J1014+4114 and WD J1420+3249 respectively) which we classify as DZQ and DQZ, respectively (Fig. 13). The fraction of DQ white dwarfs that exhibit metals in their spectra is smaller than that among DA or DB white dwarfs. This is thought to be the result of an interplay between the accreted metals and the atmosphere structure, leading to the rapid transformation of DQ white dwarfs into DZ white dwarfs (Hollands et al., 2022; Blouin, 2022).
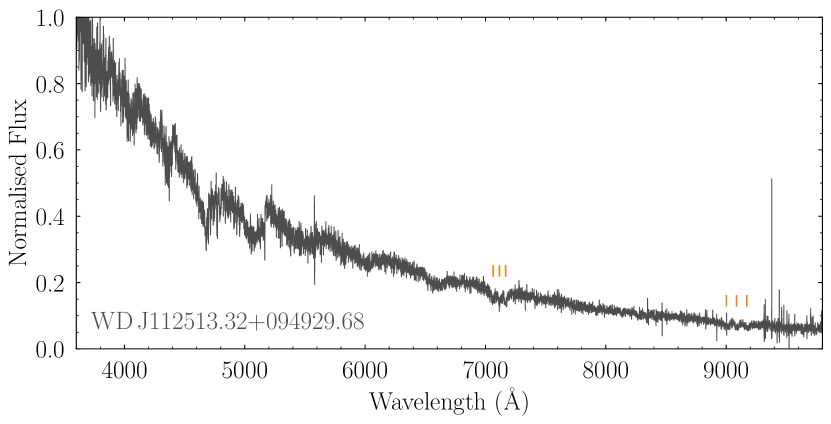
Finally, we identified one DA+DQ double degenerate (WD J0920+6926 see Fig.7 and Sect.4.2) and detect Zeeman splitting in one of the warm DQs (WD J112513.32+094029.68, hereafter WD J1125+0940, see Fig. 16 and Sect. 5.4.1).
5.3 Metal line DxZ white dwarfs
Among the 152 DxZ (where “x” is a placeholder for other spectral identifiers, e.g. A, B, Q) white dwarfs that show metal lines in their DESI EDR spectra (Table 13) 121 are new discoveries (80 per cent) and 31 were previously known. This sample is very likely dominated by white dwarfs that are actively accreting, or have recently accreted planetary material (Zuckerman et al., 2003, 2007; Barstow et al., 2014; Koester et al., 2014; Wilson et al., 2019), in particular in nearby white dwarfs with strong metal absorption features. However, narrow absorption lines in hotter white dwarfs, in particular of Ca H/K and Na D, could also be present due to absorption in the interstellar medium (ISM) as these intrinsically bright stars can be observed at greater distances. To disentangle enrichment of the white dwarf photosphere and absorption in the ISM requires detailed modelling of the DESI spectra that takes into account the ionisation and excitation within the white dwarf atmosphere, as well as the line-of-sight velocities of both the white dwarf and the ISM, and is beyond the scope of this work. We briefly discuss two noteworthy metal-enriched white dwarfs among the DESI EDR sample.
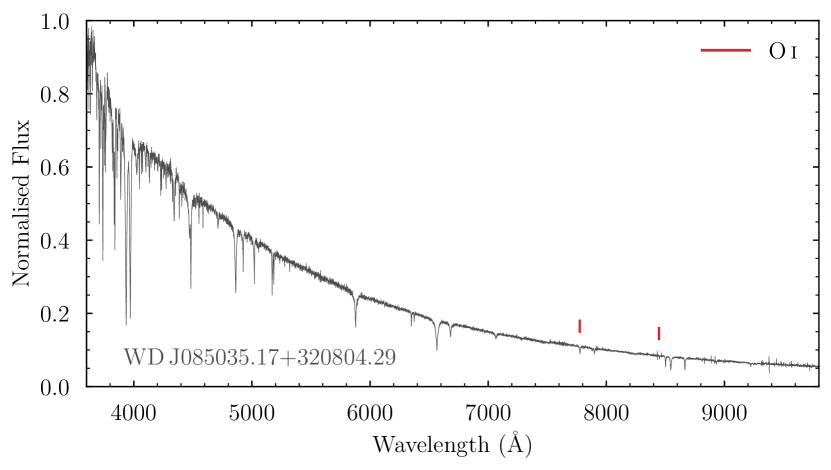
5.3.1 WD J085035.17+320804.29
WD J085035.17+320804.29 (hereafter WD J0850+3208, Fig. 14) is a DZAB§§§WD J0850+3208 is a known metal-enriched white dwarf, classified as a DABZ by Kong et al. (2019). which shows extremely strong metal lines. O i absorption at 7775 Å and 8446 Å, along with the strong H line indicated significant amounts of H in what is likely a He-dominated atmosphere suggest that this white dwarf may have accreted a water-rich body (Klein et al., 2010; Farihi et al., 2013; Gentile Fusillo et al., 2017). Further bespoke modelling of WD J0850+3208 is required to determine the composition of the planetary body it accreted.
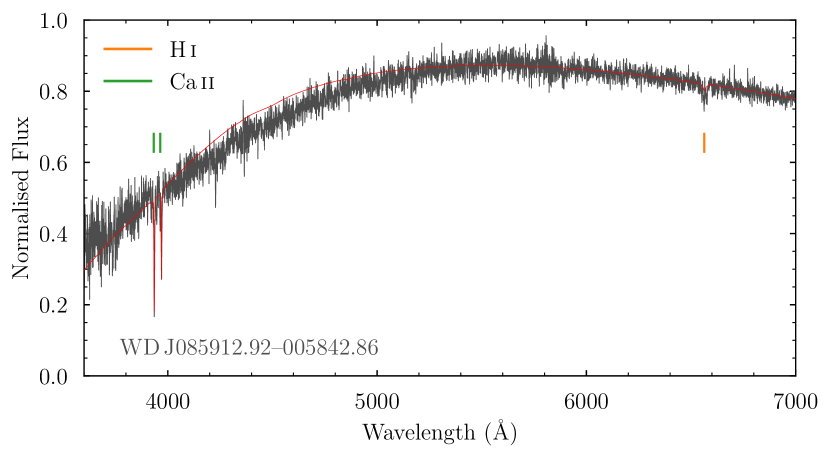
5.3.2 WD J085912.92–005842.86
WD J085912.92–005842.86 (hereafter WD J0859–0058, Fig. 14) is a known 20 pc member which has been previously reported as a featureless DC (Subasavage et al., 2008; Hollands et al., 2018b), however, the DESI spectrum clearly reveals Ca H/K lines. Inspection of spectrum of WD J0859–0058 obtained by Subasavage et al. (2008) and available in the MWDD shows no signs of metal absorption features, likely because of the much lower spectral resolution compared to the one obtained by DESI. This system is among the closest sources to the Sun observed by DESI, and this classification shows that new and interesting systems are still being identified in well-studied samples.
5.4 Magnetic white dwarfs
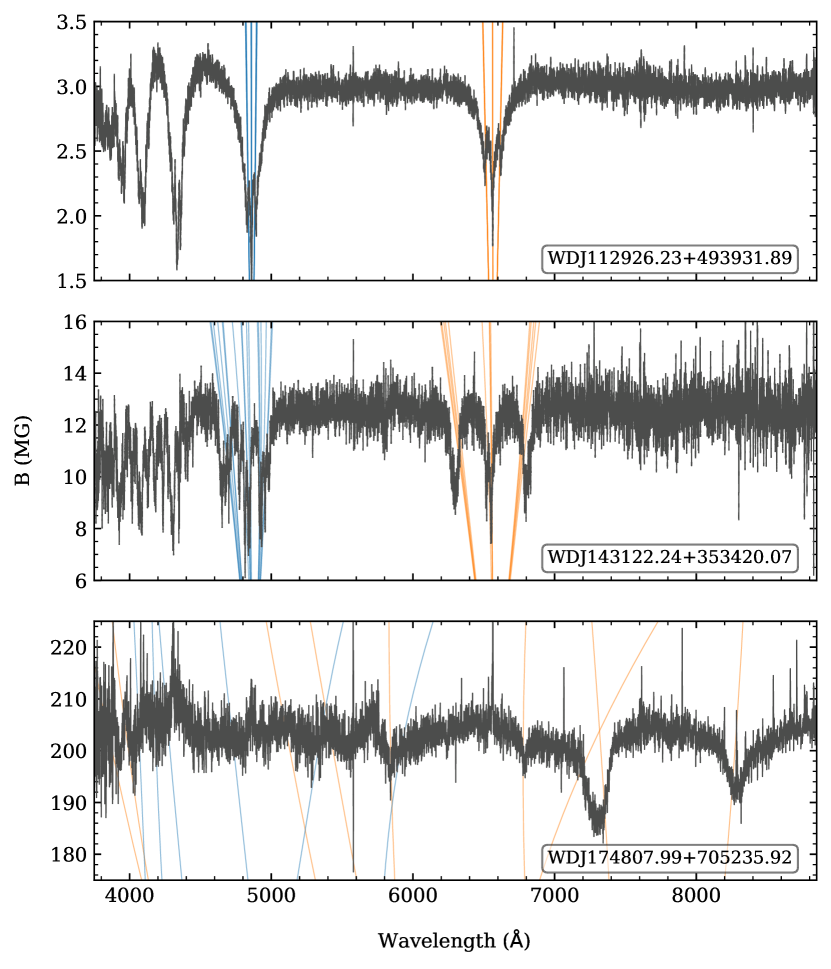
For the 56 systems presenting clear Zeeman-split spectral features we estimated their surface-averaged field strengths which are provided in Table 2. 39 (70 per cent) of the magnetic white dwarfs identified in the DESI EDR sample are new magnetic identifications from DESI. All but one appear to show Zeeman-splitting of the Balmer lines evident in the spectrum (Fig. 15). For these systems, we used the transition wavelengths of the Balmer series as a function of field strength provided by Schimeczek & Wunner (2014a, b) and fit the Zeeman-split H and H profiles, as these are usually the strongest features present. The fitting was performed by splitting the magnetic features into resolvable components and determining their location in wavelength-space, and then performing a least-squared fit with the theoretical wavelengths of the Balmer transitions to find a magnetic field strength. Two magnetic white dwarfs show Zeeman-split features in emission, classified as DAHe white dwarfs (Manser et al., 2023), and were fit by the authors using the same method.
While we assume in our fitting a single field strength, the field geometry of white dwarfs are known to be more complicated, having dipolar, quadrupole or even higher order poles and non-trivial combinations (Martin & Wickramasinghe, 1984; Achilleos & Wickramasinghe, 1989; Achilleos et al., 1992; Euchner et al., 2002, 2005, 2006). This is clearly evident in the spectra of high-field white dwarfs above 200 MG, where only transitions that are close to are identifiable, where is the wavelength of the transition, with others being smeared out across the spectrum (see fig. 2 of Schmidt et al. 2003).
Below we briefly discuss three systems of further interest:
5.4.1 WD J112513.32+094029.68
WD J1125+0940 is a DQH white dwarf that shows Zeeman splitting clearly identified in the Å and Å C lines. We fit these Zeeman-split features and obtain a field strength of 2.19 MG (Fig. 16).
5.4.2 WD J113357.66+515204.69
WD J113357.66+515204.69 (hereafter WD J1133+5152) shows five components in H. Individual exposures obtained by DESI for WD J1133+5152 only show three components, as expected for Zeeman-splitting, and the profiles shift from one field strength to another and back again over a time-frame of 20 mins. This sharp transition between field strengths in the observed spectrum is similar to that observed at G183–35 (Kilic et al., 2019), and it has been suggested that a combination of a complex magnetic field structure in addition to an inhomogenous chemical distribution across the white dwarf surface can explain the profiles. We estimate the two identified field strengths observed for WD J1133+5152 from the five components assuming they are a superposition of two sets of Zeeman-split profiles as MG and MG, and these are both reported in Table 2.
WD J1133+5152 was previously identified as a DAH from SDSS spectroscopy (Schmidt et al., 2003; Külebi et al., 2009), however there is no documentation of five Zeeman components. It has been modelled to have a polar field strength of 8 MG, slightly varying depending on the complexity of the dipolar model used, and a viewing angle compared to the dipolar field configuration as looking along the equator. For a centred-dipolar field configuration, the field strength near the magnetic equator is a factor two lower than the field strength at the poles (Achilleos et al., 1992), and our measured field strengths for WD J1133+5152 are in rough agreement with a factor two drop compared with the previously reported polar field strength.
5.4.3 WD J070253.76+553733.64
WD J070253.76+553733.64 (hereafter WD J0702+5537) also shows five components in H, similar to WD J1133+5152. By fitting the 5 components assuming they come from two sets of Zeeman-split profiles, we obtain field strengths of MG and MG.
5.5 Cataclysmic Variables (CVs)
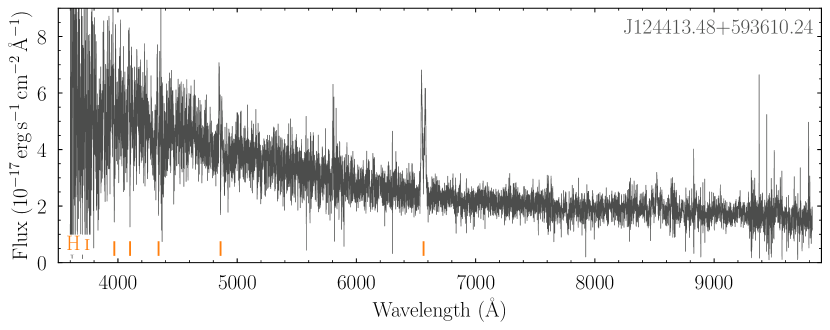
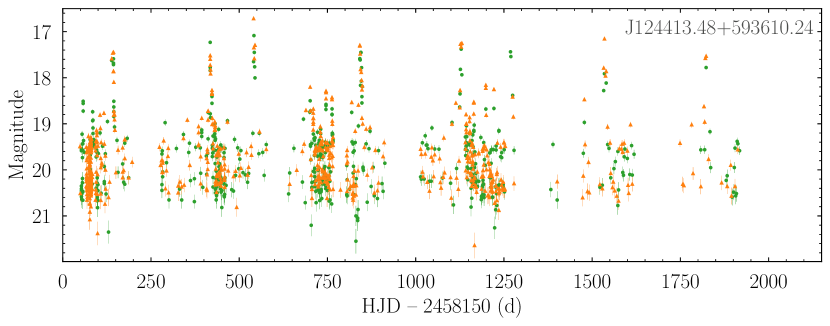
Table 3 lists the twelve CVs identified by DESI, of which five are new discoveries, and seven are previously known systems. DESI spectra along with ZTF light curves are shown in Fig. 17 for the five new systems, and we briefly discuss them below.
5.5.1 J124413.48+593610.24
The DESI spectrum reveals a blue continuum superimposed with moderately strong H emission, and weaker H emission. The deep central absorption feature within H is suggestive of a high inclination (Horne & Marsh, 1986). The slope of the spectrum displays a break around 7000 Å, which may indicate the contribution of the donor star, however, the signal-to-noise ratio is too low to identify any of its spectral signatures. The ZTF light curves of this system reveal multiple outbursts, several of which lasting d, corroborating a classification as SU UMa dwarf nova (Brun & Petit, 1952; Vogt, 1980). The ZTF data also reveals deep eclipses, and we measure an orbital period of h.
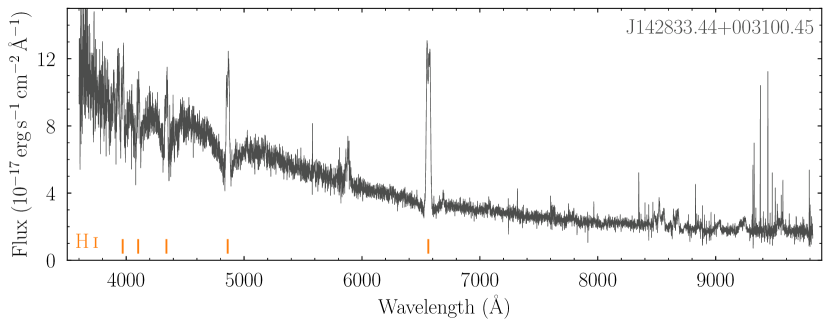
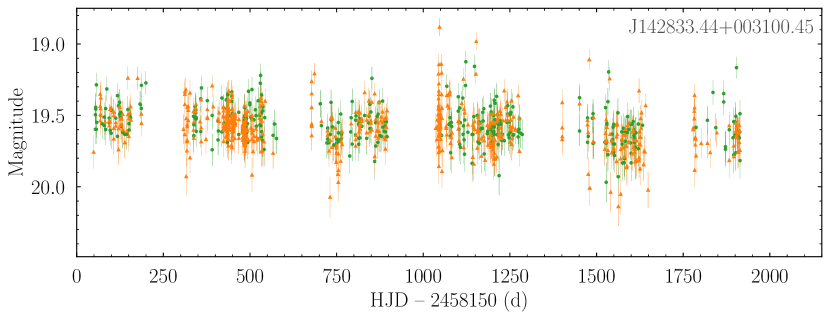
5.5.2 J142833.44+003100.45
The DESI spectrum shows a blue slope with broad Balmer absorption lines from the white dwarf, which are partially filled in by double-peaked emission lines indicating the presence of an accretion disc. The spectrum reveals no signature from the donor star. The ZTF light curves do not exhibit any outbursts, and a period analysis fails to detect a coherent signal in the data. This CV is most likely a WZ Sge dwarf nova with a long outburst recurrence time (Bailey, 1979).
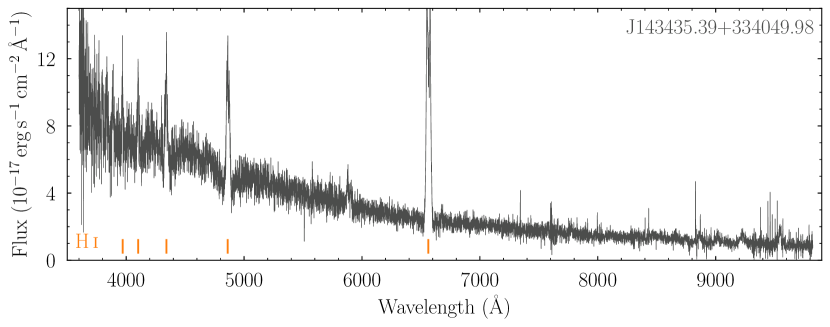
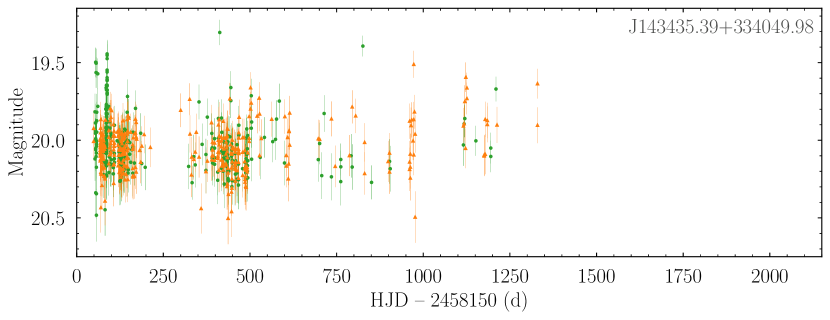
5.5.3 J143435.39+334049.98
The DESI and ZTF data of this CV are overall similar to J142833.44+003100.45, though with weaker Balmer absorption lines from the white dwarf, and stronger Balmer emission lines, suggestive of a larger contribution of the accretion disc. It is also most likely a WZ Sge dwarf nova.
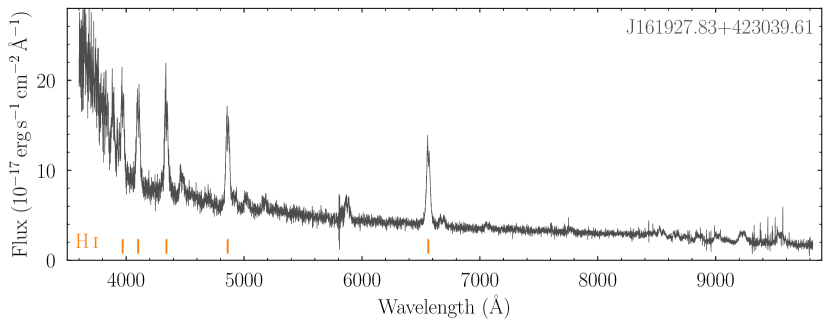
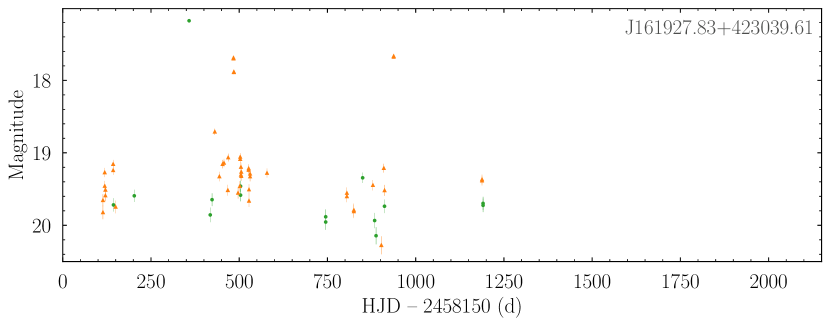
5.5.4 J161927.83+423039.61
The DESI spectrum shows a blue continuum with the Balmer jump in emission, and double-peaked emission lines from an accretion disc, with no signature of either the white dwarf or the donor star. The spectral appearance is typical of an SU UMa dwarf nova. The ZTF light curve is sparse, but captured one outburst, confirming the SU UMa classification.
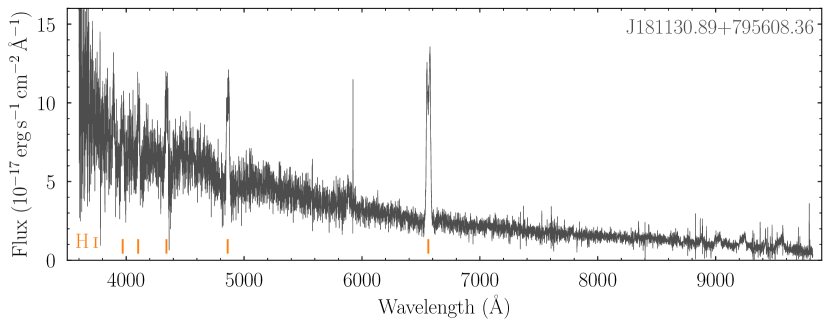
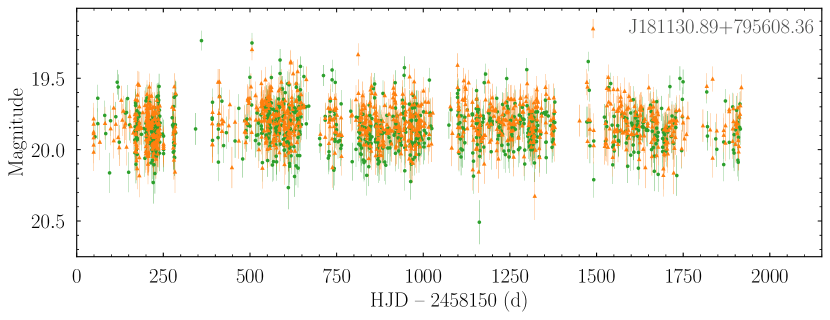
5.5.5 J181130.89+795608.36
The DESI and ZTF data of this system closely resemble those of J142833.44+003100.45 and J143435.39+334049.98, and this CV is also most likely a WZ Sge dwarf nova.
These CVs have been serendipitously included in the selection cuts made by Gentile Fusillo et al. (2019) and later by Cooper et al. (2023) to target isolated white dwarfs. CVs in this area of the Gaia HRD are dominated by WZ Sge and SU UMa subtypes (compare our Fig. 6 top left, and fig. 15 of Inight et al. 2023), consistent with our identifications.
6 Conclusions
We present here the DESI EDR sample of 2706 white dwarfs and 66 binaries including white dwarfs selected from cuts made on Gaia astrometry and photometry. The resulting Gaia selection function is relatively simple, making the DESI sample significantly more unbiased than previous surveys such as the SDSS and facilitating its use in statistical studies of white dwarf samples. Many of the white dwarfs in the DESI EDR have new spectroscopic classifications, including 43 DQs, 121 metal-line DxZ white dwarfs, 39 magnetic white dwarfs, and 5 CVs. The forthcoming DESI DR1 sample contains over 47 000 white dwarf candidates, and will revolutionise statistical studies of white dwarf samples.
Acknowledgements
The authors acknowledge financial support from Imperial College London through an Imperial College Research Fellowship grant awarded to CJM. This project has received funding from the European Research Council (ERC) under the European Union’s Horizon 2020 research and innovation programme (Grant agreement No. 101020057). PI was supported by a Leverhulme Trust Research Project Grant. SX is supported by NOIRLab, which is managed by the Association of Universities for Research in Astronomy (AURA) under a cooperative agreement with the National Science Foundation. SK acknowledges support from the Science & Technology Facilities Council (STFC) grant ST/Y001001/1. For the purpose of open access, the author has applied a Creative Commons Attribution (CC BY) licence to any Author Accepted Manuscript version arising from this submission. In identifying new white dwarfs and classifications, we have made use of the Montreal White Dwarf Database (Dufour et al., 2017) and the SIMBAD database, operated at CDS, Strasbourg, France (Wenger et al., 2000). This research is supported by the Director, Office of Science, Office of High Energy Physics of the U.S. Department of Energy under Contract No. DE–AC02–05CH11231, and by the National Energy Research Scientific Computing Center, a DOE Office of Science User Facility under the same contract; additional support for DESI is provided by the U.S. National Science Foundation, Division of Astronomical Sciences under Contract No. AST-0950945 to the NSF’s National Optical-Infrared Astronomy Research Laboratory; the Science and Technologies Facilities Council of the United Kingdom; the Gordon and Betty Moore Foundation; the Heising-Simons Foundation; the French Alternative Energies and Atomic Energy Commission (CEA); the National Council of Science and Technology of Mexico (CONACYT); the Ministry of Science and Innovation of Spain (MICINN), and by the DESI Member Institutions: https://www.desi.lbl.gov/collaborating-institutions. The authors are honoured to be permitted to conduct scientific research on Iolkam Du’ag (Kitt Peak), a mountain with particular significance to the Tohono O’odham Nation. This work has made use of data from the European Space Agency (ESA) mission Gaia (https://www.cosmos.esa.int/gaia), processed by the Gaia Data Processing and Analysis Consortium (DPAC, https://www.cosmos.esa.int/web/gaia/dpac/consortium). Funding for the DPAC has been provided by national institutions, in particular the institutions participating in the Gaia Multilateral Agreement. Funding for the Sloan Digital Sky Survey IV has been provided by the Alfred P. Sloan Foundation, the U.S. Department of Energy Office of Science, and the Participating Institutions. SDSS-IV acknowledges support and resources from the Center for High Performance Computing at the University of Utah. The SDSS website is www.sdss4.org. SDSS-IV is managed by the Astrophysical Research Consortium for the Participating Institutions of the SDSS Collaboration including the Brazilian Participation Group, the Carnegie Institution for Science, Carnegie Mellon University, Center for Astrophysics | Harvard & Smithsonian, the Chilean Participation Group, the French Participation Group, Instituto de Astrofísica de Canarias, The Johns Hopkins University, Kavli Institute for the Physics and Mathematics of the Universe (IPMU) / University of Tokyo, the Korean Participation Group, Lawrence Berkeley National Laboratory, Leibniz Institut für Astrophysik Potsdam (AIP), Max-Planck-Institut für Astronomie (MPIA Heidelberg), Max-Planck-Institut für Astrophysik (MPA Garching), Max-Planck-Institut für Extraterrestrische Physik (MPE), National Astronomical Observatories of China, New Mexico State University, New York University, University of Notre Dame, Observatário Nacional / MCTI, The Ohio State University, Pennsylvania State University, Shanghai Astronomical Observatory, United Kingdom Participation Group, Universidad Nacional Autónoma de México, University of Arizona, University of Colorado Boulder, University of Oxford, University of Portsmouth, University of Utah, University of Virginia, University of Washington, University of Wisconsin, Vanderbilt University, and Yale University. Based on observations obtained with the Samuel Oschin Telescope 48-inch and the 60-inch Telescope at the Palomar Observatory as part of the Zwicky Transient Facility project. ZTF is supported by the National Science Foundation under Grants No. AST-1440341 and AST-2034437 and a collaboration including current partners Caltech, IPAC, the Weizmann Institute for Science, the Oskar Klein Center at Stockholm University, the University of Maryland, Deutsches Elektronen-Synchrotron and Humboldt University, the TANGO Consortium of Taiwan, the University of Wisconsin at Milwaukee, Trinity College Dublin, Lawrence Livermore National Laboratories, IN2P3, University of Warwick, Ruhr University Bochum, Northwestern University and former partners the University of Washington, Los Alamos National Laboratories, and Lawrence Berkeley National Laboratories. Operations are conducted by COO, IPAC, and UW. This research has used data, tools or materials developed as part of the EXPLORE project that has received funding from the European Union’s Horizon 2020 research and innovation programme under grant agreement No 101004214.
Data availability
The data presented here are all available from the public archives of DESI, Gaia, ZTF, SDSS, and PanSTARRS. Data and python scripts used to produce the figures presented in this paper, along with the FITS file containing the DESI EDR white dwarf catalogue, are available here https://zenodo.org/records/10620344.
References
- Abdurro’uf et al. (2022) Abdurro’uf et al., 2022, ApJS, 259, 35
- Achilleos & Wickramasinghe (1989) Achilleos N., Wickramasinghe D. T., 1989, ApJ, 346, 444
- Achilleos et al. (1992) Achilleos N., Wickramasinghe D. T., Liebert J., Saffer R. A., Grauer A. D., 1992, ApJ, 396, 273
- Allende Prieto et al. (2020) Allende Prieto C., et al., 2020, Research Notes of the American Astronomical Society, 4, 188
- Almeida et al. (2023) Almeida A., et al., 2023, ApJS, 267, 44
- Althaus et al. (2005) Althaus L. G., Serenelli A. M., Panei J. A., Córsico A. H., García-Berro E., Scóccola C. G., 2005, A&A, 435, 631
- Althaus et al. (2013) Althaus L. G., Miller Bertolami M. M., Córsico A. H., 2013, Astron. Astrophys., 557, A19
- Angel et al. (1974a) Angel J. R. P., Hintzen P., Strittmatter P. A., Martin P. G., 1974a, ApJ, 190, L71
- Angel et al. (1974b) Angel J. R. P., Carswell R. F., Strittmatter P. A., Beaver E. A., Harms R., 1974b, ApJ, 194, L47
- Bailer-Jones et al. (2021) Bailer-Jones C. A. L., Rybizki J., Fouesneau M., Demleitner M., Andrae R., 2021, AJ, 161, 147
- Bailey (1979) Bailey J., 1979, MNRAS, 189, 41P
- Barstow et al. (2014) Barstow M. A., Barstow J. K., Casewell S. L., Holberg J. B., Hubeny I., 2014, MNRAS, 440, 1607
- Bauer & Bildsten (2018) Bauer E. B., Bildsten L., 2018, ApJ, 859, L19
- Bédard et al. (2020) Bédard A., Bergeron P., Brassard P., Fontaine G., 2020, ApJ, 901, 93
- Bédard et al. (2022) Bédard A., Bergeron P., Brassard P., 2022, ApJ, 930, 8
- Bellm et al. (2019) Bellm E. C., et al., 2019, PASP, 131, 018002
- Berg et al. (1992) Berg C., Wegner G., Foltz C. B., Chaffee F. H. J., Hewett P. C., 1992, ApJS, 78, 409
- Bergeron (2001) Bergeron P., 2001, ApJ, 558, 369
- Bergeron et al. (1990) Bergeron P., Wesemael F., Fontaine G., Liebert J., 1990, ApJ Lett., 351, L21
- Bergeron et al. (2001) Bergeron P., Leggett S. K., Ruiz M., 2001, ApJS, 133, 413
- Bergeron et al. (2011) Bergeron P., et al., 2011, ApJ, 737, 28
- Bergeron et al. (2022) Bergeron P., Kilic M., Blouin S., Bédard A., Leggett S. K., Brown W. R., 2022, ApJ, 934, 36
- Blouin (2022) Blouin S., 2022, A&A, 666, L7
- Blouin et al. (2017) Blouin S., Kowalski P. M., Dufour P., 2017, ApJ, 848, 36
- Blouin et al. (2018) Blouin S., Dufour P., Allard N. F., 2018, ApJ, 863, 184
- Blouin et al. (2023a) Blouin S., Bédard A., Tremblay P.-E., 2023a, MNRAS,
- Blouin et al. (2023b) Blouin S., Kilic M., Bédard A., Tremblay P.-E., 2023b, arXiv e-prints, p. arXiv:2307.14295
- Borysow et al. (2001) Borysow A., Jorgensen U. G., Fu Y., 2001, J. Quant. Spectrosc. Radiative Transfer, 68, 235
- Brun & Petit (1952) Brun A., Petit M., 1952, Bull. Assoc. Fr. Obs. Etoiles Variables, 12, 1
- Camisassa et al. (2023) Camisassa M., Torres S., Hollands M., Koester D., Raddi R., Althaus L. G., Rebassa-Mansergas A., 2023, arXiv e-prints, p. arXiv:2305.02110
- Caron et al. (2023) Caron A., Bergeron P., Blouin S., Leggett S. K., 2023, MNRAS, 519, 4529
- Cauley et al. (2018) Cauley P. W., Farihi J., Redfield S., Bachman S., Parsons S. G., Gänsicke B. T., 2018, ApJ, 852, L22
- Chambers et al. (2019) Chambers K. C., et al., 2019, The Pan-STARRS1 Surveys (arXiv:1612.05560)
- Cheng et al. (2019) Cheng S., Cummings J. D., Ménard B., 2019, ApJ, 886, 100
- Christlieb et al. (2001) Christlieb N., Wisotzki L., Reimers D., Homeier D., Koester D., Heber U., 2001, A&A, 366, 898
- Cooper et al. (2023) Cooper A. P., et al., 2023, ApJ, 947, 37
- Coutu et al. (2019) Coutu S., Dufour P., Bergeron P., Blouin S., Loranger E., Allard N. F., Dunlap B. H., 2019, ApJ, 885, 74
- Croom et al. (2004) Croom S. M., Smith R. J., Boyle B. J., Shanks T., Miller L., Outram P. J., Loaring N. S., 2004, MNRAS, 349, 1397
- Cukanovaite et al. (2018) Cukanovaite E., Tremblay P. E., Freytag B., Ludwig H. G., Bergeron P., 2018, MNRAS, 481, 1522
- Cukanovaite et al. (2021) Cukanovaite E., Tremblay P.-E., Bergeron P., Freytag B., Ludwig H.-G., Steffen M., 2021, MNRAS, 501, 5274
- Cunningham et al. (2019) Cunningham T., Tremblay P.-E., Freytag B., Ludwig H.-G., Koester D., 2019, MNRAS, 488, 2503
- Cunningham et al. (2020) Cunningham T., Tremblay P.-E., Gentile Fusillo N. P., Hollands M., Cukanovaite E., 2020, MNRAS, 492, 3540
- Cunningham et al. (2022) Cunningham T., Wheatley P. J., Tremblay P.-E., Gänsicke B. T., King G. W., Toloza O., Veras D., 2022, Nature, 602, 219
- DESI Collaboration et al. (2016a) DESI Collaboration et al., 2016a, preprint, (arXiv:1611.00036)
- DESI Collaboration et al. (2016b) DESI Collaboration et al., 2016b, preprint, (arXiv:1611.00037)
- DESI Collaboration et al. (2022) DESI Collaboration et al., 2022, AJ, 164, 207
- DESI Collaboration et al. (2023) DESI Collaboration et al., 2023, arXiv e-prints, p. arXiv:2306.06308
- DESI Collaboration et al. (2024) DESI Collaboration et al., 2024, AJ, 167, 62
- Dalton et al. (2012) Dalton G., et al., 2012, in Ground-based and Airborne Instrumentation for Astronomy IV. p. 84460P, doi:10.1117/12.925950
- Dalton et al. (2016) Dalton G., et al., 2016, in Ground-based and Airborne Instrumentation for Astronomy VI. p. 99081G, doi:10.1117/12.2231078
- Dawson et al. (2013) Dawson K. S., et al., 2013, AJ, 145, 10
- Dawson et al. (2016) Dawson K. S., et al., 2016, AJ, 151, 44
- Debes & Sigurdsson (2002) Debes J. H., Sigurdsson S., 2002, ApJ, 572, 556
- Dobbie et al. (2006) Dobbie P. D., et al., 2006, MNRAS, 369, 383
- Dufour et al. (2007a) Dufour P., Liebert J., Fontaine G., Behara N., 2007a, Nat, 450, 522
- Dufour et al. (2007b) Dufour P., et al., 2007b, ApJ, 663, 1291
- Dufour et al. (2017) Dufour P., Blouin S., Coutu S., Fortin-Archambault M., Thibeault C., Bergeron P., Fontaine G., 2017, in Tremblay P. E., Gaensicke B., Marsh T., eds, Astronomical Society of the Pacific Conference Series Vol. 509, 20th European White Dwarf Workshop. p. 3 (arXiv:1610.00986), doi:10.48550/arXiv.1610.00986
- Dunlap & Clemens (2015) Dunlap B. H., Clemens J. C., 2015, in Dufour P., Bergeron P., Fontaine G., eds, Astronomical Society of the Pacific Conference Series Vol. 493, 19th European Workshop on White Dwarfs. p. 547
- Eisenstein et al. (2006) Eisenstein D. J., et al., 2006, ApJS, 167, 40
- Elms et al. (2023) Elms A. K., et al., 2023, MNRAS, 524, 4996
- Euchner et al. (2002) Euchner F., Jordan S., Beuermann K., Gänsicke B. T., Hessman F. V., 2002, A&A, 390, 633
- Euchner et al. (2005) Euchner F., Reinsch K., Jordan S., Beuermann K., Gänsicke B. T., 2005, A&A, 442, 651
- Euchner et al. (2006) Euchner F., Jordan S., Beuermann K., Reinsch K., Gänsicke B. T., 2006, A&A, 451, 671
- Farihi et al. (2013) Farihi J., Gänsicke B. T., Koester D., 2013, MNRAS, 432, 1955
- Fitzpatrick (1999) Fitzpatrick E. L., 1999, Publ. Astron. Soc. Pacific, 111, 63
- Fleming et al. (1986) Fleming T. A., Liebert J., Green R. F., 1986, ApJ, 308, 176
- Fontaine & Wesemael (1987) Fontaine G., Wesemael F., 1987, in Philip A. G. D., Hayes D. S., Liebert J. W., eds, IAU Colloq. 95: Second Conference on Faint Blue Stars. pp 319–326
- Fontaine et al. (2001) Fontaine G., Brassard P., Bergeron P., 2001, PASP, 113, 409
- Foreman-Mackey et al. (2013) Foreman-Mackey D., Hogg D. W., Lang D., Goodman J., 2013, Publ. Astron. Soc. Pacific, 125, 306
- Gaia Collaboration et al. (2018) Gaia Collaboration et al., 2018, A&A, 616, A10
- Gaia Collaboration et al. (2021) Gaia Collaboration et al., 2021, A&A, 649, A1
- Gänsicke et al. (2009a) Gänsicke B. T., et al., 2009a, MNRAS, 397, 2170
- Gänsicke et al. (2009b) Gänsicke B. T., Levan A. J., Marsh T. R., Wheatley P. J., 2009b, ApJ Lett., 697, L129
- Gänsicke et al. (2012) Gänsicke B. T., Koester D., Farihi J., Girven J., Parsons S. G., Breedt E., 2012, MNRAS, 424, 333
- García-Berro et al. (2012) García-Berro E., et al., 2012, ApJ, 749, 25
- Genest-Beaulieu & Bergeron (2014) Genest-Beaulieu C., Bergeron P., 2014, ApJ, 796, 128
- Genest-Beaulieu & Bergeron (2019) Genest-Beaulieu C., Bergeron P., 2019, ApJ, 871, 169
- Gentile Fusillo et al. (2015) Gentile Fusillo N. P., Gänsicke B. T., Greiss S., 2015, MNRAS, 448, 2260
- Gentile Fusillo et al. (2017) Gentile Fusillo N. P., Gänsicke B. T., Farihi J., Koester D., Schreiber M. R., Pala A. F., 2017, MNRAS, 468, 971
- Gentile Fusillo et al. (2019) Gentile Fusillo N. P., et al., 2019, MNRAS, 482, 4570
- Gentile Fusillo et al. (2021) Gentile Fusillo N. P., et al., 2021, MNRAS, 508, 3877
- Gianninas et al. (2011) Gianninas A., Bergeron P., Ruiz M. T., 2011, ApJ, 743, 138
- Giclas et al. (1965) Giclas H. L., Burnham R., Thomas N. G., 1965, Lowell Obs. Bull., 125, 155
- Graham et al. (1990) Graham J. R., Matthews K., Neugebauer G., Soifer B. T., 1990, ApJ, 357, 216
- Green et al. (1986) Green R. F., Schmidt M., Liebert J., 1986, ApJS, 61, 305
- Gunn et al. (2006) Gunn J. E., et al., 2006, AJ, 131, 2332
- Guo et al. (2015) Guo J., Zhao J., Tziamtzis A., Liu J., Li L., Zhang Y., Hou Y., Wang Y., 2015, MNRAS, 454, 2787
- Guy et al. (2023) Guy J., et al., 2023, AJ, 165, 144
- Hahn et al. (2022) Hahn C., et al., 2022, arXiv e-prints, p. arXiv:2208.08512
- Hardy et al. (2023a) Hardy F., Dufour P., Jordan S., 2023a, MNRAS, 520, 6111
- Hardy et al. (2023b) Hardy F., Dufour P., Jordan S., 2023b, MNRAS, 520, 6135
- Harris et al. (2003) Harris H. C., et al., 2003, AJ, 126, 1023
- Herwig et al. (1999) Herwig F., Blöcker T., Langer N., Driebe T., 1999, A&A, 349, L5
- Hodgkin et al. (2021) Hodgkin S. T., et al., 2021, A&A, 652, A76
- Hollands et al. (2017) Hollands M. A., Koester D., Alekseev V., Herbert E. L., Gänsicke B. T., 2017, MNRAS, 467, 4970
- Hollands et al. (2018a) Hollands M. A., Gänsicke B. T., Koester D., 2018a, MNRAS, 477, 93
- Hollands et al. (2018b) Hollands M. A., Tremblay P. E., Gänsicke B. T., Gentile-Fusillo N. P., Toonen S., 2018b, MNRAS, 480, 3942
- Hollands et al. (2020) Hollands M. A., et al., 2020, Nature Astronomy, 4, 663
- Hollands et al. (2021) Hollands M. A., Tremblay P.-E., Gänsicke B. T., Koester D., Gentile-Fusillo N. P., 2021, Nature Astronomy, 5, 451
- Hollands et al. (2022) Hollands M. A., Tremblay P. E., Gänsicke B. T., Koester D., 2022, MNRAS, 511, 71
- Homeier et al. (1998) Homeier D., Koester D., Hagen H. J., Jordan S., Heber U., Engels D., Reimers D., Dreizler S., 1998, A&A, 338, 563
- Horne & Marsh (1986) Horne K., Marsh T. R., 1986, MNRAS, 218, 761
- Iben et al. (1997) Iben I. J., Ritossa C., Garcia-Berro E., 1997, ApJ, 489, 772
- Inight et al. (2023) Inight K., et al., 2023, arXiv e-prints, p. arXiv:2305.13371
- Izquierdo et al. (2021) Izquierdo P., Toloza O., Gänsicke B. T., Rodríguez-Gil P., Farihi J., Koester D., Guo J., Redfield S., 2021, MNRAS, 501, 4276
- Izquierdo et al. (2023) Izquierdo P., Gänsicke B. T., Rodríguez-Gil P., Koester D., Toloza O., Gentile Fusillo N. P., Pala A. F., Tremblay P.-E., 2023, MNRAS, 520, 2843
- Jura (2003) Jura M., 2003, ApJ Lett., 584, L91
- Kaiser et al. (2021) Kaiser B. C., Clemens J. C., Blouin S., Dufour P., Hegedus R. J., Reding J. S., Bédard A., 2021, Science, 371, 168
- Kawka et al. (2023) Kawka A., Ferrario L., Vennes S., 2023, MNRAS, 520, 6299
- Keller et al. (2022) Keller P. M., Breedt E., Hodgkin S., Belokurov V., Wild J., García-Soriano I., Wise J. L., 2022, MNRAS, 509, 4171
- Kemp et al. (1970) Kemp J. C., Swedlund J. B., Landstreet J. D., Angel J. R. P., 1970, ApJ, 161, L77
- Kenyon et al. (1988) Kenyon S. J., Shipman H. L., Sion E. M., Aannestad P. A., 1988, ApJ Lett., 328, L65
- Kepler et al. (2013) Kepler S. O., et al., 2013, MNRAS, 429, 2934
- Kepler et al. (2015) Kepler S. O., et al., 2015, MNRAS, 446, 4078
- Kepler et al. (2016) Kepler S. O., et al., 2016, MNRAS, 455, 3413
- Kepler et al. (2021) Kepler S. O., Koester D., Pelisoli I., Romero A. D., Ourique G., 2021, MNRAS, 507, 4646
- Kilic et al. (2009) Kilic M., Kowalski P. M., Reach W. T., von Hippel T., 2009, ApJ, 696, 2094
- Kilic et al. (2019) Kilic M., Rolland B., Bergeron P., Vanderbosch Z., Benni P., Garlitz J., 2019, MNRAS, 489, 3648
- Kilic et al. (2020) Kilic M., Bergeron P., Kosakowski A., Brown W. R., Agüeros M. A., Blouin S., 2020, ApJ, 898, 84
- Klein et al. (2010) Klein B., Jura M., Koester D., Zuckerman B., Melis C., 2010, ApJ, 709, 950
- Klein et al. (2021) Klein B. L., Doyle A. E., Zuckerman B., Dufour P., Blouin S., Melis C., Weinberger A. J., Young E. D., 2021, ApJ, 914, 61
- Kleinman et al. (2004) Kleinman S. J., et al., 2004, ApJ, 607, 426
- Kleinman et al. (2013) Kleinman S. J., et al., 2013, ApJS, 204, 5
- Koester (1976) Koester D., 1976, A&A, 52, 415
- Koester (2010) Koester D., 2010, Memorie della Societa Astronomica Italiana,, 81, 921
- Koester & Kepler (2015) Koester D., Kepler S. O., 2015, A&A, 583, A86
- Koester & Kepler (2019) Koester D., Kepler S. O., 2019, A&A, 628, A102
- Koester & Knist (2006) Koester D., Knist S., 2006, A&A, 454, 951
- Koester et al. (2011) Koester D., Girven J., Gänsicke B. T., Dufour P., 2011, aa, 530, A114
- Koester et al. (2014) Koester D., Gänsicke B. T., Farihi J., 2014, A&A, 566, A34
- Koester et al. (2020) Koester D., Kepler S. O., Irwin A. W., 2020, A&A, 635, A103
- Kollmeier et al. (2017) Kollmeier J. A., et al., 2017, preprint, (arXiv:1711.03234)
- Kong et al. (2019) Kong X., Luo A. L., Li X.-R., 2019, Research in Astronomy and Astrophysics, 19, 088
- Kowalski & Saumon (2006) Kowalski P. M., Saumon D., 2006, ApJ Lett., 651, L137
- Kraft (1962) Kraft R. P., 1962, ApJ, 135, 408
- Külebi et al. (2009) Külebi B., Jordan S., Euchner F., Gänsicke B. T., Hirsch H., 2009, A&A, 506, 1341
- Lallement et al. (2022) Lallement R., Vergely J. L., Babusiaux C., Cox N. L., 2022, Astron. Astrophys., 661, A147
- Liebert (1977) Liebert J., 1977, PASP, 89, 78
- Liebert (1986) Liebert J., 1986, in Hunger K., Schoenberner D., Kameswara Rao N., eds, IAU Colloq. 87: Hydrogen Deficient Stars and Related Objects. p. 367, doi:10.1007/978-94-009-4744-3_31
- Liebert et al. (2003) Liebert J., Bergeron P., Holberg J. B., 2003, AJ, 125, 348
- Lindegren et al. (2021) Lindegren L., et al., 2021, A&A, 649, A2
- Manser et al. (2016) Manser C. J., et al., 2016, MNRAS, 455, 4467
- Manser et al. (2021) Manser C. J., et al., 2021, MNRAS, 508, 5657
- Manser et al. (2023) Manser C. J., et al., 2023, MNRAS, 521, 4976
- Marsh & Horne (1988) Marsh T. R., Horne K., 1988, MNRAS, 235, 269
- Martin & Wickramasinghe (1984) Martin B., Wickramasinghe D. T., 1984, MNRAS, 206, 407
- Masci et al. (2019) Masci F. J., et al., 2019, PASP, 131, 018003
- Myers et al. (2023) Myers A. D., et al., 2023, AJ, 165, 50
- Nelson et al. (2013) Nelson B., Ford E. B., Payne M. J., 2013, Astrophys. J. Suppl. Ser., 210, 11
- Nordhaus et al. (2011) Nordhaus J., Wellons S., Spiegel D. S., Metzger B. D., Blackman E. G., 2011, Proceedings of the National Academy of Science, 108, 3135
- O’Brien et al. (2023) O’Brien M. W., et al., 2023, MNRAS, 518, 3055
- Okuya et al. (2023) Okuya A., Ida S., Hyodo R., Okuzumi S., 2023, MNRAS, 519, 1657
- Pelletier et al. (1986) Pelletier C., Fontaine G., Wesemael F., Michaud G., Wegner G., 1986, ApJ, 307, 242
- Ramírez-Pérez et al. (2023) Ramírez-Pérez C., et al., 2023, arXiv e-prints, p. arXiv:2306.06312
- Rebassa-Mansergas et al. (2007) Rebassa-Mansergas A., Gänsicke B. T., Rodríguez-Gil P., Schreiber M. R., Koester D., 2007, MNRAS, 382, 1377
- Rebassa-Mansergas et al. (2019) Rebassa-Mansergas A., Solano E., Xu S., Rodrigo C., Jiménez-Esteban F. M., Torres S., 2019, MNRAS, 489, 3990
- Reding et al. (2023) Reding J. S., Hermes J. J., Clemens J. C., Hegedus R. J., Kaiser B. C., 2023, MNRAS, 522, 693
- Regős & Tout (1995) Regős E., Tout C. A., 1995, MNRAS, 273, 146
- Reid et al. (2001) Reid I. N., Liebert J., Schmidt G. D., 2001, ApJ Lett., 550, L61
- Richards et al. (2002) Richards G. T., et al., 2002, AJ, 123, 2945
- Riello et al. (2021) Riello M., et al., 2021, A&A, 649, A3
- Rogers et al. (2024) Rogers L. K., et al., 2024, MNRAS, 527, 6038
- Rolland et al. (2018) Rolland B., Bergeron P., Fontaine G., 2018, ApJ, 857, 56
- Rolland et al. (2020) Rolland B., Bergeron P., Fontaine G., 2020, ApJ, 889, 87
- Ruiz-Macias et al. (2020) Ruiz-Macias O., et al., 2020, Research Notes of the American Astronomical Society, 4, 187
- Rybizki et al. (2020) Rybizki J., et al., 2020, Publ. Astron. Soc. Pacific, 132, 074501
- Rybizki et al. (2021) Rybizki J., Rix H.-W., Demleitner M., Bailer-Jones C. A. L., Cooper W. J., 2021, MNRAS, 500, 397
- Schimeczek & Wunner (2014a) Schimeczek C., Wunner G., 2014a, Computer Physics Communications, 185, 614
- Schimeczek & Wunner (2014b) Schimeczek C., Wunner G., 2014b, ApJS, 212, 26
- Schlafly et al. (2023) Schlafly E. F., et al., 2023, arXiv e-prints, p. arXiv:2306.06309
- Schmidt et al. (2003) Schmidt G. D., et al., 2003, ApJ, 595, 1101
- Schmidt et al. (2005) Schmidt G. D., et al., 2005, ApJ, 630, 1037
- Schneider et al. (2007) Schneider D. P., et al., 2007, AJ, 134, 102
- Schreiber et al. (2019) Schreiber M. R., Gänsicke B. T., Toloza O., Hernandez M.-S., Lagos F., 2019, ApJ, 887, L4
- Shen et al. (2023) Shen K. J., Blouin S., Breivik K., 2023, arXiv e-prints, p. arXiv:2308.04559
- Sion et al. (1983) Sion E. M., Greenstein J. L., Landstreet J. D., Liebert J., Shipman H. L., Wegner G. A., 1983, ApJ, 269, 253
- Sion et al. (1988) Sion E. M., Aannestad P. A., Kenyon S. J., 1988, ApJ Lett., 330, L55
- Steele et al. (2021) Steele A., Debes J., Xu S., Yeh S., Dufour P., 2021, ApJ, 911, 25
- Subasavage et al. (2008) Subasavage J. P., Henry T. J., Bergeron P., Dufour P., Hambly N. C., 2008, AJ, 136, 899
- Swan et al. (2019) Swan A., Farihi J., Koester D., Holland s M., Parsons S., Cauley P. W., Redfield S., Gänsicke B. T., 2019, MNRAS, 490, 202
- Swan et al. (2024) Swan A., Farihi J., Su K. Y. L., Desch S. J., 2024, MNRAS, 529, L41
- Szkody et al. (2004) Szkody P., et al., 2004, AJ, 128, 1882
- Szkody et al. (2005) Szkody P., et al., 2005, AJ, 129, 2386
- Szkody et al. (2006) Szkody P., et al., 2006, AJ, 131, 973
- Tapia (1977) Tapia S., 1977, ApJ Lett., 212, L125
- Tout et al. (2008) Tout C. A., Wickramasinghe D. T., Liebert J., Ferrario L., Pringle J. E., 2008, MNRAS, 387, 897
- Tremblay et al. (2010) Tremblay P., Bergeron P., Kalirai J. S., Gianninas A., 2010, ApJ, 712, 1345
- Tremblay et al. (2011) Tremblay P.-E., Ludwig H.-G., Steffen M., Bergeron P., Freytag B., 2011, A&A, 531, L19+
- Tremblay et al. (2013) Tremblay P. E., Ludwig H. G., Steffen M., Freytag B., 2013, A&A, 559, A104
- Tremblay et al. (2019) Tremblay P.-E., et al., 2019, Nature, 565, 202
- Trierweiler et al. (2023) Trierweiler I. L., Doyle A. E., Young E. D., 2023, arXiv e-prints, p. arXiv:2306.03743
- Vanderburg et al. (2015) Vanderburg A., et al., 2015, Nat, 526, 546
- Vanlandingham et al. (2005) Vanlandingham K. M., et al., 2005, AJ, 130, 734
- Vennes & Kawka (2012) Vennes S., Kawka A., 2012, ApJ, 745, L12
- Vennes et al. (2002) Vennes S., Smith R. J., Boyle B. J., Croom S. M., Kawka A., Shanks T., Miller L., Loaring N., 2002, MNRAS, 335, 673
- Vennes et al. (2012) Vennes S., Kawka A., O’Toole S. J., Thorstensen J. R., 2012, ApJ, 756, L5
- Vergely et al. (2022) Vergely J. L., Lallement R., Cox N. L., 2022, Astron. Astrophys., 664, A174
- Vincent et al. (2023) Vincent O., Bergeron P., Dufour P., 2023, MNRAS, 521, 760
- Vogel et al. (2008) Vogel J., Byckling K., Schwope A., Osborne J. P., Schwarz R., Watson M. G., 2008, A&A, 485, 787
- Vogt (1980) Vogt N., 1980, A&A, 88, 66
- Watson et al. (1996) Watson M. G., Marsh T. R., Fender R. P., Barstow M. A., Still M., Page M., Dhillon V. S., Beardmore A. P., 1996, MNRAS, 281, 1016
- Wenger et al. (2000) Wenger M., et al., 2000, A&AS, 143, 9
- Werner & Herwig (2006) Werner K., Herwig F., 2006, PASP, 118, 183
- Wesemael & Fontaine (1985) Wesemael F., Fontaine G., 1985, ApJ, 288, 764
- Wickramasinghe et al. (2014) Wickramasinghe D. T., Tout C. A., Ferrario L., 2014, MNRAS, 437, 675
- Wilson et al. (2019) Wilson T. G., Farihi J., Gänsicke B. T., Swan A., 2019, MNRAS, p. 1000
- Zuckerman (2015) Zuckerman B., 2015, in Dufour P., Bergeron P., Fontaine G., eds, Astronomical Society of the Pacific Conference Series Vol. 493, 19th European Workshop on White Dwarfs. p. 291 (arXiv:1410.2575), doi:10.48550/arXiv.1410.2575
- Zuckerman & Becklin (1987) Zuckerman B., Becklin E. E., 1987, Nat, 330, 138
- Zuckerman & Reid (1998) Zuckerman B., Reid I. N., 1998, ApJ, 505, L143
- Zuckerman et al. (2003) Zuckerman B., Koester D., Reid I. N., Hünsch M., 2003, ApJ, 596, 477
- Zuckerman et al. (2007) Zuckerman B., Koester D., Melis C., Hansen B. M., Jura M., 2007, ApJ, 671, 872
- de Jong et al. (2016) de Jong R. S., et al., 2016, in Ground-based and Airborne Instrumentation for Astronomy VI. p. 99081O, doi:10.1117/12.2232832
- ter Braak & Vrugt (2008) ter Braak C. J., Vrugt J. A., 2008, Stat. Comput., 18, 435
Appendix A Description of the DESI EDR white dwarf catalogue
| Column | Heading | Description |
|---|---|---|
| 1 | wdj_name | WD J + J2000 RA (hh mm ss.ss) + dec (dd mm ss.s), equinox and epoch 2000 |
| 2 | desi_sp_class | Spectral class determined from DESI EDR spectra |
| 3 | desi_id | DESI target ID (unique within DESI targeting) |
| 4 | desi_nexp | Number of exposures included in the DESI EDR |
| 5 | desi_stn_aiq | Signal-to-noise ratios of the DESI EDR blue-arm individual exposures added in quadrature |
| 6 | dr2_source_id | Gaia DR2 unique source identifier (unique within a particular Data Release) |
| 7 | dr2_ra | Gaia DR2 Right Ascension (J2015.5) [deg] |
| 8 | dr2_ra_error | Gaia DR2 Standard error of Right Ascension () [mas] |
| 9 | dr2_dec | Gaia DR2 Declination (J2015.5) [deg] |
| 10 | dr2_dec_error | Gaia DR2 Standard error of Declination [mas] |
| 11 | dr2_parallax | Gaia DR2 Absolute stellar parallax of the source at J2015.5 [mas] |
| 12 | dr2_parallax_error | Gaia DR2 Standard error of parallax [mas] |
| 13 | dr2_pmra | Gaia DR2 Proper motion in Right Ascension () [mas yr-1] |
| 14 | dr2_pmra_error | Gaia DR2 Standard error of proper motion in Right Ascension [mas yr-1] |
| 15 | dr2_pmdec | Gaia DR2 Proper motion in Declination [mas yr-1] |
| 16 | dr2_pmdec_error | Gaia DR2 Standard error of proper motion in Declination [mas yr-1] |
| 17 | dr2_astrometric_excess_noise | Gaia DR2 Measure of the residuals in the astrometric solution for the source [mas] |
| 18 | dr2_astrometric_sigma5d_max | Gaia DR2 Five-dimensional equivalent to the semimajor axis of the Gaia position error ellipse [mas] |
| 19 | dr2_phot_g_mean_flux | Gaia DR2 G-band mean flux [e-/s] |
| 20 | dr2_phot_g_mean_flux_error | Gaia DR2 Error on G-band mean flux [e-/s] |
| 21 | dr2_phot_g_mean_mag | Gaia DR2 Gaia G-band mean magnitude (Vega scale) [mag] |
| 22 | dr2_phot_bp_mean_flux | Gaia DR2 Integrated mean flux [e-/s] |
| 23 | dr2_phot_bp_mean_flux_error | Gaia DR2 Error on integrated mean flux [e-/s] |
| 24 | dr2_phot_bp_mean_mag | Gaia DR2 Integrated mean magnitude (Vega scale) [mag] |
| 25 | dr2_phot_rp_mean_flux | Gaia DR2 Integrated mean flux [e-/s] |
| 26 | dr2_phot_rp_mean_flux_error | Gaia DR2 Error on integrated mean flux [e-/s] |
| 27 | dr2_phot_rp_mean_mag | Gaia DR2 Integrated mean magnitude (Vega scale) [mag] |
| 28 | dr2_phot_bp_rp_excess_factor | Gaia DR2 / excess factor estimated from the comparison of the sum of integrated |
| 29 | dr2_distance | Gaia DR2 distance determined using parallax by GF19 |
| 30 | dr2_pwd | Gaia DR2 Probability of being a white dwarf calculated by Gentile Fusillo et al. (2019) |
| 31 | dr2_pwd_flag | If 1 it indicates the Gaia DR2 value could be unreliable |
| 32 | dr2_Teff_H | Gaia DR2 Effective temperature [K] determined by Gentile Fusillo et al. (2019) |
| for pure-H model atmospheres | ||
| 33 | dr2_eTeff_H | Gaia DR2 Uncertainty on Effective temperature [K] |
| 34 | dr2_log_g_H | Gaia DR2 Surface gravities [cm s-2] determined by Gentile Fusillo et al. (2019) |
| for pure-H model atmospheres | ||
| 35 | dr2_elog_g_H | Gaia DR2 Uncertainty on surface gravities [cm s-2] |
| 36 | dr2_mass_H | Gaia DR2 Stellar mass [] determined by Gentile Fusillo et al. (2019) |
| 37 | dr2_emass_H | Gaia DR2 Uncertainty on the mass [] |
| 38 | dr2_chi2_H | Gaia DR2 value of the fit (pure-H) |
| 39 | dr2_Teff_He | Gaia DR2 Effective temperature [K] determined by Gentile Fusillo et al. (2019) |
| for pure-He model atmospheres | ||
| 40 | dr2_eTeff_He | Gaia DR2 Uncertainty on Effective temperature [K] |
| 41 | dr2_log_g_He | Gaia DR2 Surface gravities [cm s-2] determined by Gentile Fusillo et al. (2019) |
| for pure-He model atmospheres | ||
| 42 | dr2_elog_g_He | Gaia DR2 Uncertainty on surface gravities [cm s-2] |
| 43 | dr2_mass_He | Gaia DR2 Stellar mass [] determined by Gentile Fusillo et al. (2019) |
| 44 | dr2_emass_He | Gaia DR2 Uncertainty on the mass [] |
| 45 | dr2_chisq_He | Gaia DR2 value of the fit (pure-He) |
| 46 | edr3_source_id | Gaia EDR3 unique source identifier (unique within a particular Data Release) |
| 47 | edr3_ra | Gaia EDR3 Right Ascension (J2015.5) [deg] |
| 48 | edr3_ra_error | Gaia EDR3 Standard error of Right Ascension () [mas] |
| 49 | edr3_dec | Gaia EDR3 Declination (J2015.5) [deg] |
| 50 | edr3_dec_error | Gaia EDR3 Standard error of Declination [mas] |
| 51 | edr3_parallax | Gaia EDR3 Absolute stellar parallax of the source at J2015.5 [mas] |
| 52 | edr3_parallax_error | Gaia EDR3 Standard error of parallax [mas] |
| 53 | edr3_ZP_correction | Gaia EDR3 Zero-point offset correction (Lindegren et al., 2021) |
| 54 | edr3_Pwd | Gaia EDR3 Probability of being a white dwarf calculated by (Gentile Fusillo et al., 2021) |
| 55 | edr3_density | The number of Gaia sources per square degree around this object |
| 56 | edr3_ref_epoch | Gaia EDR3 reference epoch (J2016.0) |
| 57 | edr3_pmra | Gaia EDR3 Proper motion in Right Ascension () [mas yr-1] |
| Column | Heading | Description |
|---|---|---|
| 58 | edr3_pmra_error | Gaia EDR3 Standard error of proper motion in Right Ascension [mas yr-1] |
| 59 | edr3_pmdec | Gaia EDR3 Proper motion in Declination [mas yr-1] |
| 60 | edr3_pmdec_error | Gaia EDR3 Standard error of proper motion in Declination [mas yr-1] |
| 61 | edr3_astrometric_excess_noise | Gaia EDR3 Measure of the residuals in the astrometric solution for the source [mas] |
| 62 | edr3_astrometric_excess_noise_sig | Gaia EDR3 significance of the measure of the residuals in the astrometric solution |
| 63 | edr3_astrometric_params_solved | Gaia EDR3 Number of parameters solved for the astrometric solution |
| 64 | edr3_astrometric_sigma5d_max | Gaia EDR3 Five-dimensional equivalent to the semimajor axis of the Gaia position error ellipse [mas] |
| 65 | edr3_ruwe | Gaia EDR3 Renormalised unit weight error |
| 66 | edr3_phot_g_n_obs | Gaia EDR3 number of observations contributing to photometry |
| 67 | edr3_phot_g_mean_flux | Gaia EDR3 -band mean flux [e-/s] |
| 68 | edr3_phot_g_mean_flux_error | Gaia EDR3 Error on -band mean flux [e-/s] |
| 69 | edr3_phot_g_mean_mag | Gaia EDR3 -band mean magnitude (Vega scale) [mag] |
| 70 | edr3_phot_g_mean_mag_error | Gaia EDR3 Error on -band mean magnitude (Vega scale) [mag] |
| 71 | edr3_phot_g_mean_flux_corrected | Gaia EDR3 Corrected -band mean flux (Gaia Collaboration et al., 2021) |
| 72 | edr3_phot_g_mean_mag_corrected | Gaia EDR3 Corrected -band mean magnitude (Vega scale) [mag] (Gaia Collaboration et al., 2021) |
| 73 | edr3_phot_g_mean_mag_error_corrected | Gaia EDR3 Corrected Error on -band mean magnitude (Vega scale) [mag] |
| (Gaia Collaboration et al., 2021) | ||
| 74 | edr3_phot_bp_n_obs | Gaia EDR3 number of observations contributing to photometry |
| 75 | edr3_phot_bp_mean_flux | Gaia EDR3 Integrated mean flux [e-/s] |
| 76 | edr3_phot_bp_mean_flux_error | Gaia EDR3 Error on integrated mean flux [e-/s] |
| 77 | edr3_phot_bp_mean_mag | Gaia EDR3 Integrated mean magnitude (Vega scale) [mag] |
| 78 | edr3_phot_bp_mean_mag_error | Gaia EDR3 Error on integrated mean magnitude (Vega scale) [mag] |
| 79 | edr3_phot_rp_n_obs | Gaia EDR3 number of observations contributing to photometry |
| 80 | edr3_phot_rp_mean_flux | Gaia EDR3 Integrated mean flux [e-/s] |
| 81 | edr3_phot_rp_mean_flux_error | Gaia EDR3 Error on integrated mean flux [e-/s] |
| 82 | edr3_phot_rp_mean_mag | Gaia EDR3 Integrated mean magnitude (Vega scale) [mag] |
| 83 | edr3_phot_rp_mean_mag_error | Gaia EDR3 Error on integrated mean magnitude (Vega scale) [mag] |
| 84 | edr3_phot_bp_rp_excess_factor | Gaia EDR3 / excess factor estimated from the comparison of the sum of integrated |
| 85 | edr3_phot_bp_rp_excess_factor_corrected | Gaia EDR3 / excess factor corrected for colour dependence (Riello et al., 2021) |
| 86 | edr3_l | Galactic longitude [deg] |
| 87 | edr3_b | Galactic latitude [deg] |
| 88 | edr3_excess_flux_error | Gaia EDR3 Metric for source photometric variability |
| 89 | edr3_meanAV | Gaia EDR3 Mean extinction value (mag) derived from 3D reddening maps |
| 90 | edr3_minAV | Gaia EDR3 Extinction value (mag) derived from 3D reddening maps using EDR3 distance |
| 91 | edr3_maxAV | Gaia EDR3 Extinction value (mag) derived from 3D reddening maps using EDR3 distance |
| 92 | edr3_flag_ext | Gaia EDR3 Extinction flag (see Gentile Fusillo et al. 2021) |
| 93 | edr3_teff_H | Gaia EDR3 Effective temperature [K] determined by Gentile Fusillo et al. (2021) |
| for pure-H model atmospheres | ||
| 94 | edr3_eteff_H | Gaia EDR3 Uncertainty on Effective temperature [K] |
| 95 | edr3_logg_H | Gaia EDR3 Surface gravities [cm s-2] determined by Gentile Fusillo et al. (2021) |
| for pure-H model atmospheres | ||
| 96 | edr3_elogg_H | Gaia EDR3 Uncertainty on surface gravities [cm s-2] |
| 97 | edr3_mass_H | Gaia EDR3 Stellar mass [] determined by Gentile Fusillo et al. (2021) |
| 98 | edr3_emass_H | Gaia EDR3 Uncertainty on the mass [] |
| 99 | edr3_chisq_H | Gaia EDR3 value of the fit (pure-H) |
| 100 | edr3_teff_He | Gaia EDR3 Effective temperature [K] determined by Gentile Fusillo et al. (2021) |
| for pure-He model atmospheres | ||
| 101 | edr3_eteff_He | Gaia EDR3 Uncertainty on Effective temperature [K] |
| 102 | edr3_logg_He | Gaia EDR3 Surface gravities [cm s-2] determined by Gentile Fusillo et al. (2021) |
| for pure-He model atmospheres | ||
| 103 | edr3_elogg_He | Gaia EDR3 Uncertainty on surface gravities [cm s-2] |
| 104 | edr3_mass_He | Gaia EDR3 Stellar mass [] determined by Gentile Fusillo et al. (2021) |
| 105 | edr3_emass_He | Gaia EDR3 Uncertainty on the mass [] |
| 106 | edr3_chisq_He | Gaia EDR3 value of the fit (pure-He) |
| 107 | edr3_teff_mixed | Gaia EDR3 Effective temperature [K] determined by Gentile Fusillo et al. (2021) |
| for mixed H-He model atmospheres | ||
| 108 | edr3_eteff_mixed | Gaia EDR3 Uncertainty on Effective temperature [K] |
| 109 | edr3_logg_mixed | Gaia EDR3 Surface gravities [cm s-2] determined by Gentile Fusillo et al. (2021) |
| for mixed H-He model atmospheres | ||
| 110 | edr3_elogg_mixed | Gaia EDR3 Uncertainty on surface gravities [cm s-2] |
| 111 | edr3_mass_mixed | Gaia EDR3 Stellar mass [] determined by Gentile Fusillo et al. (2021) |
| 112 | edr3_emass_mixed | Gaia EDR3 Uncertainty on the mass [] |
| 113 | edr3_chisq_mixed | Gaia EDR3 value of the fit (mixed H-He) |
| Column | Heading | Description |
|---|---|---|
| 114 | edr3_r_med_geo | Median of the geometric distance posterior (pc) (Bailer-Jones et al., 2021) |
| 115 | edr3_r_lo_geo | 16th percentile of the geometric distance posterior (pc) (Bailer-Jones et al., 2021) |
| 116 | edr3_r_hi_geo | 84th percentile of the geometric distance posterior (pc) (Bailer-Jones et al., 2021) |
| 117 | edr3_r_med_photogeo | Median of the photogeometric distance posterior (pc) (Bailer-Jones et al., 2021) |
| 118 | edr3_r_lo_photogeo | 16th percentile of the photomgeometric distance posterior (pc) (Bailer-Jones et al., 2021) |
| 119 | edr3_r_hi_photogeo | 84th percentile of the photomgeometric distance posterior (pc) (Bailer-Jones et al., 2021) |
| 120 | edr3_fidelity_v1 | ‘Astrometric fidelity’ metric from Rybizki et al. (2021) |
| 121 | umag_sdss | SDSS u-band magnitude [mag] |
| 122 | e_umag_sdss | SDSS u-band magnitude uncertainty [mag] |
| 123 | gmag_sdss | SDSS g-band magnitude [mag] |
| 124 | e_gmag_sdss | SDSS g-band magnitude uncertainty [mag] |
| 125 | rmag_sdss | SDSS r-band magnitude [mag] |
| 126 | e_rmag_sdss | SDSS r-band magnitude uncertainty [mag] |
| 127 | imag_sdss | SDSS i-band magnitude [mag] |
| 128 | e_imag_sdss | SDSS i-band magnitude uncertainty [mag] |
| 129 | zmag_sdss | SDSS z-band magnitude [mag] |
| 130 | e_zmag_sdss | SDSS z-band magnitude uncertainty [mag] |
| 131 | gmag_ps1 | PanSTARRS DR1 g-band magnitude [mag] |
| 132 | e_gmag_ps1 | PanSTARRS DR1 g-band magnitude uncertainty [mag] |
| 133 | gFlags_ps1 | Flags on PanSTARRS DR1 g-band magnitude |
| 134 | rmag_ps1 | PanSTARRS DR1 r-band magnitude [mag] |
| 135 | e_rmag_ps1 | PanSTARRS DR1 r-band magnitude uncertainty [mag] |
| 136 | rFlags_ps1 | Flags on PanSTARRS DR1 r-band magnitude |
| 137 | imag_ps1 | PanSTARRS DR1 i-band magnitude [mag] |
| 138 | e_imag_ps1 | PanSTARRS DR1 i-band magnitude uncertainty [mag] |
| 139 | iFlags_ps1 | Flags on PanSTARRS DR1 i-band magnitude |
| 140 | zmag_ps1 | PanSTARRS DR1 z-band magnitude [mag] |
| 141 | e_zmag_ps1 | PanSTARRS DR1 z-band magnitude uncertainty [mag] |
| 142 | zFlags_ps1 | Flags on PanSTARRS DR1 z-band magnitude |
| 143 | ymag_ps1 | PanSTARRS DR1 y-band magnitude [mag] |
| 144 | e_ymag_ps1 | PanSTARRS DR1 y-band magnitude uncertainty [mag] |
| 145 | yFlags_ps1 | Flags on PanSTARRS DR1 y-band magnitude |
| 146 | fuvmag_galex | GALEX FUV magnitude [mag] |
| 147 | e_fuvmag_galex | GALEX FUV magnitude uncertainty [mag] |
| 148 | nuvmag_galex | GALEX NUV magnitude [mag] |
| 149 | e_nuvmag_galex | GALEX NUV magnitude uncertainty [mag] |
| 150 | ext_tomog | Visual (5500Å) extinction [mag] from TOMO-G (https://explore-platform.eu/sda/g-tomo) |
| 151 | ext_err_tomog | Visual (5500Å) extinction uncertainity [mag] from TOMO-G (https://explore-platform.eu/sda/g-tomo) |
| 152 | simbad_main_id | Main identifier for given crossmatched source in the SIMBAD database (Wenger et al., 2000) |
| 153 | simbad_main_type | Main astronomical source-type for given crossmatched source in the SIMBAD database (Wenger et al., 2000) |
| 154 | simbad_other_types | Other astronomical source-types for given crossmatched source in the SIMBAD database (Wenger et al., 2000) |
| 155 | simbad_sp_type | Spectral type for the given crossmatched source by the SIMBAD database (Wenger et al., 2000) |
| 156 | simbad_angDist | Distance between DESI source and given crossmatched source in the SIMBAD database (Wenger et al., 2000) |
| 157 | simbad_nbref | Number of references associated with given source in the SIMBAD database (Wenger et al., 2000) |
| 158 | mwdd_name | Identifier given by the Montreal White Dwarf Database (Dufour et al., 2017) |
| 159 | mwdd_ra | Right Ascension given by the Montreal White Dwarf Database (Dufour et al., 2017) |
| 160 | mwdd_dec | Declination given by the Montreal White Dwarf Database (Dufour et al., 2017) |
| 161 | mwdd_sp_class | Spectral type given by the Montreal White Dwarf Database (Dufour et al., 2017) |
| 162 | mwdd_teff | Effective temperature [K] given by the Montreal White Dwarf Database (Dufour et al., 2017) |
| 163 | mwdd_logg | Surface gravity [cm s-2] given by the Montreal White Dwarf Database (Dufour et al., 2017) |
| 164 | mwdd_desi_separation | Separation between DESI source and cross-matched source in the Montreal White Dwarf Database |
| (Dufour et al., 2017) |
| Column | Heading | Description |
|---|---|---|
| 1 | wdj_name | WD J + J2000 ra (hh mm ss.ss) + dec (dd mm ss.s), equinox and epoch 2000 |
| 2 | plate | Plate identifier for a unique SDSS spectrum |
| 3 | mjd | MJD identifier for a unique SDSS spectrum |
| 4 | fiberid | Fiber identifier for a unique SDSS spectrum |
| 5 | desi_sdss_separation | Separation between DESI source and cross-matched source in the SDSS sample |
| 6 | n_sdss_spec | Number of unique SDSS spectra cross-matched to a given white dwarf in the DESI EDR sample |
| Column | Heading | Description |
|---|---|---|
| 1 | wdj_name | WD J + J2000 ra (hh mm ss.ss) + dec (dd mm ss.s), equinox and epoch 2000 |
| 2 | teff | Effective temperature [K] obtained from fit |
| 3 | teff_err | Error on effective temperature [K] obtained from fit |
| 4 | logg | Surface gravity [cm s-2] obtained from fit |
| 5 | logg_err | Error on surface gravity [cm s-2] obtained from fit |
| 6 | d_fitted | Distance [pc] obtained from the fit |
| 7 | d_fitted_err | Error on the distance [pc] obtained from the fit |
| Column | Heading | Description |
|---|---|---|
| 1 | wdj_name | WD J + J2000 ra (hh mm ss.ss) + dec (dd mm ss.s), equinox and epoch 2000 |
| 2 | teff | Effective temperature [K] obtained from fit |
| 3 | teff_err | Error on effective temperature [K] obtained from fit |
| 4 | logg | Surface gravity [cm s-2] obtained from fit |
| 5 | logg_err | Error on surface gravity [cm s-2] obtained from fit |
| 6 | teff_3D_0.8 | Effective temperature [K] obtained from fit after applying 3D corrections of Tremblay et al. (2011) |
| 7 | logg_3D_0.8 | Surface gravity [cm s-2] obtained from fit after applying 3D corrections of Tremblay et al. (2011) |
| Column | Heading | Description |
|---|---|---|
| 1 | wdj_name | WD J + J2000 ra (hh mm ss.ss) + dec (dd mm ss.s), equinox and epoch 2000 |
| 2 | mjd | MJD identifier for a unique SDSS spectrum |
| 3 | plate | Plate identifier for a unique SDSS spectrum |
| 4 | fiberid | Fiber identifier for a unique SDSS spectrum |
| 5 | teff | Effective temperature [K] obtained from fit |
| 6 | teff_err | Error on effective temperature [K] obtained from fit |
| 7 | logg | Surface gravity [cm s-2] obtained from fit |
| 8 | logg_err | Error on surface gravity [cm s-2] obtained from fit |
| 9 | teff_3D_0.8 | Effective temperature [K] obtained from fit after applying 3D corrections of Tremblay et al. (2011) |
| 10 | logg_3D_0.8 | Surface gravity [cm s-2] obtained from fit after applying 3D corrections of Tremblay et al. (2011) |
| Column | Heading | Description |
|---|---|---|
| 1 | wdj_name | WD J + J2000 ra (hh mm ss.ss) + dec (dd mm ss.s), equinox and epoch 2000 |
| 2 | teff | Effective temperature [K] obtained from fit |
| 3 | teff_err | Error on effective temperature [K] obtained from fit |
| 4 | logg | Surface gravity [cm s-2] obtained from fit |
| 5 | logg_err | Error on surface gravity [cm s-2] obtained from fit |
| 6 | d_fitted | Distance [pc] obtained from the fit |
| 7 | d_fitted_err | Error on the distance [pc] obtained from the fit |
| Column | Heading | Description |
|---|---|---|
| 1 | wdj_name | WD J + J2000 ra (hh mm ss.ss) + dec (dd mm ss.s), equinox and epoch 2000 |
| 2 | teff | Effective temperature [K] obtained from fit |
| 3 | teff_err | Error on effective temperature [K] obtained from fit |
| 4 | logg | Surface gravity [cm s-2] obtained from fit |
| 5 | logg_err | Error on surface gravity [cm s-2] obtained from fit |
| 6 | teff_3D_0.8 | Effective temperature [K] obtained from fit after applying 3D corrections of Cukanovaite et al. (2021) |
| 7 | logg_3D_0.8 | Surface gravity [cm s-2] obtained from fit after applying 3D corrections of Cukanovaite et al. (2021) |
| Column | Heading | Description |
|---|---|---|
| 1 | wdj_name | WD J + J2000 ra (hh mm ss.ss) + dec (dd mm ss.s), equinox and epoch 2000 |
| 2 | mjd | MJD identifier for a unique SDSS spectrum |
| 3 | plate | Plate identifier for a unique SDSS spectrum |
| 4 | fiber | Fiber identifier for a unique SDSS spectrum |
| 5 | teff | Effective temperature [K] obtained from fit |
| 6 | teff_err | Error on effective temperature [K] obtained from fit |
| 7 | logg | Surface gravity [cm s-2] obtained from fit |
| 8 | logg_err | Error on surface gravity [cm s-2] obtained from fit |
| 9 | teff_3D_0.8 | Effective temperature [K] obtained from fit after applying 3D corrections of Cukanovaite et al. (2021) |
| 10 | logg_3D_0.8 | Surface gravity [cm s-2] obtained from fit after applying 3D corrections of Cukanovaite et al. (2021) |
| Column | Heading | Description |
|---|---|---|
| 1 | wdj_name | WD J + J2000 ra (hh mm ss.ss) + dec (dd mm ss.s), equinox and epoch 2000 |
| 2 | teff | Effective temperature [K] obtained from fit |
| 3 | teff_err | Error on effective temperature [K] obtained from fit |
| 4 | logg | Surface gravity [cm s-2] obtained from fit |
| 5 | logg_err | Error on surface gravity [cm s-2] obtained from fit |
| 6 | d_fitted | Distance [pc] obtained from the fit |
| 7 | d_fitted_err | Error on the distance [pc] obtained from the fit |
| Column | Heading | Description |
|---|---|---|
| 1 | wdj_name | WD J + J2000 ra (hh mm ss.ss) + dec (dd mm ss.s), equinox and epoch 2000 |
| 2 | teff | Effective temperature [K] obtained from fit |
| 3 | teff_err | Error on effective temperature [K] obtained from fit |
| 4 | logg | Surface gravity [cm s-2] obtained from fit |
| 5 | logg_err | Error on surface gravity [cm s-2] obtained from fit |
| 6 | teff_3D_0.8 | Effective temperature [K] obtained from fit after applying 3D corrections of Cukanovaite et al. (2021) |
| 7 | logg_3D_0.8 | Surface gravity [cm s-2] obtained from fit after applying 3D corrections of Cukanovaite et al. (2021) |
| Column | Heading | Description |
|---|---|---|
| 1 | wdj_name | WD J + J2000 ra (hh mm ss.ss) + dec (dd mm ss.s), equinox and epoch 2000 |
| 2 | teff | Effective temperature [K] obtained from fit |
| 3 | teff_err | Error on effective temperature [K] obtained from fit |
| 4 | logg | Surface gravity [cm s-2] obtained from fit |
| 5 | logg_err | Error on surface gravity [cm s-2] obtained from fit |
| 6 | mass | Mass () obtained from fit |
| 7 | c_he | [C/He] abundance obtained from fit |
| 8 | c_he_err | Error on the [C/He] abundance obtained from fit |
Appendix B Details and validation of the DA, DB, and DBA fitting routines
The synthetic spectra used in the fitting procedure are generated by the latest version of the Koester (2010) code. The convection zones are modelled employing the 1D mixing-length (ML) approximation, with the ML2 parametrization and a fixed convective efficiency set to 0.8 and 1.25 for the DAs and DBs/D(AB)s, respectively (the canonical values in the treatment of H- and He-dominated photospheres, Tremblay et al., 2010; Bergeron et al., 2011).
The ranges and steps in effective temperature that cover each of the employed grids of synthetic spectra vary with chemical composition. Pure H models are used to fit the DA spectra, spanning K in steps of 250, 1000, 2000 and 5000 K up to 20 000, 30 000, 40 000 and 80 000 K, respectively. We employed pure He models for DBs, which covered K in steps of 250, 1000 and 2000 K up to 20 000, 30 000 and 40 000 K, since the He i transitions disappear from the spectrum below K and above 40 000 K He ii transitions are visible. The D(AB)s were fit with a H+He grid, equivalent to the pure He one in terms of since the same reasoning applies. The three grids spanned surface gravities dex in steps of 0.25 dex. To obtain estimates on the H content, the H+He grid covered dex in steps of 0.25 dex.
For both the spectroscopic and photometric analyses, we used the Markov-Chain Monte Carlo (MCMC) emcee package within python (Foreman-Mackey et al., 2013), following procedures established in previous work (Izquierdo et al., 2023) with some modifications that are explained in the following subsections. In all cases, chains were initialised with 30 walkers distributed randomly across the parameter space. Autocorrelation times were calculated and used to test for convergence (following the guidelines in the emcee documentation), to identify and discard a burn-in section, and to select 10000 independent samples from the ends of the chains.
B.1 Spectroscopic fitting
We performed spectroscopic analyses to the DESI coadded spectra and, when available, the SDSS archival spectroscopy, using up to three free parameters, namely , and . The fitting technique is analogous to that presented in Izquierdo et al. (2023) except for the normalisation procedure. In this work we do not normalise the spectra by the continuum. Instead, the useful spectral regions (Balmer and/or He i transitions) were split in smaller windows. Each of these windows sample, at least, an absorption line and its surroundings. The total flux of each window is integrated and each data point contained in the window is divided by this value. The same normalisation is applied to both observed and synthetic spectra. The windows span and Å for the DAs and DB/D(AB)s, respectively. These optimal widths were identified through various internal tests with independent studies.
A purely spectroscopic fit usually has two degenerate solutions that can differ significantly in , and are called the hot and cold solutions. This is due to the equivalent widths (EW) of the Balmer absorption lines reaching a maximum around 13 000 K (Rebassa-Mansergas et al., 2007); and because the EW of the He i transitions reach a plateau between 22 000 to 33 000 K (dependent on the , Bergeron et al., 2001). In order to overcome this degeneracy, we performed two fits to each white dwarf: one using only cool synthetic spectra, and a second fit employing hot synthetic spectra, with some overlap between the two subsets. For the DAs these translated into cool models up to 15 000 K and hot ones down to 13 000 K. For the DBs and D(AB)s the cool models reached to 27 000 K and the hot ones went down to 22 000 K.
Due to this degeneracy, the default emcee setup is unsuitable as it is tuned to problems with unimodal parameters. To ensure proper exploration of the posteriors, we used differential evolution proposals, so that walkers are able to move freely between widely separated modes (ter Braak & Vrugt, 2008; Nelson et al., 2013). Specifically, we used DEMove with stretch factor for 81 per cent of the moves, DESnookerMove () for 9 per cent, DEMove () for 9 per cent, and DESnookerMove () for 1 per cent.
To decide between the cold and hot solution for each H-dominated white dwarf, we followed the procedures presented in Rebassa-Mansergas et al. (2007) to evaluate the true value (the photometric result, since it is not subject to the EW degeneracy) against the theoretical value. We measured the EW of the Balmer lines in our models, and fit a polynomial in space to the peak values. That way, if the independently-fit photometric solution falls on the hot side of that polynomial, we select the hot spectroscopic fit, similarly for the cold side/fit.
For the DB/D(AB)s there is no such study performed, so we chose between the hot and cold solutions by proximity to the photometric result of each star.
B.2 Photometric fitting
We modelled photometric archival data from SDSS, Pan-STARRS, Gaia DR2 and EDR3 to test our spectroscopic results. These photometric analyses fitted for the , , and distance, , as free parameters and followed the same prescription as in Izquierdo et al. (2023) with a few variations. The model fluxes were scaled by the solid angle of the star , with the radius of the white dwarf derived from evolutionary models from Althaus et al. (2013). The photometric data were supplemented by Gaia parallaxes, but some of the white dwarfs have imprecise measurements. We therefore used a distance prior constructed following the popular prescription of Bailer-Jones et al. (2021) but generated only from sources with from the mock Gaia EDR3 catalogue (Rybizki et al., 2020). The synthetic spectra were reddened by the values from the G-Tomo 3D dust map (Fitzpatrick, 1999; Lallement et al., 2022; Vergely et al., 2022), queried at the inverse-parallax distance, and then integrated over the SDSS bandpasses.
B.3 Validation of DA fitting method
In order to test the accuracy of our spectroscopic and drawn from the DESI EDR spectra we compared them to different sets of data in Figs. 18 and 19. We use the same notation as in Figs. 18 and 19, where A and B refer to the two samples that are being compared in a respective panel.
For the comparison of our spectroscopic DESI results (A) with an internal photometric test we chose the SDSS and Pan-STARRS catalogues (B). In general, there is good agreement between the spectroscopic and photometric results, with a weighted mean and . In particular, we are obtaining higher from the DESI spectroscopic analysis than that derived from photometry, which is most significant above 15 000 K, which is also observed in other DA population studies that compare spectroscopic and photometric solutions (Tremblay et al., 2019; Genest-Beaulieu & Bergeron, 2019; O’Brien et al., 2023). This is also illustrated in the individual mean and standard deviations for the hotter objects (), compared to the objects with K of . The large discrepancies obtained for white dwarfs with K are likely related to the loss of sensitivity to that affects optical photometry as increases, becoming unreliable as it reaches the Rayleigh-Jeans regime.
We fit the archival SDSS spectra of the 963 DA white dwarfs (B) in the same way as the DESI EDR spectra (A) to validate our results. If we remove from the sample two low signal-to-noise ratio SDSS spectra (those corresponding to WDJ140151.43+032946.46 and WDJ140547.76-013454.94), which lead to meaningless values both compared to our DESI spectroscopic results and the literature values obtained from photometry, we find and . This is an excellent agreement given the low signal-to-noise ratio of several of the SDSS spectra compared to DESI. In fact, these figures are in line with the ones seen in literature for independent analyses performed on different spectroscopic data sets (Genest-Beaulieu & Bergeron, 2014).
Some of the SDSS stars that also feature in the DESI EDR sample were fit by Tremblay et al. (2019) and the comparison between their analysis (B) and ours (A), both with 3D corrections applied, yields and . The biggest discrepancies are found in the region where the hot and cold solutions are split and hence, systematic uncertainties due to the different approaches may arise.
The spectroscopic and photometric comparison performed in this work relies on the validity of both types of analyses. We have compared our DESI EDR spectroscopic results with two independent samples and thus we need to contrast too the goodness of our photometric fit. This comparison between our photometric fitting (A), and the photometric catalogue of Gentile Fusillo et al. (2021) (B), is displayed in the bottom panels of Figs. 18 and 19. We obtained and , which are both on the order of the uncertainties obtained when fitting independent photometric catalogues (see figs. 7 to 10 of GF19).
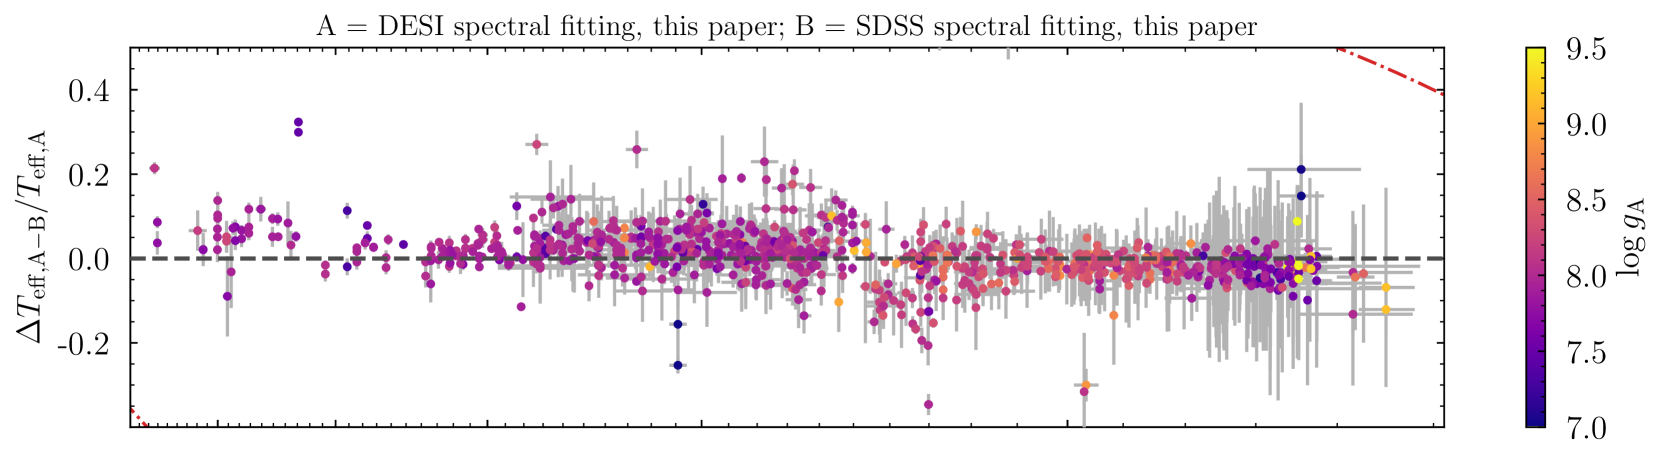
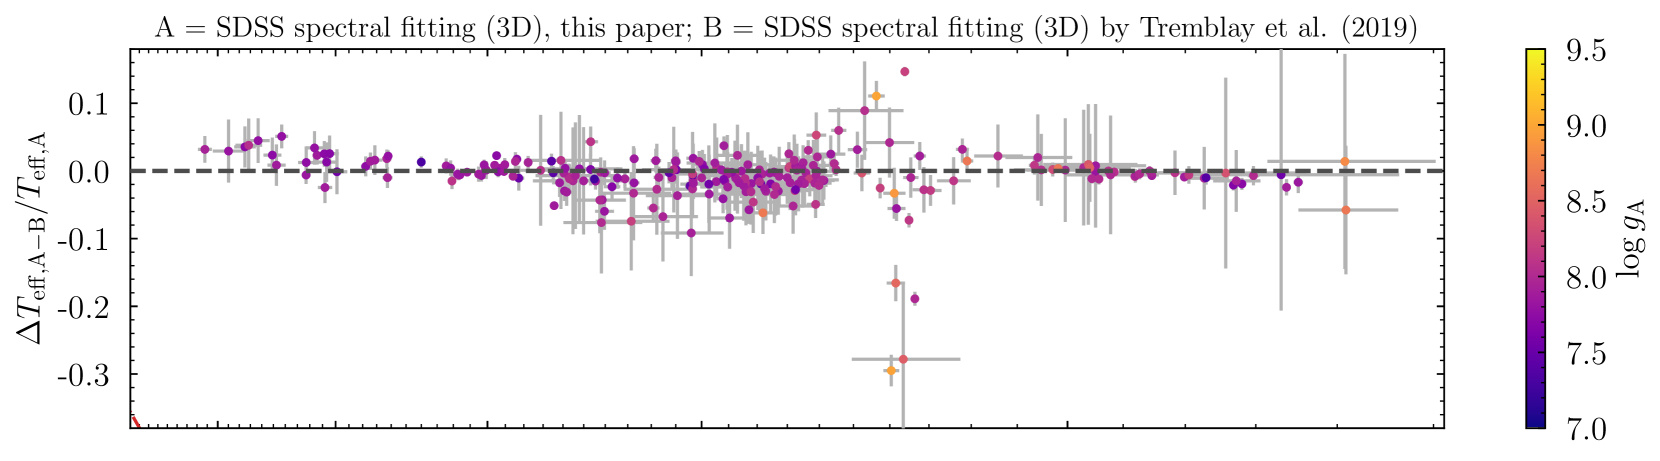
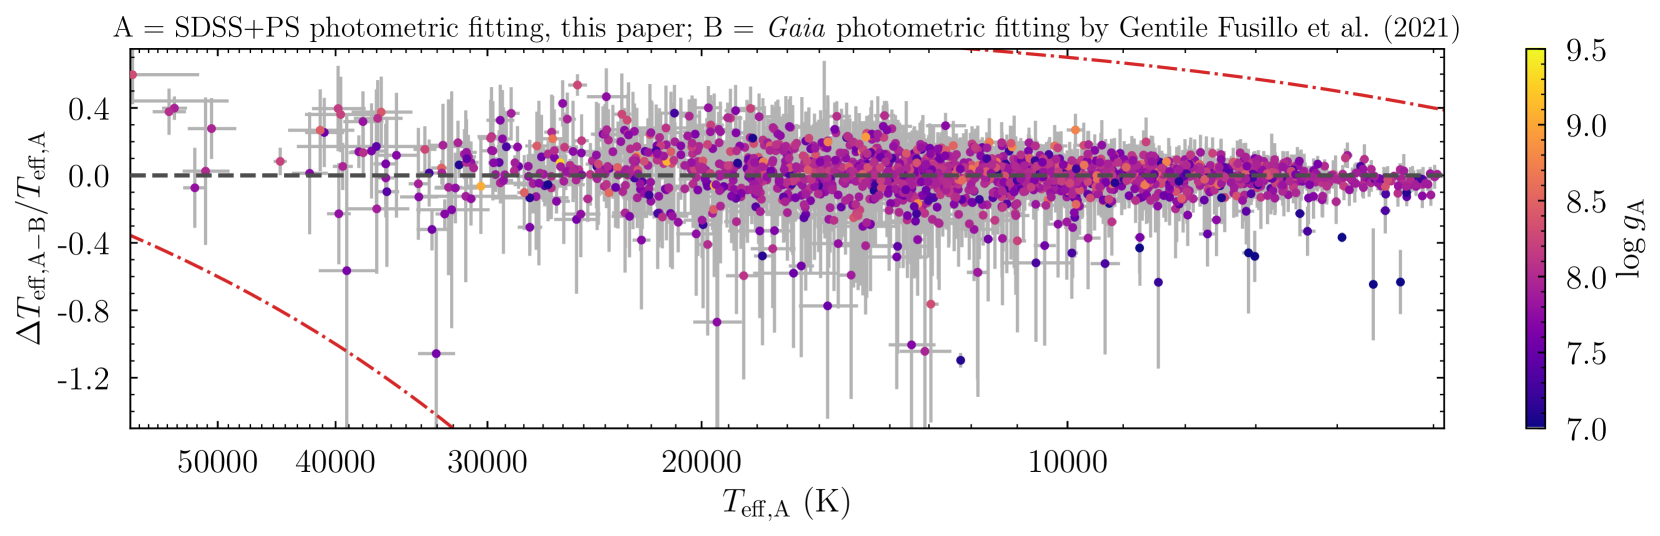
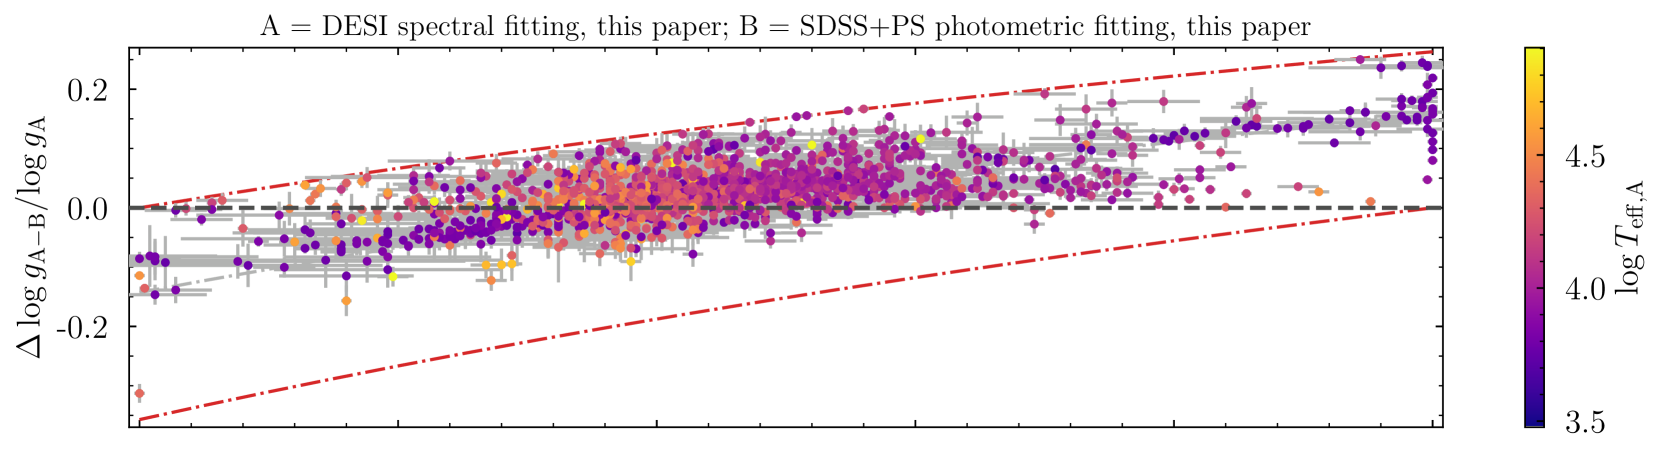
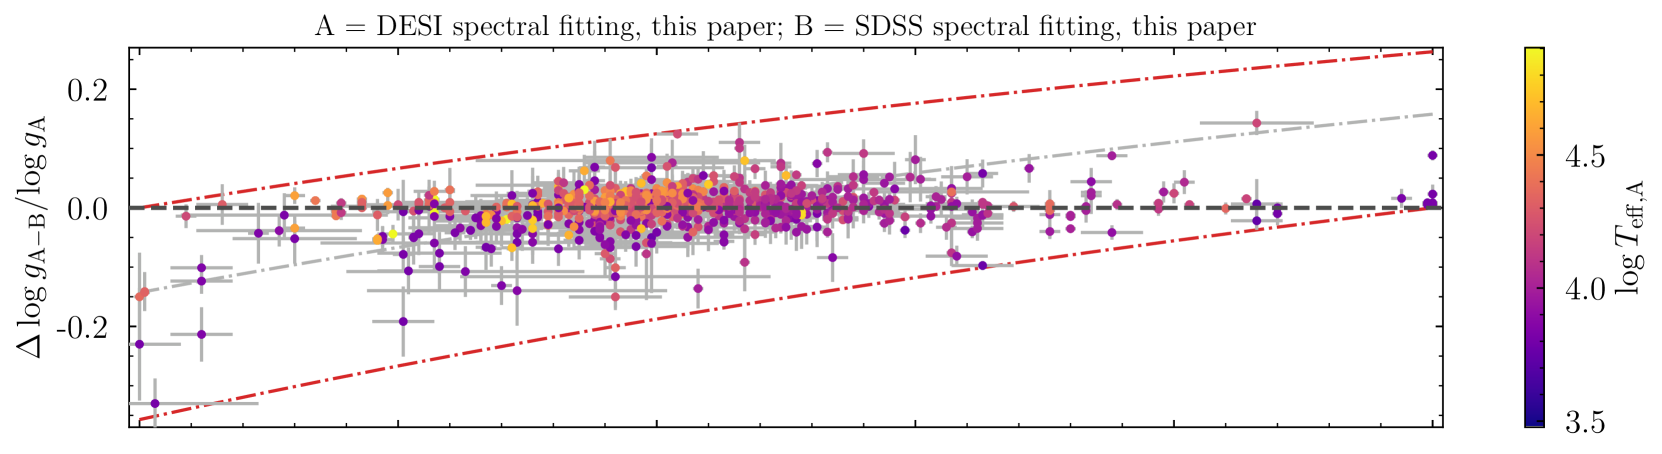
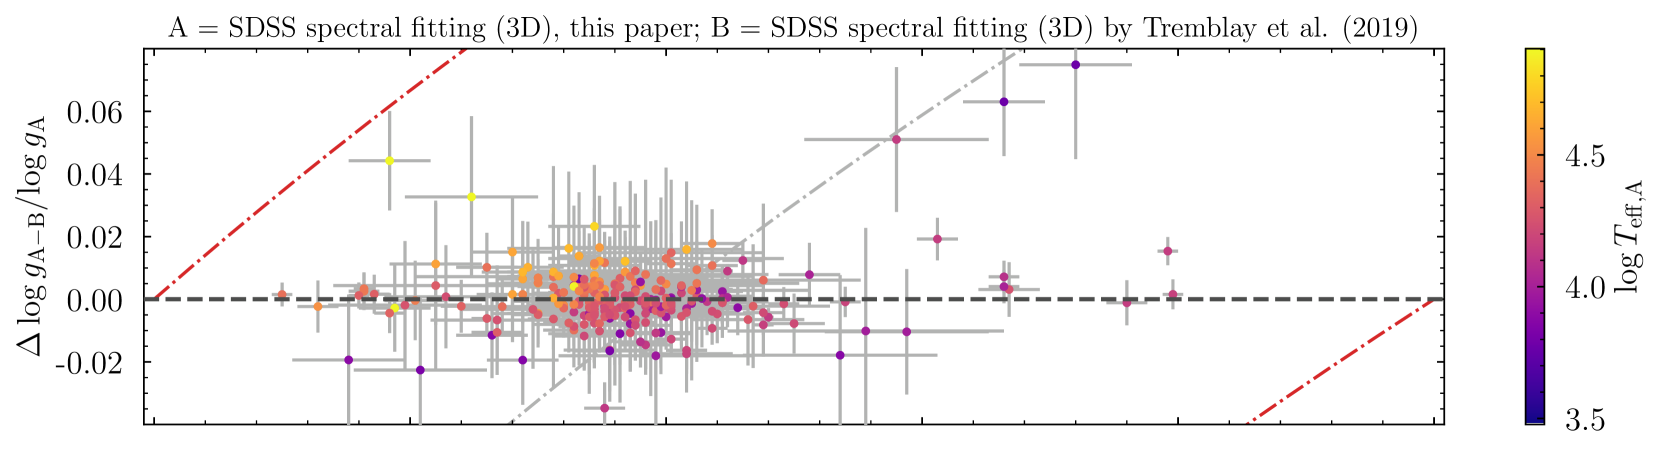
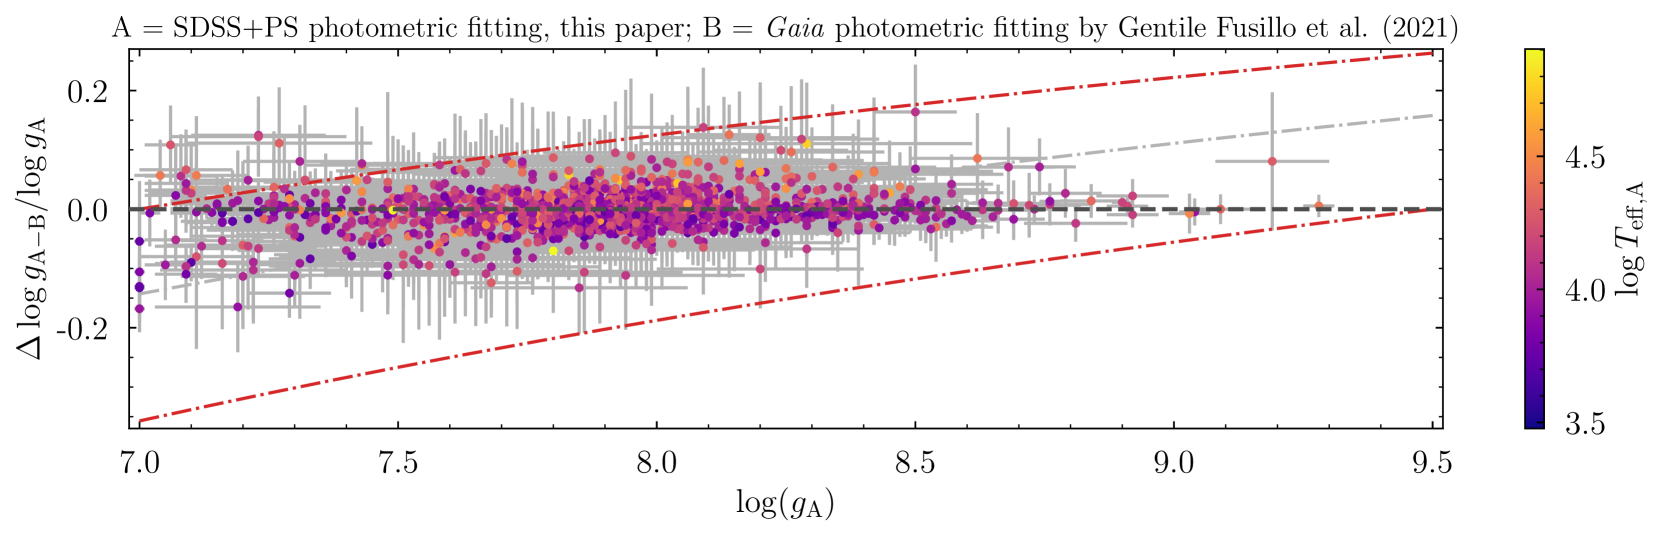
Our spectroscopic results drawn from the DESI EDR spectra for the DB white dwarfs are contrasted to independent analyses in Figs. 20 and 21. As for the DA white dwarfs, we use the notation of Figs. 20 and 21 when describing the comparison between two given samples.
The comparison between the spectroscopic (A) and photometric (B) techniques we developed (top panels in Figs. 20 and 21) highlights the non-physical increase in spectroscopic below K. Within the same regime, we have identified two objects whose photometrically derived fall outside our spectroscopic grid boundaries, as indicated by the red dot-dashed lines. This is because the He i transitions are only visible above K but the photometric solutions can cover cooler temperatures as well, including DC spectral types. Inspection of these two systems in more details revealed that the observed photometry did not appear consistent, and that the spectroscopic solutions are preferred. The differences between 20 000 and 30 000 K originate from the difficulty to obtain accurate photometric parameters in the instability strip of DBs (where they pulsate) and its coincidence with the maximum of the EW for He i lines, where the hot and cold technique is necessary but forces sharp boundaries in . In general, we find a weighted mean of and , similar to the values seen in the literature (Tremblay et al., 2019). If we calculate those values for the objects with photometric smaller than 15 000 K, we get and ; and for the hotter ones: and , which illustrates the bigger discrepancy in for hotter objects and the significant difference in for the cooler ones.
The refitted archival SDSS spectroscopy (B) of crossmatched DESI EDR (A) DB white dwarfs shows a good agreement, both in and , with and . The comparison between our SDSS+Pan-STARRS photometric (A) parameters and the Gaia-obtained values published by GF21 (B) results in and . Given the small number of D(AB) white dwarfs no population study was performed, but the derived spectroscopic and photometric parameters are available in the online catalog.
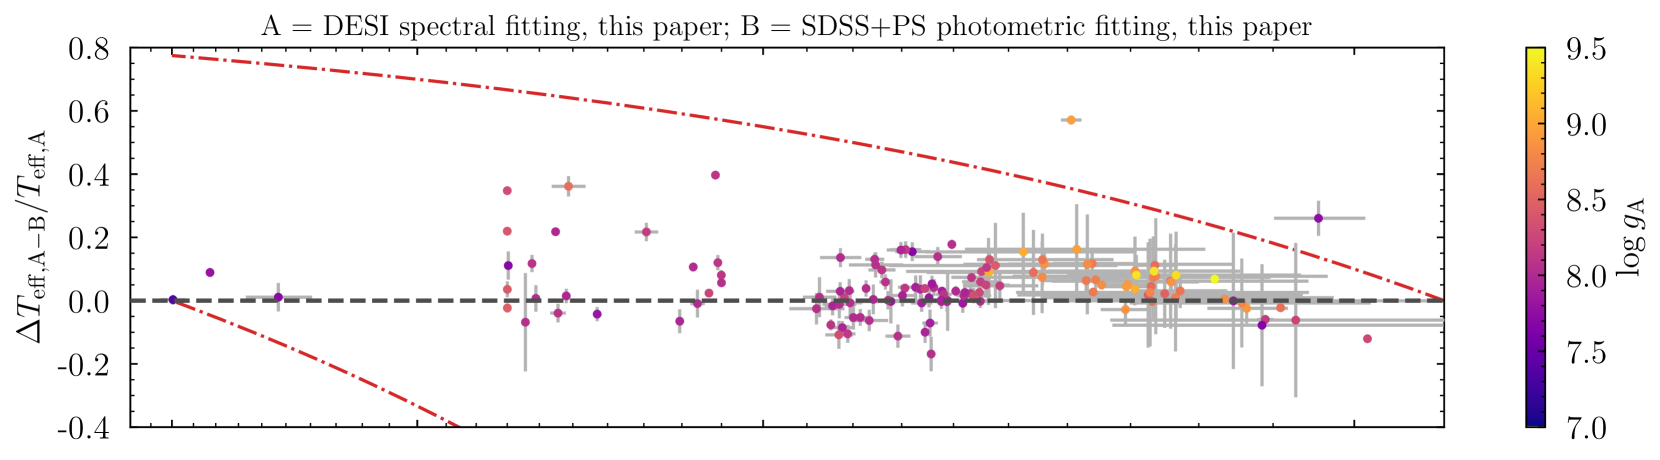
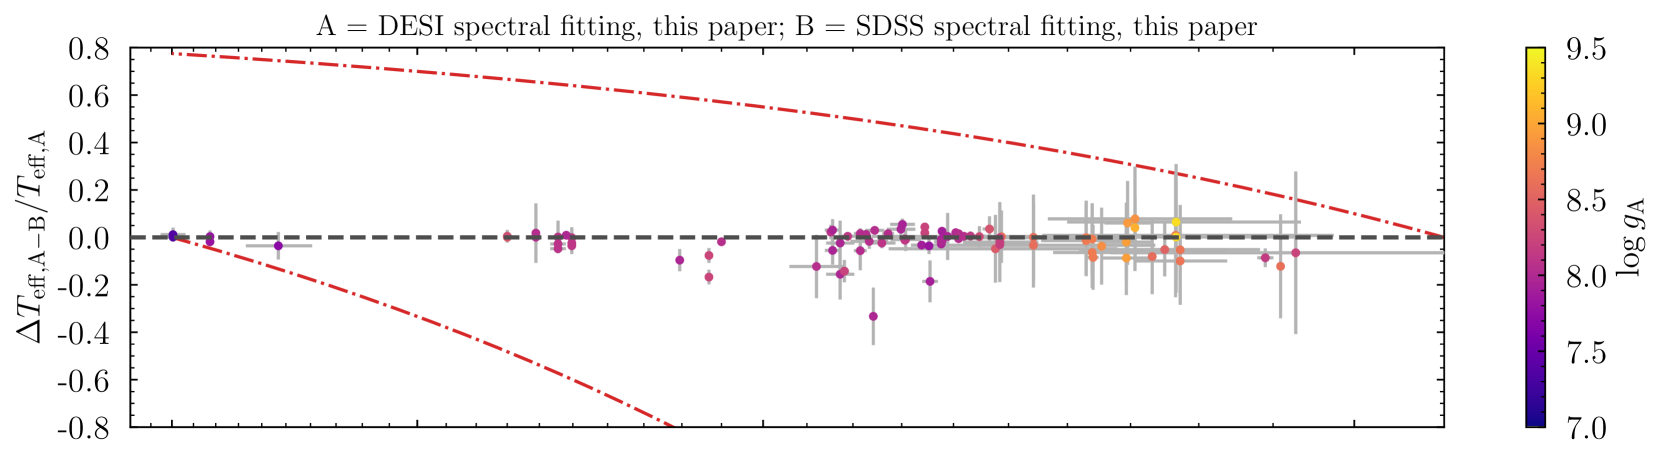
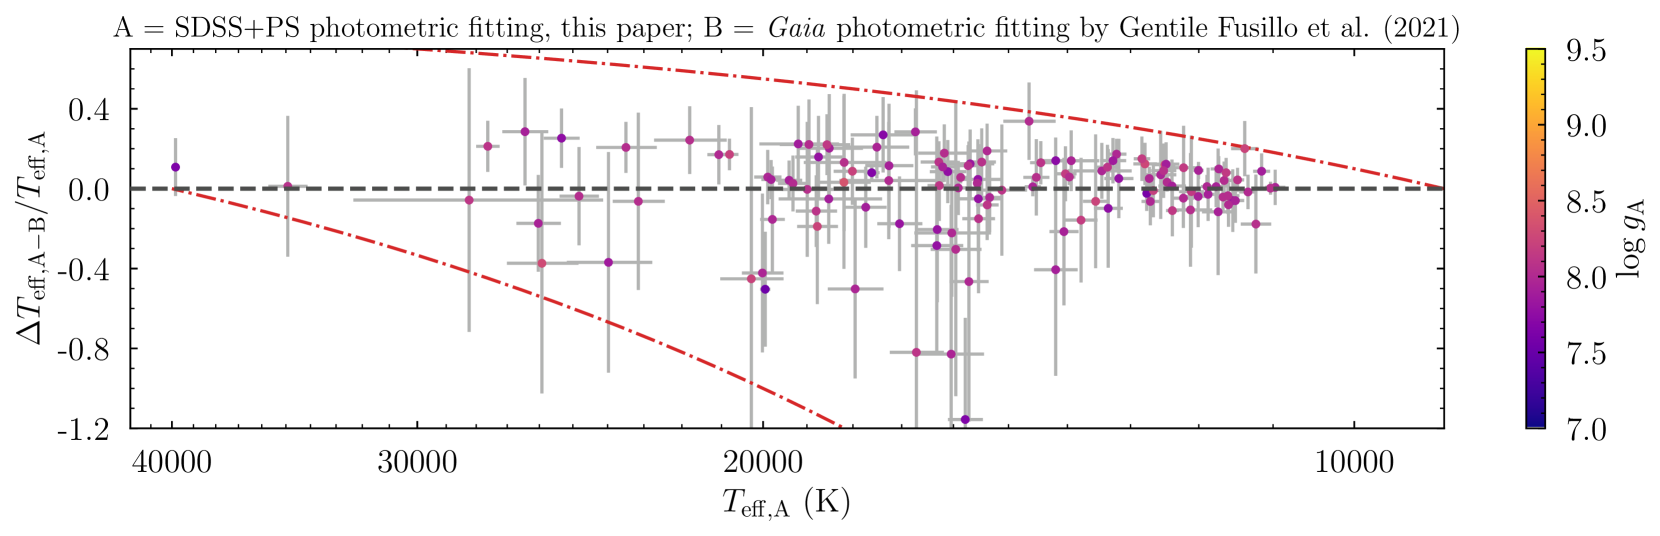
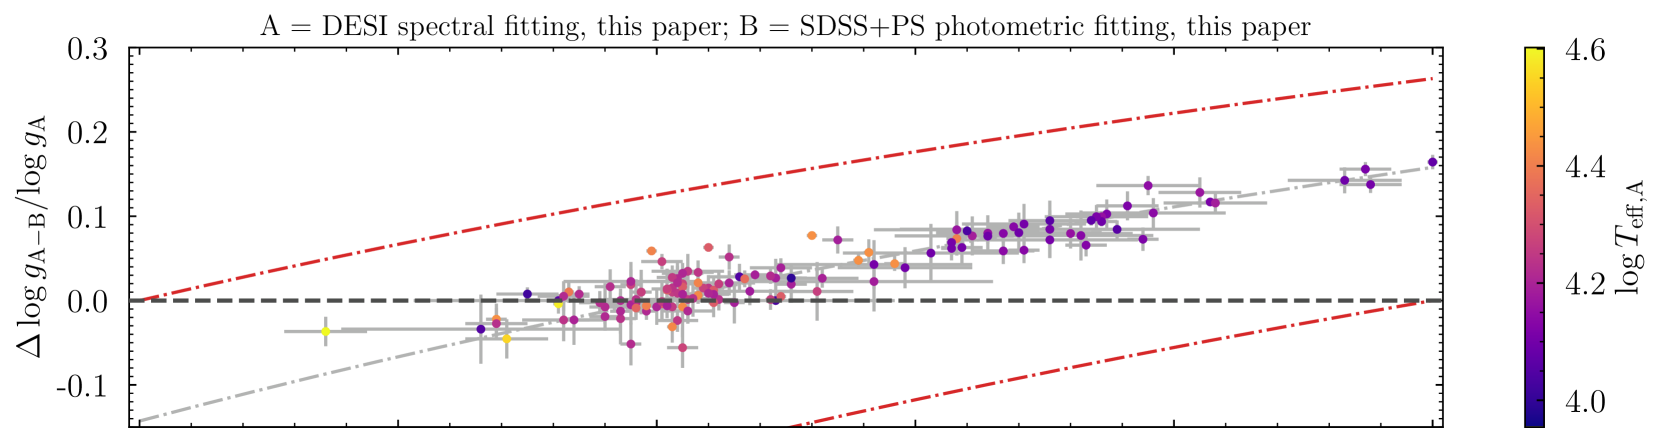
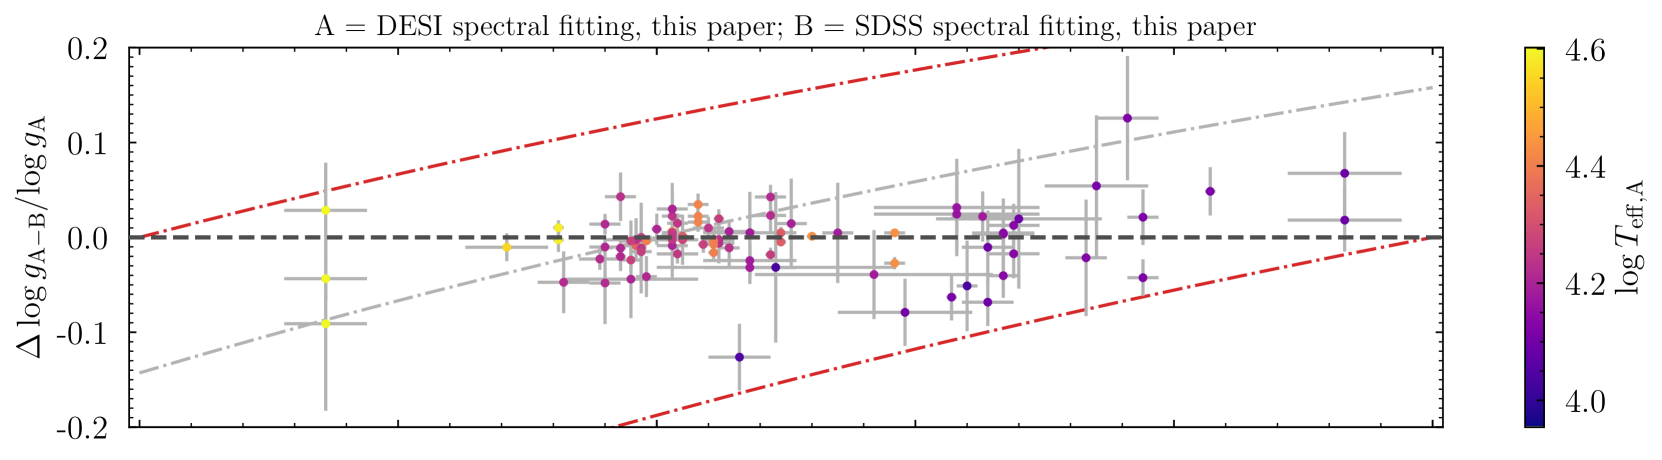
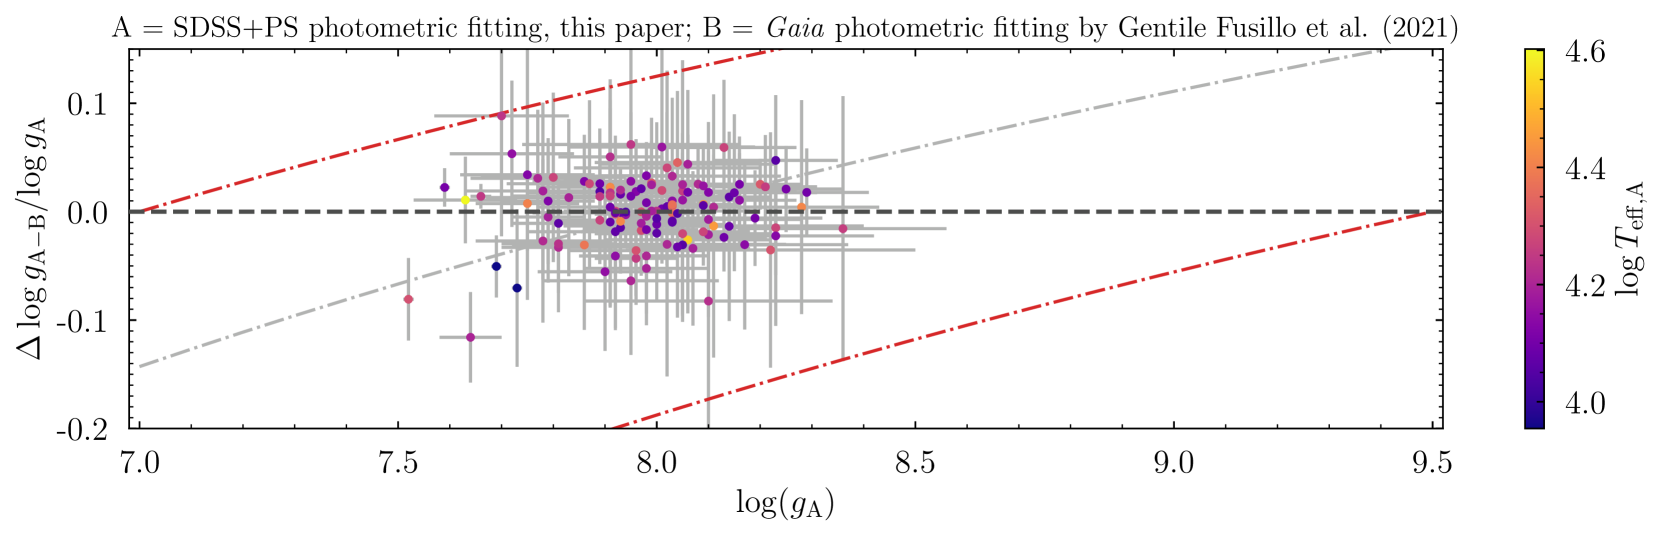
Appendix C Tables of DQ classifications
| Name | Class | (K) | Mass (M⊙ ) | [C/He] | References/Notes | |
| Newly confirmed carbon-rich systems | ||||||
| WDJ072922.34+451425.96 | DQ | 7182 (62) | 7.943 (0.155) | 0.541 | 6.261 (0.004) | |
| WDJ074019.13+314234.94 | DQ | 7385 (30) | 7.988 (0.078) | 0.568 | 6.087 (0.006) | |
| WDJ084131.55+332915.47 | DQ | 6736 (23) | 7.978 (0.087) | 0.561 | 6.741 (0.002) | |
| WDJ085049.40+315656.41 | DQ | 8859 (70) | 7.724 (0.222) | 0.427 | 4.682 (0.007) | |
| WDJ085601.74+321354.51 | DQ | 22611 (1379) | 9.286 (0.102) | 1.252 | 0.100 (0.100) | |
| WDJ091350.42+833906.33 | DQ | 8334 (119) | 7.926 (0.094) | 0.533 | 5.700 (0.015) | |
| WDJ092053.05+692645.36 | DQ+DA | 6250 (100) | 7.333 (0.100) | 0.262 | 6.500 (0.100) | |
| WDJ092702.32+660414.45 | DQ | 8427 (112) | 7.482 (0.154) | 0.324 | 5.600 (0.127) | |
| WDJ093332.74+690523.34 | DQ | 9501 (135) | 8.119 (0.133) | 0.647 | 4.410 (0.006) | |
| WDJ101453.59+411416.94 | DZQ | 8438 (41) | 7.858 (0.058) | 0.498 | 5.200 (0.150) | [Ca/He] = 11.20 (0.15) |
| WDJ104933.02+831754.88 | DQ | 9543 (117) | 8.414 (0.072) | 0.835 | 4.075 (0.005) | |
| WDJ112513.32+094929.68 | DQH | 10861 (200) | 8.383 (0.100) | 0.818 | 0.158 (0.100) | |
| WDJ113918.83+560127.03 | DQ | 6030 (131) | 8.152 (0.256) | 0.664 | 7.327 (0.012) | |
| WDJ115550.78+004602.30 | DQ | 6263 (100) | 7.250 (0.100) | 0.236 | 6.839 (0.100) | |
| WDJ115627.40+274057.00 | DQ | 8500 (125) | 7.919 (0.100) | 0.529 | 4.900 (0.100) | |
| WDJ120827.22–001019.67 | DQ | 8149 (44) | 7.837 (0.112) | 0.484 | 5.300 (0.010) | |
| WDJ121501.67+010057.72 | DQ | 5400 (100) | 8.115 (0.100) | 0.639 | 7.700 (0.100) | |
| WDJ123426.71+534526.83 | DQ | 7011 (47) | 7.847 (0.078) | 0.487 | 6.418 (0.006) | |
| WDJ124716.94+571031.84 | DQ | 7991 (99) | 8.082 (0.099) | 0.613 | 5.500 (0.024) | |
| WDJ125047.16+265145.69 | DQ | 5248 (100) | 8.275 (0.100) | 0.740 | 6.481 (0.100) | |
| WDJ125207.43+745756.93 | DQ | 4750 (100) | 8.171 (0.100) | 0.673 | 7.400 (0.100) | |
| WDJ130431.69+252847.56 | DQ | 6767 (43) | 8.099 (0.072) | 0.627 | 6.964 (0.007) | |
| WDJ130830.91+062921.60 | DQA | 14137 (400) | 8.993 (0.200) | 1.158 | 1.168 (0.100) | |
| WDJ133614.62+312322.83 | DQ | 7183 (100) | 7.780 (0.100) | 0.452 | 5.163 (0.100) | |
| WDJ135004.41+701129.23 | DQ | 8088 (65) | 7.989 (0.120) | 0.569 | 5.186 (0.008) | |
| WDJ141205.22–013214.32 | DQ | 6827 (41) | 7.885 (0.066) | 0.507 | 6.248 (0.007) | |
| WDJ141844.14+512729.49 | DQ | 7934 (50) | 7.913 (0.115) | 0.525 | 5.473 (0.003) | |
| WDJ142018.91+324921.12 | DQZ | 8370 (36) | 7.892 (0.051) | 0.551 | 5.400 (0.150) | [Ca/He] = 11.50 (0.15) |
| WDJ143047.56+023259.07 | DQ | 7565 (59) | 8.012 (0.052) | 0.566 | 6.140 (0.006) | |
| WDJ143534.79+154813.46 | DQ | 6632 (45) | 7.870 (0.108) | 0.499 | 6.968 (0.006) | |
| WDJ145256.54+762027.63 | DQ | 6995 (44) | 7.796 (0.038) | 0.460 | 6.500 (0.009) | |
| WDJ151203.98+695231.94 | DQ | 6300 (150) | 7.904 (0.100) | 0.517 | 7.300 (0.100) | |
| WDJ153904.40+335231.80 | DQ | 7962 (86) | 7.671 (0.160) | 0.402 | 5.500 (0.016) | |
| WDJ160053.14+424017.74 | DQ | 7585 (71) | 7.825 (0.135) | 0.477 | 5.623 (0.005) | |
| WDJ160244.40+435558.42 | DQ | 9725 (121) | 8.306 (0.055) | 0.765 | 4.152 (0.005) | |
| WDJ160347.86+430810.38 | DQ | 13050 (200) | 8.786 (0.100) | 1.070 | 1.632 (0.100) | |
| WDJ160411.92+434359.04 | DQ | 8947 (37) | 7.925 (0.034) | 0.534 | 4.900 (0.005) | |
| WDJ160424.17+423816.28 | DQ | 5648 (100) | 7.802 (0.100) | 0.459 | 7.151 (0.100) | |
| WDJ160755.84+440726.68 | DQ | 5050 (100) | 7.657 (0.100) | 0.385 | 6.027 (0.100) | |
| WDJ161348.88+195024.46 | DQ | 7568 (51) | 7.811 (0.145) | 0.469 | 5.953 (0.005) | |
| WDJ161659.09+534228.01 | DQ | 8217 (63) | 7.935 (0.066) | 0.538 | 5.446 (0.002) | |
| WDJ164417.61+234720.41 | DQ | 7889 (71) | 7.639 (0.133) | 0.387 | 5.796 (0.007) | |
| WDJ171604.64+555548.08 | DQ | 8901 (74) | 8.004 (0.076) | 0.569 | 4.766 (0.005) | |
| Known carbon-rich systems | ||||||
| WDJ084151.18+324821.49 | DQ | 8362 (81) | 7.860 (0.143) | 0.496 | 5.332 (0.007) | Koester & Knist (2006) |
| WDJ085914.71+325712.16 | DQ | 10300 (100) | 8.589 (0.100) | 0.951 | 2.300 (0.100) | Liebert (1977) |
| WDJ110140.34+521807.26 | DQ | 8476 (52) | 7.866 (0.075) | 0.500 | 5.024 (0.003) | Kepler et al. (2016); Coutu et al. (2019) |
| WDJ114048.36+554251.29 | DQ | 7713 (45) | 7.946 (0.076) | 0.544 | 5.604 (0.009) | Vincent et al. (2023) |
| WDJ114851.69–012612.69 | DQ | 10327 (100) | 8.573 (0.100) | 0.941 | 2.300 (0.100) | Berg et al. (1992) |
| WDJ115305.54+005646.15 | DQ | 19211 (400) | 9.312 (0.100) | 1.256 | > 0.000 | Liebert et al. (2003) |
| WDJ120936.52+535525.76 | DQ | 11666 (150) | 8.426 (0.100) | 0.846 | 2.400 (0.100) | Eisenstein et al. (2006) |
| WDJ121211.02+545222.88 | DQ | 8246 (23) | 7.951 (0.015) | 0.547 | 5.297 (0.003) | Eisenstein et al. (2006); Kleinman et al. (2013) |
| WDJ135810.43+055238.08 | DQ | 8282 (40) | 7.956 (0.068) | 0.550 | 5.164 (0.005) | Kepler et al. (2015) |
| WDJ142032.64+531624.19 | DQ | 8487 (45) | 7.920 (0.052) | 0.530 | 5.367 (0.005) | Koester & Kepler (2019) |
| WDJ154248.66+432902.53 | DQ | 10750 (100) | 8.618 (0.100) | 0.970 | 2.500 (0.100) | Kleinman et al. (2013) |
| WDJ163837.83+360620.16 | DQ | 6963 (28) | 8.004 (0.030) | 0.565 | 6.678 (0.006) | Kleinman et al. (2013) |
| A poor fit was obtained. | ||||||
Appendix D Tables of metal-line classifications
| Name | Class | Reference for DxZ candidacy |
|---|---|---|
| Newly confirmed metal-line systems | ||
| WD J013105.68+314755.63 | DAZ | |
| WD J014145.83+311049.96 | DAZ | |
| WD J014211.57+314603.62 | DBZ | |
| WD J020559.33–042230.18 | DZB | |
| WD J054545.32–190245.54 | DAZ | |
| WD J071959.42+402122.13 | DBZ | Sion et al. (1988) |
| WD J072234.27+425655.60 | DZ | |
| WD J073321.79+321614.15 | DAZ | |
| WD J074351.32+385615.78 | DBZ | |
| WD J081556.53+345224.37 | DAZ | |
| WD J081634.98+342638.54 | DAZ | |
| WD J081918.86+334837.64 | DAZ | |
| WD J082845.45+334600.34 | DAZ | |
| WD J083213.85+010907.60 | DBZ | |
| WD J083254.36+313904.84 | DAZ | |
| WD J083834.87–064942.24 | DBAZ | |
| WD J085748.04+332708.66 | DBZ | |
| WD J085912.92–005842.86 | DZA | |
| WD J090016.86+331819.03 | DAZ | |
| WD J091725.71+325837.90 | DBZ | |
| WD J092251.70+315028.36 | DZ | |
| WD J092301.12+315828.32 | DZAB | |
| WD J093106.58+684430.96 | DBZA | |
| WD J093640.77+314335.15 | DBZA | |
| WD J094111.57+705827.74 | DZ | |
| WD J095936.19+034949.30 | DAZ | |
| WD J101453.59+411416.94 | DZQ | |
| WD J102012.80+315447.24 | DAZ | Kepler et al. (2016) |
| WD J102447.72+332816.61 | DAZ | |
| WD J103637.16+070948.00 | DAZ | |
| WD J103812.22+825135.62 | DAZ | |
| WD J104534.75–272726.47 | DAZ | |
| WD J104709.52+712557.15 | DZ | |
| WD J105627.17+485610.66 | DAZ | |
| WD J105751.09+320839.62 | DZ | |
| WD J105805.77+711242.56 | DZ | |
| WD J105846.34+325113.01 | DAZ | |
| WD J110145.42+313555.64 | DAZ | |
| WD J110511.98+320003.98 | DAZ | |
| WD J110835.57+522526.91 | DZB | |
| WD J110858.03+513410.39 | DBZ | |
| WD J111322.63+700635.27 | DZ | |
| WD J112009.89+085641.99 | DBZ | |
| WD J112638.23+720116.67 | DZ | |
| WD J112807.93+530625.77 | DZ | |
| WD J113233.24+723746.29 | DAZ | |
| WD J113305.51+790621.07 | DAZ | |
| WD J113320.85+505909.85 | DAZ | |
| WD J113706.95+494337.11 | DZB | |
| WD J113835.19+553922.24 | DZ | |
| WD J114041.55+511835.62 a | DAZ | Kepler et al. (2016) |
| Name | Class | Reference for DxZ candidacy |
|---|---|---|
| Newly confirmed metal-line systems | ||
| WD J114201.76+562949.00 | DAZ | |
| WD J115040.63+552956.66 | DZ | |
| WD J115802.16+010537.12 | DZ | |
| WD J115803.66–011257.60 | DZA | |
| WD J115908.60+525653.55 | DZ | |
| WD J120538.84+524626.80 | DAZ | |
| WD J120924.36+740639.27 | DZ | |
| WD J121104.25+544857.06 | DZ | |
| WD J121219.03–011535.95 | DBZA | |
| WD J121354.40+531140.78 | DABZ | |
| WD J121653.30+745525.29 a | DAZ | Rebassa-Mansergas et al. (2019) |
| WD J121710.48+321358.74 | DAZ | |
| WD J122102.43+554835.08 | DZ | |
| WD J122147.27+330426.63 | DAZ | |
| WD J122239.60+305149.93 | DAZ | |
| WD J122704.88+794236.33 | DAZ | |
| WD J123026.82+800506.82 | DZ | |
| WD J123352.65+544610.28 | DAZ | |
| WD J123519.07+575949.54 | DAZ | |
| WD J123544.36+623414.43 | DBZ | |
| WD J123711.25+545128.03 | DZ | |
| WD J123949.74+740823.33 | DZ | |
| WD J124325.87+605227.97 | DZ | |
| WD J124440.84+582304.08 | DBZ | |
| WD J125250.17+735216.84 | DZA | |
| WD J125427.39+735248.83 | DAZ | |
| WD J125955.25+240542.09 | DBZ | Vincent et al. (2023) |
| WD J130130.51+262150.50 | DZ | |
| WD J130153.16+233106.57 | DBZ | |
| WD J130931.30+162204.03 | DAZ | |
| WD J133136.60+323835.96 | DZ | |
| WD J141517.07+512345.35 | DAZ | |
| WD J142018.91+324921.12 | DQZ | |
| WD J142258.14–004853.17 | DZ | |
| WD J143013.43+040018.09 | DAZ | |
| WD J143304.74+330703.81 | DZ | |
| WD J143555.99+135928.34 | DZ | |
| WD J143651.40–004709.85 | DAZ | |
| WD J143700.89+330917.72 | DZ | |
| WD J143802.77+144137.61 | DBZ | |
| WD J145242.22+753939.06 | DBZ | |
| WD J150003.73+331948.23 | DZ | |
| WD J150241.98+732528.73 | DBZ | |
| WD J150831.23+330239.24 | DAZ | |
| WD J151259.89+745158.02 | DAZ | |
| WD J151521.50+155213.09 | DAZ | |
| WD J153954.92+335444.49 | DBZ | |
| WD J154155.46+745259.62 | DZ | |
| WD J154252.76+445829.02 | DZ | |
| WD J154310.62+314355.41 | DZ | |
| WD J155050.49+744001.33 | DBZA | |
| a Identified as a candidate for hosting a dusty disc. | ||
| Name | Class | Reference for DxZ candidacy |
| Newly confirmed metal-line systems | ||
| WD J155300.64+692620.03 | DZA | |
| WD J161316.63+552125.97 | DAZ | |
| WD J161502.83+544603.38 | DBZ | |
| WD J162344.53+744313.12 | DAZ | |
| WD J163054.20+434009.43 | DBZA | |
| WD J163405.62+314336.23 | DAZ | |
| WD J164344.36+343305.46 | DBAZ | |
| WD J165236.79+353437.58 | DAZ | |
| WD J171723.85+574608.00 | DAZ | |
| WD J172623.05+793759.60 | DZ | |
| WD J175121.52+802758.90 | DZ | |
| WD J175314.93+653107.61 | DZ | |
| WD J175358.38+605738.86 | DAZ | |
| WD J175445.49+610836.20 | DBZA | |
| WD J175805.73+645520.41 | DAZ | |
| WD J180322.69+664744.38 | DAZ | |
| WD J180555.51+621534.72 | DBZA | |
| WD J180804.35+645950.43 | DAZ | |
| WD J181236.47+802423.37 | DAZ | |
| Known metal-line systems | ||
| WD J014125.42+225734.98 | DZA | Kilic et al. (2020) |
| WD J080234.18+405015.21 | DBAZ | Kepler et al. (2015) |
| WD J082611.70+325000.40 | DAZ | Kilic et al. (2020) |
| WD J082720.59+330438.09 | DZ | Eisenstein et al. (2006) |
| WD J083935.89+215844.56 | DZ | Kleinman et al. (2013) |
| WD J085035.17+320804.29 | DZAB | Kong et al. (2019) |
| WD J094024.06+642202.02 | DZ | Kleinman et al. (2013) |
| WD J095406.45+334716.86 | DZ | Kleinman et al. (2013) |
| WD J100237.36+031325.60 | DZ | Eisenstein et al. (2006) |
| WD J110513.63+500652.49 | DZAP | Hollands et al. (2017) |
| WD J112035.20+525754.44 | DZB | Gentile Fusillo et al. (2015); Guo et al. (2015) |
| WD J112617.18+524155.12 | DZ | Eisenstein et al. (2006) |
| WD J114054.89+532827.33 | DZA | Dufour et al. (2007a) |
| WD J114830.09+570840.98 | DZ | Kepler et al. (2016) |
| WD J115926.98+290105.85 | DZ | Vincent et al. (2023) |
| WD J121129.27+572417.24 | DAZ | Zuckerman & Reid (1998) |
| WD J121218.70+540938.68 | DZ | Eisenstein et al. (2006) |
| WD J121837.12+002303.87 | DZ | Kleinman et al. (2004); Eisenstein et al. (2006) |
| WD J125922.03+311215.59 | DZ | Hollands et al. (2017) |
| WD J125946.66+273404.14 | DAZ | Zuckerman et al. (2003) |
| WD J133305.34+325400.11 | DBZ | Kleinman et al. (2013); Coutu et al. (2019) |
| WD J135632.60+241606.27 | DZ | Koester et al. (2011) |
| WD J141426.55–011354.63 | DZ | Harris et al. (2003) |
| WD J141518.65+315551.05 | DZAB | Gentile Fusillo et al. (2019) |
| WD J142516.43–005048.83 | DZ | Harris et al. (2003) |
| WD J142736.17+534828.00 | DBAZ | Kenyon et al. (1988) |
| WD J143235.82+035423.22 | DZAB | Eisenstein et al. (2006) |
| WD J154907.13+442258.06 | DZ | Kepler et al. (2015) |
| WD J155847.91+150735.08 | DZ | Kleinman et al. (2013) |
| WD J160731.21+444248.06 | DBZ | Kepler et al. (2015) |
| WD J162646.91+313628.00 | DZBA | Kepler et al. (2015) |
Appendix E Tables of magnetic classifications
| Name | Class | (MG) | References |
| Newly identified magnetic systems | |||
| WD J022723.13–055305.72 | DAH | 20.5 (0.4) | |
| WD J042613.14–034701.99 | DAH | 250 - 1000 | |
| WD J070253.76+553733.64 | DAH | 6.89 (0.07) / 15.5 (0.2) | |
| WD J082302.41+334534.27 | DAH | 1.344 (0.008) | |
| WD J084546.99+194542.45 | DAH | 7.01 (0.05) | |
| WD J085045.22+110553.50 | DAH | 542 (1) | |
| WD J085753.69+331453.52 | DAH | 22.9 (0.2) | |
| WD J092625.68+710020.09 | DAH | 39.3 (0.8) | |
| WD J100055.37+690330.42 | DAH | 290 (9) | |
| WD J102146.26+310551.99 | DAH | 12.2 (0.2) | |
| WD J110146.25+323101.96 | DAH | 1.89 (0.06) | |
| WD J110344.93+510048.61 | DAH | 1.822 (0.008) | |
| WD J110759.25+812213.63 | DAH | 18.3 (0.2) | |
| WD J111940.70+722847.58 | DAH | 10.90 (0.02) | |
| WD J112513.32+094929.68 | DQH | 2.19 (0.01) | |
| WD J121945.85+543402.99 | DAH | 3.57 (0.07) | |
| WD J125820.50+281357.33 | DAH | 2.57 (0.02) | |
| WD J125954.37+252756.09 | DAH | 2.09 (0.02) | |
| WD J130522.83+244537.01 | DAH | 13.5 (0.3) | |
| WD J131051.11+171049.60 | DAH | 0.81 (0.01) | |
| WD J133158.03+312721.23 | DAH | 3.05 (0.06) | |
| WD J135820.93+045021.46 | DAH | 2.30 (0.01) | |
| WD J140009.88+042015.44 | DAH | 2.90 (0.03) | |
| WD J140100.50+043720.71 | DAH | 2.4 (0.1) | |
| WD J140916.34–000011.32 | DAHe | 23.5 | Manser et al. (2023) |
| WD J142645.38+020101.87 | DAH | 1.83 (0.02) | |
| WD J143122.24+353420.07 | DAH | 12.60 (0.02) | |
| WD J143550.43+140519.59 | DAH | 4.30 (0.03) | |
| WD J143755.33+141345.64 | DAH | 660 (50) | |
| WD J143804.42–005220.49 | DAH | 15.0 (0.1) | |
| WD J160604.06+550924.93 | DAH | 2.214 (0.007) | |
| WD J161053.06+535518.49 | DAH | 0.585 (0.004) | |
| WD J161634.36+541011.51 | DAHe | 6.5 (0.1) | Manser et al. (2023) |
| WD J162713.92+313559.18 | DAH | 1.394 (0.007) | |
| WD J165631.22+760850.65 | DAH | 73.8 (0.5) | |
| WD J175419.17+660224.85 | DAH | 12.9 (0.2) | |
| WD J180147.11+652136.43 | DAH | 2.71 (0.02) | |
| WD J180813.60+652321.24 | DAH | 24.1 (0.4) | |
| WD J181222.70+624810.54 | DAH | 14.0 (0.2) | |
| Previously known magnetic systems | |||
| WD J023420.63+264801.74 | DAH | 27.2 (0.3) | Külebi et al. (2009) |
| WD J073615.92+403335.18 | DAH | 2.12 (0.02) | Kepler et al. (2015); Vincent et al. (2023) |
| WD J111812.68+095241.52 | DAH | 2.71 (0.03) | Vanlandingham et al. (2005) |
| WD J112328.50+095619.35 | DAH | 0.966 (0.007) | Külebi et al. (2009) |
| WD J112926.23+493931.89 | DAH | 3.00 (0.02) | Vanlandingham et al. (2005) |
| WD J113357.66+515204.69 | DAH | 3.04 (0.07) / 4.4 (0.1) | Schmidt et al. (2003) |
| WD J115418.15+011711.55 | DAH | 18.4 (0.2) | Schmidt et al. (2003) |
| WD J121209.31+013627.77 | DAH | 7.21 (0.02) | Schmidt et al. (2003, 2005) |
| WD J121548.73–005637.56 | DAH | 1.653 (0.005) | Kilic et al. (2020) |
| WD J131426.39+173228.40 | DAH | 0.982 (0.008) | Kepler et al. (2013) |
| WD J141813.22+312340.03 | DAH | 1.23 (0.02) | Kepler et al. (2013) |
| WD J160357.94+140929.77 | DAH | 25.4 (0.3) | Kepler et al. (2013) |
| WD J164703.24+370910.23 | DAH | 2.7 (0.9) | Vanlandingham et al. (2005) |
| WD J165029.91+341125.53 | DAH | 2.29 (0.02) | Vanlandingham et al. (2005) |
| WD J165203.68+352815.81 | DAH | 6.29 (0.05) | Schmidt et al. (2003) |
| WD J165249.09+333444.98 | DAH | 3.00 (0.02) | Külebi et al. (2009) |
| WD J174807.99+705235.92 | DAH | 203 (3) | Angel et al. (1974a) |
| We give a range of field strengths as only a single stationary component at 8600 Å is observed. | |||
| Evidence of an offset-dipole field structure with five Zeeman components visible and we give field strengths for both poles separated by ‘/’. | |||
| Field strength reproduced from Manser et al. (2023). | |||
| This white dwarf is part of the binary system, V* V379 Vir, with the secondary likely being a brown dwarf. | |||
Appendix F Tables of CVs classifications
| Name | Alternative name | Simbad Type | References | ||
| Newly confirmed CVs | |||||
| J124413.48+593610.24 | Gaia 16adi | CV candidate | Hodgkin et al. (2021) | ||
| J142833.44+003100.45 | CV candidate | Croom et al. (2004) | |||
| J143435.39+334049.98 | WD candidate | ||||
| J161927.83+423039.61 | Star | ||||
| J181130.89+795608.36 | WD candidate | ||||
| Known CVs | |||||
| J022319.73–052002.02 | 2XLSSd J022319.8–052002 | CV | Kepler et al. (2016); Gentile Fusillo et al. (2019) | ||
| J090350.73+330036.11 | CRTS J090350.7+330036 | CV | Szkody et al. (2005) | ||
| J125510.56+264226.59 | V* MT Com | CV | Watson et al. (1996) | ||
| J131223.48+173659.21 | 2XMMp J131223.4+173659 | CV | Vogel et al. (2008) | ||
| J150241.00+333424.00 | V* NZ Boo | CV | Szkody et al. (2006) | ||
| J151333.10+703721.98 | Gaia 17bcx | CV | Hodgkin et al. (2021); Keller et al. (2022) | ||
| J162608.15+332827.83 | CV | Szkody et al. (2004) |
Appendix G DESI EDR white dwarf systems not in the Gaia EDR3 white dwarf catalogue