The X-ray enhancements of radio-loud quasars at high redshift: New results at
Abstract
Highly radio-loud quasars (HRLQs; ) at show apparent enhanced X-ray emission compared to matched HRLQs at lower redshifts, perhaps due to a redshift-dependent fractional contribution to the X-ray luminosity from inverse-Compton scattering of cosmic microwave background photons (IC/CMB). Using new Chandra observations and archival X-ray data, we investigate this phenomenon with an optically flux-limited sample of 41 HRLQs at –5.5 all with sensitive X-ray coverage, the largest sample utilized to date by a wide margin. X-ray enhancements are assessed using X-ray-to-optical flux ratios and spectral energy distributions. We confirm the presence of X-ray enhancements at a 4.9–5.3 significance level, finding that the median factor of enhancement is at our sample median redshift of . Under a fractional IC/CMB model, the expected enhancement at lower redshifts is modest; e.g., % at . We also investigate a sample of seven radio-loud quasars (RLQs; ) at even higher redshifts of –6.8, using new and archival X-ray data. These RLQs also show evidence for X-ray enhancements by a median factor of at a 3.7–4.9 significance level. The X-ray spectral and other properties of these –6.8 RLQs, however, pose challenges for a straightforward fractional IC/CMB interpretation of their enhancements.
keywords:
galaxies: high-redshift – quasars: general – X-rays: galaxies1 Introduction
Quasars are powered by the accretion process happening in the vicinity of supermassive black holes (SMBHs) located in the central regions of host galaxies. Quasars at high redshifts are of particular interest since they provide insights into SMBH growth and galaxy formation in the early universe. The discovery of significant samples of rare high-redshift quasars was made possible by large-scale sky surveys such as the Sloan Digital Sky Survey (SDSS, York et al., 2000). Since Ly emission is redshifted to the near-infrared (NIR) bands at , wide-field NIR surveys like the UKIRT Infrared Deep Sky Survey and the VISTA Hemisphere Survey (e.g. Lawrence et al., 2007; McMahon et al., 2013) are also important. As of December 2022, there are 531 quasars with in the literature (Fan et al., 2022). Based on the radio-loudness parameter , where and are the flux densities at rest-frame and (Kellermann et al., 1989), quasars can be divided into radio-quiet quasars (RQQs; ) and radio-loud quasars (RLQs; ). RLQs harbor strong relativistic jets (e.g. Padovani, 2017). The fraction of RLQs remains up to (Bañados et al., 2015). It is well known that the quasar number density peaks at (e.g. Dunlop & Peacock, 1990; Croom et al., 2004; Brown et al., 2006; Yang et al., 2016) and then rapidly declines with increasing redshift. In contrast to the strong redshift dependence of the quasar number density, previous studies have shown that the UV/optical and NIR spectral properties of quasars do not show significant evolution up to (e.g. Fan et al., 2004; Jiang et al., 2007; Shen et al., 2019). Current observations suggest that AGNs and SMBH feeding modes do not show significant evolution after the first billion years of the Universe.
Almost all quasars are bright in the X-ray regime. The X-ray emission from RQQs is proposed largely to be generated by the thermal inverse-Compton (IC) process, where UV/optical photons provided by the accretion disk are upscattered by the hot electrons in a coronal structure (e.g. Haardt & Maraschi, 1993). The – relation of RQQs also does not show significant evolution up to (e.g. Steffen et al., 2006; Vito et al., 2019). Previous studies found that the typical X-ray power-law photon index of RQQs is slightly steeper than that of RQQs at lower redshifts (e.g. Nanni et al., 2017; Vito et al., 2019; Wang et al., 2021). A recent work conducted by Zappacosta et al. (2023) showed that the power-law photon index of a sample of hyperluminous ( erg s-1) RQQs seems significantly steeper than that for RQQs at lower redshifts.
The nuclear X-ray emission of RLQs is stronger than that of RQQs with comparable UV/optical luminosities. Historically, this X-ray excess was believed to be produced by an additional jet-linked component (e.g. Zamorani et al., 1981; Worrall et al., 1987). This idea has been challenged by Zhu et al. (2020, 2021) and Timlin et al. (2021), who proposed that the X-ray emission from most RLQs is still corona-dominated with stronger coronal X-ray emission caused by a corona-jet connection.
The X-ray luminosity contribution from the jet-linked component is much less important than previously expected for general RLQs. However, the many extended X-ray jets discovered by Chandra111See, e.g., https://hea-www.harvard.edu/XJET/., often stretching over tens of kpc, demonstrate that some level of jet-linked X-ray emission exists. The radiation mechanisms of this jet-linked X-ray emission have been extensively discussed. One possible mechanism is seed photons being IC scattered by relativistic electrons accelerated in the jet. The seed photons of the IC process may come from the cosmic microwave background (IC/CMB; Tavecchio et al., 2000; Celotti et al., 2001); synchrotron emission from the jet (synchrotron self-Compton, or SSC; Bloom & Marscher, 1996); or photons radiated from the accretion disc, broad-line region (BLR), or the dusty “torus” (e.g. Dermer & Schlickeiser, 1993; Sikora et al., 1994; Błażejowski et al., 2004). The IC/CMB model was used to explain the X-ray knot emission of the kpc-scale jet of PKS 0637752 (Tavecchio et al., 2000; Chartas et al., 2000; Schwartz et al., 2000) and became a popular explanation for X-ray jets (e.g. Sambruna et al., 2004, 2006; Perlman et al., 2011; Marshall et al., 2018).
Despite the initial success of the IC/CMB model for extended X-ray jets, the lack of strong redshift evolution of RLQ X-ray properties disfavors using IC/CMB to explain the nuclear jet-linked X-ray emission (e.g. Bassett et al., 2004; Lopez et al., 2006; Miller et al., 2011). An X-ray jet-linked component that is dominated by IC/CMB emission would reproduce the dependence of the CMB energy density. Miller et al. (2011) showed that the relative X-ray brightness of RLQs compared to RQQs with similar UV/optical luminosities does not show significant redshift dependence to . However, Wu et al. (2013, Wu13 hereafter) and Zhu et al. (2019, Zhu19 hereafter) showed that the minority subset of highly radio-loud quasars (HRLQs, ) has an X-ray enhancement at compared to their matched low- counterparts. Zhu19 formed a flux-limited sample of 24 HRLQs at (median , ) with complete X-ray coverage and compared it with 311 HRLQs at (median ) with matched UV/optical luminosities. Zhu19 found the nuclear X-ray emission of HRLQs is times stronger than that for their low- counterparts at a 4–5 confidence level. The X-ray enhancement factor of is slightly smaller than the factor found by Wu13 but has a higher confidence level owing to the larger and improved sample. Although the dependence of the dominant X-ray emission has not been observed, contributions from the IC/CMB process are still expected.
Wu13 and Zhu19 proposed a fractional IC/CMB model to explain the X-ray enhancements of high-redshift HRLQs. In this model, the IC/CMB process is only dominant on the scale of kpc, where the CMB energy density starts to dominate those of other radiation fields and the magnetic field. In the inner region, the IC seed photons are dominated by the emission from the accretion process around the central SMBH, such as IR photons emitted by the torus (e.g. Ghisellini & Tavecchio, 2009), which does not show a strong redshift dependence. Here, Ghisellini & Tavecchio (2009) assumed a highly relativistic jet with a bulk Lorentz factor . On scales of kpc, the likely decelerated jet (e.g. Mullin & Hardcastle, 2009; Breiding et al., 2017; Meyer et al., 2015, 2016) can no longer boost CMB photons to X-ray energies. Indeed, if a jet with at kpc decelerates to at a large distance, the X-ray emission produced by the IC/CMB process would decrease by a factor of . An alternative to the fractional IC/CMB model is that the enhanced star formation in high- host galaxies might create extra IR photons serving as seed photons for the IC process. It is also possible that high- jets are slower than those in the low- universe, leading to a larger fraction of beamed objects at .
If the fractional IC/CMB model is correct, then RLQs at still higher redshifts of are expected to have strong IC/CMB-related X-ray emission due to the evolution of CMB energy density. Moreover, observations of several individual RLQs reveal inconsistent results regarding their X-ray enhancements (e.g. Medvedev et al., 2020, 2021; Connor et al., 2021; Belladitta et al., 2020; Ighina et al., 2022a). Thus, it is important to study the role of the IC/CMB process in the early universe by investigating the X-ray enhancements of a sample of RLQs.
In this work, we investigate a sample of 41 HRLQs at and a sample of 7 RLQs at . Our goals include the following: (1) further assess the existence of X-ray enhancements for HRLQs with an enlarged sample, and (2) constrain the X-ray enhancements of RLQs at very high redshifts (). In Section 2, we describe the selection of our HRLQ sample and the sample. We report our observations, analysis procedures, and X-ray properties of eight newly observed Chandra Cycle 23 objects in Section 3. In Section 4, we present our main results and findings. The discussion and a summary are presented in Sections 5 and 6. Throughout the paper, we use short-hand nomenclature for object names in the text and Table 5. We adopt a flat CDM cosmology with 70.0 km s-1 Mpc -1 and .
2 Sample Selection
2.1 The HRLQ sample
Our HRLQ sample was constructed based on the sources selected by Wu13 and Zhu19. Wu13 first selected four HRLQs from the SDSS Data Release 7 quasar catalog (Schneider et al., 2010) that covers a sky area of 9380 deg2. They then found HRLQs within the sky area at from NED.222https://ned.ipac.caltech.edu/ The sky area they chose was covered by the 1.4 GHz NRAO VLA Sky Survey (NVSS; Condon et al., 1998), which enabled them to determine the radio-loudness of each source. The flux densities of HRLQs () with at observed-frame 1.4 GHz should be above the NVSS detection limit ( mJy). The resulting sample contains 28 HRLQs (see Table 1 and Table 2 in Wu13 for a full list).333The 28 HRLQs were revised to 26 by Zhu19. SDSS J003126.79+150739.5 and SDSS J123142.17+381658.9 were removed since they do not satisfy the HRLQ criterion () when using the rest-frame 2500 Å luminosity from Shen et al. (2011).
Based on the HRLQ sample constructed by Wu13, Zhu19 found 17 more HRLQs. Zhu19 first matched the SDSS Data Release 14 quasar catalog (Pâris et al., 2018) to the Faint Images of the Radio Sky at Twenty-centimeters survey (FIRST; Becker et al., 1995) for observed-frame 1.4 GHz flux densities and found 16 HRLQs at . FIRST should have detected all HRLQs with with a sensitivity of mJy. Zhu19 also searched NED following the method used by Wu13 and selected another HRLQ at , B3 0254+434 (Amirkhanyan & Mikhailov, 2006).
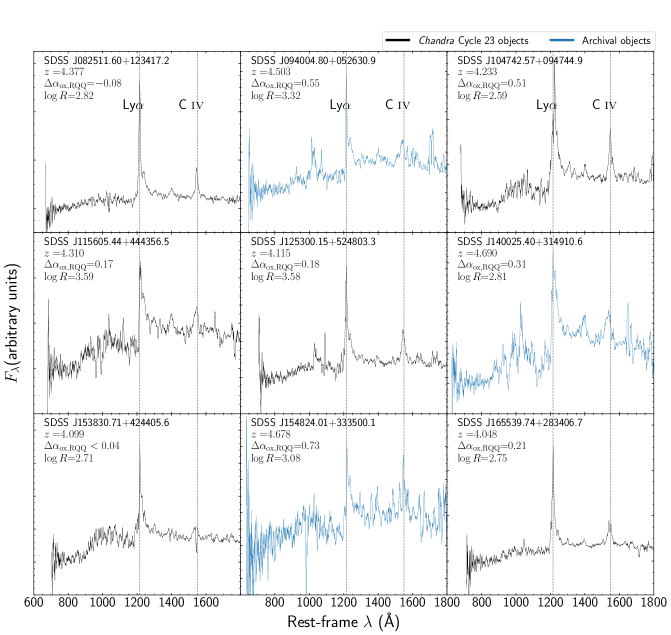
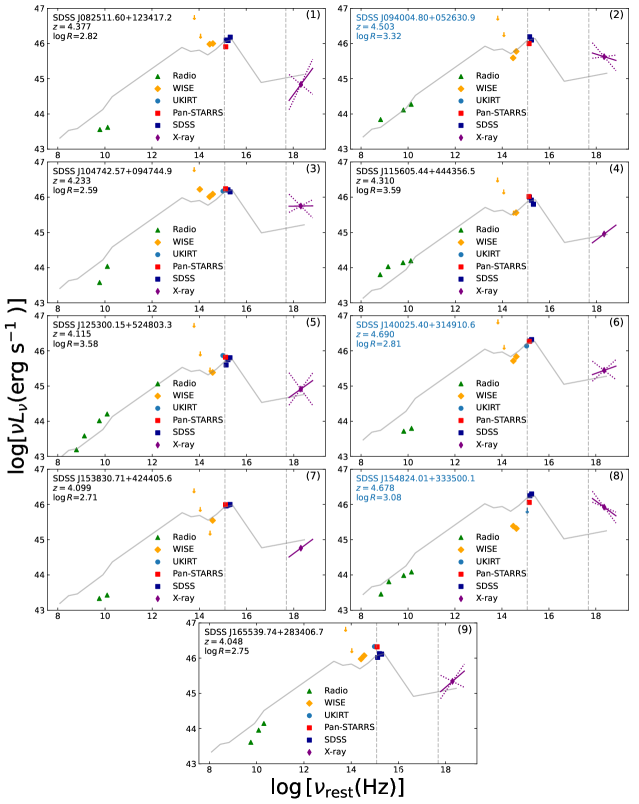
We combined the samples constructed by Zhu19 and Wu13, with the two faintest sources () removed, to form a complete sample of HRLQs with 41 sources. 32 out of 41 sources have been analyzed by Wu13 and Zhu19. In this paper, we report the data analyses of the remaining nine objects using new and archival Chandra observations. The rest-frame UV spectra of the nine newly-added HRLQs taken from SDSS are shown in Fig. 1. These objects generally show strong emission lines, indicating that their optical/UV continua are not strongly beamed. SDSS J1538+4244, showing an absorption feature on the blue wing of the C iv emission line, was identified as a mini-Broad Absorption Line quasar (mini-BAL; e.g. Hall et al., 2002). Since mini-BALs generally do not show weaker X-ray emission compared to typical quasars (e.g. Gibson et al., 2009; Wu et al., 2010), we did not remove SDSS J1538+4244 from the sample.
We checked the VLA Sky Survey (VLASS; Lacy et al., 2020) Epochs 1 and 2 Quick-look Catalogs (Gordon et al., 2021) for potential source radio variability.444The catalogs were retrieved from https://cirada.ca/vlasscatalogueql0. The majority of HRLQs do not show significant source variability during the 32 month time span between Epochs 1 and 2 of VLASS, corresponding to a rest-frame timescale of months (calculated using the median redshift of HRLQs). All 41 HRLQs at are detected in both epochs. The flux densities at observed-frame 3 GHz of 40 objects fluctuate within 30% between two epochs. The flux density of GB 1508+5714 obtained from VLASS Epoch 2 has doubled compared to that from Epoch 1. A variability corresponds to a fluctuation in . The highly-radio-loud nature of HRLQs in our sample is thus not jeopardized by source variability.
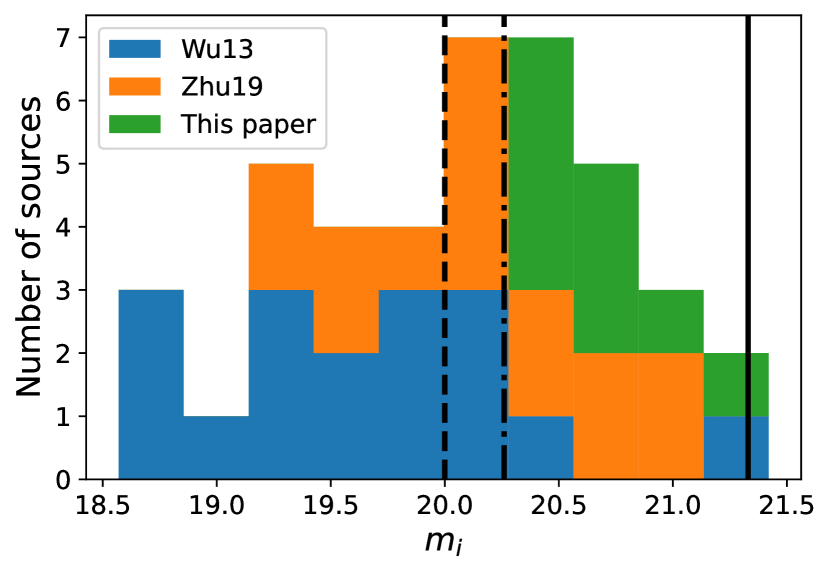
We plotted the distribution of the HRLQ sample in Fig. 2 and showed the joint efforts made by Wu13, Zhu19, and this paper to construct a high-redshift HRLQ sample with complete X-ray coverage over the past decade. The optically flux-limited sample utilized here is significantly larger than those of past work.
2.2 The RLQ sample
We collected RLQs from the literature (e.g. Belladitta et al., 2020; Bañados et al., 2021; Ighina et al., 2021; Liu et al., 2021) and found 14 objects as of March 2021. Since the quasars selected by radio surveys tend to bias toward those with high radio luminosities, which may show more extreme properties, we removed three radio-selected quasars (McGreer et al., 2006; Zeimann et al., 2011; Belladitta et al., 2020) and focused on optically selected objects. We also removed three optically selected putative RLQs since they were either not detected in deep follow-up radio observations (Liu et al., 2021) or the radio-loud nature depends on the assumed shape of the radio spectrum (Bañados et al., 2021). Therefore, we found eight bona fide optical-selected RLQs at , among which seven objects with have sensitive (new and archival) Chandra or XMM-Newton coverage. The remaining object with still lacks sensitive X-ray data.
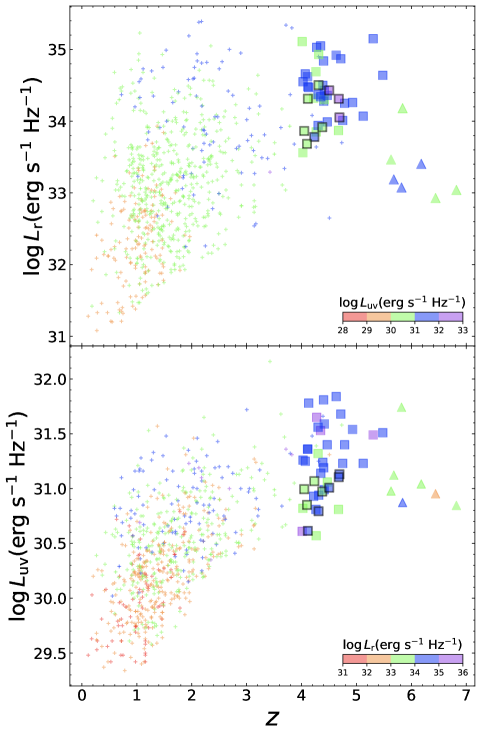
We plotted the radio and optical/UV luminosities against redshift for HRLQs, RLQs, and general RLQs from the full sample of Zhu et al. (2020) in Fig. 3. Compared to objects studied by Wu13 and Zhu19, our objects are fainter in both the radio and optical/UV bands.
We repeated the VLASS radio variability analysis described in Section 2.1. Three out of seven RLQs at were detected in both Epochs of VLASS and all of them show flux density fluctuations within 15% on a rest-frame timescale of months (calculated using the median redshift of RLQs). Only one object (VIK J23183113) was detected in one Epoch but not another. Observations at other radio frequencies further suggest that VIK J2318-3113 is probably a highly variable source. It is possible that such variability is extrinsic rather than intrinsic (Ighina et al., 2022b). The typical radio variability of RLQs translates to a fluctuation in , which does not jeopardize their radio-loud nature.
3 observations and Data analyses
In this section, we describe the data analyses of nine HRLQs at and seven RLQs at (see Table 1 for their observation logs).
Among the nine HRLQs, six have been awarded Chandra Cycle 23 observation time and three are archival objects (Snios et al., 2020) that are reanalyzed for consistency. Among the seven RLQs, two (PSO J05500 and PSO J135+16) are Chandra Cycle 23 objects. Two archival objects (VIK J23183113 and PSO J172+18) are analyzed and reported for the first time in this paper. Three additional objects with sensitive X-ray coverage reported in previous studies (Brandt et al., 2002; Connor et al., 2021; Medvedev et al., 2021) are reanalyzed for consistency.
3.1 Chandra data reduction and analysis
All objects reported in Table 1 were observed with the Advanced CCD Imaging Spectrometer (ACIS) on board Chandra except for PSO J172+18. 555CFHQS J1429+5447 has been observed by both Chandra and XMM-Newton. We used the most recent observation conducted by Chandra in our analyses. However, the 0.5–2 keV flux derived from the Chandra data is fainter than that inferred from the XMM-Newton data (Medvedev et al., 2021), suggesting the source is probably variable in X-rays on a rest-frame timescale of days. The Chandra observation also gave a flatter X-ray spectral index. We utilized Chandra Interactive Analysis of Observations (ciao) version 4.14.0 to conduct X-ray data reduction. We first ran the chandra_repro tool to reprocess and recalibrate the observation data with CALDB version 4.9.7. We did not see any object showing extended X-ray structures based on visual inspections. After that, we ran fluximage to generate exposure-corrected X-ray images in the full band (0.5–8 keV), soft band (0.5–2 keV), and hard band (2–8 keV). Here we define the effective energy of each band to be the geometric mean of the energy limits. We then performed source detection by running wavdetect on the full-band image with a significance threshold and wavelet scales and 4. All sources but SDSS J1538+4244 and VIK J23183113 were detected by wavdetect. We adopted wavdetect positions for the detected sources and the optical position for the undetected sources as source positions. We then applied the deflare procedure to background light curves to remove background flares and periods when the count rate was anomalously low. The method parameter is set to be sigma to adopt the lc_sigma_clip method with the default sigma value of 3, which iteratively deletes any point outside about the mean until all points are in this range. When running deflare, regions of detected sources were masked out. Then, we filtered the event file with the good time interval (GTI) file produced by deflare. None of our observations was affected by flaring except for SDSS J1400+3149, whose exposure time has been reduced by 4%.
We defined the source region to be a circle with a radius of 2.0 arcsec centered at the source position (corresponding to a encircled-energy fraction, or EEF, of the PSF at 2 keV) and the background region to be an annulus centered at the source position, with inner and outer radii of 5.0 arcsec and 20.0 arcsec, respectively. We visually inspected the X-ray images to ensure that the background regions of reported objects are free of other X-ray sources. After that, we extracted the source and background counts of all three bands using dmextract with the source and background regions. We added the raw counts in the source and background regions of all five observations of VIK J23183113 together to get its raw source and background counts. We adopted the likelihood-ratio test developed by Li & Ma (1983) for source detection. The null hypothesis is , and the alternative hypothesis , where is the true source counts. Following Li & Ma (1983), we defined a likelihood ratio, , which is the ratio of the likelihoods that all X-ray counts are produced by the background over that there exists an actual X-ray source. The likelihood ratio, , satisfies Eq. (1), where and are source and background counts, and is background area to source area ratio:
| (1) |
The statistic is the Z-score of the source-detection test. That is, the likelihood-ratio test has a significance level. If the source counts are smaller than the estimated background counts, i.e., , we flip the sign of for this scenario. We rejected the null hypothesis if , or equivalently <0.01, and considered a source to be detected in the tested energy band. Here the -value is calculated as where follows a standard normal distribution. The 0.01 threshold is suitable for source-detection tests with pre-specified positions.
We calculated for all three bands of all our sources. For detected bands, we used a Bayesian method aprates666https://cxc.cfa.harvard.edu/ciao/ahelp/aprates.html. (e.g. Primini & Kashyap, 2014) and set the conf parameter to 0.68 to calculate the net counts and their 1 credible intervals for all three bands, which are shown in Table 2. For each undetected band, the upper bound of a 90 percent confidence interval of net counts is reported. Only a fraction of the source counts is included in the source aperture. We corrected the effects of nonideal PSF by setting the parameters alpha and beta of aprates to be the PSF fraction in the source aperture and background region, which are calculated using src_psffrac.
We ran the specextract tool to extract source and background spectra. The specextract tool automatically generates ancillary response files (ARFs) and response matrix files (RMFs) except for SDSS J1538+4244, which does not have counts in the full band. We ran mkacisrmf, with the weight map provided by specextract, to create the weighted RMF and mkarf to create the ARF for SDSS J1538+4244. For VIK J23183113, we ran combine_spectra to combine its spectra and response files from all five observations. We used the combined spectrum in the following analyses.
We also calculated hardness ratios and their 1 confidence intervals using the Bayesian estimation method developed by Park et al. (2006). In this paper, hardness ratio is defined as , where and are net counts in the hard and soft bands, respectively. For each object detected in the soft band but undetected in the hard band, we reported an upper limit on the hardness ratio to be the hard count upper limit divided by soft counts. We then estimated the effective power-law photon index using Sherpa. For each object, we generated a series of Galactic-absorbed power-law spectra using the xsphabs.abs1*powlaw1d.p1 model implemented in Sherpa, which is the multiplication of an absorption model and a power-law model, with fixed Galactic neutral hydrogen column density (777https://heasarc.gsfc.nasa.gov/cgi-bin/Tools/w3nh/w3nh.pl) and varying . We then used calc_model_sum to calculate the soft-band and hard-band counts of each model. With X-ray counts, we calculated the hardness ratio of each model and used interpolation to determine the desired whose hardness ratio matches the observed value.
Our data reduction ends with running calc_energy_flux on the xsphabs.abs1*powlaw1d.p1 model combining ARF and RMF files, , and to derive the Galactic-absorption corrected soft-band flux. The model is normalized so that the result of running calc_model_sum on the soft-band equals the soft-band net counts or upper limit.
3.2 XMM-Newton data reduction and analysis
There are two archival X-ray observations of PSO J172+18 using EPIC onboard the XMM-Newton observatory. We report the results of these observations (see Table 1 for the observation logs) for the first time. We used the sas package (v21.0.0) and the most recent Current Calibration Files to reprocess the XMM-Newton data. We used the epproc command to produce calibrated event lists and filtered the resulting event lists using good time intervals created with single-event (i.e. pattern zero), and high-energy (10–12 keV) light curves with a criterion of “RATE<=0.4”. We extracted source spectra from a circular aperture with a radius of 15 arcsec centered at the optical position of PSO J172+18. We also chose a circular source-free region with a radius of arcsec on the same CCD as the background region. We then extracted background spectra following the method we used to extract source spectra. The net counts, hardness ratio, and are calculated following the steps described in Section 3.1. The results are reported in Table 2. The flux of PSO J172+18 appears only slightly above the sensitivity of these XMM-Newton observations. To achieve the best signal-to-noise ratio, we only considered counts below 4.5 keV and defined soft, hard, and full bands as 0.3–1 keV, 1–4.5 keV, and 0.3–4.5 keV, respectively.
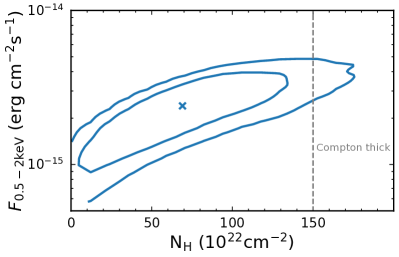
The X-ray emission of PSO J172+18 might suffer from additional absorption, given the flatness of the observed spectrum (; see Table 2) and the faintness of the flux.888We examined the rest-frame optical/UV spectrum of PSO J172+18 provided by Bañados et al. (2021). The optical/UV spectrum is similar to that of typical quasars, with prominent emission lines and a rest-frame UV power-law slope . Thus, there is no apparent obscuration in the rest-frame optical/UV band. Since the 0.3–4.5 keV band probes 2.3–35 keV photons in the rest frame, the column density must be high if the putative absorber is intrinsic to PSO J172+18. To assess the column density of the absorber and its impact on the X-ray fluxes, we fit a power-law model with intrinsic photoelectric absorption in addition to the Galactic absorption. The spectra from the two observations were fitted jointly. Due to the limited number of net counts, the photon index and column density cannot be constrained simultaneously. We thus fixed to 2.0 (e.g. Vito et al., 2019; Zhu et al., 2021), leaving the power-law normalization factor and the column density of the absorber free to vary. We performed a Markov chain Monte Carlo analysis to obtain a sample of 104 sets of free parameters using sherpa. The results are plotted in Fig. 4, where the normalization factor is replaced by absorption-corrected 0.5–2 keV flux. If , the absorber is likely Compton thin with best-fit cm-2. We use the best-fit 0.5–2 keV flux, erg cm-2 s-1, in later calculations.
Another possible explanation for the flat X-ray spectrum of PSO J172+18 is that it is a highly beamed object (or blazar). However, the steep radio spectrum (, Bañados et al., 2021) and the modest radio loudness () of PSO J172+18 disfavor this scenario.
3.3 X-ray, optical/UV, and radio properties
In this section, we elaborate on selected columns of Table 3 and Table 4, which report X-ray, optical/UV, and radio properties for our sample of HRLQs and RLQs. The captions of Table 3 and Table 4 contain brief explanations of all columns.
The absolute -band magnitude of the quasar is listed in column (3) of Table 3. To be consistent with Zhu19, they are calculated from Galactic-extinction corrected using equations (1) and (4) in Section 5 of Richards et al. (2006) and K-corrections from the same paper.
We adopted a new method to calculate the flux density observed at Å for RLQs since Richards et al. (2006) did not provide K-corrections for quasars. We used the synphot (Lian Lim, 2020) package to simulate the photometry of quasars observed in certain filters and adopted the composite quasar spectrum from Vanden Berk et al. (2001) as the quasar spectrum template. We inspected the rest-frame optical/UV spectra of all seven RLQs and did not identify any objects with unusual continuum spectra. It is thus appropriate to use the composite spectrum given by Vanden Berk et al. (2001) in our calculations. We then normalized the composite spectrum to the photometric data in the selected band and determined the flux density at Å from the normalized composite spectrum. Since rest-frame Å is in the observed-frame near-infrared (NIR) band at , we used -band magnitudes to calculate whenever possible. For objects without -band observations, we used -band (CFHQS J1429+5447 and PSO J35215) or Pan-STARRS -band (PSO J135+16) photometric data instead (see 4.3). The results are shown in column (9) of Table 4.
We calculated the radio spectral indices around observed-frame 1.4 GHz, with . The results are shown in column (11) of Table 3 for HRLQs and column (11) of Table 4 for RLQs. The 1.4 GHz flux densities were obtained from the FIRST or NVSS surveys. We also obtained flux densities at observed-frame 150 MHz, 326 MHz, 366 MHz, 3 GHz, and 5 GHz (See Section 4.3). We calculated and , the radio spectral index between 1.4 GHz and a lower or higher frequency. We take the average value of and to be .
The power-law spectral indices connecting rest-frame 2500 Å and 2 keV, defined by
| (2) |
are shown in column (14) of Table 3 for HRLQs and column (14) of Table 4 for RLQs.
We present differences between the measured and the expected value of RQQs () in column (15) of Table 3 for HRLQs and column (15) of Table 4 for RLQs. More explicitly,
| (3) |
Here, is calculated using Eq. (3) of Just et al. (2007):
| (4) |
We also present differences between the measured and the expected of low- RLQs () in column (16) of Table 3 for HRLQs and column (16) of Table 4 for RLQs. More explicitly,
| (5) |
Here, is calculated from the -- relation for the full RLQ sample given by model I in Table 4 of Zhu et al. (2020), which is equivalent to
| (6) |
4 Results
4.1 X-ray enhancements of HRLQs
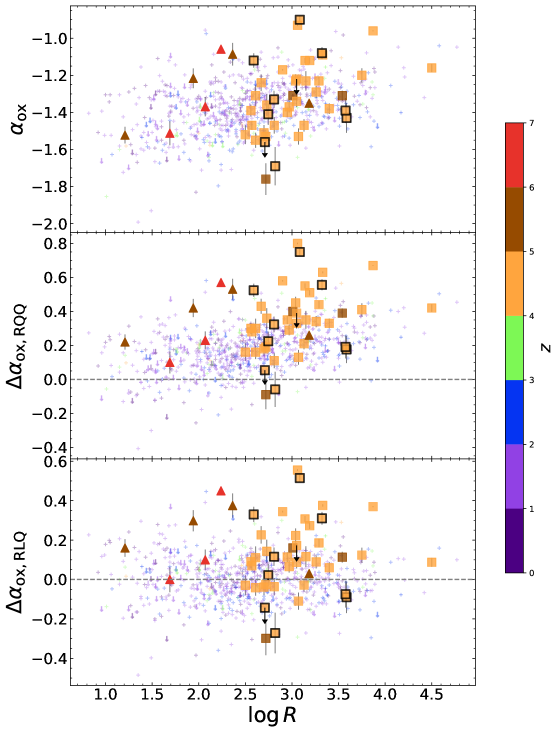
To qualitatively assess the X-ray enhancements of HRLQs and RLQs, we plotted , , and against for our full sample of HRLQs and RLQs in the upper, middle, and lower panels of Fig. 5, respectively. We also included optically selected radio-loud quasars from Zhu et al. (2020) in Fig. 5 for comparison. The full sample of Zhu et al. (2020) has 729 RLQs, among which 657 (90.1%) objects have X-ray detections. The redshift of the comparison sample has a median of 1.5 and an interquartile range (IQR) of 1.0. We plotted horizontal dashed lines with and in the middle and lower panels of Fig. 5. The positions of HRLQs (stars, squares, and diamonds) in the middle and lower panels of Fig. 5 are generally higher than the low- comparison RLQs, implying enhanced X-ray emission. More specifically, 39 out of 41 HRLQs at have positive , and 29 have positive .
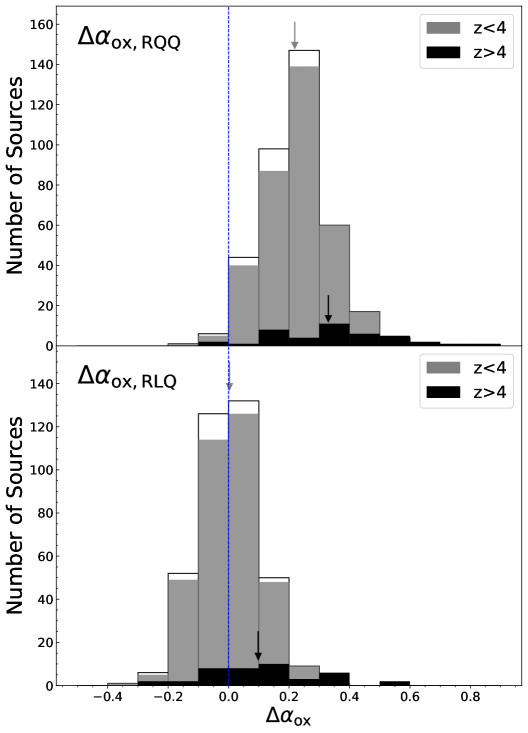
We then applied three conditions (, , ) to the full sample of Zhu et al. (2020) to form a sample of HRLQs that are comparable to HRLQs in the optical/UV and radio bands. Here we adopted an upper limit of 21.33 for since all objects in our HRLQ sample are optically brighter than . We plotted the distributions of and for the low- HRLQ comparison sample and the HRLQ sample in Fig. 6 for quantitative analysis. The low- HRLQ sample contains 377 objects with a median redshift of 1.5 and an IQR of 1.0. The logarithm of the radio-loudness parameter () of the comparison sample has a median of 3.0 and an IQR of 0.6.
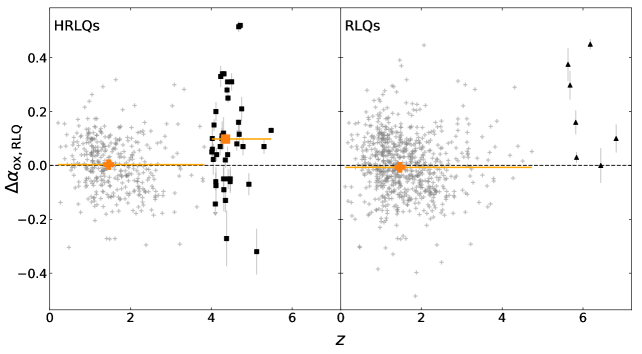
Since our data include upper limits, we adopted survival analysis methods implemented in the python package lifelines (Davidson-Pilon, 2023) in the following calculations. We used the Kaplan-Meier estimator to estimate the cumulative distribution functions of all datasets. We then calculated the medians of all distributions from the cumulative distribution functions. We used bootstrap (1000 times) to estimate the uncertainties of the medians we calculated in the previous step. The medians of for low- and high- HRLQs are and , respectively. The medians of for low- and high- HRLQs are and , respectively. The difference between the medians of the distributions at and is . Our results imply that the X-ray emission of high- HRLQs is times stronger than that of their low- counterparts. After that, we used the Peto-Peto test implemented in the lifelines package to test the significance of the difference between distributions of low- and high- HRLQs. The statistical test shows a () difference for distributions and a () difference for distributions. To illustrate the redshift evolution of , we plotted versus redshift for the low redshift HRLQ comparison sample (grey plus signs) and the HRLQ sample (black squares) in the left panel of Fig. 7.
We performed a two-sample Kolmogorov-Smirnov (KS) test on the distributions of the HRLQ sample and the HRLQ comparison sample. With the null hypothesis that the distributions from the two samples are the same, the KS test gave a -value of 0.95. We also performed a similar KS test on the radio flux distributions and found a -value of 0.30. The medians (999. This is a robust estimator of standard deviation. ) of the distributions of HRLQs and HRLQs are and , respectively. Similarly, for the log radio flux distributions of the high- and low- HRLQs, the medians () are and , respectively. Therefore, both the values and radio fluxes are consistent among the two samples. Thus, we do not need an explicit cut on or radio fluxes.
The results from Zhu19 indicate that the X-ray enhancement of high- HRLQs is a factor of at a significance level considering the differences between distributions of low- and high- HRLQs. Compared to Zhu19, our results indicate a slightly lower X-ray enhancement factor (though statistically consistent within uncertainties) at a higher significance level. The X-ray enhancement factor for our results is smaller because only five out of nine newly added HRLQs have positive . However, since the sample size has been improved from 24 (the flux-limited sample in Zhu19) to 41, the significance level of the X-ray enhancement has been improved.
4.2 X-ray enhancements of RLQs
Referring to the middle and lower panels of Fig. 5, the positions of the seven RLQs are generally higher than the comparison sample. All seven objects have positive , and non-negative . Five of them have , and three stand out with .
We used the sample of optically selected RLQs from Zhu et al. (2020) with as the comparison sample. Here the flux limit is the of the faintest RLQ. The low-redshift comparison sample of RLQs differs from that of by removing the and conditions and changing the flux limit. We then followed the methods used in Section 4.1 to calculate the medians of the distributions and test the significance levels of the differences between the distributions for RLQs at and . The medians of at and are and , respectively. The medians of at and are and , respectively. The difference between the medians of the distributions at and is . This corresponds to an X-ray enhancement factor of . The large uncertainties are due to the small sample size at . The statistical test shows a () difference for the distributions and a () difference for the distributions. The results are not significantly affected if the potentially heavily absorbed source, PSO J172+18, is removed. Following Section 4.1, we plotted versus redshift for the low redshift RLQ comparison sample (grey plus signs) and the RLQ sample (black triangles) in the right panel of Fig. 7.
A KS test on the distributions of the RLQ sample and its low-redshift comparison sample gives a -value of 0.07. A similar KS test on radio flux distributions gives a -value of 0.003. The KS tests suggest that the values, as well as the radio fluxes, are marginally different among the two samples. If such differences do exist, the low-redshift comparison sample could only bias toward higher (see Fig. 5) and radio fluxes. Since objects with lower and radio fluxes are expected to have less jet-linked X-ray emission, we conservatively did not apply an upper limit on or radio fluxes for the comparison sample.
4.3 Spectral energy distributions
To compare the broadband spectral energy distributions (SEDs) of HRLQs at and RLQs at with their low- counterparts, we constructed the SEDs for the nine newly added HRLQs and the seven RLQs. The SEDs of the remaining HRLQs can be found in Wu13 and Zhu19. This comparison serves as an additional test of X-ray enhancements of HRLQs and RLQs. The multiwavelength photometric data were collected from the following sources:
-
1.
Radio: See Table 5 and its footnotes for detailed information about the available radio frequencies for each source.
-
2.
Submillimeter: We included submillimeter photometry for RLQs. The flux densities at of CFHQS J1429+5447 and PSO J35215 are taken from Khusanova et al. (2022). The flux densities at of VIK J23183113 and SDSS J0836+0054 are taken from Venemans et al. (2020) and Petric et al. (2003), respectively. The flux densities at of PSO J05500 and PSO J135+16 are taken from Li et al. (2020). PSO J05500 is a non-detection; we took its 2 upper limit.
-
3.
Mid-infrared: The mid-infrared flux densities are taken from the WISE all-sky catalog (Wright et al., 2010) except for SDSS J1548+3335, PSO J05500, VIK J23183113, PSO J35215, and PSO J172+18, which are non-detections in the WISE all-sky catalog. We retrieved the and magnitudes of the first four sources from the CatWISE 2020 catalog (Marocco et al., 2021). We used the WISE all-sky catalog whenever possible since the CatWISE catalog did not provide and magnitudes. Following Bañados et al. (2021), we took the and magnitudes of PSO J172+18 from the DESI Legacy Imaging Surveys (DECaLS; Dey et al., 2019).
-
4.
Near-infrared: The flux densities in near-infrared bands are taken from the UKIRT Hemisphere Survey (UHS; Dye et al., 2018), the VISTA Kilo-degree Infrared Galaxy Survey (VIKING; Edge et al., 2013), the VISTA Hemisphere Survey (VHS; McMahon et al., 2013), or dedicated follow-up observations. SDSS J1253+5248 and SDSS J1655+2834 only have -band detections from UHS. PSO J05500 has , , and band detections from VHS. SDSS J0836+0054 and VIK J23183113 have , , and band detections from VIKING. PSO J35215 has and band detections from VHS. CFHQS J1429+5447 has -band detection from the Canada–France High- Quasar Survey (CFHQS; Willott et al., 2010). SDSS J1548+3335 was covered by UHS but not detected in any band. Due to our particular interest in this source, we set an upper limit for its -band flux by taking the maximum -band magnitude among all detections within 1 arcmin of it. We took , , and band magnitudes for PSO J172+18 from follow-up observations reported by Bañados et al. (2021).
-
5.
Optical: Considering the effects of the Ly forest, we took SDSS , , and magnitudes and Pan-STARRS magnitudes for objects. For objects with larger redshift (), we took Pan-STARRS and magnitudes. VIK J23183113 is not covered by Pan-STARRS.
- 6.
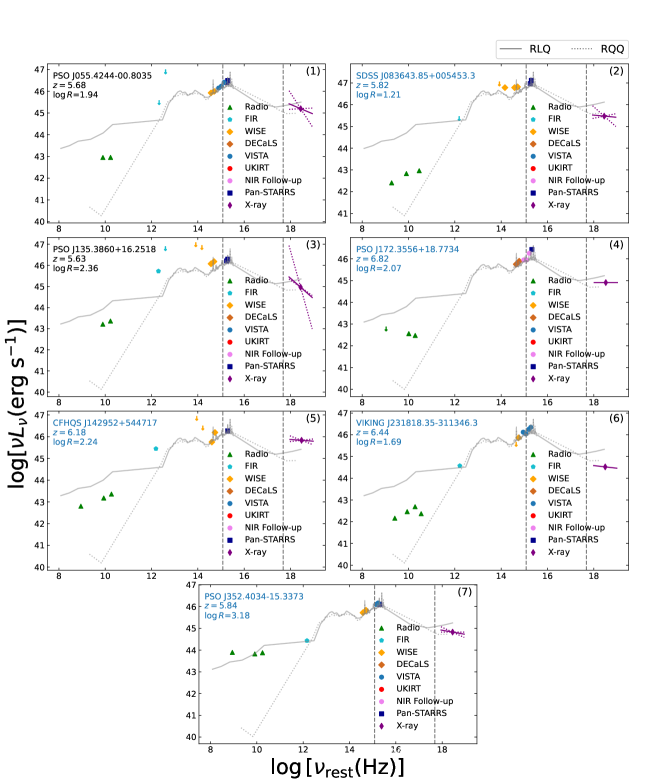
We calculated the monochromatic luminosities using flux densities and distances, which are derived from redshifts. The constructed SEDs for HRLQs and RLQs are shown in Fig. 8 and Fig. 9. Both figures are ordered by ascending RA. Following Wu13 and Zhu19, the composite SEDs for the 10 HRLQs from Shang et al. (2011) with comparable optical luminosity and radio loudness are plotted for comparison in Fig. 8 and Fig. 9. Considering the radio-loudness of RLQs (), we also plotted the composite spectrum for RQQs retrieved from Shang et al. (2011) using dotted lines in Fig. 9. The composite SEDs are normalized to the observed fluxes at 2500 Å.
Four out of nine newly-added HRLQs have higher luminosities at rest-frame 2 keV (the rightmost dotted vertical grey line of each panel) than the comparison SEDs. The X-ray luminosities of the remaining five sources are comparable to the comparison SED if the uncertainties of are considered. Combining the SED comparison results from Wu13, Zhu19, and our work, 20 out of 41 HRLQs show apparent X-ray excesses. Indeed, all 20 objects have , indicating that the SED comparison method is consistent with the method described in Section 3.3. Nearly all of them have X-ray luminosities that are at least comparable to the comparison SED.
The rest-frame 2 keV luminosities for three out of seven RLQs are higher than the comparison composite SED of RLQs. The three objects that show apparent X-ray enhancements under the SED comparison are those with the largest values among the RLQs.
5 Discussion
5.1 Implications for the fractional IC/CMB model
Historically, it has been thought that the small-scale X-ray core emission of RLQs is dominated by a jet-linked component (e.g. Worrall et al., 1987). To accommodate the mild X-ray enhancements of high- HRLQs, Wu13 proposed a fractional IC/CMB model, where the IC/CMB process mainly operates within a few kpc from the central SMBH and the contribution from the IC/CMB process is only a small fraction of the total X-ray emission at low redshifts. None of the objects in our sample shows extended X-ray emission. Considering that the 0.5 arcsec angular resolution of Chandra corresponds to a physical size of 3.4 kpc at (the median redshift of the HRLQ sample), the X-ray jets (if present) are likely smaller than kpc. This is consistent with the assumptions of the fractional IC/CMB model. X-ray observations with higher spatial resolution are required to constrain the scale of the jet. An alternative approach is to observe gravitationally lensed RLQs at high redshifts, whose X-ray emission is expected to have a significant contribution from the jet. However, only a few gravitationally lensed RLQs, limited to , have been observed in X-rays. Those with the highest redshifts are either only moderately radio loud (Dadina et al., 2016; Dogruel et al., 2020) or have ambiguities in physical interpretation (Schwartz et al., 2021). Besides, none of the gravitationally lensed systems mentioned above shows apparent X-ray enhancements compared to typical RLQs.
The results from Zhu et al. (2020, 2021) may suggest a simpler explanation. Zhu et al. (2020) found that the contribution of the jet-linked component to the X-ray core emission of RLQs is generally small, with a mean fraction of . The median redshift of the RLQ sample utilized by Zhu et al. (2020) is 1.5. The small contribution from the jet-linked component could readily explain the X-ray enhancements of high- HRLQs.
We then modeled the factor of X-ray enhancement as , containing a constant component and an IC/CMB component that evolves with redshift following , to constrain the contribution from the IC/CMB process at different redshifts. is set to to obtain the X-ray enhancement factor of 1.77 at . At , the predicted factor of X-ray enhancement is , which is consistent with previous studies (e.g. Wu13; Zhu19; Ighina et al., 2019) and the contribution from the jet-linked component found by Zhu et al. (2020). This is also roughly consistent with the jet-to-core X-ray ratio reported by Marshall et al. (2005, 2011, 2018).
5.2 The X-ray enhancements of RLQs at
At , the X-ray emission of moderately radio-loud quasars may be enhanced as a manifestation of the IC/CMB process in the dense CMB photon field. Indeed, the RLQs show X-ray enhancements as expected if the IC/CMB mechanism plays an important role. However, the RLQs show properties different from the HRLQs at .
We compiled multiwavelength radio data for 41 HRLQs at and seven RLQs at in Table 5. We calculated the radio spectral index between 1.4 GHz and a lower frequency, , and the radio spectral index between 1.4 GHz and a higher frequency, . We then took the average of and to get , the radio spectral index around observed-frame 1.4 GHz defined as . When calculating and , we preferred to use frequencies that are further from 1.4 GHz to reduce the effects of measurement uncertainties with the exception that 150 MHz has the lowest priority since it is too far away from 1.4 GHz and the radio spectra of some objects are peaked at frequencies between 150 MHz and 1.4 GHz. The radio data we collected cover rest-frame frequencies of –27 GHz and –34 GHz for typical HRLQs and RLQs (calculated using the median redshift of each sample), respectively. Thus, the redshift difference between the two samples does not significantly affect the rest-frame radio frequencies probed. In Table 5, we used boldface to label GHz peaked sources (GPSs) identified based on the radio data we collected, whose should be treated with caution.
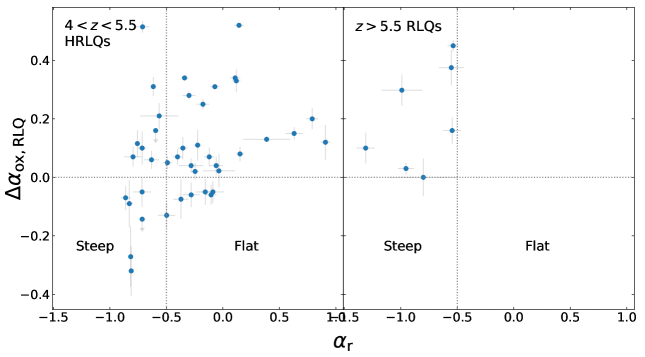
To explore the correlation between X-ray enhancements and radio spectral index, we plotted versus in Fig. 10 for HRLQs (left panel) and RLQs (right panel). The medians of of HRLQs and RLQs with are and , respectively.
Our results suggest that RLQs at with tend to have stronger X-ray enhancements than HRLQs at with similar radio spectral indices. Considering that RLQs at do not show X-ray enhancements (e.g. Miller et al., 2011), the X-ray enhancements of RLQs apparently rise significantly at . It is worth noting that although radio-selected blazars that should have the strongest jet-linked X-ray components have been deliberately removed (see Section 2.2), the X-ray enhancement of our optically selected RLQ sample is still strong. We also note that there is no apparent correlation between and X-ray enhancements for RLQs. The only HRLQ in our RLQ sample (PSO J35215) only shows a marginal X-ray enhancement with . This does not support the idea that X-ray emission for RLQs is dominated by jets. However, the lack of correlation between and X-ray enhancements is only suggestive since the RLQ sample is very small.
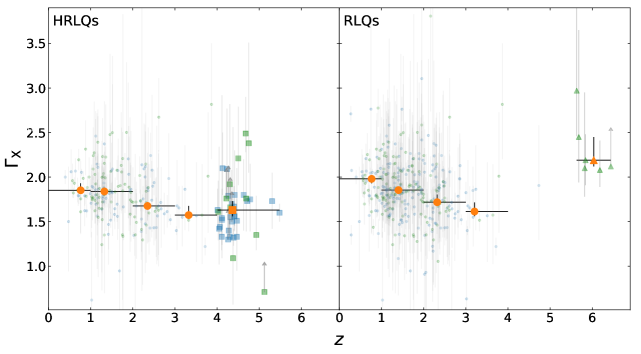
We also found that the X-ray spectra of RLQs are steeper than those of their low-redshift counterparts while such an X-ray steepening is not found in HRLQs. We plotted versus redshift for 333 optically selected RLQs with analyzed by Zhu et al. (2021) (small dots) and median in four redshift bins ( 0–1, 1–2, 2–3, and 3–4; large orange dots) in the right panel of Fig. 11.101010 We notice that there is an apparent versus redshift trend for RLQs and HRLQs as is shown in both panels of Fig. 11 which is probably caused by selection biases. The radio-loud nature of objects in Zhu et al. (2021) is determined using radio data at observed-frame 1.4 GHz, whose rest-frame frequency increases with redshift. At higher rest-frame frequencies, objects with steep radio spectra may drop below detection limits. Thus, objects in the Zhu et al. (2021) sample tend to have flatter radio spectra at higher redshifts, which suggests more jet contribution and hence flatter X-ray spectra. Aside from that, only bright radio sources can be detected at higher redshifts, resulting in higher values and probably flattening X-ray spectra. The Zhu et al. (2021) sample was built upon the Zhu et al. (2020) sample by selecting objects with high-quality X-ray data that could produce reliable values. Throughout Fig. 11, blue labels represent objects with and green labels represent those with . The median of for low-redshift RLQs given by Zhu et al. (2021) is . We then included the six RLQs with available values (small triangles) and their median (large orange triangle) in Fig. 11 for comparison. The potentially heavily absorbed object, PSO J172+18 (see Section 3.2), was not included. We used the Kaplan-Meier estimator to derive the median of for RLQs, , which is significantly larger than that for low redshift RLQs.
The small dots in the left panel of Fig. 11 are HRLQs from the Zhu et al. (2021) sample and the large orange dots are median values of HRLQs in redshift bins similar to the right panel. The squares represent HRLQs. The large yellow square represents the median value of HRLQs. 38 out of 41 objects in our HRLQ sample have available values. The median of for HRLQs at and are and , respectively. The 1 error bars were calculated using bootstrap. The X-ray spectra of HRLQs at are not steeper compared to their low-redshift counterparts. The steepening of X-ray spectra of RLQs and the lack of it for HRLQs indicate RLQs may be in a different evolutionary stage.
The evolution of X-ray spectral properties of RQQs up to has been investigated by recent studies. Vito et al. (2019) jointly fitted the X-ray spectra of 12 RQQs at with net counts and 6 with net counts from 0.5–7 keV. They found an average for the sample with net counts and an average for the sample with net counts. Zappacosta et al. (2023) reported an average for a sample of hyperluminous RQQs ( erg s-1). Compared to the canonical value of for RQQs at lower redshifts, both studies suggest, although at different significance levels, the steepening of X-ray spectra of RQQs. Zappacosta et al. (2023) proposed that the steepening of X-ray spectra is a manifestation of lower coronal temperature due to disc truncation caused by radiatively driven winds. The evolution trend of RQQs (see also Fig. 7 in Vito et al., 2019 and Fig. 5 in Zappacosta et al., 2023) is similar to that of RLQs presented in the right panel of Fig. 11. This suggests that RLQs may undergo similar physical transitions as RQQs at .
The X-ray spectral and other properties discussed above indicate RLQs are at a different evolutionary stage. RLQs at feature steep radio and X-ray spectra and relatively strong X-ray enhancements. The X-ray steepening mechanism proposed by previous studies, which was mentioned in the previous paragraph, could probably shed light on the evolution of RLQs. However, a larger sample of RLQs is needed to determine the physical mechanisms that are responsible for the X-ray enhancements of RLQs at very high redshifts and the role of the IC/CMB process in them.
5.3 Milli-arcsecond scale properties
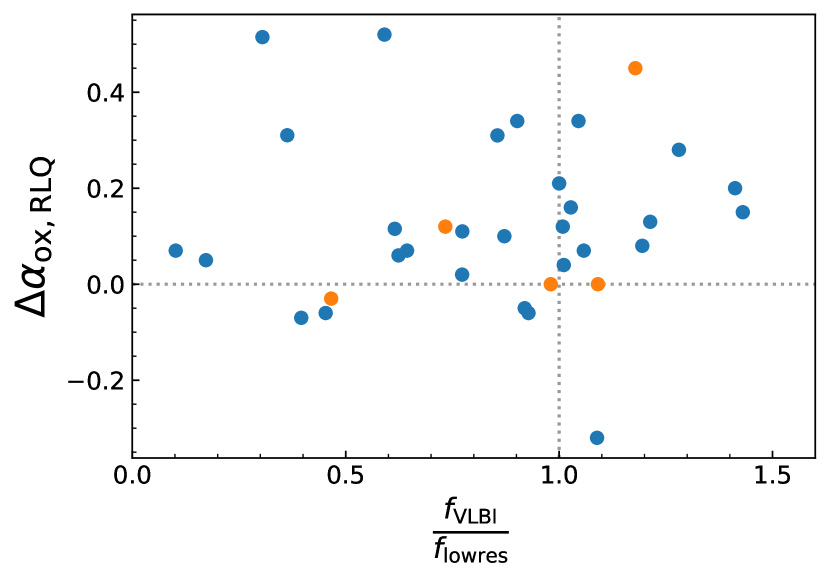
We also investigated if there is a relation between the milliarcsec-scale radio-jet properties and the X-ray enhancements of high redshift HRLQs/RLQs. We used the ratio between the flux densities given by VLBI observations and observations with lower resolution (NVSS/FIRST) at matched frequencies, , as an indicator of source compactness. An that is close to one indicates a compact radio-emitting region while a ratio that is much smaller than one indicates the existence of diffuse emission extending beyond the scale of a few hundred pc.
We collected available VLBI observations from the literature (see Table 5). 29 out of 41 HRLQs at and five out of seven RLQs at have available VLBI observations. If an object has VLBI observations in more than one band, the band closest to observed-frame 1.4 GHz was selected. The frequencies of all the bands we selected are greater than 1.4 GHz. We then used (see Table 5) to extrapolate the NVSS/FIRST flux densities from 1.4 GHz to the VLBI frequencies we selected. Since the VLBI and NVSS/FIRST observations were not taken simultaneously, variability of the sources may influence the values of . Based on the VLASS radio variability analyses presented in Section 2, the typical radio variability of HRLQs and RLQs is within % over a rest-frame period of –6 months. Although some VLBI and NVSS/FIRST observations are separated by over a decade in the observed-frame ( years in the rest-frame), the available VLASS radio variability analyses over a shorter time period do not suggest strong variability effects upon .
We plotted versus for HRLQs and RLQs that have VLBI observations in Fig. 12. We did not find an apparent dependence between the amount of X-ray enhancement and the source compactness, or the scale and size of radio jets.
Since the value reaches as high as , we expect that source variability and flux uncertainties may affect by . This is roughly consistent with a combination of the suggestive radio variability mentioned in the previous paragraph and measurement uncertainties, considering that objects with longer time gaps between VLBI and NVSS/FIRST observations may show stronger radio variability. It is thus appropriate to consider objects with as relatively compact. The majority of objects in Fig. 12 are considered to be compact and have radio jets at scales smaller than a few hundred pc, which are smaller than typical X-ray jets. This is consistent with the expectation that X-ray jets produced via the IC/CMB process are larger than radio jets since the electrons that are responsible for X-ray emission have a longer cooling time than those responsible for radio emission (e.g. Harris & Krawczynski, 2007; Worrall, 2009).
6 summary and future work
6.1 Summary
We have investigated and confirmed the X-ray enhancements of HRLQs compared to their low-redshift counterparts using new and archival Chandra observations. We also found such X-ray enhancements in RLQs for the first time. Our key findings are summarized as the following:
-
1.
We combined the HRLQs selected by Wu13 and Zhu19 to construct a sample of 41 HRLQs at with complete X-ray coverage, pushing the optical flux limit to compared with previous studies (See Section 2.1). We obtained new Chandra Cycle 23 observations of six HRLQs at . Along with three archival objects, we analyzed the Chandra observations of nine HRLQs at and reported their X-ray properties in Table 3 (see Section 3.1).
-
2.
We searched the literature and constructed a sample of optically selected RLQs. The sample consists of the seven brightest (in rest-frame optical/UV bands) optically selected RLQs at with complete X-ray coverage (see Section 2.2). We also obtained new Chandra Cycle 23 observations of two RLQs at . Along with five archival objects, we analyzed and reported the X-ray properties of seven RLQs at in Table 4. Among the five archival objects, two (VIK J23183113 and PSO J172+18) have not been reported in the literature previously. The remaining three objects have been reanalyzed for consistency. All objects except for PSO J172+18, which only has XMM-Newton coverage (see Section 3.2), were observed by Chandra (see Section 3.1).
-
3.
The X-ray enhancement of HRLQs at compared to matched HRLQs at has been further confirmed. The distributions of HRLQs are shown to be different from those of HRLQs at a 4.90–5.33 statistical significance level. The factor of X-ray enhancement of HRLQs is constrained to be (see Section 4.1).
-
4.
We found an X-ray enhancement of RLQs at compared to matched RLQs at for the first time. The distributions of RLQs are shown to be different from those of RLQs at a 3.65–4.91 statistical significance level. The factor of X-ray enhancement of RLQs is (see Section 4.2).
-
5.
We constructed broadband SEDs of the nine newly added HRLQs and seven RLQs. We compared these with suitable composite SEDs at lower redshifts. The comparison results further support the X-ray enhancements of HRLQs and RLQs (see Section 4.3). The broadband SEDs of the remaining 32 HRLQs at can be found in Wu13 and Zhu19.
-
6.
We found that the RLQs at have a median X-ray power-law spectral index () of , which is significantly steeper than that of RLQs at lower redshifts, , given by Zhu et al. (2021).
6.2 Future work
The number of luminous RLQs at very high redshifts () has been increasing rapidly with the aid of wide-field sky surveys in the optical-to-NIR bands (e.g. Pan-STARRS, Chambers et al., 2016; UKIDSS, Lawrence et al., 2007; and VHS, McMahon et al., 2013) and at radio frequencies (e.g. RACS, McConnell et al., 2020; and LoTSS-DR2, Shimwell et al., 2022). During the writing process of this paper, several new RLQs at have been identified (Bañados et al., 2023; Ighina et al., 2023). The upcoming Vera C. Rubin Observatory Legacy Survey of Space and Time (Ivezić et al., 2019), together with Euclid and the Roman Space Telescope, are expected to discover even more quasars, pushing the redshift frontier of quasars to –10. Their radio properties could be constrained by ongoing sensitive radio surveys including VLASS (Lacy et al., 2020) and EMU (Norris et al., 2021). Thus, the number of RLQs at is expected to be significantly increased in the near future. With the increasing number of RLQs, one could possibly form a sample of HRLQs at as well.
While our results for HRLQs can still be explained by the fractional IC/CMB model, it is possible that there are additional mechanisms that are responsible for the X-ray enhancement of RLQs. Our understanding of RLQs/HRLQs at is greatly limited by low X-ray count numbers and the small sample size. Deeper X-ray observations of objects in our sample will be valuable to set tighter constraints on their X-ray spectral properties. In addition, investigating the X-ray properties of larger samples of RLQs/HRLQs with Chandra and XMM-Newton could provide insights into the X-ray emission mechanisms of RLQs/HRLQs and the evolution of SMBHs in the first billion years of the Universe.
Acknowledgements
We thank the second referee for constructive feedback. We acknowledge support from the Chandra X-ray Center grant GO2-23083X and Penn State ACIS Instrument Team Contract SV4-74018 (issued by the Chandra X-ray Center, which is operated by the Smithsonian Astrophysical Observatory for and on behalf of NASA under contract NAS8-03060). S.F.Z. and Y.Q.X. acknowledge support from NSFC grants (12025303 and 11890693). The Chandra ACIS Team Guaranteed Time Observations (GTO) utilized were selected by the ACIS Instrument Principal Investigator, Gordon P. Garmire, currently of the Huntingdon Institute for X-ray Astronomy, LLC, which is under contract to the Smithsonian Astrophysical Observatory via Contract SV2-82024.
Data Availability
The raw data of all objects except SDSS J104742.57+094744.9 are publicly available in the Chandra Data Archive (https://cxc.cfa.harvard.edu/cda/) and the XMM-Newton Science Archive (http://nxsa.esac.esa.int/nxsa-web/#home). The raw data of SDSS J104742.57+094744.9 will be shared on reasonable request to the corresponding author. The reduced data generated in this research will be shared on reasonable request to the corresponding author.
References
- Amirkhanyan & Mikhailov (2006) Amirkhanyan V. R., Mikhailov V. P., 2006, Astrophysics, 49, 184
- Bañados et al. (2015) Bañados E., et al., 2015, ApJ, 804, 118
- Bañados et al. (2021) Bañados E., et al., 2021, ApJ, 909, 80
- Bañados et al. (2023) Bañados E., et al., 2023, ApJS, 265, 29
- Bassett et al. (2004) Bassett L. C., Brandt W. N., Schneider D. P., Vignali C., Chartas G., Garmire G. P., 2004, AJ, 128, 523
- Becker et al. (1995) Becker R. H., White R. L., Helfand D. J., 1995, ApJ, 450, 559
- Belladitta et al. (2020) Belladitta S., et al., 2020, A&A, 635, L7
- Błażejowski et al. (2004) Błażejowski M., Siemiginowska A., Sikora M., Moderski R., Bechtold J., 2004, ApJ, 600, L27
- Bloom & Marscher (1996) Bloom S. D., Marscher A. P., 1996, ApJ, 461, 657
- Brandt et al. (2002) Brandt W. N., et al., 2002, ApJ, 569, L5
- Breiding et al. (2017) Breiding P., Meyer E. T., Georganopoulos M., Keenan M. E., DeNigris N. S., Hewitt J., 2017, ApJ, 849, 95
- Brown et al. (2006) Brown M. J. I., et al., 2006, ApJ, 638, 88
- Cao et al. (2017) Cao H. M., Frey S., Gabányi K. É., Paragi Z., Yang J., Cseh D., Hong X. Y., An T., 2017, MNRAS, 467, 950
- Celotti et al. (2001) Celotti A., Ghisellini G., Chiaberge M., 2001, MNRAS, 321, L1
- Chambers et al. (2016) Chambers K. C., et al., 2016, arXiv e-prints, p. arXiv:1612.05560
- Chartas et al. (2000) Chartas G., et al., 2000, ApJ, 542, 655
- Condon et al. (1998) Condon J. J., Cotton W. D., Greisen E. W., Yin Q. F., Perley R. A., Taylor G. B., Broderick J. J., 1998, AJ, 115, 1693
- Connor et al. (2021) Connor T., et al., 2021, ApJ, 911, 120
- Coppejans et al. (2016) Coppejans R., et al., 2016, MNRAS, 463, 3260
- Croom et al. (2004) Croom S. M., Smith R. J., Boyle B. J., Shanks T., Miller L., Outram P. J., Loaring N. S., 2004, MNRAS, 349, 1397
- Dadina et al. (2016) Dadina M., Vignali C., Cappi M., Lanzuisi G., Ponti G., De Marco B., Chartas G., Giustini M., 2016, A&A, 592, A104
- Davidson-Pilon (2023) Davidson-Pilon C., 2023, lifelines, survival analysis in Python, doi:10.5281/zenodo.7883870, https://doi.org/10.5281/zenodo.7883870
- Dermer & Schlickeiser (1993) Dermer C. D., Schlickeiser R., 1993, ApJ, 416, 458
- Dey et al. (2019) Dey A., et al., 2019, AJ, 157, 168
- Dogruel et al. (2020) Dogruel M. B., Dai X., Guerras E., Cornachione M., Morgan C. W., 2020, ApJ, 894, 153
- Douglas et al. (1996) Douglas J. N., Bash F. N., Bozyan F. A., Torrence G. W., Wolfe C., 1996, AJ, 111, 1945
- Dunlop & Peacock (1990) Dunlop J. S., Peacock J. A., 1990, MNRAS, 247, 19
- Dye et al. (2018) Dye S., et al., 2018, MNRAS, 473, 5113
- Edge et al. (2013) Edge A., Sutherland W., Kuijken K., Driver S., McMahon R., Eales S., Emerson J. P., 2013, The Messenger, 154, 32
- Fan et al. (2004) Fan X., et al., 2004, AJ, 128, 515
- Fan et al. (2022) Fan X., Banados E., Simcoe R. A., 2022, arXiv e-prints, p. arXiv:2212.06907
- Frey et al. (2003) Frey S., Mosoni L., Paragi Z., Gurvits L. I., 2003, MNRAS, 343, L20
- Frey et al. (2010) Frey S., Paragi Z., Gurvits L. I., Cseh D., Gabányi K. É., 2010, A&A, 524, A83
- Frey et al. (2011) Frey S., Paragi Z., Gurvits L. I., Gabányi K. É., Cseh D., 2011, A&A, 531, L5
- Frey et al. (2015) Frey S., Paragi Z., Fogasy J. O., Gurvits L. I., 2015, MNRAS, 446, 2921
- Frey et al. (2018) Frey S., Titov O., Melnikov A. E., de Vicente P., Shu F., 2018, A&A, 618, A68
- Ghisellini & Tavecchio (2009) Ghisellini G., Tavecchio F., 2009, MNRAS, 397, 985
- Gibson et al. (2009) Gibson R. R., Brandt W. N., Gallagher S. C., Schneider D. P., 2009, ApJ, 696, 924
- Gordon et al. (2016) Gordon D., et al., 2016, AJ, 151, 154
- Gordon et al. (2021) Gordon Y. A., et al., 2021, ApJS, 255, 30
- Gregory et al. (1996) Gregory P. C., Scott W. K., Douglas K., Condon J. J., 1996, ApJS, 103, 427
- HI4PI Collaboration et al. (2016) HI4PI Collaboration et al., 2016, A&A, 594, A116
- Haardt & Maraschi (1993) Haardt F., Maraschi L., 1993, ApJ, 413, 507
- Hall et al. (2002) Hall P. B., et al., 2002, ApJS, 141, 267
- Harris & Krawczynski (2007) Harris D. E., Krawczynski H., 2007, in Revista Mexicana de Astronomia y Astrofisica, vol. 27. p. 188 (arXiv:astro-ph/0604527), doi:10.48550/arXiv.astro-ph/0604527
- Hunt et al. (2021) Hunt L. R., Johnson M. C., Cigan P. J., Gordon D., Spitzak J., 2021, AJ, 162, 121
- Ighina et al. (2019) Ighina L., Caccianiga A., Moretti A., Belladitta S., Della Ceca R., Ballo L., Dallacasa D., 2019, MNRAS, 489, 2732
- Ighina et al. (2021) Ighina L., Caccianiga A., Moretti A., Belladitta S., Della Ceca R., Diana A., 2021, MNRAS, 505, 4120
- Ighina et al. (2022a) Ighina L., et al., 2022a, A&A, 659, A93
- Ighina et al. (2022b) Ighina L., et al., 2022b, A&A, 663, A73
- Ighina et al. (2023) Ighina L., Caccianiga A., Moretti A., Belladitta S., Broderick J. W., Drouart G., Leung J. K., Seymour N., 2023, MNRAS, 519, 2060
- Intema et al. (2017) Intema H. T., Jagannathan P., Mooley K. P., Frail D. A., 2017, A&A, 598, A78
- Ivezić et al. (2019) Ivezić Ž., et al., 2019, ApJ, 873, 111
- Jiang et al. (2007) Jiang L., Fan X., Vestergaard M., Kurk J. D., Walter F., Kelly B. C., Strauss M. A., 2007, AJ, 134, 1150
- Just et al. (2007) Just D. W., Brandt W. N., Shemmer O., Steffen A. T., Schneider D. P., Chartas G., Garmire G. P., 2007, ApJ, 665, 1004
- Kellermann et al. (1989) Kellermann K. I., Sramek R., Schmidt M., Shaffer D. B., Green R., 1989, AJ, 98, 1195
- Khusanova et al. (2022) Khusanova Y., et al., 2022, A&A, 664, A39
- Krezinger et al. (2022) Krezinger M., et al., 2022, ApJS, 260, 49
- Lacy et al. (2020) Lacy M., et al., 2020, PASP, 132, 035001
- Lawrence et al. (2007) Lawrence A., et al., 2007, MNRAS, 379, 1599
- Li & Ma (1983) Li T. P., Ma Y. Q., 1983, ApJ, 272, 317
- Li et al. (2020) Li Q., et al., 2020, ApJ, 900, 12
- Lian Lim (2020) Lian Lim P., 2020, synphot, Zenodo, doi:10.5281/zenodo.3971036
- Liu et al. (2021) Liu Y., et al., 2021, ApJ, 908, 124
- Lopez et al. (2006) Lopez L. A., Brandt W. N., Vignali C., Schneider D. P., Chartas G., Garmire G. P., 2006, AJ, 131, 1914
- Marocco et al. (2021) Marocco F., et al., 2021, ApJS, 253, 8
- Marshall et al. (2005) Marshall H. L., et al., 2005, ApJS, 156, 13
- Marshall et al. (2011) Marshall H. L., et al., 2011, ApJS, 193, 15
- Marshall et al. (2018) Marshall H. L., et al., 2018, ApJ, 856, 66
- McConnell et al. (2020) McConnell D., et al., 2020, Publ. Astron. Soc. Australia, 37, e048
- McGreer et al. (2006) McGreer I. D., Becker R. H., Helfand D. J., White R. L., 2006, ApJ, 652, 157
- McMahon et al. (2013) McMahon R. G., Banerji M., Gonzalez E., Koposov S. E., Bejar V. J., Lodieu N., Rebolo R., VHS Collaboration 2013, The Messenger, 154, 35
- Medvedev et al. (2020) Medvedev P., et al., 2020, MNRAS, 497, 1842
- Medvedev et al. (2021) Medvedev P., Gilfanov M., Sazonov S., Schartel N., Sunyaev R., 2021, MNRAS, 504, 576
- Meyer et al. (2015) Meyer E. T., Georganopoulos M., Sparks W. B., Godfrey L., Lovell J. E. J., Perlman E., 2015, ApJ, 805, 154
- Meyer et al. (2016) Meyer E. T., et al., 2016, ApJ, 818, 195
- Miller et al. (2011) Miller B. P., Brandt W. N., Schneider D. P., Gibson R. R., Steffen A. T., Wu J., 2011, ApJ, 726, 20
- Momjian et al. (2004) Momjian E., Petric A. O., Carilli C. L., 2004, AJ, 127, 587
- Momjian et al. (2018) Momjian E., Carilli C. L., Bañados E., Walter F., Venemans B. P., 2018, ApJ, 861, 86
- Momjian et al. (2021) Momjian E., Bañados E., Carilli C. L., Walter F., Mazzucchelli C., 2021, AJ, 161, 207
- Mullin & Hardcastle (2009) Mullin L. M., Hardcastle M. J., 2009, MNRAS, 398, 1989
- Nanni et al. (2017) Nanni R., Vignali C., Gilli R., Moretti A., Brandt W. N., 2017, A&A, 603, A128
- Norris et al. (2011) Norris R. P., et al., 2011, Publ. Astron. Soc. Australia, 28, 215
- Norris et al. (2021) Norris R. P., et al., 2021, Publ. Astron. Soc. Australia, 38, e046
- Padovani (2017) Padovani P., 2017, Nature Astronomy, 1, 0194
- Pâris et al. (2018) Pâris I., et al., 2018, A&A, 613, A51
- Park et al. (2006) Park T., Kashyap V. L., Siemiginowska A., van Dyk D. A., Zezas A., Heinke C., Wargelin B. J., 2006, ApJ, 652, 610
- Perlman et al. (2011) Perlman E. S., et al., 2011, ApJ, 739, 65
- Petric et al. (2003) Petric A. O., Carilli C. L., Bertoldi F., Fan X., Cox P., Strauss M. A., Omont A., Schneider D. P., 2003, AJ, 126, 15
- Petrov (2013) Petrov L., 2013, AJ, 146, 5
- Petrov (2021) Petrov L., 2021, AJ, 161, 14
- Primini & Kashyap (2014) Primini F. A., Kashyap V. L., 2014, ApJ, 796, 24
- Pushkarev & Kovalev (2012) Pushkarev A. B., Kovalev Y. Y., 2012, A&A, 544, A34
- Rengelink et al. (1997) Rengelink R. B., Tang Y., de Bruyn A. G., Miley G. K., Bremer M. N., Roettgering H. J. A., Bremer M. A. R., 1997, A&AS, 124, 259
- Richards et al. (2006) Richards G. T., et al., 2006, AJ, 131, 2766
- Sambruna et al. (2004) Sambruna R. M., Gambill J. K., Maraschi L., Tavecchio F., Cerutti R., Cheung C. C., Urry C. M., Chartas G., 2004, ApJ, 608, 698
- Sambruna et al. (2006) Sambruna R. M., Gliozzi M., Tavecchio F., Maraschi L., Foschini L., 2006, ApJ, 652, 146
- Schneider et al. (2010) Schneider D. P., et al., 2010, AJ, 139, 2360
- Schwartz et al. (2000) Schwartz D. A., et al., 2000, ApJ, 540, 69
- Schwartz et al. (2021) Schwartz D., Spingola C., Barnacka A., 2021, ApJ, 917, 26
- Shang et al. (2011) Shang Z., et al., 2011, ApJS, 196, 2
- Shao et al. (2020) Shao Y., Wagg J., Wang R., Carilli C. L., Riechers D. A., Intema H. T., Weiss A., Menten K. M., 2020, A&A, 641, A85
- Shen et al. (2011) Shen Y., et al., 2011, ApJS, 194, 45
- Shen et al. (2019) Shen Y., et al., 2019, ApJ, 873, 35
- Shimwell et al. (2022) Shimwell T. W., et al., 2022, A&A, 659, A1
- Sikora et al. (1994) Sikora M., Begelman M. C., Rees M. J., 1994, ApJ, 421, 153
- Snios et al. (2020) Snios B., et al., 2020, ApJ, 899, 127
- Steffen et al. (2006) Steffen A. T., Strateva I., Brandt W. N., Alexander D. M., Koekemoer A. M., Lehmer B. D., Schneider D. P., Vignali C., 2006, AJ, 131, 2826
- Tavecchio et al. (2000) Tavecchio F., Maraschi L., Sambruna R. M., Urry C. M., 2000, ApJ, 544, L23
- Timlin et al. (2021) Timlin J., Zhu S., Brandt W. N., Laor A., 2021, Research Notes of the American Astronomical Society, 5, 101
- Vanden Berk et al. (2001) Vanden Berk D. E., et al., 2001, AJ, 122, 549
- Venemans et al. (2020) Venemans B. P., et al., 2020, ApJ, 904, 130
- Vito et al. (2019) Vito F., et al., 2019, A&A, 630, A118
- Wang et al. (2021) Wang F., et al., 2021, ApJ, 907, L1
- Willott et al. (2010) Willott C. J., et al., 2010, AJ, 139, 906
- Worrall (2009) Worrall D. M., 2009, A&ARv, 17, 1
- Worrall et al. (1987) Worrall D. M., Giommi P., Tananbaum H., Zamorani G., 1987, ApJ, 313, 596
- Wright et al. (2010) Wright E. L., et al., 2010, AJ, 140, 1868
- Wu et al. (2010) Wu J., Brandt W. N., Comins M. L., Gibson R. R., Shemmer O., Garmire G. P., Schneider D. P., 2010, ApJ, 724, 762
- Wu et al. (2013) Wu J., Brandt W. N., Miller B. P., Garmire G. P., Schneider D. P., Vignali C., 2013, ApJ, 763, 109
- Yang et al. (2016) Yang J., et al., 2016, ApJ, 829, 33
- York et al. (2000) York D. G., et al., 2000, AJ, 120, 1579
- Zamorani et al. (1981) Zamorani G., et al., 1981, ApJ, 245, 357
- Zappacosta et al. (2023) Zappacosta L., et al., 2023, arXiv e-prints, p. arXiv:2305.02347
- Zeimann et al. (2011) Zeimann G. R., White R. L., Becker R. H., Hodge J. A., Stanford S. A., Richards G. T., 2011, ApJ, 736, 57
- Zhang et al. (2022) Zhang Y., An T., Wang A., Frey S., Gurvits L. I., Gabányi K. É., Perger K., Paragi Z., 2022, A&A, 662, L2
- Zhu et al. (2019) Zhu S. F., Brandt W. N., Wu J., Garmire G. P., Miller B. P., 2019, MNRAS, 482, 2016
- Zhu et al. (2020) Zhu S. F., Brandt W. N., Luo B., Wu J., Xue Y. Q., Yang G., 2020, MNRAS, 496, 245
- Zhu et al. (2021) Zhu S. F., Timlin J. D., Brandt W. N., 2021, MNRAS, 505, 1954
| Object name | RA | DEC. | Instr. | Obs. date | Obs. ID | Exp.time | |
|---|---|---|---|---|---|---|---|
| (deg) | (deg) | (ks) | |||||
| Chandra Cycle 23 targets | |||||||
| PSO J055.424400.8035 | 55.4244 | ACIS-S | 5.68 | 2022/02/03 | 26029 | 13.18 | |
| SDSS J082511.60+123417.2 | 126.2983 | 12.5714 | ACIS-S | 4.377 | 2021/10/17 | 26025 | 6.20 |
| PSO J135.3860+16.2518 | 135.3860 | 16.2519 | ACIS-S | 5.63 | 2022/01/26 | 26030 | 12.74 |
| SDSS J104742.57+094744.9 | 161.9274 | 9.7958 | ACIS-S | 4.233 | 2023/03/12 | 26023 | 5.02 |
| SDSS J115605.44+444356.5 | 179.0223 | 44.7301 | ACIS-S | 4.310 | 2021/12/21 | 26027 | 7.78 |
| SDSS J125300.15+524803.3 | 193.2506 | 52.8009 | ACIS-S | 4.115 | 2021/11/10 | 26028 | 9.17 |
| SDSS J153830.71+424405.6 | 234.6280 | 42.7349 | ACIS-S | 4.099 | 2021/12/05 | 26026 | 6.67 |
| SDSS J165539.74+283406.7 | 253.9156 | 28.5685 | ACIS-S | 4.048 | 2021/12/05 | 26024 | 5.10 |
| Archival objects | |||||||
| SDSS J083643.85+005453.3 | 129.1829 | 0.9148 | ACIS-S | 5.82 | 2002/01/29 | 3359 | 5.68 |
| SDSS J094004.80+052630.9 | 145.0200 | 5.4419 | ACIS-S | 4.503 | 2017/12/31 | 20476 | 5.99 |
| PSO J172.3556+18.7734 | 172.3556 | 18.7734 | EPIC-pn | 6.82 | 2020/12/20 | 0863780101 | 94.03 |
| 2020/12/22 | 0863780201 | 89.73 | |||||
| SDSS J140025.40+314910.6 | 210.1058 | 31.8196 | ACIS-S | 4.690 | 2018/02/07 | 20480 | 5.99 |
| CFHQS J142952+544717 | 217.4671 | 54.7882 | ACIS-S | 6.18 | 2021/08/03 | 22601 | 30.56 |
| SDSS J154824.01+333500.1 | 237.1000 | 33.5834 | ACIS-S | 4.678 | 2018/02/11 | 20482 | 6.11 |
| VIKING J231818.35311346.3 | 349.5765 | 31.2295 | ACIS-S | 6.44 | 2022/01/07 | 25739 | 19.64 |
| 2022/01/08 | 26254 | 9.78 | |||||
| 2022/04/12 | 25254 | 9.94 | |||||
| 2022/04/17 | 26391 | 17.84 | |||||
| 2022/04/18 | 26392 | 9.94 | |||||
| PSO J352.403415.3373 | 352.4034 | -15.3373 | ACIS-S | 5.83 | 2019/08/19 | 21415 | 41.52 |
| 2019/08/21 | 22728 | 59.28 | |||||
| 2019/08/24 | 22729 | 45.46 | |||||
| 2019/08/25 | 22730 | 38.24 | |||||
| 2019/09/16 | 21416 | 19.06 | |||||
| 2019/09/17 | 22850 | 31.44 | |||||
| 2019/09/22 | 22851 | 29.88 | |||||
[b] Name Net X-ray counts HRa Full band Soft band Hard band (0.5–8 keV) (0.5–2 keV) (2–8 keV) Chandra Cycle 23 targets PSO J055.424400.8035 SDSS J082511.60+123417.2 PSO J135.3860+16.2518 SDSS J104742.57+094744.9 SDSS J115605.44+444356.5 SDSS J125300.15+524803.3 SDSS J153830.71+424405.6 - - SDSS J165539.74+283406.7 Archival objects SDSS J083643.85+005453.3 SDSS J094004.80+052630.9 PSO J172.3556+18.7734 b SDSS J140025.40+314910.6 CFHQS J142952+544717 SDSS J154824.01+333500.1 VIKING J231818.35311346.3 PSO J352.403415.3373
- a
-
b
The full, soft, and hard bands for PSO J172+18 are defined to be 0.3–4.5 keV, 0.3–1 keV, and 1–4.5 keV, respectively. See Section 3.2
[b] Object name C.R. (1) (2) (3) (4) (5) (6) (7) (8) (9) (10) (11) (12) (13) (14) (15) (16) Chandra Cycle 23 objects SDSS J082511.60+123417.2 20.71 4.47 0.27 30.97 33.92 2.82 SDSS J104742.57+094744.9 20.32 2.51 0.35 31.07 33.78 2.59 SDSS J115605.44+444356.5 21.06 1.24 0.18 30.79 34.50 3.59 SDSS J125300.15+524803.3 21.33 1.20 0.13 30.61 34.31 3.58 SDSS J153830.71+424405.6 20.76 2.36 - 0.22 30.85 33.68 2.71 SDSS J165539.74+283406.7 20.41 4.58 0.32 30.99 33.86 2.75 Archival objects SDSS J094004.80+052630.9 20.77 4.07 0.28 30.98 34.43 3.32 SDSS J140025.40+314910.6 20.28 1.15 0.35 31.13 34.05 2.81 SDSS J154824.01+333500.1 20.35 2.40 0.32 31.10 34.31 3.08
[b] Object name C.R. (1) (2) (3) (4) (5) (6) (7) (8) (9) (10) (11) (12) (13) (14) (15) (16) Chandra Cycle 23 Obejcts PSO J055.424400.8035 20.70 5.89 0.25 31.12 33.19 1.94 PSO J135.3860+16.2518 21.04 3.50 0.18 30.98 33.46 2.36 Archival Objects SDSS J083643.85+005453.3 18.77 4.81 - 33.07 1.21 PSO J172.3556+18.7734 21.68 3.48 - - 33.04 2.07 CFHQS J142952+544717 21.03 1.15 33.40 2.24 VIKING J231818.35311346.3 21.32 1.10 0.14 30.95 32.76 1.69 PSO J352.403415.3373 21.36 1.67 - 0.14 34.18 3.18
-
a
Flux in the observed frame 0.5–2 keV is calculated from the hard band (1–4.5 keV) count rate assuming .
| Object name | VLBI band | Ref. | ||||||||||||||
| (mJy) | (mJy) | (mJy) | (mJy) | (mJy) | (mJy) | (GHz) | (mJy) | (mJy) | (mas) | |||||||
| (1) | (2) | (3) | (4) | (5) | (6) | (7) | (8) | (9) | (10) | (11) | (12) | (13) | (14) | (15) | ||
| HRLQs at from this paper | ||||||||||||||||
| SDSS J0825+1234 | - | - | - | - | - | - | - | - | - | - | ||||||
| SDSS J0940+0526 | - | - | - | 1.7 | 18.3 | 50.4 | 1.91 | (a) | ||||||||
| SDSS J1047+0947 | - | - | - | - | - | - | - | - | ||||||||
| SDSS J1156+4443 | - | - | - | - | - | - | - | |||||||||
| SDSS J1253+5248 | - | - | - | - | - | - | - | |||||||||
| SDSS J1400+3149 | - | - | - | - | - | 1.7 | 10.7 | 17.4 | 3.01 | (a) | ||||||
| SDSS J1538+4244 | - | - | - | - | - | - | - | - | - | - | ||||||
| SDSS J1548+3335 | - | - | 1.7 | 10.0 | 32.8 | 1.76 | (a) | |||||||||
| SDSS J1655+2834 | - | - | - | - | - | - | - | - | - | |||||||
| HRLQs at from Wu13 and Zhu19 | ||||||||||||||||
| PSS 0121+0347 | - | - | - | - | 2.2 | 65.0 | 64.3 | - | (b) | |||||||
| B3 0254+434 | - | 2.3 | 353.0 | 246.8 | - | (c) | ||||||||||
| SDSS J0304+0046 | - | - | - | 1.7 | 15.0 | 19.4 | 4.78 | (d) | ||||||||
| PMN J03242918 | - | - | - | 2.3 | 238.0 | 199.2 | - | (a) | ||||||||
| PMN J05253343 | - | - | - | 4.3 | 71.0 | 83.0 | - | (e) | ||||||||
| SDSS J0813+3508 | - | - | 1.6 | 17.1 | 43.2 | 1.18 | (f) | |||||||||
| SDSS J0835+1825 | - | - | - | - | - | - | - | |||||||||
| Q0906+6930 | - | - | 2.3 | 118.3 | 97.5 | 0.98 | (g) | |||||||||
| SDSS J0913+5919 | - | - | - | - | - | 1.4 | 19.0 | 17.4 | 1.3 | (h) | ||||||
| SDSS J1021+2209 | - | - | 4.3 | 97.0 | 111.2 | - | (e) | |||||||||
| SDSS J1026+2542 | - | 1.7 | 137.5 | 213.6 | - | (i) | ||||||||||
| RX J10280844 | - | - | - | 2.3 | 147.0 | 163.0 | - | (j) | ||||||||
| SDSS J1113+4645 | - | - | - | - | - | - | - | |||||||||
| PMN J11553107 | - | - | - | - | - | 2.3 | 129.9 | 128.8 | - | (c) | ||||||
| SDSS J12350003 | - | - | - | - | - | 1.4 | 18.8 | 18.3 | (h) | |||||||
| SDSS J1237+6517 | - | - | - | - | - | - | - | |||||||||
| SDSS J1242+5422 | - | - | 1.6 | 17.7 | 17.7 | 0.67 | (f) | |||||||||
| CLASS J1325+1123 | - | - | - | - | 1.7 | 62.7 | 68.2 | 0.76 | (d) | |||||||
| SDSS J1348+1935 | - | - | - | - | - | - | - | |||||||||
| SDSS J1412+0624 | - | - | 1.7 | 18.8 | 41.5 | (d) | ||||||||||
| SDSS J1420+1205 | - | 1.7 | 47.9 | 76.8 | - | (k) | ||||||||||
| GB 1428+4217 | 2.3 | 150.0 | 253.9 | - | (l) | |||||||||||
| GB 1508+5714 | 2.3 | 276.6 | 264.6 | - | (l) | |||||||||||
| SDSS J1535+0254 | - | - | 5 | 68.0 | 53.1 | - | (r) | |||||||||
| SDSS J1605+2728 | - | - | - | - | - | - | - | - | ||||||||
| SDSS J1612+4702 | - | - | - | - | - | - | ||||||||||
[b] Object name VLBI band Ref. (mJy) (mJy) (mJy) (mJy) (mJy) (mJy) (GHz) (mJy) (mJy) (mas) (1) (2) (3) (4) (5) (6) (7) (8) (9) (10) (11) (12) (13) (14) (15) SDSS J1659+2101 - - - 1.6 29.3 27.7 3.07 (f) GB 1713+2148 - 4.3 55.0 318.8 - (e) PMN J1951+0134 - - 2.3 259.0 183.4 - (c) PMN J21340419 - - 1.7 236.6 306.2 1.42 (k) SDSS J2220+0025 - - 1.7 8.2 80.6 - (k) PMN J2314+0201 - - 5 77.6 83.6 - (r) RLQs at PSO J05500 - - - - - - - - - - SDSS J0836+0054 - - - - 1.6 1.1 1.5 - (m) PSO J135+16 - - - - - - - - - - PSO J172+18 - - - - - 1.5 0.50 5.9 (n) CFHQS J1429+5447 - - - - 1.6 3.3 2.8 2.63 (o) VIK J23183113 - - - 1.57 0.48 0.44 2.3 (p) PSO J35215 - - - 1.5 6.57 14.1 - (q)
-
a
of these objects are substantially larger than and . Use to calculate rather than the preferred .
-
b
Forced photometry using aegean.
-
c
of SDSS J083643.85+005453.3 is taken from Petric et al. (2003).
-
d
is calculated from and (; Shao et al., 2020).
-
e
A 3 upper limit obtained from Bañados et al. (2021).
-
f
is calculated from flux densities at observed-frame 1.52 GHz and 2.87 GHz obtained from simultaneous follow-up radio observations reported by Bañados et al. (2021) to avoid possible variability.
-
g
is the flux density at observed-frame 1.52 GHz taken from Bañados et al. (2021) instead of extrapolating from FIRST observation at 1.4 GHz to avoid possible variability.
-
h
is calculated from and Shimwell et al. (; LoTSS DR2, 2022).
-
i
of VIK J23183113 is the flux density at observed-frame 1367 MHz taken from the Rapid ASKAP Continuum Survey (RACS, McConnell et al., 2020).
-
j
of VIK J23183113 is taken from Ighina et al. (2022b), calculated from the VLASS Epoch 2 Quick Lood Image.
-
k
of VIK J23183113 is the flux density at observed-frame 5500 MHz taken from Ighina et al. (2022b).
-
l
is calculated from (0.89 mJy; EMU, Norris et al., 2011) and .