Supporting Information:
Electrical Scanning Probe Microscope Measurements Reveal
Surprisingly High Dark Conductivity in Y6 and PM6:Y6
and
Non-Langevin Recombination in PM6:Y6
Rachael L. Cohn
Department of Chemistry and Chemical Biology, Cornell University, Ithaca, New York 14853 USA
Christopher A. Petroff
Department of Chemistry and Chemical Biology, Cornell University, Ithaca, New York 14853 USA
Department of Materials Science and Engineering, Cornell University, Ithaca, New York 14853 USA
Virginia E. McGhee
Department of Chemistry and Chemical Biology, Cornell University, Ithaca, New York 14853 USA
John A. Marohn
Department of Chemistry and Chemical Biology, Cornell University, Ithaca, New York 14853 USA
The samples were illuminated from above using a variable intensity fiber-coupled red continuous wave diode laser (QPhotonics QFLD-635-30SAX).
The laser output was directed to the sample through a core diameter, multimode fiber (Thorlabs FG050LGA).
The cleaved end of the fiber was placed away from the sample and directed toward the cantilever tip at a angle relative to the sample surface.
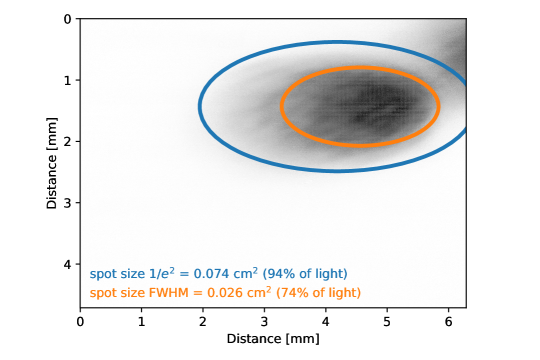
The laser spot size was measured using a CMOS sensor, utilizing a method similar to the literature [1].
In brief, a Raspberry Pi camera module (Seeed Studio model 114992442 with a Sony IMX477 CMOS sensor) was loaded and approached as a sample would be.
With the laser output set to , an image of the laser spot (Fig. S1) was captured and saved as an array.
The lmfit Python package [2] was used to fit the short axis of the elliptical spot to a Gaussian and the long axis (due to the angle of incident light) to a skewed Gaussian.
The SciPy Python package’s [3] signal module was used to determine both the width and the full width at half max (FWHM) of each fit.
The percent of the total light contained within each spot was estimated by integrating the fits using the Simpson function from SciPy’s integrate module.
We chose to use the FWHM spot size () for our light intensity calculations as we expect that the cantilever falls near the center of the laser beam.
The laser light intensity was estimated by multiplying the measured laser power (Coherent FieldMate 1098297 Laser Power Meter with OP-2 VIS 1098313 Si sensor) by the relative area under the curve for FWHM and dividing by the FWHM ellipse spot area.
Figure S1: Image of the laser spot used to illuminate the sample showing the (shown in \contourlength0.2exblue\contourwhiteblue ) and full width at half max (FWHM) (shown in \contourlength0.2exorange\contourwhiteorange ) spot sizes. The FWHM spot size was used to determine the incident light intensity.
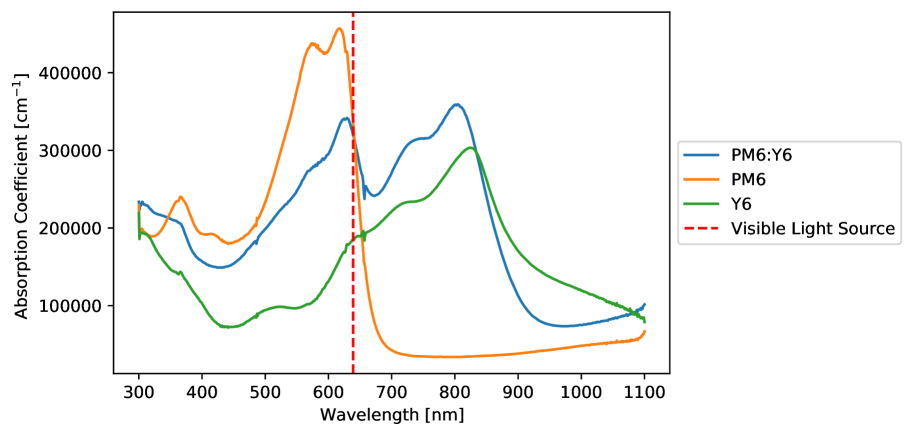
S-3 Absorption Coefficient
UV-Vis spectra of polymer films (Fig. S2) were collected using an Agilent Technologies Cary 8454 UV-Vis. Absorption coefficients match those found in literature within 25% [4, 5].
Figure S2: Absorption coefficient spectra for PM6:Y6, Y6, and PM6 calculated from the measured UV-Vis spectra.
Table S2: Disorder parameter values used to calculate average disorder found in main text Table IV.
How would charge density at steady state depend on the generation rate, , and therefore light intensity or laser power?
S-4.1 , no background charge density
Following Burke et al. [12], we have the rate equations
(S1a)
(S1b)
(S1c)
with and , where and are the background electron and hole concentration and and are the change in electron and hole density due to light; , , and are the rates at which carrier meet, split, and recombine respectively; and the generation rate , where is the generation rate due to light and is the thermal generation rate.
where is the visible light intensity, is the absorption coefficient, and is the photon energy. We get from the wavelength of the visible laser, 639.7 nm, = 1.94 eV. is estimated from the laser power and spot size.
Starting with Eqs. S2a–S2c, and assuming , we have
(S12a)
(S12b)
(S12c)
At steady state, Eqs. S12a–S12c equal zero, and we get
(S13)
(S14)
If ,
(S15)
In computing conductivity, let us neglect n. This assumption gives,
(S16)
In this case, conductivity is directly proportional to light intensity, which is what we see in our data.
S-5 Error Estimation
The error bars for the Langevin reduction factor were estimated as follows,
(S17)
where is the Langevin reduction factor; and are the slope and intercept for the linear fit of conductivity versus light intensity; , , and are the error for the Langevin reduction factor, slope, and intercept, respectively; and is the correlation coefficient.
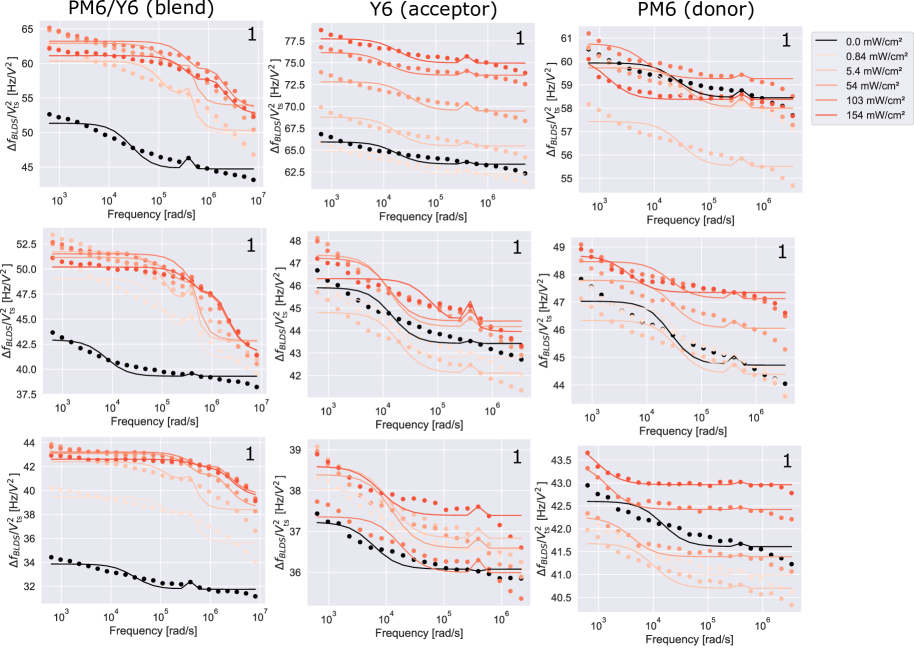
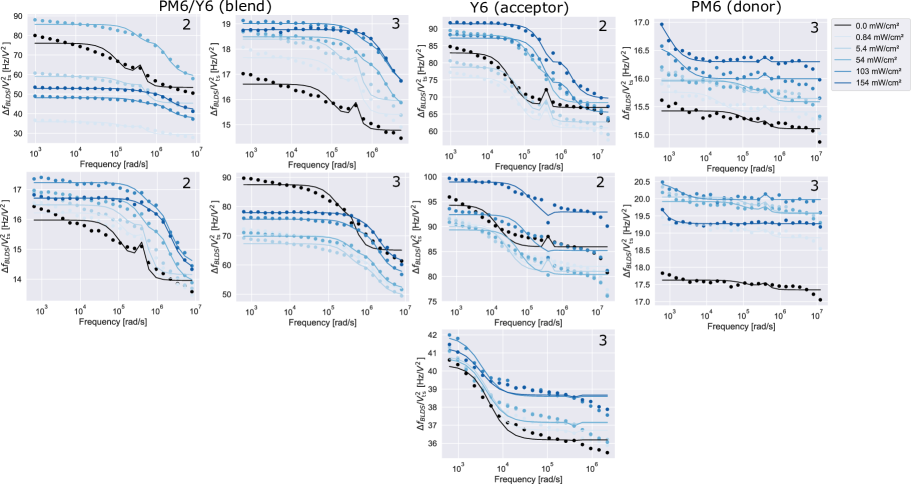
S-6 Broadband Local Dielectric Spectroscopy
Below are all of the BLDS spectra collected for the PM6:Y6 blend and controls, Y6 and PM6, both with (Fig. S3) and without (Fig. S4) the hole transport layer, PEDOT:PSS. The cantilever details for each spectra are listed in Table S3. The BLDS experiment is described by Tirmzi et al. [13], with the amplitude modulation frequency = 20 Hz and the peak-to-peak voltage applied = 2 V using a waveform generator (Keysight 33622A).
Cantilever Number
[kHz]
[nm]
Q
1
60.437
226.27
20202
2
63.670
157.44
19999
3
62.149
135.41
27778
Table S3: Details of all cantilevers (MikroMasch HQ:NSC18/Pt) used for the described experiments.
Figure S3: All BLDS spectra collected for samples containing the hole transport layer, PEDOT:PSS. Numbers in the upper right corner of each spectra correspond to the cantilever number that was used to collect those data.Figure S4: All BLDS spectra collected for samples without the hole transport layer. Numbers in the upper right corner of each spectra correspond to the cantilever number that was used to collect those data.
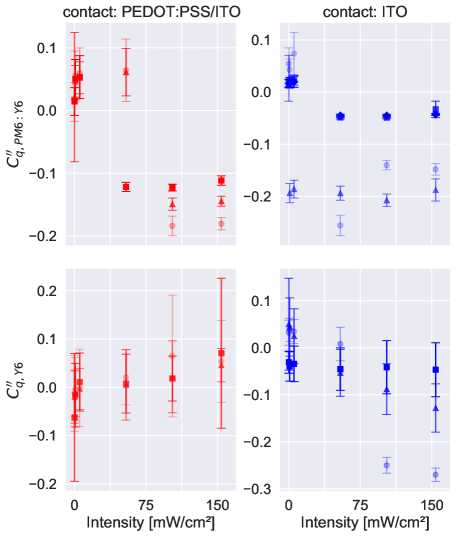
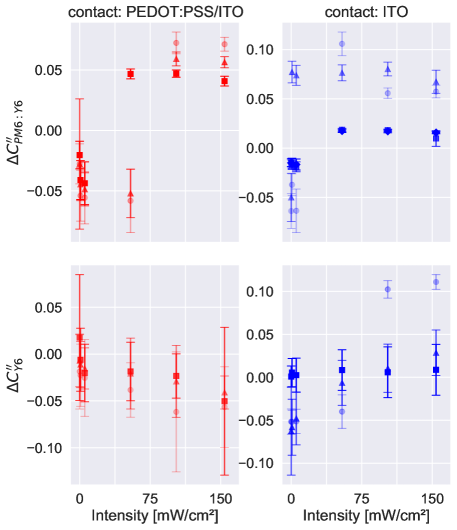
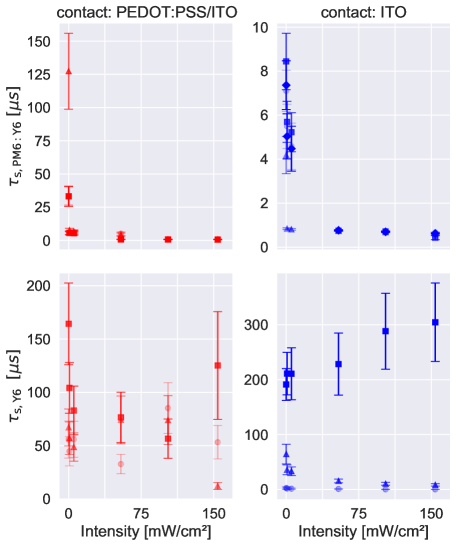
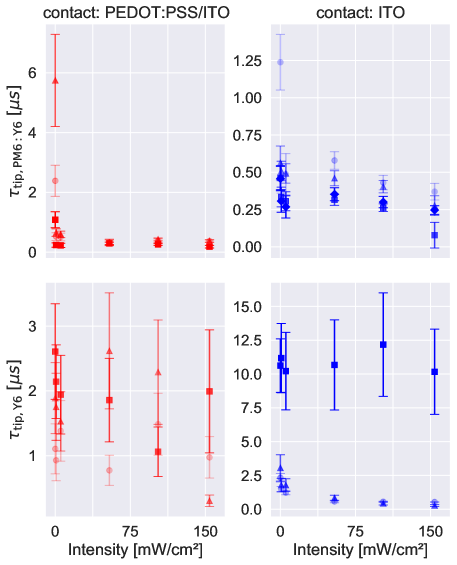
Figs. S5–S8 show BLDS fit parameters , , , and versus light intensity. Tables S4–S16 list the fit parameters as well.
Light Intensity
0 mW/cm2
5.45e-02 3.06e-02
-6.38e-02 1.77e-02
7.10e-06 9.41e-07
1.24e-06 1.87e-07
0.84 mW/cm2
4.30e-02 2.06e-02
-3.71e-02 1.10e-02
5.49e-06 1.01e-06
4.66e-07 1.05e-07
5.4 mW/cm2
7.40e-02 4.05e-02
-6.35e-02 2.21e-02
4.58e-06 1.05e-06
4.87e-07 1.38e-07
54 mW/cm2
-2.56e-01 1.95e-02
1.06e-01 1.19e-02
7.47e-07 2.72e-08
5.79e-07 5.88e-08
103 mW/cm2
-1.40e-01 8.95e-03
5.58e-02 5.28e-03
7.31e-07 2.52e-08
4.31e-07 4.89e-08
154 mW/cm2
-1.48e-01 1.12e-02
5.74e-02 6.46e-03
6.75e-07 3.27e-08
3.70e-07 5.57e-08
Table S4: Fit parameters for PM6:Y6/ITO, dataset.
Light Intensity
0 mW/cm2
2.65e-02 4.40e-02
-5.00e-02 2.44e-02
4.19e-06 8.46e-07
5.63e-07 1.14e-07
0.84 mW/cm2
-1.94e-01 1.84e-02
7.72e-02 1.10e-02
8.42e-07 4.09e-08
5.09e-07 6.62e-08
5.4 mW/cm2
-1.86e-01 1.71e-02
7.39e-02 1.02e-02
8.12e-07 3.61e-08
4.92e-07 6.49e-08
54 mW/cm2
-1.94e-01 1.36e-02
7.64e-02 8.03e-03
7.54e-07 2.44e-08
4.60e-07 5.05e-08
103 mW/cm2
-2.07e-01 1.20e-02
8.03e-02 6.97e-03
6.81e-07 2.11e-08
4.04e-07 4.16e-08
154 mW/cm2
-1.88e-01 2.13e-02
6.73e-02 1.17e-02
6.00e-07 4.65e-08
2.77e-07 6.65e-08
Table S5: Fit parameters for PM6:Y6/ITO, dataset.
Light Intensity
0 mW/cm2
1.60e-02 7.43e-03
-1.47e-02 3.90e-03
8.44e-06 1.28e-06
4.64e-07 8.10e-08
0.84 mW/cm2
1.97e-02 8.78e-03
-1.70e-02 4.61e-03
5.70e-06 9.32e-07
3.34e-07 6.61e-08
5.4 mW/cm2
2.29e-02 9.47e-03
-1.89e-02 4.97e-03
5.22e-06 8.85e-07
3.06e-07 6.37e-08
54 mW/cm2
-4.88e-02 2.68e-03
1.86e-02 1.52e-03
7.53e-07 2.33e-08
3.15e-07 3.72e-08
103 mW/cm2
-4.91e-02 1.92e-03
1.83e-02 1.07e-03
7.16e-07 1.81e-08
2.62e-07 2.55e-08
154 mW/cm2
-3.31e-02 1.57e-02
9.83e-03 8.00e-03
4.33e-07 8.89e-08
7.80e-08 8.58e-08
Table S6: Fit parameters for PM6:Y6/ITO, dataset.
Light Intensity
0 mW/cm2
1.68e-02 7.41e-03
-1.49e-02 3.91e-03
7.36e-06 1.11e-06
4.58e-07 8.19e-08
0.84 mW/cm2
1.75e-02 9.64e-03
-1.53e-02 5.07e-03
5.03e-06 1.02e-06
3.07e-07 7.52e-08
5.4 mW/cm2
1.98e-02 1.07e-02
-1.66e-02 5.60e-03
4.48e-06 1.02e-06
2.68e-07 7.43e-08
54 mW/cm2
-4.52e-02 2.86e-03
1.75e-02 1.65e-03
7.71e-07 2.63e-08
3.53e-07 4.39e-08
103 mW/cm2
-4.53e-02 2.58e-03
1.71e-02 1.46e-03
7.01e-07 2.54e-08
3.00e-07 3.83e-08
154 mW/cm2
-4.26e-02 1.93e-03
1.57e-02 1.07e-03
6.28e-07 2.52e-08
2.47e-07 2.90e-08
Table S7: Fit parameters for PM6:Y6/ITO, dataset.
Light Intensity
0 mW/cm2
3.21e-02 2.67e-02
-5.17e-02 1.48e-02
2.58e-06 2.05e-06
2.33e-06 3.15e-07
0.84 mW/cm2
3.82e-02 2.46e-02
-5.20e-02 1.36e-02
1.61e-06 1.48e-06
1.48e-06 1.98e-07
5.4 mW/cm2
3.47e-02 2.54e-02
-5.14e-02 1.41e-02
1.24e-06 1.15e-06
1.23e-06 1.61e-07
54 mW/cm2
8.20e-03 3.54e-02
-4.00e-02 1.95e-02
7.81e-07 3.25e-07
5.74e-07 9.57e-08
103 mW/cm2
-2.50e-01 1.68e-02
1.02e-01 1.01e-02
3.92e-08 1.72e-07
5.54e-07 4.66e-08
154 mW/cm2
-2.70e-01 1.42e-02
1.11e-01 8.58e-03
2.53e-08 1.24e-07
5.33e-07 3.85e-08
Table S8: Fit parameters for Y6/ITO, dataset.
Light Intensity
0 mW/cm2
5.02e-02 9.78e-02
-6.26e-02 5.12e-02
6.43e-05 1.80e-05
3.05e-06 9.74e-07
0.84 mW/cm2
4.42e-02 6.20e-02
-5.81e-02 3.26e-02
3.57e-05 8.91e-06
1.79e-06 4.93e-07
5.4 mW/cm2
2.49e-02 5.82e-02
-4.80e-02 3.07e-02
3.31e-05 7.93e-06
1.78e-06 4.69e-07
54 mW/cm2
-5.34e-02 4.98e-02
-6.47e-03 2.62e-02
1.54e-05 3.49e-06
8.30e-07 2.01e-07
103 mW/cm2
-8.81e-02 5.40e-02
1.05e-02 2.81e-02
1.02e-05 2.67e-06
4.29e-07 1.16e-07
154 mW/cm2
-1.28e-01 5.14e-02
2.85e-02 2.65e-02
8.25e-06 2.19e-06
2.73e-07 7.09e-08
Table S9: Fit parameters for Y6/ITO, dataset.
Light Intensity
0 mW/cm2
-3.07e-02 2.34e-02
8.66e-04 1.23e-02
1.91e-04 2.89e-05
1.06e-05 1.98e-06
0.84 mW/cm2
-3.97e-02 3.13e-02
5.43e-03 1.65e-02
2.11e-04 3.87e-05
1.12e-05 2.56e-06
5.4 mW/cm2
-3.42e-02 3.79e-02
2.51e-03 1.98e-02
2.11e-04 4.73e-05
1.02e-05 2.86e-06
54 mW/cm2
-4.54e-02 4.53e-02
8.37e-03 2.37e-02
2.28e-04 5.65e-05
1.07e-05 3.33e-06
103 mW/cm2
-4.14e-02 5.66e-02
5.82e-03 2.95e-02
2.88e-04 6.92e-05
1.22e-05 3.83e-06
154 mW/cm2
-4.66e-02 5.74e-02
8.70e-03 2.97e-02
3.05e-04 7.15e-05
1.02e-05 3.15e-06
Table S10: Fit parameters Y6/ITO, dataset.
Light Intensity
0 mW/cm2
1.37e-02 3.09e-02
-2.77e-02 1.66e-02
3.35e-05 6.76e-06
2.39e-06 5.22e-07
0.84 mW/cm2
5.57e-02 3.91e-02
-5.40e-02 2.10e-02
5.92e-06 1.25e-06
5.18e-07 1.29e-07
5.4 mW/cm2
5.94e-02 4.04e-02
-5.57e-02 2.16e-02
6.21e-06 1.34e-06
5.05e-07 1.29e-07
54 mW/cm2
6.41e-02 4.98e-02
-5.82e-02 2.63e-02
5.13e-06 1.38e-06
3.31e-07 1.06e-07
103 mW/cm2
-1.84e-01 1.55e-02
7.25e-02 8.99e-03
8.18e-07 3.98e-08
3.80e-07 6.34e-08
154 mW/cm2
-1.81e-01 9.77e-03
7.14e-02 5.69e-03
8.15e-07 2.69e-08
3.71e-07 4.18e-08
Table S11: Fit parameters for PM6:Y6/PEDOT:PSS/ITO, dataset.
Light Intensity
0 mW/cm2
2.13e-02 1.03e-01
-2.78e-02 5.39e-02
1.27e-04 2.86e-05
5.75e-06 1.54e-06
0.84 mW/cm2
4.65e-02 2.52e-02
-4.46e-02 1.36e-02
7.81e-06 1.29e-06
6.51e-07 1.25e-07
5.4 mW/cm2
5.22e-02 2.55e-02
-4.87e-02 1.37e-02
6.80e-06 1.06e-06
5.93e-07 1.09e-07
54 mW/cm2
6.11e-02 3.78e-02
-5.21e-02 2.00e-02
4.49e-06 1.16e-06
3.14e-07 9.71e-08
103 mW/cm2
-1.49e-01 9.80e-03
5.92e-02 5.76e-03
8.10e-07 2.83e-08
4.24e-07 4.91e-08
154 mW/cm2
-1.44e-01 7.91e-03
5.65e-02 4.58e-03
7.39e-07 2.47e-08
3.69e-07 4.14e-08
Table S12: Fit parameters for PM6:Y6/PEDOT:PSS/ITO, dataset.
Light Intensity
0 mW/cm2
1.44e-02 2.21e-02
-2.04e-02 1.14e-02
3.32e-05 7.54e-06
1.08e-06 2.68e-07
0.84 mW/cm2
5.01e-02 3.11e-02
-4.10e-02 1.61e-02
5.63e-06 1.42e-06
2.37e-07 7.37e-08
5.4 mW/cm2
5.31e-02 3.42e-02
-4.37e-02 1.77e-02
5.50e-06 1.43e-06
2.25e-07 7.24e-08
54 mW/cm2
-1.22e-01 7.22e-03
4.68e-02 4.10e-03
7.90e-07 3.23e-08
2.92e-07 4.36e-08
103 mW/cm2
-1.23e-01 5.31e-03
4.70e-02 3.00e-03
7.62e-07 2.80e-08
2.59e-07 3.25e-08
154 mW/cm2
-1.12e-01 7.49e-03
4.08e-02 4.08e-03
6.48e-07 5.44e-08
1.81e-07 4.36e-08
Table S13: Fit parameters for PM6:Y6/PEDOT:PSS/ITO, dataset.
Light Intensity
0 mW/cm2
-1.24e-02 7.86e-02
-1.86e-02 4.01e-02
5.57e-05 1.74e-05
1.11e-06 3.86e-07
0.84 mW/cm2
-3.76e-03 6.52e-02
-2.26e-02 3.33e-02
4.48e-05 1.37e-05
9.29e-07 3.14e-07
5.4 mW/cm2
-1.15e-03 8.00e-02
-2.55e-02 4.10e-02
5.60e-05 1.69e-05
1.38e-06 4.66e-07
54 mW/cm2
2.09e-02 5.69e-02
-3.83e-02 2.91e-02
3.27e-05 9.05e-06
7.74e-07 2.32e-07
103 mW/cm2
6.49e-02 1.26e-01
-6.17e-02 6.41e-02
8.53e-05 2.38e-05
1.49e-06 4.79e-07
154 mW/cm2
5.36e-02 8.47e-02
-5.66e-02 4.31e-02
5.32e-05 1.56e-05
9.75e-07 3.20e-07
Table S14: Fit parameters for Y6/PEDOT:PSS/ITO, dataset.
Light Intensity
0 mW/cm2
-2.02e-02 5.41e-02
-7.10e-03 2.78e-02
6.71e-05 1.73e-05
1.89e-06 5.48e-07
0.84 mW/cm2
-1.19e-02 4.78e-02
-1.12e-02 2.46e-02
5.70e-05 1.52e-05
1.75e-06 5.20e-07
5.4 mW/cm2
-3.43e-03 4.25e-02
-1.54e-02 2.19e-02
4.87e-05 1.33e-05
1.53e-06 4.58e-07
54 mW/cm2
5.05e-03 7.30e-02
-2.08e-02 3.78e-02
7.42e-05 2.24e-05
2.62e-06 8.95e-07
103 mW/cm2
2.17e-02 7.44e-02
-2.92e-02 3.84e-02
7.40e-05 2.30e-05
2.29e-06 8.05e-07
154 mW/cm2
4.58e-02 3.44e-02
-4.10e-02 1.76e-02
1.22e-05 3.26e-06
3.05e-07 8.84e-08
Table S15: Fit parameters for Y6/PEDOT:PSS/ITO, dataset.
Light Intensity
0 mW/cm2
-6.23e-02 1.32e-01
1.76e-02 6.72e-02
1.64e-04 3.83e-05
2.61e-06 7.38e-07
0.84 mW/cm2
-1.63e-02 6.59e-02
-6.09e-03 3.36e-02
1.04e-04 2.38e-05
2.14e-06 5.68e-07
5.4 mW/cm2
1.10e-02 6.01e-02
-2.02e-02 3.07e-02
8.30e-05 2.28e-05
1.94e-06 6.07e-07
54 mW/cm2
7.81e-03 6.09e-02
-1.86e-02 3.12e-02
7.65e-05 2.36e-05
1.86e-06 6.45e-07
103 mW/cm2
1.82e-02 4.64e-02
-2.34e-02 2.37e-02
5.65e-05 1.84e-05
1.06e-06 3.82e-07
154 mW/cm2
7.05e-02 1.55e-01
-5.04e-02 7.89e-02
1.25e-04 5.05e-05
1.99e-06 9.49e-07
Table S16: Fit parameters for Y6/PEDOT:PSS/ITO, dataset.
Dataset:
Light Intensity
[]
[F]
[]
[F]
[]
[F]
[]
[F]
0 mW/cm2
2.55E+11
2.79E-17
1.16E+11
3.62E-17
9.56E+10
8.83E-17
9.42E+10
7.82E-17
0.84 mW/cm2
9.59E+10
5.73E-17
1.05E+11
8.04E-18
6.88E+10
8.28E-17
6.32E+10
7.97E-17
5.4 mW/cm2
1.00E+11
4.57E-17
1.01E+11
8.02E-18
6.29E+10
8.31E-17
5.52E+10
8.11E-17
54 mW/cm2
1.19E+11
6.27E-18
9.47E+10
7.96E-18
6.49E+10
1.16E-17
7.26E+10
1.06E-17
103 mW/cm2
8.86E+10
8.25E-18
8.31E+10
8.20E-18
5.40E+10
1.33E-17
6.18E+10
1.13E-17
154 mW/cm2
7.61E+10
8.87E-18
5.69E+10
1.05E-17
1.61E+10
2.70E-17
5.07E+10
1.24E-17
Table S17: and at each light intensity for all PM6:Y6/ITO samples.
Dataset:
Light Intensity
[]
[F]
[]
[F]
[]
[F]
0 mW/cm2
4.79E+11
5.39E-18
6.28E+11
1.02E-16
2.19E+12
8.75E-17
0.84 mW/cm2
3.05E+11
5.29E-18
3.68E+11
9.72E-17
2.30E+12
9.18E-17
5.4 mW/cm2
2.53E+11
4.91E-18
3.66E+11
9.04E-17
2.10E+12
1.00E-16
54 mW/cm2
1.18E+11
6.61E-18
1.71E+11
9.02E-17
2.20E+12
1.04E-16
103 mW/cm2
1.14E+11
3.44E-19
8.82E+10
1.16E-16
2.51E+12
1.15E-16
154 mW/cm2
1.10E+11
2.31E-19
5.62E+10
1.47E-16
2.09E+12
1.46E-16
Table S18: and at each light intensity for all Y6/ITO samples.
Dataset:
Light Intensity
[]
[F]
[]
[F]
[]
[F]
0 mW/cm2
4.91E+11
6.83E-17
1.18E+12
1.08E-16
2.23E+11
1.49E-16
0.84 mW/cm2
1.07E+11
5.56E-17
1.34E+11
5.83E-17
4.87E+10
1.16E-16
5.4 mW/cm2
1.04E+11
5.98E-17
1.22E+11
5.58E-17
4.63E+10
1.19E-16
54 mW/cm2
6.81E+10
7.52E-17
6.45E+10
6.96E-17
6.00E+10
1.32E-17
103 mW/cm2
7.82E+10
1.05E-17
8.72E+10
9.29E-18
5.32E+10
1.43E-17
154 mW/cm2
7.63E+10
1.07E-17
7.59E+10
9.73E-18
3.72E+10
1.74E-17
Table S19: and at each light intensity for all PM6:Y6/PEDOT:PSS/ITO samples.
Dataset:
Light Intensity
[]
[F]
[]
[F]
[]
[F]
0 mW/cm2
2.27E+11
2.45E-16
3.89E+11
1.73E-16
5.36E+11
3.06E-16
0.84 mW/cm2
1.91E+11
2.34E-16
3.61E+11
1.58E-16
4.41E+11
2.36E-16
5.4 mW/cm2
2.84E+11
1.97E-16
3.15E+11
1.55E-16
4.00E+11
2.08E-16
54 mW/cm2
1.59E+11
2.06E-16
5.38E+11
1.38E-16
3.82E+11
2.00E-16
103 mW/cm2
3.06E+11
2.79E-16
4.71E+11
1.57E-16
2.18E+11
2.59E-16
154 mW/cm2
2.01E+11
2.65E-16
6.27E+10
1.94E-16
4.10E+11
3.05E-16
Table S20: and at each light intensity for all Y6/PEDOT:PSS/ITO samples.
Figure S5: vs. light intensity for all samples obtained from the BLDS fits. Each symbol corresponds to a different physical sample. Red data points are samples that contain PEDOT:PSS, and blue data points are samples without PEDOT:PSS. Data were collected in triplicate. All error bars are 1.Figure S6: vs. light intensity for all samples obtained from the BLDS fits. Each symbol corresponds to a different physical sample. Red data points are samples that contain PEDOT:PSS, and blue data points are samples without PEDOT:PSS. Data were collected in triplicate. All error bars are 1.Figure S7: vs. light intensity for all samples obtained from the BLDS fits. Each symbol corresponds to a different physical sample. Red data points are samples that contain PEDOT:PSS, and blue data points are samples without PEDOT:PSS. Data were collected in triplicate. All error bars are 1.Figure S8: vs. light intensity for all samples obtained from the BLDS fits. Each symbol corresponds to a different physical sample. Red data points are samples that contain PEDOT:PSS, and blue data points are samples without PEDOT:PSS. Data were collected in triplicate. All error bars are 1.
S-7 Atomic Force Microscopy
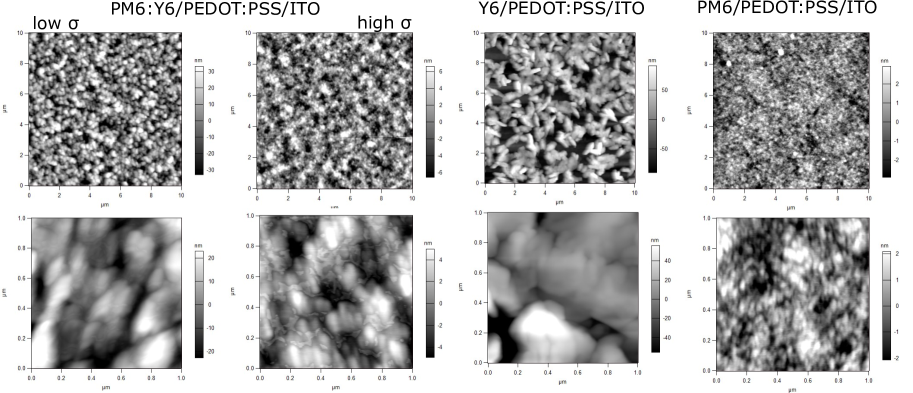
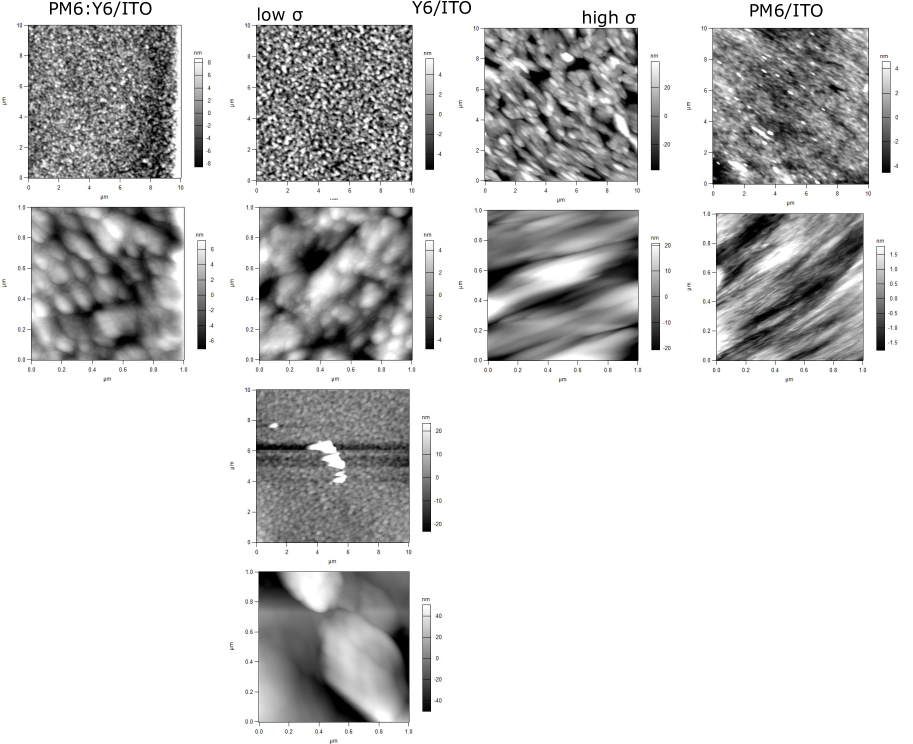
Atomic force micrographs (AFMs) of polymer films were collected in air on a commercial instrument in tapping mode (Asylum Research MFP-3D-BIO) using a Olympus AC160TS-R3 probe. The AFMs (Figs. S9–S10) of the PEDOT:PSS/ITO samples give some insight into the conductivity. We observe that samples with higher conductivity have a lower rms roughness. This is noteable in the PM6:Y6/PEDOT:PSS/ITO samples, where the sample with lower conductivity () has a roughness of 30 nm, and the sample with higher conductivity () has a roughness of 6 nm.
Figure S9: AFMs of PM6:Y6, Y6, and PM6 samples on PEDOT:PSS. PM6:Y6/PEDOT:PSS/ITO “low ” was the second sample prepared (), with medium conductivity and “high ” was the third sample prepared (), with the highest conductivity of the 3 samples.Figure S10: AFMs of PM6:Y6, Y6, and PM6 samples on ITO. Y6/ITO “low ” is the lowest conductivity sample (, collected on two spots on the sample), and “high ” is one of the higher conductivity samples ().
References
Bonnett Del Alamo et al. [2021]M. Bonnett Del Alamo, C. Soncco, R. Helaconde,
J. L. Bazo Alba, and A. M. Gago, Laser spot measurement using simple devices, AIP Adv. 11, 075016 (2021).
Newville et al. [2023]M. Newville, R. Otten,
A. Nelson, T. Stensitzki, A. Ingargiola, D. Allan, A. Fox, F. Carter, Michał, R. Osborn, D. Pustakhod, lneuhaus, S. Weigand,
A. Aristov, Glenn, C. Deil, mgunyho,
Mark, A. L. R. Hansen, G. Pasquevich, L. Foks, N. Zobrist, O. Frost,
Stuermer, azelcer, A. Polloreno, A. Persaud, J. H. Nielsen, M. Pompili, and P. Eendebak, lmfit/lmfit-py: 1.2.2, Zenodo (2023).
Virtanen et al. [2020]P. Virtanen, R. Gommers,
T. E. Oliphant, M. Haberland, T. Reddy, D. Cournapeau, E. Burovski, P. Peterson, W. Weckesser, J. Bright, S. J. van der Walt, M. Brett, J. Wilson, K. J. Millman, N. Mayorov, A. R. J. Nelson, E. Jones,
R. Kern, E. Larson, C. J. Carey, I. Polat, Y. Feng, E. W. Moore, J. VanderPlas, D. Laxalde,
J. Perktold, R. Cimrman, I. Henriksen, E. A. Quintero, C. R. Harris, A. M. Archibald, A. H. Ribeiro, F. Pedregosa, and P. van Mulbregt, SciPy 1.0: fundamental algorithms for scientific
computing in Python, Nat. Methods 17, 261 (2020).
Nyman et al. [2021]M. Nyman, O. J. Sandberg,
W. Li, S. Zeiske, R. Kerremans, P. Meredith, and A. Armin, Requirements for making thick junctions of organic solar cells based on
nonfullerene acceptors, Sol. RRL 5, 2100018 (2021).
Hosseini et al. [2020]S. M. Hosseini, N. Tokmoldin,
Y. W. Lee, Y. Zou, H. Y. Woo, D. Neher, and S. Shoaee, Putting
order into PM6:Y6 solar cells to reduce the Langevin recombination in 400
nm thick junction, Sol. RRL 4, 2000498 (2020).
Kim et al. [2019]S. Kim, J. Jeong, Q. V. Hoang, J. W. Han, A. Prasetio, M. Jahandar, Y. H. Kim, S. Cho, and D. C. Lim, The role of cation and anion dopant
incorporated into a ZnO electron transporting layer for polymer bulk
heterojunction solar cells, RSC Adv. 9, 37714 (2019).
Lv et al. [2021]J. Lv, H. Tang, J. Huang, C. Yan, K. Liu, Q. Yang, D. Hu, R. Singh, J. Lee, S. Lu, G. Li, and Z. Kan, Additive-induced miscibility
regulation and hierarchical morphology enable 17.5% binary organic solar
cells, Energy Environ. Sci. 14, 3044 (2021).
Tang et al. [2018]H. Tang, Y. Shang,
W. Zhou, Z. Peng, and Z. Ning, Energy level tuning of PEDOT:PSS for high performance tin-lead
mixed perovskite solar cells, Sol. RRL 3, 1800256 (2018).
Perdigón-Toro et al. [2022]L. Perdigón-Toro, L. Q. Phuong, F. Eller,
G. Freychet, E. Saglamkaya, J. I. Khan, Q. Wei, S. Zeiske, D. Kroh, S. Wedler, A. Köhler,
A. Armin, F. Laquai, E. M. Herzig, Y. Zou, S. Shoaee, and D. Neher, Understanding the role of order in Y-series non-fullerene solar cells to
realize high open-circuit voltages, Adv. Energy Mater. 12, 2103422 (2022).
Perdigón-Toro et al. [2020]L. Perdigón-Toro, H. Zhang, A. Markina,
J. Yuan, S. M. Hosseini, C. M. Wolff, G. Zuo, M. Stolterfoht, Y. Zou, F. Gao, D. Andrienko,
S. Shoaee, and D. Neher, Barrierless free charge generation in the high-performance
PM6:Y6 bulk heterojunction non-fullerene solar cell, Adv. Mater. 32, 1906763 (2020).
Hosseini et al. [2023]S. M. Hosseini, S. Wilken,
B. Sun, F. Huang, S. Y. Jeong, H. Y. Woo, V. Coropceanu, and S. Shoaee, Relationship between
energetic disorder and reduced recombination of free carriers in organic
solar cells, Adv. Energy Mater. 13, 2203576 (2023).
Burke et al. [2015]T. M. Burke, S. Sweetnam,
K. Vandewal, and M. D. McGehee, Beyond Langevin recombination: How
equilibrium between free carriers and charge transfer states determines the
open-circuit voltage of organic solar cells, Adv. Energy Mater. 5, 1500123 (2015).
Tirmzi et al. [2019]A. M. Tirmzi, J. A. Christians, R. P. Dwyer, D. T. Moore, and J. A. Marohn, Substrate-dependent photoconductivity
dynamics in a high-efficiency hybrid perovskite alloy, J. Phys. Chem. C 123, 3402 (2019).