[1]Christian Doppler Laboratory for Artificial Intelligence in Retina, Department of Ophthalmology and Optometry, Medical University of Vienna, Austria
RRWNet: Recursive Refinement Network for Effective Retinal Artery/Vein Segmentation and Classification
Abstract
The caliber and configuration of retinal blood vessels serve as important biomarkers for various diseases and medical conditions. A thorough analysis of the retinal vasculature requires the segmentation of blood vessels and their classification into arteries and veins, which is typically performed on color fundus images obtained by retinography, a widely used imaging technique. Nonetheless, manually performing these tasks is labor-intensive and prone to human error. Various automated methods have been proposed to address this problem. However, the current state of art in artery/vein segmentation and classification faces challenges due to manifest classification errors that affect the topological consistency of segmentation maps. This study presents an innovative end-to-end framework, RRWNet, designed to recursively refine semantic segmentation maps and correct manifest classification errors. The framework consists of a fully convolutional neural network with a Base subnetwork that generates base segmentation maps from input images, and a Recursive Refinement subnetwork that iteratively and recursively improves these maps. Evaluation on public datasets demonstrates the state-of-the-art performance of the proposed method, yielding more topologically consistent segmentation maps with fewer manifest classification errors than existing approaches. In addition, the Recursive Refinement module proves effective in post-processing segmentation maps from other methods, automatically correcting classification errors and improving topological consistency. The model code, weights, and predictions are publicly available at https://github.com/j-morano/rrwnet.
keywords:
artery-vein classification , segmentation , retina , medical image analysis , deep learning1 Introduction
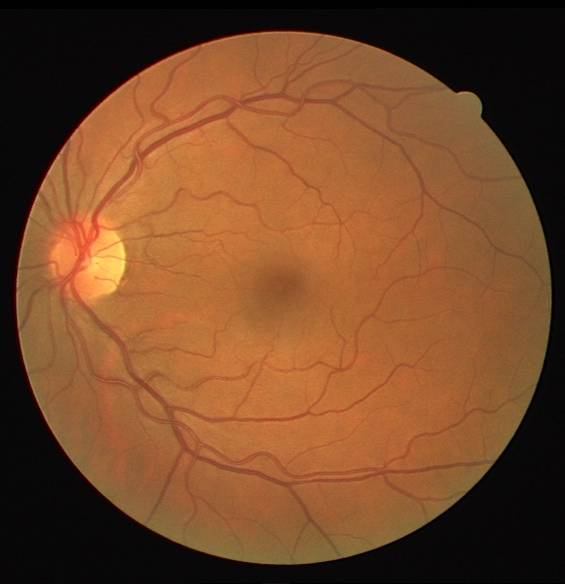
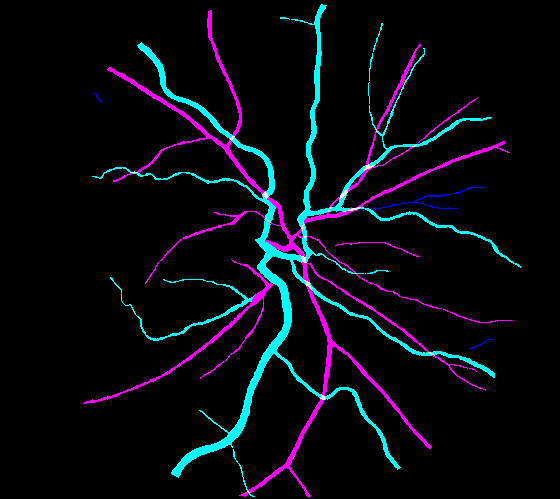
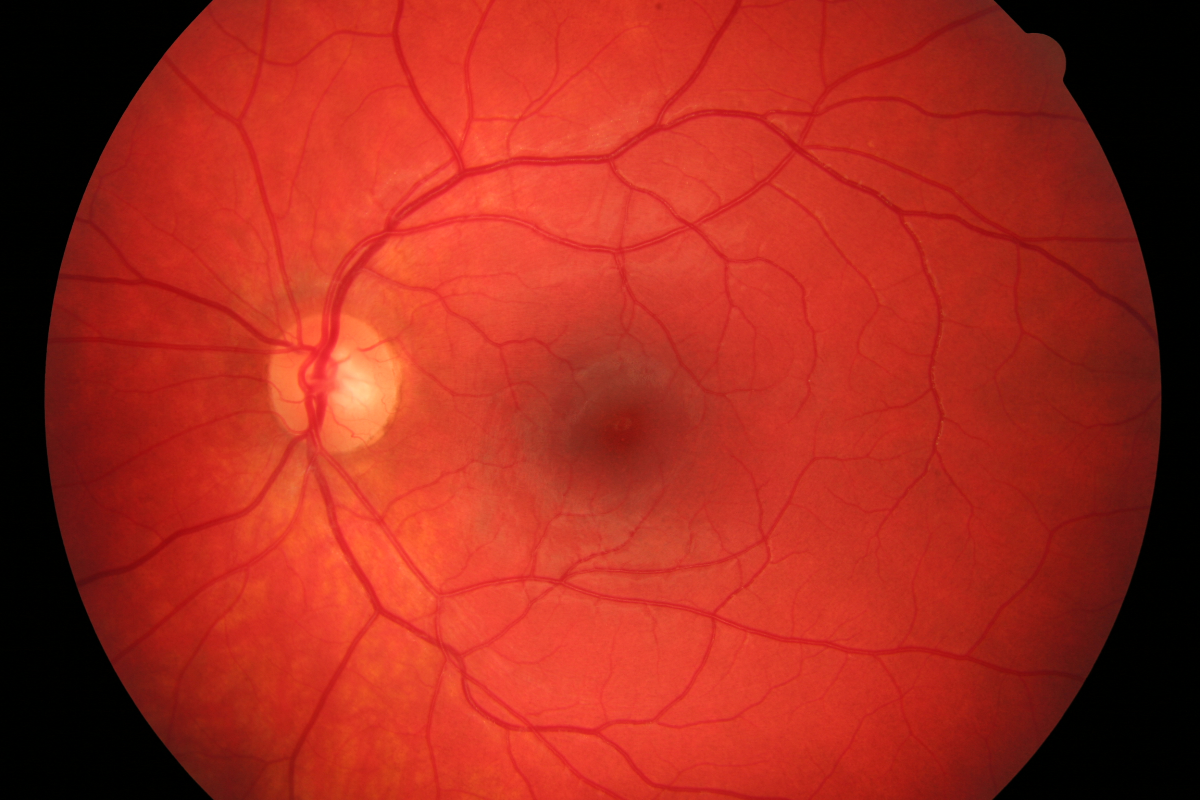
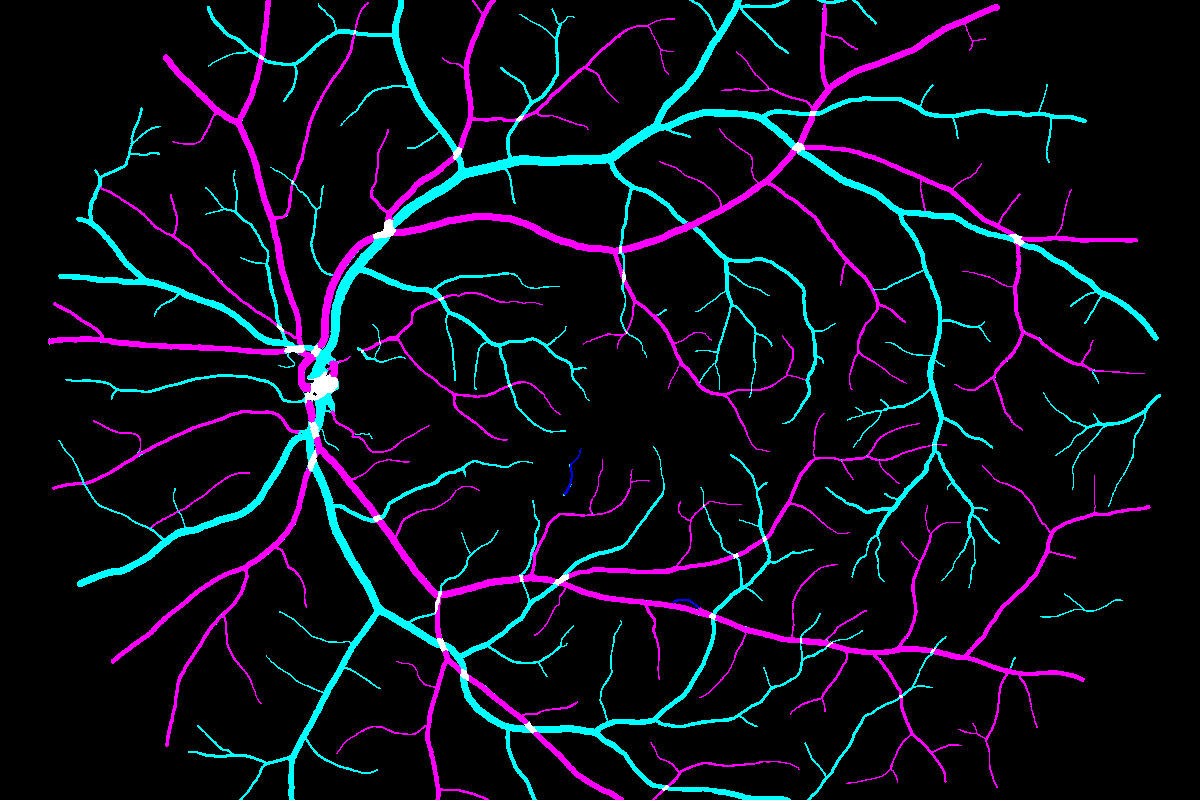
The caliber and the configuration of retinal blood vessels (BV) is an important biomarker for several diseases and medical conditions, including glaucoma, age-related macular degeneration (AMD), diabetic retinopathy (DR), and hypertension [1, 2, 3, 4, 5, 6, 7, 8]. These changes can be detected by an ophthalmologist using color fundus images obtained by retinography [9, 10, 11, 12, 13, 14, 15, 16], a non-invasive imaging technique that consists of photographing the retina through the pupil [5, 1] (see an example in Fig. 1, left). Retinography is inexpensive, technologically simpler than other modalities, and straightforward to operate, which makes it very suitable for population screening of eye diseases.
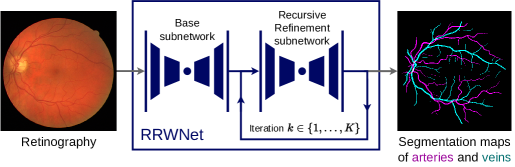
A thorough analysis of the retinal vasculature requires the segmentation of the blood vessels and their classification into arteries and veins. The output of this task, i.e., the binary segmentation maps of arteries and veins (A/V) (see Fig. 1, right), allows the measurement of vessel characteristics such as width, diameter, length and tortuosity, which have been proven useful in the evaluation of some of the aforementioned diseases [7]. In addition, the precise measurement of these characteristics enables the calculation of more complex biomarkers, such as the arteriolar-venular diameter ratio (AVR) [17, 8, 18]. However, performing these tasks manually is very laborious, which increases costs, and is prone to human error, which affects reproducibility and quality of care. To avoid these problems, several automated methods have been proposed to perform simultaneous A/V segmentation and classification [2, 19, 20, 21, 22, 23, 24, 25, 26, 27, 28, 29, 30, 31, 32, 33, 34, 35, 36, 37, 38, 39, 40, 41, 42, 43, 44, 45, 46, 47].
State-of-the-art methods for vessel segmentation and classification are based on fully convolutional neural networks (FCNNs) [48, 37, 38, 39, 40, 41, 42, 43, 46, 47]. Most approaches classify each pixel into one (and only one) of the following classes of interest: background, artery, vein, and crossing (area where a vein overlaps an artery or vice versa); others also include an uncertain class for vessels difficult to classify. In contrast, other approaches [44, 42, 43] treat the simultaneous segmentation and classification of arteries and veins as a multitask segmentation problem, where the network is trained to segment arteries, veins, and vessels (i.e., both) simultaneously and separately, so that a pixel can be classified into one or more classes.
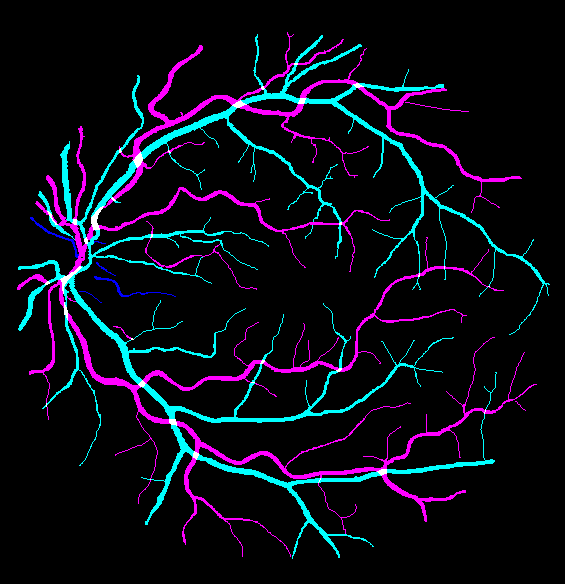
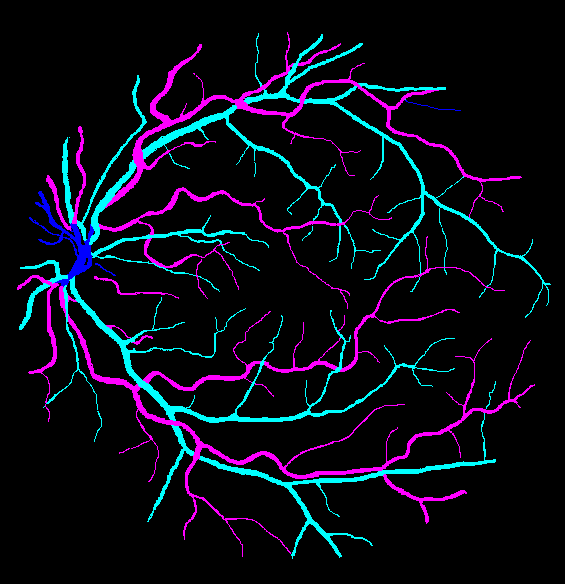
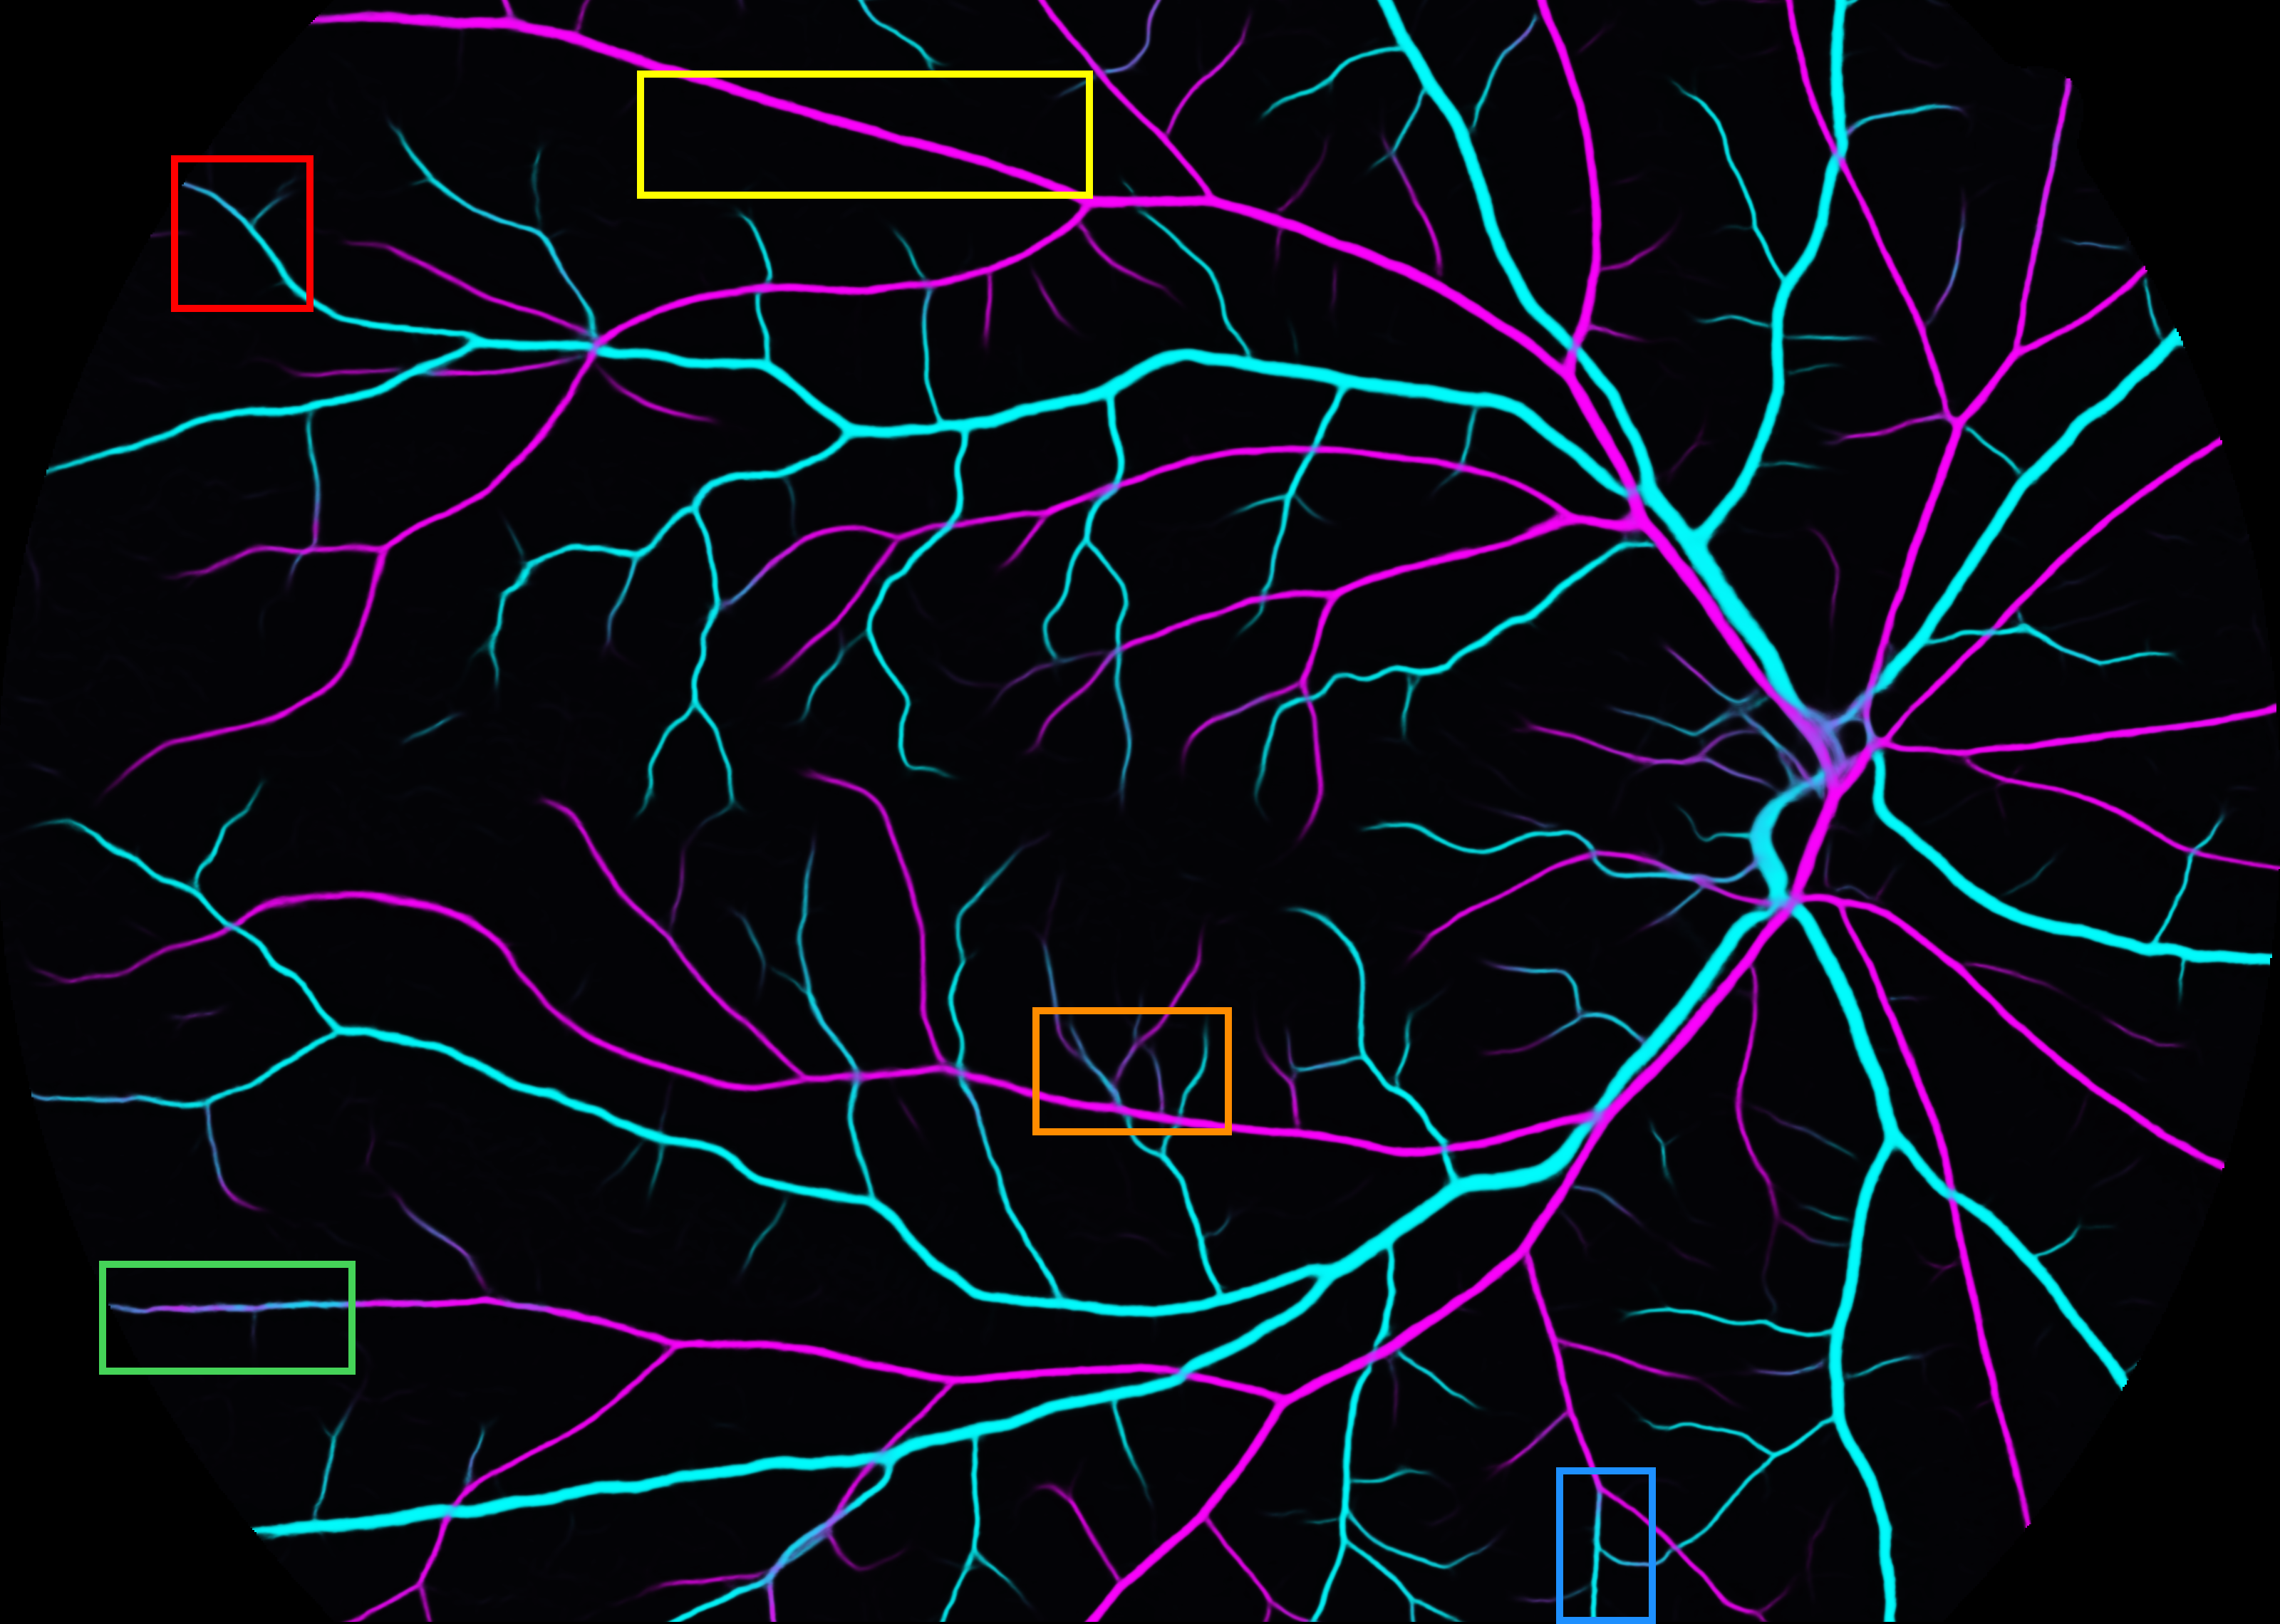
Regardless of the approach, state-of-the-art FCNN-based methods face a common problem: the presence of manifest classification errors, i.e., areas whose classification is incompatible with the topology of the structures to be segmented and classified; in A/V segmentation and classification, this stands for unreasonably misclassified portions of mostly correctly segmented vessels (see Fig. 2).
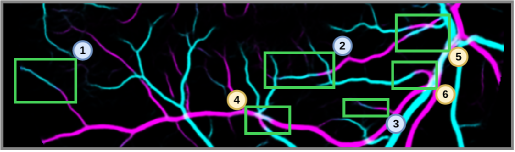
These errors are caused by the tendency of the models to perform vessel classification based on local characteristics of the input, rather than the overall structure of the vascular tree. In order to reduce these errors, some works [37, 41] used ad hoc post-processing methods based on graph propagation. Alternatively, other methods [42, 43] have proposed to combine regular pixel-wise segmentation losses combined with adversarial losses [49] and other losses focused on measuring certain characteristics of the predicted maps (such as the topological connectivity of the vessels) to force the model to produce more topologically consistent segmentations. However, these approaches remain relatively ad hoc, as they are specifically designed for the problem at hand (BV segmentation and classification), and their effectiveness is still limited.
In this work, we propose a novel end-to-end framework, RRWNet (Fig. 1), for recursively refining semantic segmentation maps to correct manifest classification errors. The framework defines a recursive FCNN consisting of a Base subnetwork, which receives the input image and produces the base segmentation maps, and a Recursive Refinement (RR) subnetwork, which receives the base segmentation maps and iteratively refines them. The potential of the proposed framework is assessed by applying it to automated segmentation and A/V classification of retinal vessels. Results on several public datasets show that the proposed method achieves state-of-the-art performance, producing segmentation maps that are more topologically consistent and with fewer manifest classification errors than the state of the art. Furthermore, we show that our recursive refinement module can be used as a standalone post-processing method to significantly improve the topological consistency of the segmentation maps produced by other methods. The code, the weights, and the predictions of our model are publicly available at https://github.com/j-morano/rrwnet.
2 Related works
2.1 Vessel segmentation and classification
The first methods for vessel segmentation on color fundus images were based on ad hoc image processing techniques [19, 20, 21, 2, 50] or traditional learning models such as artificial neural networks [22, 23]. Today, FCNNs based on the U-Net architecture [51] have become the state of the art [26, 28, 29, 30, 31, 52, 53, 54, 55].
Until recently, A/V segmentation and classification were treated as a two-step process, where A/V classification was performed only on pixels previously identified as BV by the segmentation algorithm [33, 34, 35, 56, 36, 32]. In addition, many works restricted the classification to small regions, usually around the optic disc [56, 33, 34]. The first work that deals with the whole vascular tree [35] proposed a graph-based method that takes as input a previously segmented vascular graph and the input image and obtains two separate graphs for arteries and veins. Later, Welikala et al. [32] were the first to propose the use of a CNN for the classification stage. Although these methods achieved reasonable performance, they were limited by the quality of the initial vessel segmentation.
To avoid this problem, several works have addressed the simultaneous segmentation and classification of retinal vessels either as a semantic segmentation task of three to four classes (background, artery, vein, uncertain) [48, 37, 40, 38, 39, 41, 44, 42, 43, 46, 47] or as a multi-label segmentation task with multiple targets [44, 42, 43] (arteries, veins, blood vessels). The latter approach has the advantage of providing continuous and thus more topologically consistent segmentation maps of arteries and veins, since vessel crossings are considered as both arteries and veins.
2.2 Reducing manifest classification errors
All of the aforementioned studies acknowledge the challenge of manifest classification errors resulting from models that favor local input characteristics over the overall structure of the vascular tree. Various methods proposed [37, 41] ad hoc post-processing of the vessel graph extracted from the segmentation maps via graph-based operations. However, these methods usually require additional input information (such as the location of the optic disc), and their effectiveness is severely limited by the quality of the initial segmentation maps (usually obtained using an FCNN), which limits their generalization capabilities.
In the deep learning domain, Hu et al. [57] introduced a multi-class point consistency module to generate artery and vein skeletons, employing different consistency losses to improve topological consistency and mitigate classification errors, albeit with limited performance. Similarly, Chen et al. [42, 43] proposed a GAN-based method with a topological loss. In particular, they propose to use a discriminator designed to rank, from lowest to highest, the topological connectivity of the ground truth, the predicted mask, and a randomly transformed mask. The ranking error is used as a loss to encourage the model to produce more topologically consistent segmentation maps. In addition, they propose a module that extracts the high-level topological features of the images to force the model to predict vascular segmentation maps with a topology similar to that of the manual annotations. Alternatively, Karlsson et al. proposed a method to improve the classification of arteries and veins by using multiple serially-connected U-Net-based networks that process both the input image and the segmentation maps predicted by the previous network. However, this method is highly dependent on the hyperparameters selected. In particular, the authors tuned the number of networks, the number of layers, levels, and kernels in each network/layer, as well as the weights of the losses and the regularization parameters. Also, no cross-dataset evaluation is performed. Similar to Karlsson el al., our method also uses serially connected U-net-like networks. However, it uses only two specialized modules, where the recursive refinement is performed recursively by the second module.
2.3 Iterative refinement
In recent years, several iterative refinement approaches have been proposed to improve segmentation performance in the context of both natural and medical image analysis [58, 59, 60, 61, 62, 63, 46, 47]. These methods use an iterative prediction process via a classifier that receives as input the result from the previous iteration(s) and, optionally, the input image, addressing the errors made in earlier iterations.
A common approach consists of stacking multiple deep modules and training them in an end-to-end fashion [60, 61, 46, 47], which allows to have modules specialized in solving the errors of the previous modules. For example, in [60], 8 consecutive modules are used for pose estimation in images. During training, supervision is applied to all these modules by comparing their output with the ground truth (GT). Yet, these approaches require a large number number of parameters, leading to high memory and computational costs, both during training and at test time. To avoid this problem, recent A/V segmentation methods [46] propose to use custom lightweight U-Net-based networks. However, these methods require to modify the architecture of the base network, and heavily rely on hyperparameter tuning (e.g., the # of networks) to perform well. Galdran et al. [47] proposed a similar method, but using only two stacked networks.
An alternative approach consists of refining the predictions using a single recursive network [58, 63]. While the memory requirements during training of this approach remain constant, as the gradients for each iteration must be stored, the number of parameters is much lower, which makes it more efficient at test time. In [58], the semantic segmentation of natural images produced by a CNN network is subsequently refined by the same network at different scales. This approach is focused on increasing the spatial context of the network, so that it models non-local dependencies (of higher level) in the scenes. In this way, the authors manage to make the network give rise to much more coherent predictions. The problem with this method is that the CNN is applied pixel-wise, making it very inefficient in terms of computational cost. This problem is solved by Mosinska et al. in [63] by using a FCNN at a constant scale. The complete methodology consists of training a FCNN network in a supervised way using this type of images together with their manual segmentation masks. For each image, the network obtains an initial segmentation that it subsequently recursively refines over multiple iterations. Thus, in the first iteration, the network receives the input image and an empty segmentation map; and in the following iterations (), it receives the same image together with the segmentation map obtained in iteration . For each iteration, the segmentation error is calculated from the prediction and the GT. Thus, the loss function used to train the network is the weighted sum of the errors of all the iterations. The weighting is greater for later iterations. This method, however, has a disadvantage compared to stacking module approaches: the same network is used for all iterations, so it cannot be specialized for the refinement task.
In contrast, our framework innovatively combines the advantages of stacking and recursive approaches by decomposing the network into two specialized parts, a Base subnetwork and a RR subnetwork, which are trained in an end-to-end manner. The Base subnetwork takes the input image and produces the initial segmentation maps, which are then recursively refined by the RR subnetwork to solve manifest classification errors. This setting also enables the RR subnetwork to be used as a post-processing method for the segmentation maps predicted by any FCNN-based method, regardless of the architecture or the losses used.
3 Contributions
The main contributions of our work are as follows:
-
1.
We propose a novel end-to-end framework, RRWNet, for recursively refining semantic segmentation maps to correct manifest classification errors. Our framework is the first to combine the advantages of module stacking and recursive refinement approaches by decomposing the network into two specialized parts, a Base subnetwork and a Recursive Refinement subnetwork, which are trained in an end-to-end manner.
-
2.
We propose and publicly release a straightforward implementation of the proposed framework, based on FCNNs, for the automatic segmentation and classification of retinal vessels into arteries, veins, and blood vessels in retinography images.
-
3.
We show that the proposed method achieves state-of-the-art performance in A/V segmentation and classification on several publicly available datasets (RITE, LES-AV, HRF), demonstrating the effectiveness of the proposed framework.
-
4.
Further analyses show that the proposed method produces more topologically consistent segmentation maps than the state of the art, and that the Recursive Refinement subnetwork can be used as a stand-alone post-processing method for the segmentation maps predicted by any other method, greatly improving topological consistency.
4 Methods
The proposed general framework (whose overview was already presented in Fig. 1) is shown in detail for the task of A/V segmentation and classification in Fig. 3.
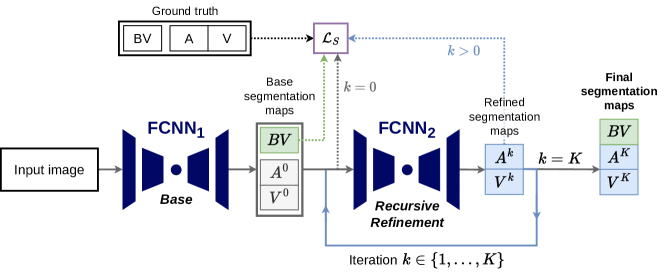
The Base subnetwork takes as the input a retinography image and produces coarse segmentation maps of arteries (A), veins (V), and blood vessels (BV) that are the union of the previous two. Then, the segmentation maps are fed to the RR subnetwork, which recursively refines the maps a certain number of iterations , iteratively correcting the vessel classification errors made by the Base part. In each iteration, the input of the RR part is the output of the previous iteration, and never the input image. This forces the network to correct the errors based on the vessel structure, and not on the characteristics of the input image. The final output of the network is composed of the refined A/V segmentation maps at the last iteration () and the initial BV segmentation map produced by the Base part.
Specifically, let be the input retinography, where and are its height and width, respectively, and , its corresponding GT with the manual segmentation maps of arteries (), veins (), and vessels (). We obtain the final prediction by applying the network to the input image , where are the parameters of the network and the number of iterations of the RR part. The network is defined as
| (1) |
where and are the parameters of the Base and RR subnetworks, respectively, is the concatenation operator and is the third channel of the output of the Base subnetwork, corresponding to the BV segmentation map.
Training loss
To train the network, we use a loss function that combines the losses of the Base and RR subnetworks for arteries, veins, and BV. In particular, the Base loss is the sum of the losses of the segmentation maps produced by the Base subnetwork, while the RR loss is the weighted sum of the losses of the output of the RR subnetwork at each iteration . The final loss is the sum of the Base and RR losses. Formally, it is defined as follows:
| (2) |
where and . are the output of the Base subnetwork and the RR subnetwork at iteration , respectively, and is the segmentation loss function, which computes the segmentation error as the sum of the binary segmentation errors for each structure (arteries, veins and BV). In line with previous works [44, 42, 43], the Binary Cross-Entropy (BCE) between the prediction and the manual annotation is used in each case. Formally, the segmentation loss for an arbitrary number of structures , is defined as follows:
| (3) |
Network Architecture
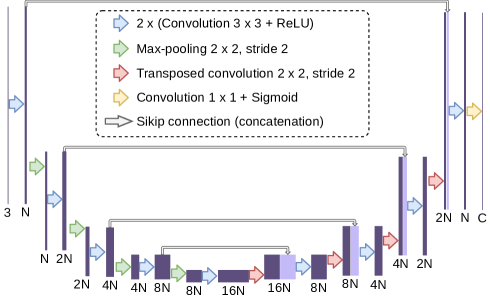
The proposed network architecture consists of two nearly-identical encoder-decoder subnetworks connected in series ( and , in Figure 3). The first one is used to obtain the base segmentation maps, while the second one is used to iteratively refine the segmentation maps to correct manifest classification errors. Similarly to most state-of-the-art works on retinal vessel segmentation and classification [48, 37, 40, 38, 39, 64, 44], we use the original U-Net [51] as the architecture of the subnetworks. The number of output channels of the first subnetwork is 3 (for arteries, veins, and blood vessels), while the second one has 2 (for arteries and veins). The segmentation of the blood vessels is not refined because previous works have shown that a single U-Net already produces very accurate segmentation maps [44]. A complete diagram of the U-Net architecture used in this work is shown in Figure 4.
5 Experimental setup
5.1 Datasets
Experiments were performed on the only three public datasets with color fundus images and their corresponding A/V annotations: RITE [65], LES-AV [66], and HRF [67]. Figure 5 shows some examples of the images and available annotations of the three datasets, while Table 1 gives an overview of the distribution of samples (pixels) among the different classes in the datasets. Further details on the datasets are provided below.
Retinal Images vessel Tree Extraction (RITE)
The RITE111https://medicine.uiowa.edu/eye/rite-dataset (accessed on 2023-12-15) [65] dataset (also known as AV-DRIVE or DRIVE-AV in the literature) is an extension of the Digital Retinal Images for Vessel Extraction (DRIVE) dataset [2] (a reference standard for vessel segmentation) containing vessel classification annotations. It is composed of the same 40 retinography images as DRIVE, 20 of which are used for training and 20 for testing. 33 of the images are from healthy patients, while 7 are from patients with mild signs of DR. All images are centered on the macula and have a resolution of pixels. The region of interest (ROI) is always circular. Manual segmentation maps of the blood vessels, originally provided by the DRIVE dataset, are available for each image. The pixel-level classification of the vessels into arteries, veins, crossings and uncertain is also provided [65]. Crossings are areas where a vein and an artery overlap. The uncertain class is used for those vessels whose classification the experts have not been able to determine.
| Class | Dataset | ||
|---|---|---|---|
| RITE [65] | LES-AV [66] | HRF [43] | |
| Background | 87.52 | 90.50 | 89.88 |
| Vessel | 12.48 | 9.50 | 10.12 |
| - Artery | 5.19 | 4.28 | 4.49 |
| - Vein | 6.37 | 4.81 | 5.19 |
| - Crossing | 0.32 | 0.14 | 0.26 |
| - Uncertain | 0.60 | 0.27 | 0.18 |
Alternative A/V classification annotations for the DRIVE dataset were proposed by Qureshi et al. [68], who manually segmented and classified the blood vessels into arteries, veins, and uncertain from the raw retinography images (i.e., without using the already available DRIVE vessel segmentations). For artery-vein crossings, the classification was assigned according to the superior vessel. These alternative labels (henceforth referred to as Qureshi et al.) are used as “second expert” annotations.
LES-AV
This dataset222https://figshare.com/articles/dataset/LES-AV_dataset/11857698 (accessed on 2023-12-16) [66] consists of 22 retinography images, 11 from healthy patients and 11 from patients with signs of glaucoma. Unlike RITE, LES-AV does not have a default split into training and test subsets. All images are centered on the optic disc and have a resolution of pixels, (except one, which has a resolution of pixels) with a circular ROI. LES-AV has exactly the same types of manual annotations as RITE. In this work, we use this dataset as an external dataset for cross-dataset evaluations.
High-Resolution Fundus (HRF)
The HRF dataset333https://www5.cs.fau.de/research/data/fundus-images/ (accessed on 2023-12-16) [67] is a collection of 45 retinography images with a resolution of pixels. Of these images, 15 are from individuals showing no signs of DR, 15 are from patients with DR, and 15 are from glaucomatous patients. A/V classification annotations were first provided by Hemelings et al. [40]444https://github.com/rubenhx/av-segmentation (accessed on 2023-12-16). Then, Chen et al. [43]555https://github.com/o0t1ng0o/TW-GAN (accessed on 2023-12-16) proposed novel manual annotations to solve the inconsistencies in the annotations of Hemelings et al. [40]. The annotation procedures of these two works are slightly different. In Chen et al. [43], the crossing pixels are labelled as such (in line with the RITE and LES-AV datasets), while in Hemelings et al. [40] they are assigned to the class of the superior vessel, if this is known, or to the uncertain class otherwise. In this work, we use the annotations of Chen et al. [43] for training and testing, while keeping the annotations of Hemelings et al. [40] as “second expert” annotations. In line with previous works [40, 46], we use the first five images in each category for testing and the remainder for training.
5.2 Experiments
Hyperparameter search
The number of refinement steps is an important property of RRWNet. We performed a hyperparameter search to find the best value of by comparing the results of RRWNet in RITE for equal to 2, 3, 6, 8, and 11. For the subsequent experiments, we select that maximizes the average of the AUROC and AUPR for the segmentation of the different structures, as well as the accuracy of the A/V and BV/background (BV/BG) classification.
Ablation study
We performed an ablation study measuring the impact of adding the refinement module and the recursive refinement, separately and jointly. For this end, we compared our approach with a simple U-Net (U-Net), the proposed approach without recursive refinement (i.e., ) (W-Net), similar to [47], and the U-Net trained with the recursive refinement approach proposed by Mosinska et al. [63] (RRU-Net). Unlike RRWNet, RRU-Net consists of a single encoder-decoder module that is recursively applied to the input image and the output of the previous iteration (or a zero matrix in the first iteration). In addition, we compared the performance of the proposed approach refining all the segmentation maps (RRWNetAll) and refining only the segmentation maps of arteries and veins (RRWNet). All these experiments were performed using the RITE dataset. To assess statistical significance, the one-tailed Wilcoxon signed-rank test was used.
State-of-the-art comparison and recursive refinement post-processing
We compared the proposed approach with several state-of-the-art methods for A/V segmentation and classification [37, 38, 39, 40, 41, 44, 43, 47, 45, 46, 57] in RITE, LES-AV and HRF according to the most typical evaluation protocol in the literature, which evaluates the A/V classification for the intersection of GT vessels and detected vessels. In addition, to further demonstrate the effectiveness of the proposed approach, we performed detailed comparisons with recent state-of-the-art methods that provided either the source code or the resulting continuous segmentation maps of their methods for any of the datasets. In particular, we evaluated A/V segmentation and classification for all vessel pixels in the GT, and we computed several threshold-independent and topological metrics. The methods compared are: Morano et al. [44], Chen et al.666https://github.com/o0t1ng0o/TW-GAN (accessed on 2023-12-16) [43], Karlsson et al.777https://github.com/robert-karlsson/av-segmentation (accessed on 2023-12-16) [46], and Galdran et al. 888https://github.com/agaldran/lwnet (accessed on 2023-12-16) [47]. We also compared our approach with a second set of human annotations in both RITE and HRF: Qureshi et al. [68] and Hemelings et al.[40], respectively. In order to standardize the evaluation criteria, we did not perform any post-processing on the segmentation maps produced by these methods and performed the evaluation metrics described in Section 5.3 below. Following previous work [38, 43, 47], we train and test the models (separately) on the RITE and HRF datasets, while the LES-AV dataset is used for cross-dataset evaluation (from RITE).
Finally, to evaluate the effectiveness of the proposed RR subnetwork as a post-processing step, we also obtained the results of the aforementioned methods after refining their segmentation maps with the RR subnetwork.
5.3 Evaluation metrics
Segmentation performance is evaluated by constructing receiver operating characteristic (ROC) curve, precision-recall (PR) curve, and computing one-versus-all classification metrics, including sensitivity, specificity, and accuracy, for each structure of interest. To summarize the information of the curves, we calculate the area under the curve (AUC) value. We use PR curves in addition to ROC curves because they are more sensitive than ROC curves in scenarios where the target classes are unbalanced [69, 70], as in this case. For arteries and veins, only pixels within the ROI are considered, excluding uncertain vessels and crossings. We do this to ensure a fair comparison with other state-of-the-art work, where crossings are typically discarded from the evaluation. In each case, the positive class is the structure of interest and the negative class is everything else within the ROI.
A/V classification and BV/BG classification are evaluated by calculating sensitivity, specificity, and accuracy, considering arteries and BV, respectively, as the positive class. Only vessel pixels that are neither crossings nor uncertain vessels are included in the calculation. Most previous works [37, 40, 47, 46] only consider the intersection between the predicted vessels and the GT vessels in the calculation. However, this can give a false impression of the classification performance in cases where the segmentations are poor, and it does not allow a standardized comparison between the different methods. For this reason, a few works [44, 43] also evaluate the classification performance for all vessel pixels in the GT, including those that are not detected. In our state-of-the-art comparison, we report the classification performance in both cases, always specifying which criterion is used.
In addition, as in previous works [43], we adopt two metrics to evaluate the topological connectivity of A/V segmentation maps: infeasible and correct percentages (INF and COR, respectively) [71]999https://github.com/rjtaraujo/dvae-refiner (accessed on 2023-12-20). Specifically, we randomly sample a certain number of paths from the GT mask and the generated mask. If the path does not exist, the path of the generated mask is classified as infeasible. If the path of the generated mask differs from that of the GT, but the difference is less than 10%, it is classified as correct. The higher value of correct percentage (COR) and the lower value of infeasible (INF) implies more topologically correct segmentations.
Besides the previous quantitative evaluations, a qualitative evaluation is performed by visual inspection of the different segmentation maps. In particular, we focus on manifest classification errors and vessel continuity.
5.4 Training and evaluation details
We perform 4-fold cross-validation on RITE and HRF training sets. Each fold is divided into 80% for training and 20% for validation. To train the networks, we use the Adam optimization algorithm [72] with a constant learning rate (LR) and decay rates and . Early stopping is applied when the validation error does not decrease for 200 epochs. The batch size is set to 1. For hyperparameter search, we combine the predictions of the different models in their corresponding validation sets and compute the mean of the evaluation metrics. For the comparison with the state of the art, the models with the lowest validation error among the different folds are selected for testing.
We kept the original splits of the RITE and HRF datasets into training and test subsets. For RITE, the original resolution of the images is kept both for training and testing. As in [47], HRF images are resized to a width of 1024 pixels for training. For testing, we use the original resolution of the images by resizing the predicted segmentation maps to the original resolution. For LES-AV, we predict the segmentation maps at the original resolution of the images by feeding the model trained on RITE with the LES-AV images resized to a width of 576 pixels and then resizing the predicted segmentation maps to the original resolution.
All images were preprocessed offline following [44], which performs global contrast enhancement per channel together with local intensity normalization. In training time, we used random online data augmentation with color and intensity variations, affine transformations (rotation, scaling and shearing), horizontal and vertical flipping, and random cutout.
To compute the INF and COR metrics, we use 1000 paths for the RITE dataset and 100 for the HRF and LES-AV datasets. The number of paths was chosen to keep the computational cost reasonable, since the execution time of the algorithm is proportional to the number of pixels, and, for example, HRF images have times more pixels than RITE images.
The proposed methodology is implemented in Python 3 using PyTorch. The code, the weights of the models and their predictions on the test sets are available on GitHub: https://github.com/j-morano/rrwnet. All the experiments were performed on a server with two AMD EPYC 7443 24-Core CPU (1024GB of RAM) and four NVIDIA RTX A6000, of which only one GPU was used. In such a system, it takes about 3 hours to the complete the training of the proposed RRWNet, less than 0.1 seconds to segment an image using the GPU, and about 6-8 seconds using the CPU.
6 Results and Discussion
6.1 Hyperparameter search
Table 3 shows the AUROC and AUPR values for A/V/BV segmentation, as well as the mean sensitivity, specificity, and accuracy values for A/V classification and BV/BG classification in RITE (validation) for the RRWNet model with different . These results show that the proposed method is robust to the choice of this hyperparameter, yielding similar results for all values. However, RRWNet with slightly outperformed the other methods in 3 of the 12 evaluation metrics, and was the second best method in 5 of them. In particular, the mean of the AUROC, AUPR, and accuracy values for segmentation and classification for () is slightly higher than for the other values of (, , , and for , and , respectively). For this reason, we chose for the rest of the experiments.
| Evaluation | Structure | Metric | Models | ||||
| RRWNet-2 | RRWNet-3 | RRWNet-6 | RRWNet-8 | RRWnet-11 | |||
| Segmentation | Artery | AUROC | |||||
| AUPR | |||||||
| Vein | AUROC | ||||||
| AUPR | |||||||
| BV | AUROC | ||||||
| AUPR | |||||||
| Classification | Artery/Vein | Sens. | |||||
| Spec. | |||||||
| Acc. | |||||||
| BV/BG | Sens. | ||||||
| Spec. | |||||||
| Acc. | |||||||
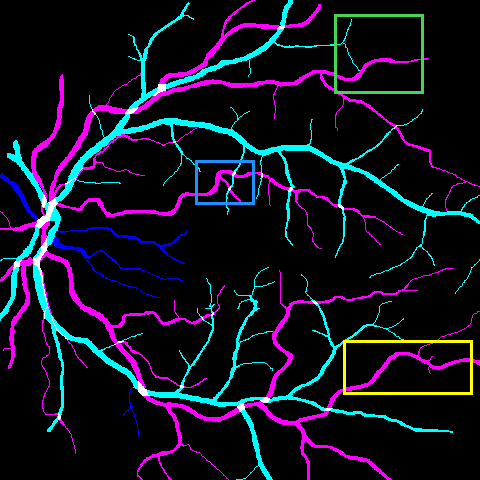
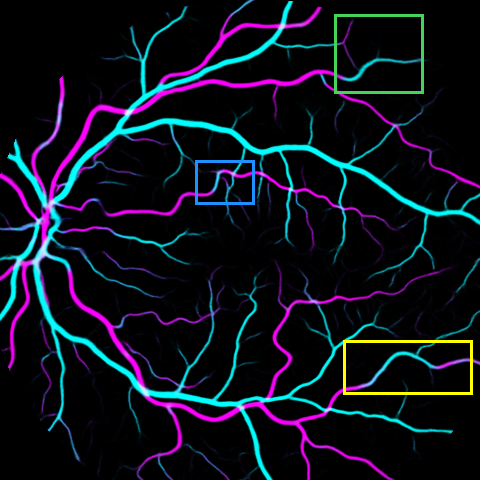
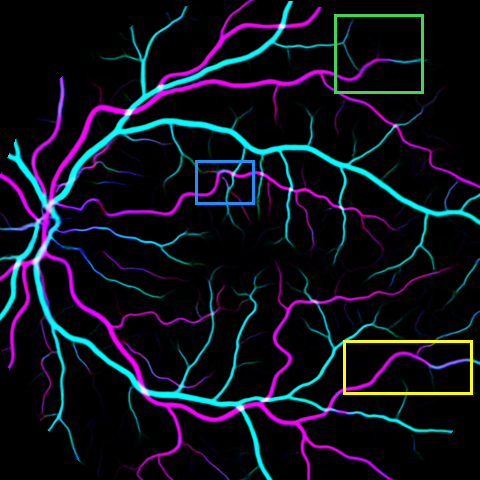
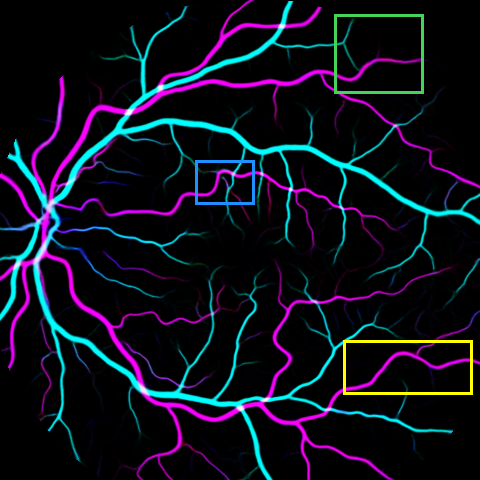
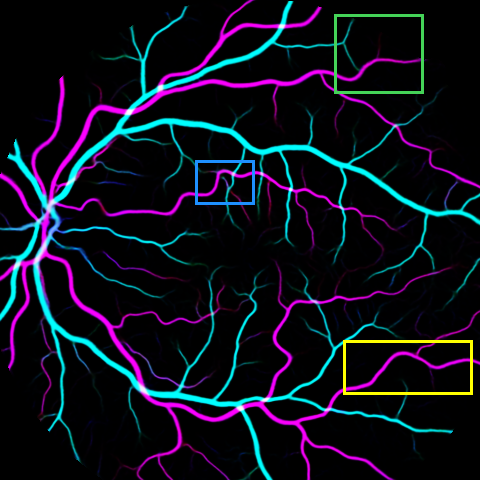
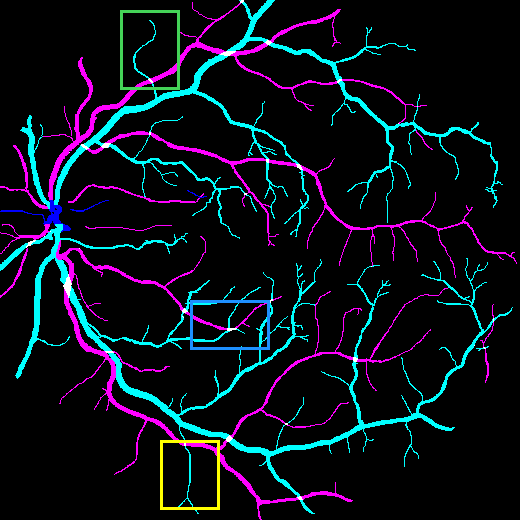
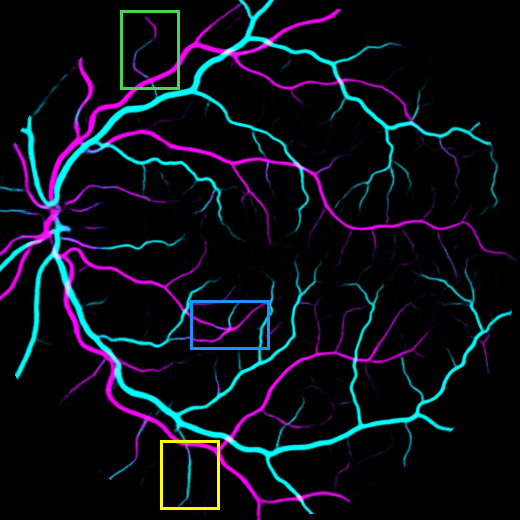
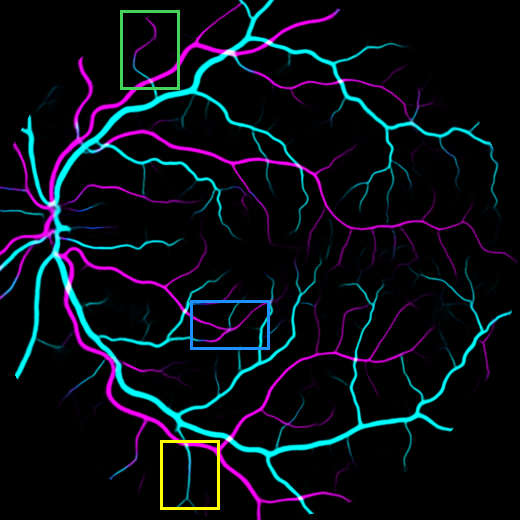
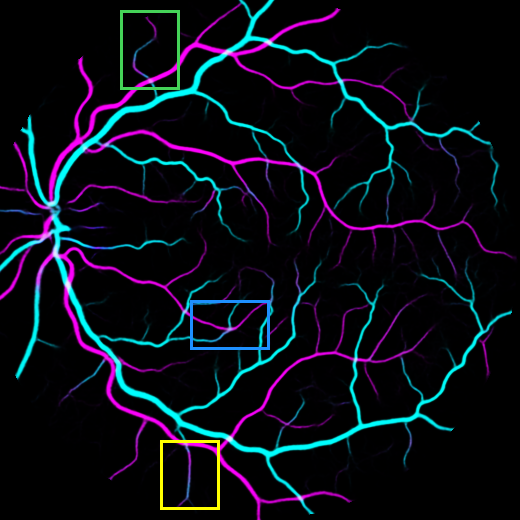
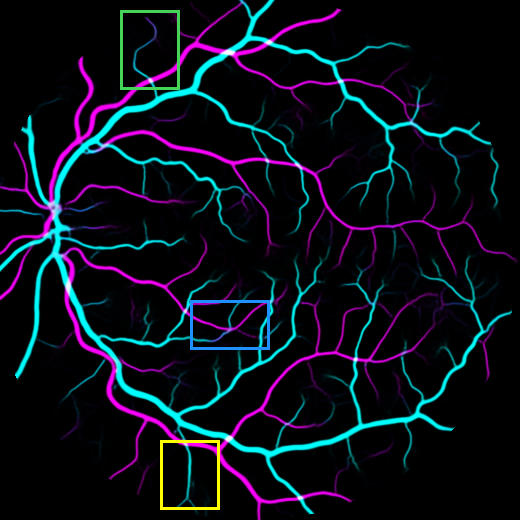
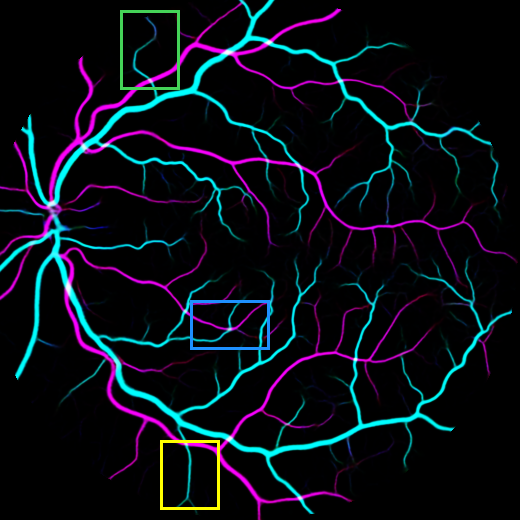
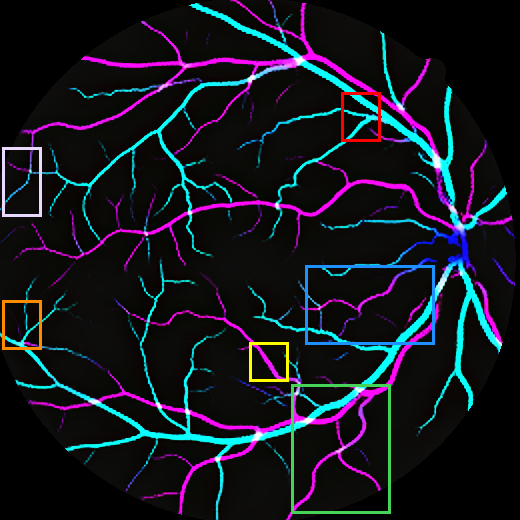
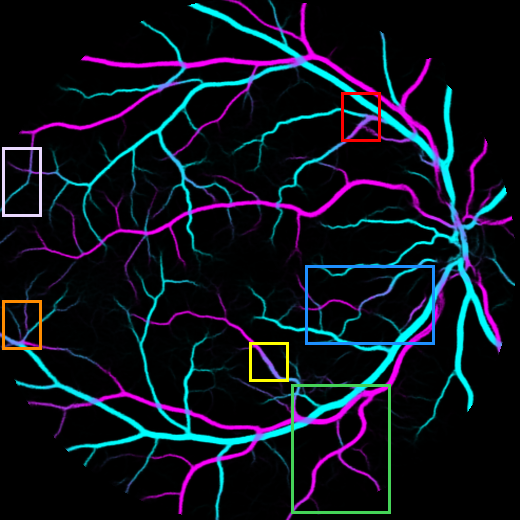
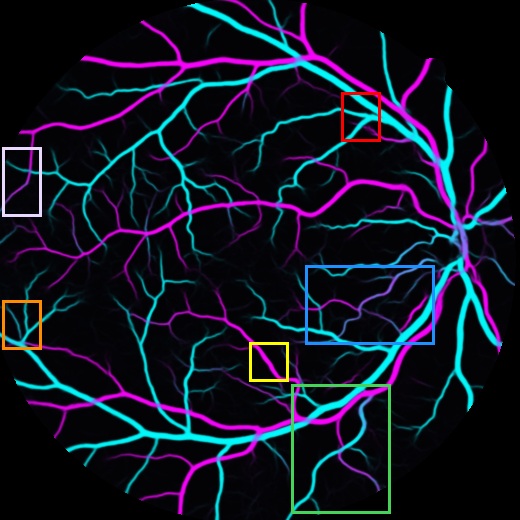
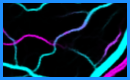
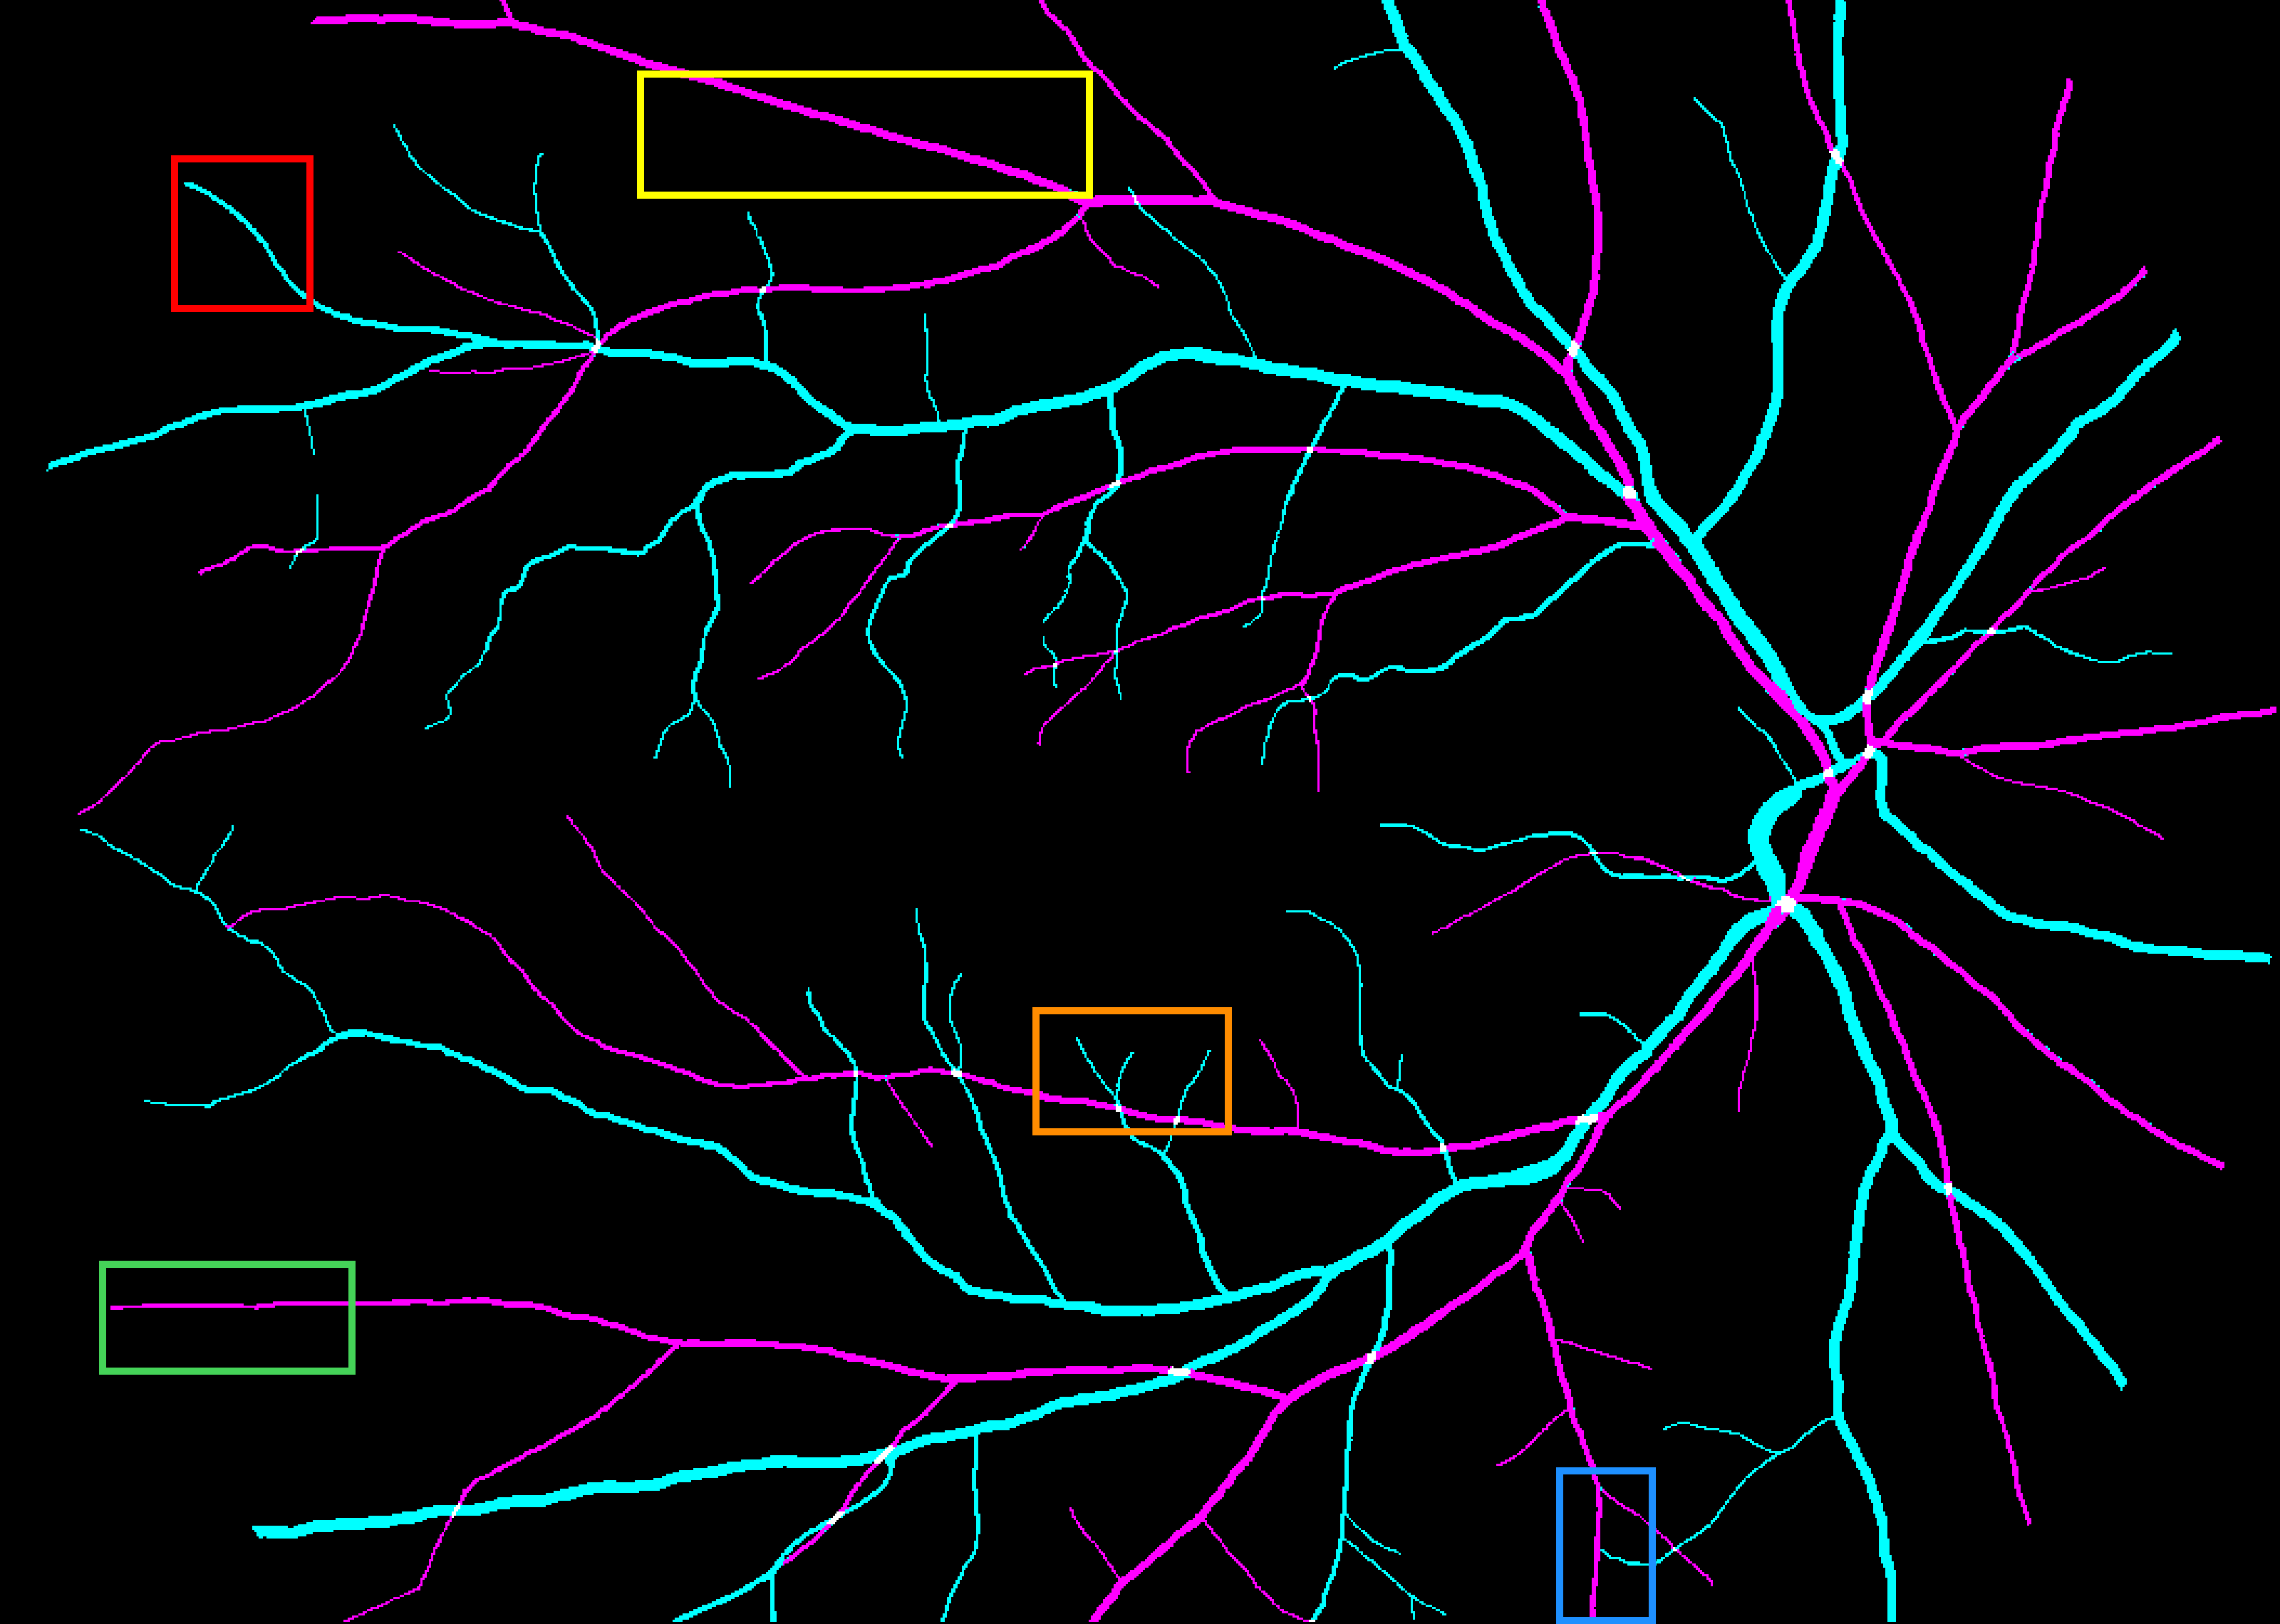
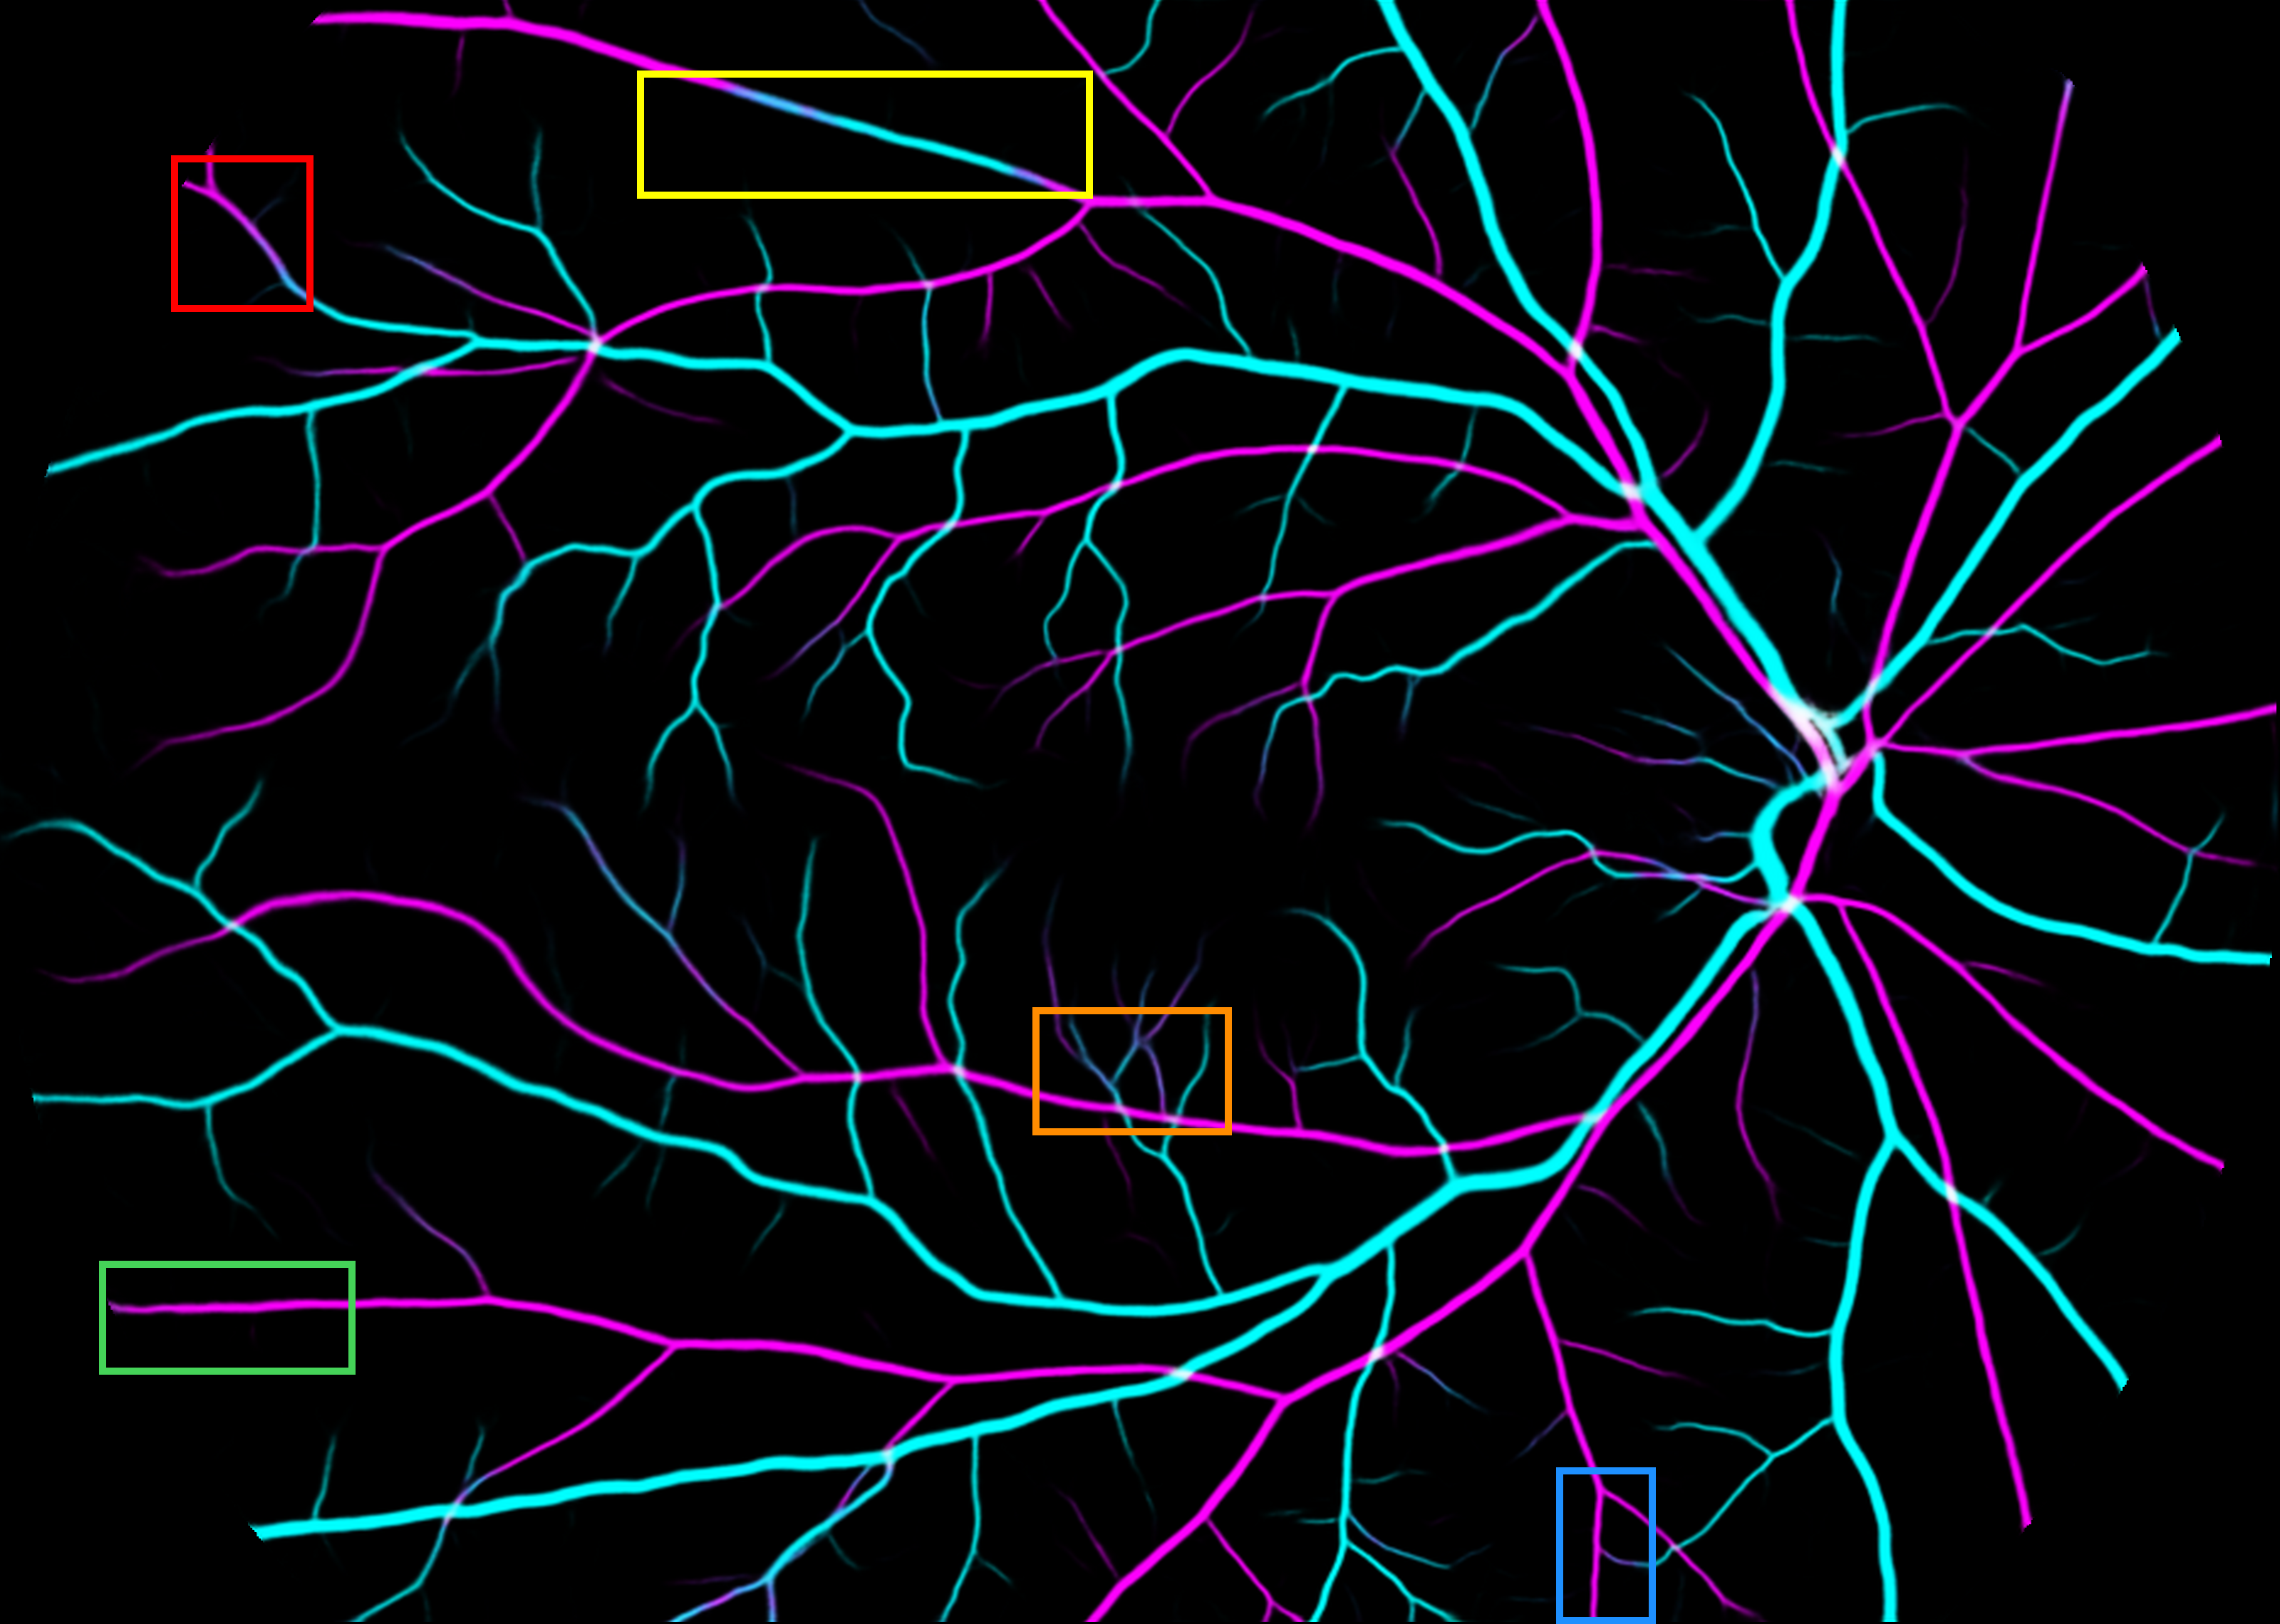
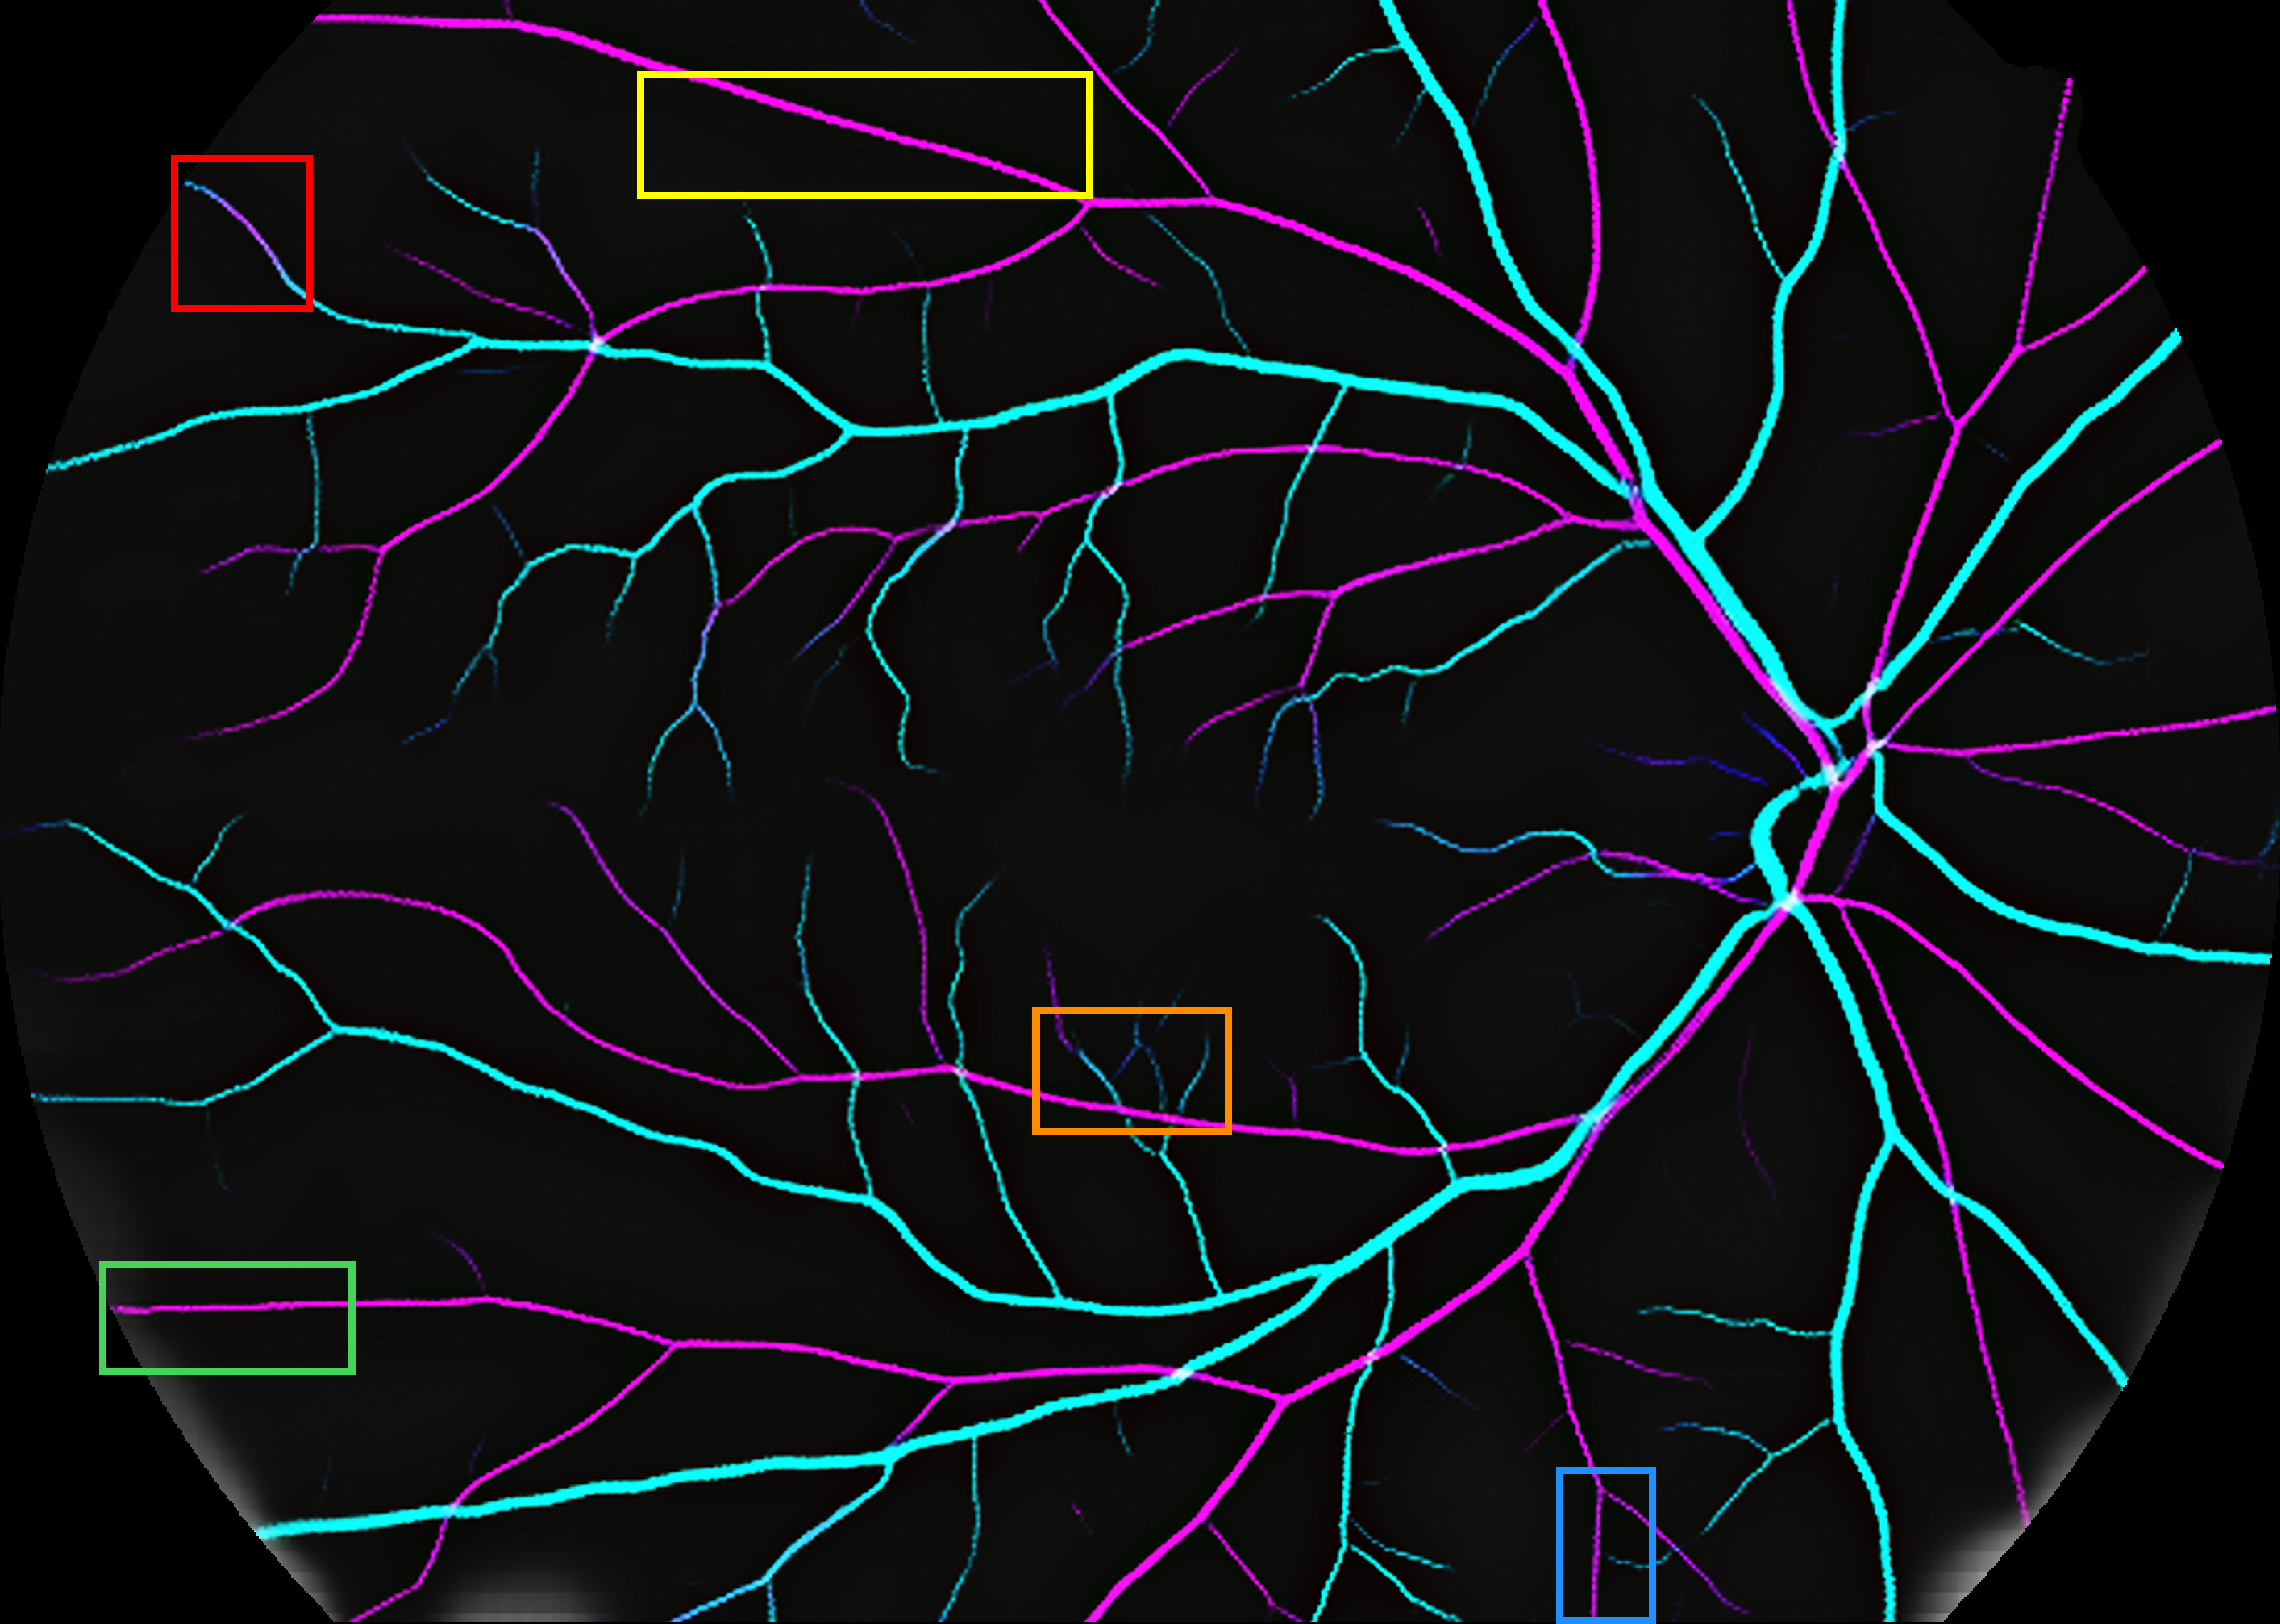
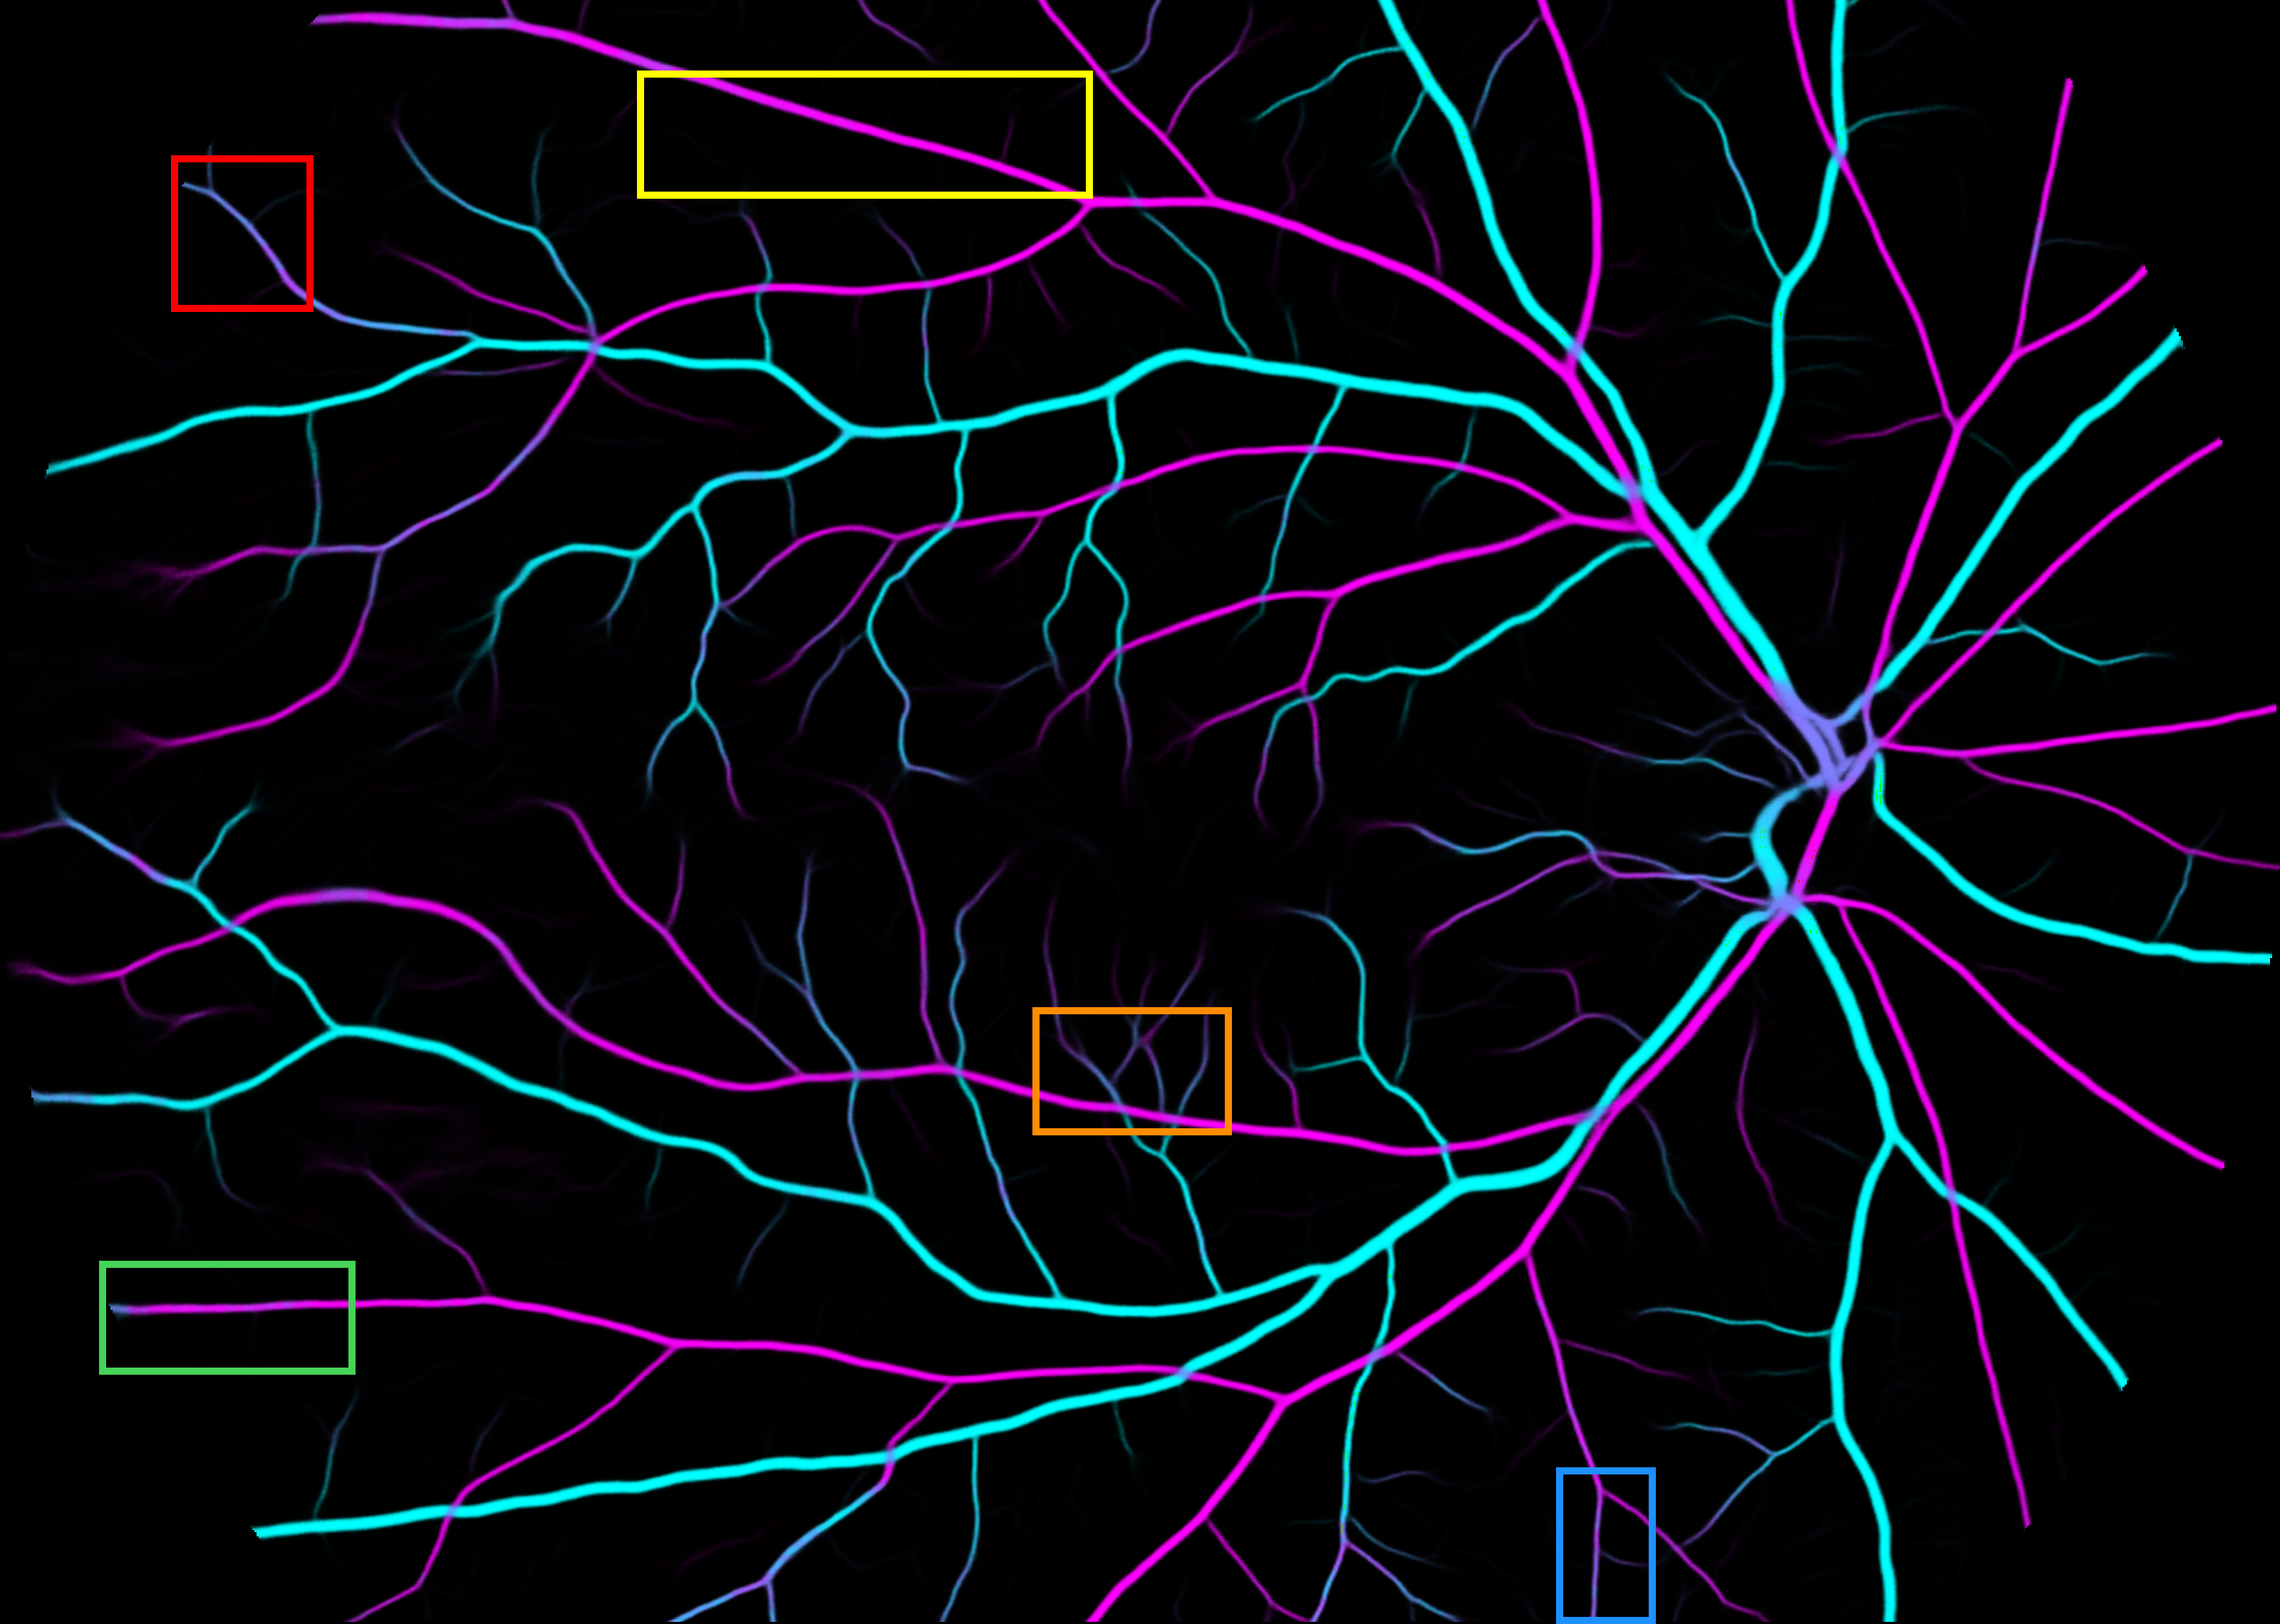
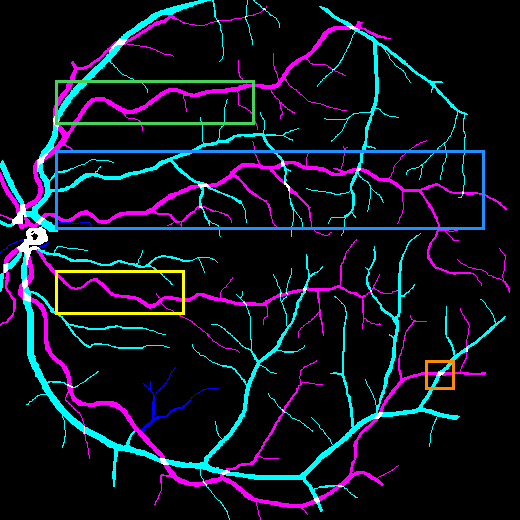
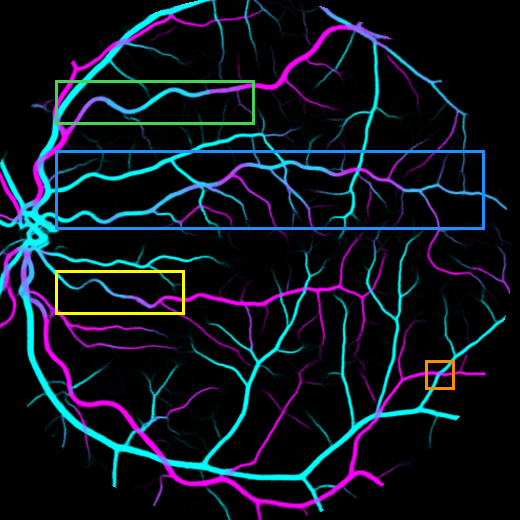
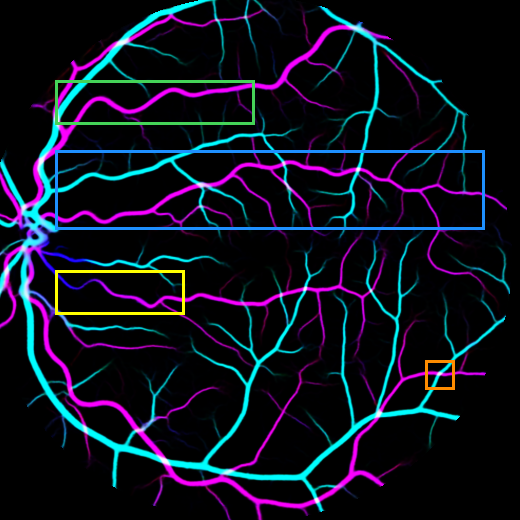
Figure 6 shows the segmentation maps of the proposed RRWNet-6 for each iteration at the output of the RR module.
| GT | Base segmentation () | |
|
|
|
|
|
|
|
|

|
|
|
|
|
|

|

|
|
|
|
|
The figure shows that the RR module progressively improves A/V classification, significantly reducing the manifest classification errors in the final segmentation map with respect to the base segmentation.
6.2 Ablation study
Table 3 shows the mean AUROC and AUPR values for A/V/BV segmentation, as well as the mean sensitivity, specificity, and accuracy values for A/V classification and BV/BG classification in RITE for partial or similar versions of RRWNet.
| Evaluation | Structure | Metric | Models | ||||
| U-Net | W-Net | RRU-Net | RRWNetAll | RRWNet | |||
| Segmentation | Artery | AUROC | * | ||||
| AUPR | * | ||||||
| Vein | AUROC | * | |||||
| AUPR | * | ||||||
| BV | AUROC | * | |||||
| AUPR | * | ||||||
| Classification | Artery/Vein | Sens. | * | ||||
| Spec. | * | ||||||
| Acc. | * | ||||||
| BV/BG | Sens. | ||||||
| Spec. | |||||||
| Acc. | * | ||||||
The results show that all methods outperformed the U-Net baseline for A/V/BV segmentation in most evaluation metrics. The only exceptions are the AUROC of the veins (for which W-Net is 0.11 pp worse and RRU-Net is 0.01 pp worse) and the BV (for which RRU-Net is 0.01 pp worse). Interestingly, RRWNetAll, which recursively refines all segmentation maps (A/V/BV), lead to improved A/V segmentation performance over U-Net, W-Net, and RRU-Net, but causes a 0.13 pp and 0.53 pp reduction in AUROC and AUPR values, respectively, for BV segmentation. This phenomenon is not observed for RRWNet, which recursively refines only the A/V segmentation maps, and lead to significantly improved segmentation performance for all structures compared to the U-Net baseline and the other methods. The improvement is particularly noticeable for artery and vein segmentation, where the AUPR values of RRWNet are 5.64 pp and 3.11 pp higher, respectively, than those of U-Net. The same is true for the AUROC values, which are 0.80 pp and 0.36 pp higher, respectively. The greater improvement in the AUPR values is particularly relevant because the AUPR is much more sensitive than the AUROC in unbalanced scenarios, as is the case here.
Similar results were obtained for A/V classification, where all methods outperformed the U-Net baseline in all evaluation metrics, and the proposed RRWNet was significantly better than the second best method in all metrics. In particular, the differences between RRWNet and U-Net are 7.41, 3.89, and 5.48 pp in terms of sensitivity, specificity, and accuracy, respectively. Similarly, RRWNetAll, which iteratively improves the output of the refinement module for all segmentation maps (A/V/BV), leads to an improved A/V classification performance compared to W-Net and RRU-Net (+1.83 pp and +2.35 pp, respectively, in terms of A/V accuracy). Smaller improvements over U-Net are observed for RRU-Net (+1.02 pp in terms of A/V accuracy) and W-Net (+1.54 pp in terms of A/V accuracy).
For BV/BG classification, the results are slightly different. In this case, the methods with refinement strategies did not outperform the U-Net baseline in 7 out of 12 cases. The decrease in performance is particularly noticeable for RRWNetAll, resulting in a 0.2 pp decrease in accuracy compared to the U-Net baseline. This is consistent with the results obtained for BV segmentation, where RRWNetAll also performed worse than the U-Net baseline. Nevertheless, RRWNet was the best method in terms of sensitivity and accuracy, with significant improvements over the other methods in the latter. The significant differences for all metrics in BV segmentation, but not in BV/BG classification, can be explained by the threshold used to binarize the output of the models, which is set to 0.5. This threshold maximizes the accuracy of the classification in the training set, but it is not necessarily the best threshold for the test set. Since AUROC and AUPR are threshold independent metrics, they are not affected by this problem.
Overall, the proposed RRWNet outperformed the other methods in 11 of the 12 evaluation segmentation and classification metrics, with significant improvements found in 10 of them.
Figure 7 shows examples of the segmentation maps obtained by the different models of the ablation study in RITE.
| GT | U-Net | W-Net |
|
|
|
|
|
|
|
| RR-UNet | RRWNetAll | RRWNet |
|
|
|
|
|
|
|
The qualitative evaluation is consistent with the quantitative results presented above. The proposed RRWNet with refinement allows to solve manifest classification errors, resulting in segmentation maps that are structurally correct and closer to the GT. Remarkably, the model is able to solve these types of errors by itself, without the need for topology constraints or post-processing techniques.
6.3 State of the art comparison
6.3.1 A/V classification and BV segmentation
Table 4 shows a comparison of the proposed model with the state of the art in the tasks of A/V classification and BV segmentation in the RITE, LES-AV and HRF datasets using the most common evaluation metrics in the literature. Following the current practice in the literature and to allow a fair comparison with the state of the art, only the intersection of the GT and the detected vessels are considered for evaluating the A/V classification performance.
| Dataset | Method | A/V classification | BV segmentation (BV/BG classification) | |||||
|---|---|---|---|---|---|---|---|---|
| Sens. | Spec. | Acc. | Sens. | Spec. | Acc. | AUROC | ||
| RITE | Girard et al. (2019) [37] | 86.3 | 86.6 | 86.5 | 78.4 | 98.1 | 95.7 | 97.2 |
| Galdran et al. (2019) [38] | 89 | 90 | 89 | 94 | 93 | 93 | 95 | |
| Ma et al. (2019) [39] | 93.4 | 95.5 | 94.5 | 79.16 | 98.11 | 95.70 | 98.10 | |
| Hemelings et al. (2019)* [40] | 95.13 | 92.78 | 93.81 | 77.61 | 98.74 | 96.08 | 88.17 | |
| Kang et al. (2020) [41] | 88.63 | 92.72 | 90.81 | - | - | - | - | |
| Morano et al. (2021) [44] | 87.47 | 90.89 | 89.24 | 79.12 | 98.65 | 96.16 | 98.33 | |
| Galdran et al. (2022)* [47] | 88.86 | 96.04 | 92.76 | 83.05 | 98.19 | 96.29 | 98.47 | |
| Hatamizadeh et al. (2022) [45] | 93.10 | 94.31 | 95.13 | - | - | - | - | |
| Karlsson et al. (2022) [46] | 95.1 | 96.0 | 95.6 | 82.2 | 97.6 | 95.6 | 98.1 | |
| Chen et al. (2022)† [43] | 95.38 | 97.20 | 96.34 | 81.51 | 97.81 | 95.75 | 96.29 | |
| Hu et al. (2023) [57] | 93.37 | 95.37 | 94.42 | 79.08 | 98.15 | 95.69 | 98.07 | |
| Second expert [68] | 95.80 | 96.82 | 96.37 | 80.38 | 96.83 | 94.76 | - | |
| RRWNet (ours) | 95.73 | 97.38 | 96.66 | 80.16 | 98.61 | 96.29 | 98.50 | |
| LES-AV | Galdran et al. (2019) [38] | 88 | 85 | 86 | - | - | - | - |
| Kang et al. (2020) [41] | 94.26 | 90.90 | 92.19 | - | - | - | - | |
| Galdran et al. (2022)* [47] | 86.86 | 93.56 | 90.47 | 76.40 | 97.73 | 95.69 | 96.27 | |
| RRWNet (ours) | 94.30 | 95.25 | 94.81 | 86.41 | 96.59 | 95.61 | 97.72 | |
| HRF | Galdran et al. (2019) [38] | 85 | 91 | 91 | - | - | - | - |
| Hemelings et al. (2019)* [40] | - | - | 96.98 | 80.74 | - | - | - | |
| Chen et al. (2022)* [43] | 97.06 | 97.29 | 97.19 | 78.14 | 98.29 | 96.59 | 94.66 | |
| Galdran et al. (2022)* [47] | 98.10 | 93.17 | 95.35 | 81.19 | 98.12 | 96.70 | 98.55 | |
| Karlsson et al. (2022)* [46] | 97.07 | 96.53 | 96.77 | 86.17 | 97.09 | 96.17 | 98.42 | |
| Hu et al. (2023) [57] | 93.37 | 95.37 | 94.42 | 69.01 | 99.02 | 96.25 | 98.15 | |
| Second expert [40] | 97.46 | 97.05 | 97.23 | 93.85 | 98.91 | 98.48 | - | |
| RRWNet (ours) | 97.98 | 97.72 | 97.83 | 82.78 | 97.87 | 96.60 | 98.57 | |
The proposed RRWNet achieved state-of-the-art performance in all datasets. In particular, in RITE, RRWNet achieved an A/V classification accuracy of 96.66% and a BV segmentation AUROC of 98.50%. These results are 0.32 and 0.27 pp higher than the second best performing method, Chen et al. (2022) [39] and Morano et al. (2021) [47], respectively. Additionally, the comparison with the Second Expert [68] shows that RRWNet achieved human-level performance in both tasks.
The proposed RRWNet also achieved state-of-the-art performance in the LES-AV dataset, with an Accuracy of 94.81% in A/V classification and an AUROC of 97.72% in BV segmentation. This is an improvement of 2.62 pp and 1.63 pp over the second best performing methods, Kang et al. (2020) [41] and Galdran et al. (2022) [47], respectively. Notably, RRWNet was evaluated in a cross-dataset setting, trained on RITE and tested on LES-AV, while Kang et al. (2020) [41] was evaluated in a 2-fold cross-validation setting in LES-AV. This demonstrates the robustness of RRWNet in generalizing to unseen datasets.
Finally, in the HRF dataset, RRWNet achieved once again state-of-the-art performance, with an A/V classification Accuracy of 97.83% (+0.64 pp over the second best performing method, Chen et al. (2022) [43]) and BV segmentation AUROC of 98.57% (+0.35 pp over the second best performing method, Galdran et al. (2022) [47]).
Overall, the performance of RRWNet was consistently better than the state of the art for all datasets and most metrics considered. Most notably, these results were achieved with a straightforward implementation of the proposed framework, without hyperparameter tuning and without the use of any post-processing techniques.
6.3.2 A/V segmentation and classification for all GT vessels and RR post-processing
Complementary to the common state-of-the-art comparison presented in Table 4, we present in Table 5 an additional comparative analysis of the proposed model with the state of the art in A/V classification using Accuracy (Acc.) (all “vessel” pixels from the GT except crossings and unknown pixels) and arteries and veins segmentation using different threshold-agnostic metrics (AUPR and AUROC) and topological metrics (COR and INF). This table also includes (in parenthesis) the results of applying the proposed RR module as a post-processing step to the segmentation maps obtained by the other methods.
| Dataset | Method | A/V | Artery | Vein | ||||||
|---|---|---|---|---|---|---|---|---|---|---|
| Acc. | AUPR | AUROC | COR | INF | AUPR | AUROC | COR | INF | ||
| RITE | Morano et al. (2021) [44] | 89.26 (94.37) | 81.49 (86.46) | 97.37 (97.95) | 13.71 (28.79) | 86.02 (70.84) | 87.26 (86.97) | 98.12 (98.16) | 27.54 (40.95) | 72.23 (58.74) |
| Galdran et al. (2022) [47] | 90.59 (94.80) | 83.26 (87.21) | 97.31 (98.02) | 9.93 (27.15) | 89.85 (72.48) | 87.71 (84.81) | 98.21 (98.27) | 16.84 (39.14) | 82.84 (60.47) | |
| Karlsson et al. (2022) [46] | 94.67 (94.70) | 86.39 (86.81) | 97.79 (97.62) | 14.42 (33.19) | 85.30 (66.42) | 89.47 (84.47) | 98.27 (97.76) | 22.39 (42.91) | 77.35 (56.75) | |
| Chen et al. (2022) [43] | 90.91 (93.93) | 80.94 (84.03) | 94.81 (96.49) | 19.04 (29.84) | 80.56 (69.80) | 85.75 (85.50) | 95.18 (97.64) | 25.16 (46.78) | 74.67 (52.68) | |
| RRWNet (ours) | 94.95 | 86.93 | 98.22 | 31.62 | 68.03 | 90.43 | 98.31 | 38.23 | 61.36 | |
| LES-AV | Morano et al. (2021) [44] | 83.62 (88.44) | 72.45 (78.02) | 96.64 (97.73) | 11.73 (26.00) | 87.82 (73.77) | 80.53 (80.60) | 97.48 (96.52) | 25.91 (32.55) | 73.64 (66.91) |
| Galdran et al. (2022) [47] | 85.39 (89.41) | 74.66 (79.74) | 97.08 (97.99) | 10.05 (23.68) | 89.68 (75.68) | 80.46 (83.47) | 97.20 (97.10) | 22.50 (35.32) | 76.86 (63.27) | |
| RRWNet (ours) | 92.61 | 81.87 | 97.18 | 47.05 | 51.68 | 86.50 | 97.70 | 49.68 | 49.45 | |
| HRF | Morano et al. (2021) [44] | 94.76 (96.32) | 84.02 (84.64) | 98.86 (99.01) | 44.87 (51.80) | 54.73 (47.87) | 87.85 (83.83) | 98.96 (99.07) | 46.27 (46.13) | 53.20 (53.07) |
| Galdran et al. (2022) [47] | 93.94 (96.65) | 82.65 (85.26) | 98.91 (99.06) | 17.07 (55.80) | 82.33 (43.40) | 86.94 (88.64) | 98.76 (99.04) | 18.07 (52.07) | 81.47 (47.07) | |
| Karlsson et al. (2022) [46] | 95.80 (96.91) | 83.27 (82.60) | 98.55 (98.52) | 31.80 (60.87) | 67.93 (38.40) | 86.42 (83.68) | 98.41 (98.50) | 23.60 (54.20) | 75.67 (45.00) | |
| Chen et al. (2022) [43] | 92.08 (96.72) | 77.95 (81.60) | 93.75 (98.06) | 27.20 (48.87) | 72.67 (50.73) | 82.12 (82.46) | 94.58 (97.99) | 36.33 (44.47) | 63.53 (54.93) | |
| RRWNet (ours) | 95.85 | 84.99 | 98.91 | 48.40 | 51.00 | 88.36 | 98.99 | 48.13 | 51.40 | |
RRWNet consistently outperformed state-of-the-art methods on several metrics. In RITE, in terms of A/V classification accuracy, RRWNet achieves 94.95%, outperforming all other methods by at least 0.28% (see Chen et al. (2022) [43]). Similar improvements in AUPR and AUROC are observed for both arteries and veins. However, the most significant improvements are observed in terms of COR and INF, with RRWNet achieving values of 31.62% and 68.03% for arteries and 38.23% and 61.36% for veins, respectively. These values are 12.58 pp higher and 12.53 pp lower than the second best method for arteries and 11.69 pp higher and 10.87 pp lower for veins. This highlights the superiority of RRWNet in producing more topologically correct segmentation maps compared to the state of the art. The results are similar for the HRF dataset, where RRWNet achieved the best performance for all metrics.
The application of the RR module as a post-processing step yields remarkable improvements in segmentation quality (Table 5). Of the 90 values in the table, 78 are improved when the RR module is used as a post-processing step. Moreover, in 14 out of 27 cases (3 datasets 9 metrics), the combination of a state-of-the-art method with the RR module achieves the best overall performance (in the remaining 13 cases, the best performance is achieved by RRWNet). This highlights the effectiveness of the RR module as a robust post-processing step capable of improving the segmentation maps obtained by heterogeneous state-of-the-art methods.
Examples of segmentation maps obtained by the different models compared in Table 5 are shown in Figures 8 and 9, for RITE and HRF datasets, respectively101010All the segmentation maps obtained by our RRWNet model for RITE, HRF and LES-AV datasets are publicly available at https://github.com/j-morano/rrwnet..
| GT | RRWNet (ours) | Morano et al. [44] |

|

|
|
 |
 |
 |
| Chen et al. [43] | Galdran et al. [47] | Karlsson et al. [46] |
|
|
|
 |
 |
 |
| GT | RRWNet (ours) | Morano et al. [44] |
|

|
|
|
|
|
|
| Chen et al. [43] | Galdran et al. [47] | Karlsson et al. [46] |
|
|
|
|
|
|
|
Overall, we can observe that the proposed RRWNet was able to segment the arteries and veins more accurately than the other methods, resulting in more topologically consistent segmentations. In addition, the proposed RRWNet was able to correctly classify the pixels belonging to crossings as both arteries and veins simultaneously (depicted in white in the segmentation maps), while the other methods tended to classify them as only one of the two classes. This resulted in discontinuities in the A/V segmentation maps of the other methods, except Chen et al. [43], which are not present in the segmentation maps obtained by the proposed RRWNet.
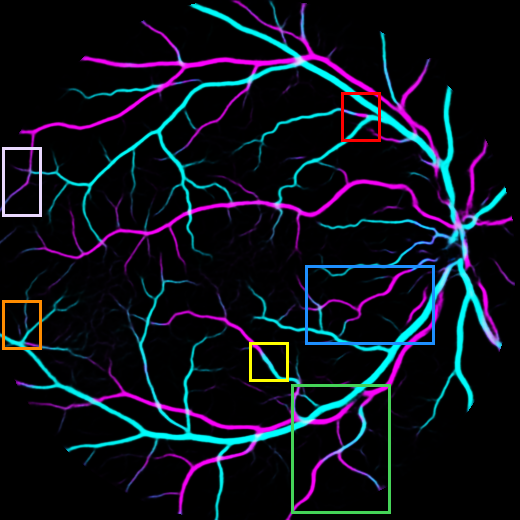
Additionally, Figure 10 shows examples of the segmentation maps obtained by the model of Galdran et al. (2022) [47] before and after applying the proposed RR module as a post-processing step.
| GT | Galdran et al. [47] | Galdran et al. [47] with RR |
|
|
|
|
|
|
|
The benefits of applying the proposed RR module as a post-processing step are clearly visible in the figure. In particular, in the given example, the RR module solved the problems of the false positive veins in the base segmentation map by correctly classifying them as arteries. In addition, it connected both arteries and veins in crossing points (shown in white) where the original segmentation map presented gaps (predicted low probability for one or both classes), a common problem to the segmentation maps obtained by the other methods, except for Chen et al. (2022) [43]. These results, along with the quantitative results presented in Table 5, show that the proposed RR can be effectively used as a standalone post-processing step to improve the segmentation maps obtained by any other method.
7 Conclusions
In this work, we have proposed a novel end-to-end framework, RRWNet, for recursively refining the semantic segmentation maps obtained by an FCNN and resolving manifest classification errors, i.e., areas whose classification is incompatible with the topology of the structures to be segmented and classified. Our framework combines the advantages of stacking module and recursive refinement approaches by decomposing the network into two specialized parts, a Base subnetwork and a Recursive Refinement subnetwork, which are trained in an end-to-end manner. The Base subnetwork is responsible for extracting the features from the input image and generating the initial segmentation maps, while the Recursive Refinement subnetwork is responsible for recursively refining the initial segmentation maps by resolving manifest classification errors. This approach implicitly recognizes the need for both local and global contextual understanding. FCNNs are particularly adept at capturing local features, especially when they are highly discriminative. We postulate that our Base network leverages these local attributes, primarily through color and contrast differentiation, to generate the base segmentation maps. However, the complexity of semantic segmentation, as in the case of A/V segmentation, typically extends beyond the scope of local features alone. Accurate classification demands a more comprehensive integration of global context. To address this, our specialized Recursive Refinement network, functioning exclusively on the base segmentation maps, employs recursive processes to capture and integrate more distant dependencies. This iterative refinement enables gradual, yet significant modifications to the classification maps, surpassing the capabilities of a single-pass approach.
The proposed framework is compatible with any FCNN architecture and can be easily integrated into existing FCNN-based methods. To validate the framework, we have proposed a straightforward implementation based on U-Net for the task of A/V segmentation and classification in retinography images. The results showed that the proposed method outperformed state-of-the-art methods by a notable margin. Moreover, the proposed RR module was able to improve the segmentation maps obtained by all the other state-of-the-art methods, highlighting its effectiveness as a standalone post-processing step.
As a general framework, the proposed method can be applied to any semantic segmentation task where topological consistency plays a fundamental role in the segmentation quality. Its application to other tasks, such as A/V segmentation in optical coherence tomography angiography (OCT-A) images and retinal layer segmentation in OCT images, represents a promising line of future work.
In conclusion, the proposed framework and its implementation (which we have made publicly available) represent an effective approach to semantic segmentation that can be applied to a wide range of tasks and modalities. We believe that this work will serve as a good reference implementation and benchmark and encourage further research in this direction, and that it will contribute to the development of more robust and accurate semantic segmentation systems, with a particular focus on the field of ophthalmology.
Acknowledgements
This work was supported in part by the Christian Doppler Research Association, Austrian Federal Ministry for Digital and Economic Affairs, the National Foundation for Research, Technology and Development.
References
- [1] M. D. Abràmoff, M. K. Garvin, and M. Sonka. Retinal imaging and image analysis. IEEE Reviews in Biomedical Engineering, 3:169–208, 2010. doi:10.1109/RBME.2010.2084567.
- [2] J. Staal, M. D. Abràmoff, M. Niemeijer, M. A. Viergever, and B. van Ginneken. Ridge-based vessel segmentation in color images of the retina. IEEE Transactions on Medical Imaging, 23(4):501–509, 2004. doi:10.1109/TMI.2004.825627.
- [3] Niall Patton, Tariq Aslam, Thomas Macgillivray, Alison Pattie, Ian J. Deary, and Baljean Dhillon. Retinal vascular image analysis as a potential screening tool for cerebrovascular disease: a rationale based on homology between cerebral and retinal microvasculatures. Journal of anatomy, 206(4):319–348, 2005. doi:10.1111/j.1469-7580.2005.00395.x.
- [4] Philip J. Rosenfeld, David M. Brown, Jeffrey S. Heier, David S. Boyer, Peter K. Kaiser, Carol Y. Chung, and Robert Y. Kim. Ranibizumab for neovascular age-related macular degeneration. New England Journal of Medicine, 355(14):1419–1431, 2006. PMID: 17021318. doi:10.1056/NEJMoa054481.
- [5] Jack J. Kanski and Brad Bowling. Clinical Ophthalmology: A Systematic Approach. Elsevier Health Sciences, seventh edition, 2011.
- [6] M.M. Fraz, S.A. Barman, P. Remagnino, A. Hoppe, A. Basit, B. Uyyanonvara, A.R. Rudnicka, and C.G. Owen. An approach to localize the retinal blood vessels using bit planes and centerline detection. Computer Methods and Programs in Biomedicine, 108(2):600 – 616, 2012. doi:10.1016/j.cmpb.2011.08.009.
- [7] Ryo Kawasaki, Ning Cheung, Jie Jin Wang, Ronald Klein, Barbara Ek Klein, Mary Frances Cotch, A. Richey Sharrett, Steven Shea, Fm Amirul Islam, and Tien Y. Wong. Retinal vessel diameters and risk of hypertension: the multiethnic study of atherosclerosis. Journal of Hypertension, 27(12):2386–2393, 2009. doi:10.1097/HJH.0b013e3283310f7e.
- [8] Cong Sun, Jie Jin Wang, David A. Mackey, and Tien Y. Wong. Retinal vascular caliber: Systemic, environmental, and genetic associations. Survey of Ophthalmology, 54(1):74 – 95, 2009. doi:10.1016/j.survophthal.2008.10.003.
- [9] Andréa Vasconcellos Batista da Silva, Sonia Alves Gouvea, Aurélio Paulo Batista da Silva, Saulo Bortolon, Anabel Nunes Rodrigues, Glaucia Rodrigues Abreu, and Fernando Luiz Herkenhoff. Changes in retinal microvascular diameter in patients with diabetes. International journal of general medicine, 8:267–273, 2015. doi:10.2147/IJGM.S83749.
- [10] Evelien Vandewalle, L Abegão Pinto, Olof B. Olafsdottir, Eline De Clerck, Peter Stalmans, Joachim Van Calster, Thierry Zeyen, Einar Stefánsson, and Ingeborg Stalmans. Oximetry in glaucoma: correlation of metabolic change with structural and functional damage. Acta Ophthalmologica, 92(2):105–110, 2014. doi:10.1111/aos.12011.
- [11] E. Prokofyeva and E. Zrenner. Epidemiology of major eye diseases leading to blindness in europe: A literature review. Ophthalmic Research, 47(4):171–188, 2012. doi:10.1159/000329603.
- [12] R. Ross. Atherosclerosis - an inflammatory disease. New England Journal of Medicine, 340(2):115–126, 1999. doi:10.1056/NEJM199901143400207.
- [13] C.D. Mathers and D. Loncar. Projections of global mortality and burden of disease from 2002 to 2030. PLoS Medicine, 3(11):2011–2030, 2006. doi:10.1371/journal.pmed.0030442.
- [14] P. Mitchell, H. Leung, J.J. Wang, E. Rochtchina, A.J. Lee, T.Y. Wong, and R. Klein. Retinal vessel diameter and open-angle glaucoma: The blue mountains eye study. Ophthalmology, 112(2):245–250, 2005. doi:10.1016/j.ophtha.2004.08.015.
- [15] S. Wang, L. Xu, Y. Wang, Y. Wang, and J. B. Jonas. Retinal vessel diameter in normal and glaucomatous eyes: the Beijing eye study. Clin. Experiment. Ophthalmol., 35(9):800–807, 2007. doi:10.1111/j.1442-9071.2007.01627.x.
- [16] L. Ramm, S. Jentsch, S. Peters, R. Augsten, and M. Hammer. Investigation of blood flow regulation and oxygen saturation of the retinal vessels in primary open-angle glaucoma. Graefe’s Archive for Clinical and Experimental Ophthalmology, 252(11):1803–1810, 2014. doi:10.1007/s00417-014-2766-4.
- [17] M. Kamran Ikram, Frank Jan de Jong, Johannes R. Vingerling, Jacqueline C. M. Witteman, Albert Hofman, Monique M. B. Breteler, and Paulus T. V. M. de Jong. Are Retinal Arteriolar or Venular Diameters Associated with Markers for Cardiovascular Disorders? The Rotterdam Study. Investigative Ophthalmology & Visual Science, 45(7):2129–2134, 2004. doi:10.1167/iovs.03-1390.
- [18] Y. Hatanaka, T. Nakagawa, A. Aoyama, X. Zhou, T. Hara, H. Fujita, M. Kakogawa, Y. Hayashi, Y. Mizukusa, and A. Fujita. Automated detection algorithm for arteriolar narrowing on fundus images. In 2005 IEEE Engineering in Medicine and Biology 27th Annual Conference, pages 286–289, 2005. doi:10.1109/IEMBS.2005.1616400.
- [19] X. Jiang and D. Mojon. Adaptive local thresholding by verification-based multithreshold probing with application to vessel detection in retinal images. IEEE Transactions on Pattern Analysis and Machine Intelligence, 25(1):131–137, 2003. doi:10.1109/TPAMI.2003.1159954.
- [20] D. Nain, A. Yezzi, and G. Turk. Vessel segmentation using a shape driven flow. In Medical Image Computing and Computer-Assisted Intervention – MICCAI, volume 3216 of LNCS, pages 51–59, 2004. doi:10.1007/978-3-540-30135-6_7.
- [21] Y. A. Tolias and S. M. Panas. A fuzzy vessel tracking algorithm for retinal images based on fuzzy clustering. IEEE Transactions on Medical Imaging, 17(2):263–273, 1998. doi:10.1109/42.700738.
- [22] C. Sinthanayothin, J. F Boyce, H. L. Cook, and T. H. Williamson. Automated localisation of the optic disc, fovea, and retinal blood vessels from digital colour fundus images. British Journal of Ophthalmology, 83(8):902–910, 1999. doi:10.1136/bjo.83.8.902.
- [23] D. Marín, A. Aquino, M. E. Gegundez-Arias, and J. M. Bravo. A new supervised method for blood vessel segmentation in retinal images by using gray-level and moment invariants-based features. IEEE Transactions on Medical Imaging, 30(1):146–158, 2011. doi:10.1109/TMI.2010.2064333.
- [24] Elisa Ricci and Renzo Perfetti. Retinal blood vessel segmentation using line operators and support vector classification. IEEE Transactions on Medical Imaging, 26(10):1357–1365, 2007. doi:10.1109/TMI.2007.898551.
- [25] P. Liskowski and K. Krawiec. Segmenting retinal blood vessels with deep neural networks. IEEE Transactions on Medical Imaging, 35(11):2369–2380, 2016. doi:10.1109/TMI.2016.2546227.
- [26] H. Fu, Y. Xu, D. W. K. Wong, and J. Liu. DeepVessel: Retinal vessel segmentation via deep learning network and fully-connected conditional random fields. In 2016 IEEE 13th International Symposium on Biomedical Imaging (ISBI), pages 698–701, 2016. doi:10.1109/ISBI.2016.7493362.
- [27] Huazhu Fu, Yanwu Xu, Stephen Lin, Damon Wing Kee Wong, and Jiang Liu. DeepVessel: Retinal vessel segmentation via deep learning and conditional random field. In Sebastien Ourselin, Leo Joskowicz, Mert R. Sabuncu, Gozde Unal, and William Wells, editors, Medical Image Computing and Computer-Assisted Intervention – MICCAI 2016, pages 132–139, Cham, 2016. Springer International Publishing. doi:10.1007/978-3-319-46723-8_16.
- [28] A. Dasgupta and S. Singh. A fully convolutional neural network based structured prediction approach towards the retinal vessel segmentation. In 2017 IEEE 14th International Symposium on Biomedical Imaging (ISBI), pages 248–251, 2017. doi:10.1109/ISBI.2017.7950512.
- [29] Zhexin Jiang, Hao Zhang, Yi Wang, and Seok-Bum Ko. Retinal blood vessel segmentation using fully convolutional network with transfer learning. Computerized Medical Imaging and Graphics, 68:1 – 15, 2018. doi:10.1016/j.compmedimag.2018.04.005.
- [30] Américo Oliveira, Sérgio Pereira, and Carlos A. Silva. Retinal vessel segmentation based on fully convolutional neural networks. Expert Systems with Applications, 112:229 – 242, 2018. doi:10.1016/j.eswa.2018.06.034.
- [31] Q. Jin, Z. Meng, T. D. Pham, Q. Chen, L. Wei, and R. Su. DUNet: A deformable network for retinal vessel segmentation. Knowledge-Based Systems, 178:149 – 162, 2019. doi:10.1016/j.knosys.2019.04.025.
- [32] R.A. Welikala, P.J. Foster, P.H. Whincup, A.R. Rudnicka, C.G. Owen, D.P. Strachan, and S.A. Barman. Automated arteriole and venule classification using deep learning for retinal images from the uk biobank cohort. Computers in Biology and Medicine, 90:23 – 32, 2017. doi:10.1016/j.compbiomed.2017.09.005.
- [33] D. Relan, T. MacGillivray, L. Ballerini, and E. Trucco. Retinal vessel classification: Sorting arteries and veins. In 2013 35th Annual International Conference of the IEEE Engineering in Medicine and Biology Society (EMBC), pages 7396–7399, 2013. doi:10.1109/EMBC.2013.6611267.
- [34] D. Relan, T. MacGillivray, L. Ballerini, and E. Trucco. Automatic retinal vessel classification using a least square-support vector machine in vampire. In 2014 36th Annual International Conference of the IEEE Engineering in Medicine and Biology Society, pages 142–145, 2014. doi:10.1109/EMBC.2014.6943549.
- [35] B. Dashtbozorg, A. M. Mendonça, and A. Campilho. An automatic graph-based approach for artery/vein classification in retinal images. IEEE Transactions on Image Processing, 23(3):1073–1083, 2014. doi:10.1109/TIP.2013.2263809.
- [36] R. Estrada, M. J. Allingham, P. S. Mettu, S. W. Cousins, C. Tomasi, and S. Farsiu. Retinal artery-vein classification via topology estimation. IEEE Transactions on Medical Imaging, 34(12):2518–2534, 2015. doi:10.1109/TMI.2015.2443117.
- [37] Fantin Girard, Conrad Kavalec, and Farida Cheriet. Joint segmentation and classification of retinal arteries/veins from fundus images. Artificial Intelligence in Medicine, 94:96 – 109, 2019. doi:10.1016/j.artmed.2019.02.004.
- [38] A. Galdran, M. Meyer, P. Costa, Mendonça, and A. Campilho. Uncertainty-aware artery/vein classification on retinal images. In 2019 IEEE 16th International Symposium on Biomedical Imaging (ISBI 2019), pages 556–560, 2019. doi:10.1109/ISBI.2019.8759380.
- [39] Wenao Ma, Shuang Yu, Kai Ma, Jiexiang Wang, Xinghao Ding, and Yefeng Zheng. Multi-task neural networks with spatial activation for retinal vessel segmentation and artery/vein classification. In Dinggang Shen, Tianming Liu, Terry M. Peters, Lawrence H. Staib, Caroline Essert, Sean Zhou, Pew-Thian Yap, and Ali Khan, editors, Medical Image Computing and Computer Assisted Intervention – MICCAI 2019, pages 769–778, Cham, 2019. Springer International Publishing. doi:10.1007/978-3-030-32239-7_85.
- [40] Ruben Hemelings, Bart Elen, Ingeborg Stalmans, Karel Van Keer, Patrick De Boever, and Matthew B. Blaschko. Artery–vein segmentation in fundus images using a fully convolutional network. Computerized Medical Imaging and Graphics, 76:101636, 2019. doi:10.1016/j.compmedimag.2019.05.004.
- [41] Hong Kang, Yingqi Gao, Song Guo, Xia Xu, Tao Li, and Kai Wang. AVNet: A retinal artery/vein classification network with category-attention weighted fusion. Computer Methods and Programs in Biomedicine, 195:105629, 2020. doi:10.1016/j.cmpb.2020.105629.
- [42] Wenting Chen, Shuang Yu, Junde Wu, Kai Ma, Cheng Bian, Chunyan Chu, Linlin Shen, and Yefeng Zheng. Tr-gan: Topology ranking gan with triplet loss for retinal artery/vein classification. In Anne L. Martel, Purang Abolmaesumi, Danail Stoyanov, Diana Mateus, Maria A. Zuluaga, S. Kevin Zhou, Daniel Racoceanu, and Leo Joskowicz, editors, Medical Image Computing and Computer Assisted Intervention – MICCAI 2020, pages 616–625, Cham, 2020. Springer International Publishing. doi:10.1007/978-3-030-59722-1_59.
- [43] Wenting Chen, Shuang Yu, Kai Ma, Wei Ji, Cheng Bian, Chunyan Chu, Linlin Shen, and Yefeng Zheng. Tw-gan: Topology and width aware gan for retinal artery/vein classification. Medical Image Analysis, page 102340, 2022. doi:10.1016/j.media.2021.102340.
- [44] José Morano, Álvaro S. Hervella, Jorge Novo, and José Rouco. Simultaneous segmentation and classification of the retinal arteries and veins from color fundus images. Artificial Intelligence in Medicine, 118:102116, 2021. doi:10.1016/j.artmed.2021.102116.
- [45] Ali Hatamizadeh, Hamid Hosseini, Niraj Patel, Jinseo Choi, Cameron C. Pole, Cory M. Hoeferlin, Steven D. Schwartz, and Demetri Terzopoulos. RAVIR: A dataset and methodology for the semantic segmentation and quantitative analysis of retinal arteries and veins in infrared reflectance imaging. IEEE Journal of Biomedical and Health Informatics, 26(7):3272–3283, 2022. doi:10.1109/JBHI.2022.3163352.
- [46] Robert Arnar Karlsson and Sveinn Hakon Hardarson. Artery vein classification in fundus images using serially connected u-nets. Computer Methods and Programs in Biomedicine, 216:106650, 2022. doi:10.1016/j.cmpb.2022.106650.
- [47] Adrian Galdran, André Anjos, José Dolz, Hadi Chakor, Hervé Lombaert, and Ismail Ben Ayed. State-of-the-art retinal vessel segmentation with minimalistic models. Scientific Reports, 12(1):6174, Apr 2022. doi:10.1038/s41598-022-09675-y.
- [48] Xiayu Xu, Rendong Wang, Peilin Lv, Bin Gao, Chan Li, Zhiqiang Tian, Tao Tan, and Feng Xu. Simultaneous arteriole and venule segmentation with domain-specific loss function on a new public database. Biomedical Optics Express, 9(7):3153–3166, 2018. doi:10.1364/BOE.9.003153.
- [49] Ian Goodfellow, Jean Pouget-Abadie, Mehdi Mirza, Bing Xu, David Warde-Farley, Sherjil Ozair, Aaron Courville, and Yoshua Bengio. Generative adversarial nets. Advances in neural information processing systems, 27, 2014.
- [50] A.M. Mendonça and A. Campilho. Segmentation of retinal blood vessels by combining the detection of centerlines and morphological reconstruction. IEEE Transactions on Medical Imaging, 25(9):1200–1213, 2006. doi:10.1109/TMI.2006.879955.
- [51] Olaf Ronneberger, Philipp Fischer, and Thomas Brox. U-net: Convolutional networks for biomedical image segmentation. In Nassir Navab, Joachim Hornegger, William M. Wells, and Alejandro F. Frangi, editors, Medical Image Computing and Computer-Assisted Intervention – MICCAI 2015, pages 234–241, Cham, 2015. Springer International Publishing. doi:10.1007/978-3-319-24574-4_28.
- [52] Bo Wang, Shengpei Wang, Shuang Qiu, Wei Wei, Haibao Wang, and Huiguang He. CSU-Net: A context spatial u-net for accurate blood vessel segmentation in fundus images. IEEE Journal of Biomedical and Health Informatics, 25(4):1128–1138, 2021. doi:10.1109/JBHI.2020.3011178.
- [53] Yanhong Liu, Ji Shen, Lei Yang, Hongnian Yu, and Guibin Bian. Wave-Net: A lightweight deep network for retinal vessel segmentation from fundus images. Computers in Biology and Medicine, 152:106341, 2023. doi:10.1016/j.compbiomed.2022.106341.
- [54] Meilin Liu, Zidong Wang, Han Li, Peishu Wu, Fuad E. Alsaadi, and Nianyin Zeng. AA-WGAN: Attention augmented wasserstein generative adversarial network with application to fundus retinal vessel segmentation. Computers in Biology and Medicine, 158:106874, 2023. doi:10.1016/j.compbiomed.2023.106874.
- [55] Yanhong Liu, Ji Shen, Lei Yang, Guibin Bian, and Hongnian Yu. Resdo-unet: A deep residual network for accurate retinal vessel segmentation from fundus images. Biomedical Signal Processing and Control, 79:104087, 2023. doi:10.1016/j.bspc.2022.104087.
- [56] A. Zamperini, A. Giachetti, E. Trucco, and K. S. Chin. Effective features for artery-vein classification in digital fundus images. In 2012 25th IEEE International Symposium on Computer-Based Medical Systems (CBMS), pages 1–6, 2012. doi:10.1109/CBMS.2012.6266336.
- [57] Jingfei Hu, Linwei Qiu, Hua Wang, and Jicong Zhang. Semi-supervised point consistency network for retinal artery/vein classification. Computers in Biology and Medicine, 168:107633, 2024. doi:10.1016/j.compbiomed.2021.107633.
- [58] Pedro Pinheiro and Ronan Collobert. Recurrent convolutional neural networks for scene labeling. In Eric P. Xing and Tony Jebara, editors, Proceedings of the 31st International Conference on Machine Learning, volume 32 of Proceedings of Machine Learning Research, pages 82–90, Bejing, China, 22–24 Jun 2014. PMLR.
- [59] Amos Sironi, Engin Türetken, Vincent Lepetit, and Pascal Fua. Multiscale centerline detection. IEEE Transactions on Pattern Analysis and Machine Intelligence, 38(7):1327–1341, 2016. doi:10.1109/TPAMI.2015.2462363.
- [60] Alejandro Newell, Kaiyu Yang, and Jia Deng. Stacked hourglass networks for human pose estimation. In Bastian Leibe, Jiri Matas, Nicu Sebe, and Max Welling, editors, Computer Vision – ECCV 2016, pages 483–499, Cham, 2016. Springer International Publishing. doi:10.1007/978-3-319-46484-8_29.
- [61] Wei Shen, Bin Wang, Yuan Jiang, Yan Wang, and Alan Yuille. Multi-stage multi-recursive-input fully convolutional networks for neuronal boundary detection. In 2017 IEEE International Conference on Computer Vision (ICCV), pages 2410–2419, 2017. doi:10.1109/ICCV.2017.262.
- [62] Michał Januszewski, Jeremy Maitin-Shepard, Peter Li, Jörgen Kornfeld, Winfried Denk, and Viren Jain. Flood-filling networks, 2016. arXiv:1611.00421.
- [63] Agata Mosinska, Pablo Márquez-Neila, Mateusz Koziński, and Pascal Fua. Beyond the pixel-wise loss for topology-aware delineation. In Proceedings of the IEEE Conference on Computer Vision and Pattern Recognition (CVPR), June 2018. doi:10.1109/CVPR.2018.00331.
- [64] José Morano, Á. S. Hervella, Noelia Barreira, Jorge Novo, and José Rouco. Multimodal transfer learning-based approaches for retinal vascular segmentation. In European Conference on Artificial Intelligence (ECAI), volume 325 of Frontiers in Artificial Intelligence and Applications, pages 1866–1873, 2020. doi:10.3233/FAIA200303.
- [65] Qiao Hu, Michael D. Abràmoff, and Mona K. Garvin. Automated separation of binary overlapping trees in low-contrast color retinal images. In Kensaku Mori, Ichiro Sakuma, Yoshinobu Sato, Christian Barillot, and Nassir Navab, editors, Medical Image Computing and Computer-Assisted Intervention – MICCAI 2013, pages 436–443, Berlin, Heidelberg, 2013. Springer Berlin Heidelberg. doi:10.1007/978-3-642-40763-5_54.
- [66] José Ignacio Orlando, João Barbosa Breda, Karel van Keer, Matthew B. Blaschko, Pablo J. Blanco, and Carlos A. Bulant. Towards a glaucoma risk index based on simulated hemodynamics from fundus images. In Alejandro F. Frangi, Julia A. Schnabel, Christos Davatzikos, Carlos Alberola-López, and Gabor Fichtinger, editors, Medical Image Computing and Computer Assisted Intervention – MICCAI 2018, pages 65–73, Cham, 2018. Springer International Publishing. doi:10.1007/978-3-030-00934-2_8.
- [67] Attila Budai, Rüdiger Bock, Andreas Maier, Joachim Hornegger, Georg Michelson, et al. Robust vessel segmentation in fundus images. International Journal of Biomedical Imaging, 2013, 2013. doi:10.1155/2013/154860.
- [68] T. A. Qureshi, M. Habib, A. Hunter, and B. Al-Diri. A manually-labeled, artery/vein classified benchmark for the drive dataset. In Proceedings of the 26th IEEE International Symposium on Computer-Based Medical Systems, pages 485–488, 2013. doi:10.1109/CBMS.2013.6627847.
- [69] Jesse Davis and Mark Goadrich. The relationship between precision-recall and roc curves. In Proceedings of the 23rd International Conference on Machine Learning, ICML ’06, page 233–240, New York, NY, USA, 2006. Association for Computing Machinery. doi:10.1145/1143844.1143874.
- [70] Takaya Saito and Marc Rehmsmeier. The precision-recall plot is more informative than the roc plot when evaluating binary classifiers on imbalanced datasets. PLOS ONE, 10(3):1–21, 03 2015. doi:10.1371/journal.pone.0118432.
- [71] Ricardo J. Araújo, Jaime S. Cardoso, and Hélder P. Oliveira. A deep learning design for improving topology coherence in blood vessel segmentation. In Dinggang Shen, Tianming Liu, Terry M. Peters, Lawrence H. Staib, Caroline Essert, Sean Zhou, Pew-Thian Yap, and Ali Khan, editors, Medical Image Computing and Computer Assisted Intervention – MICCAI 2019, pages 93–101, Cham, 2019. Springer International Publishing. doi:10.1007/978-3-030-32239-7_11.
- [72] D. P. Kingma and J. Ba. Adam: A method for stochastic optimization. In 3rd International Conference on Learning Representations, ICLR, San Diego, CA, USA, May 7-9, 2015, Conference Track Proceedings, 2015.