Probing the dipole of the diffuse gamma-ray background
Abstract
We measured the dipole of the diffuse -ray background (DGB) identifying a highly significant time-independent signal coincidental with that of the Pierre Auger UHECR. The DGB dipole is determined from flux maps in narrow energy bands constructed from 13 years of observations by the Large Area Telescope (LAT) of the Fermi satellite. The -ray maps were clipped iteratively of sources and foregrounds similar to that done for the cosmic infrared background. The clipped narrow energy band maps were then assembled into one broad energy map out to the given energy starting at Gev, where the LAT beam falls below the sky’s pixel resolution. Next we consider cuts in Galactic latitude and longitude to probe residual foreground contaminations from the Galactic Plane and Center. In the broad energy range GeV the measured dipoles are stable with respect to the various Galactic cuts, consistent with an extragalactic origin. The -ray sky’s dipole/monopole ratio is much greater than that expected from the DGB clustering component and the Compton-Getting effect origin with reasonable velocities. At it is similar to the Pierre Auger UHECRs with EeV pointing to a common origin of the two dipoles. However, the DGB flux associated with the found DGB dipole reaches parity with that of the UHECR around EeV, perhaps arguing for a non-cascading mechanism if the DGB dipole were to come from the higher energy UHECRs. The signal/noise of the DGB dipole is largest in the GeV range, possibly suggesting the -photons at these energies are the ones related to cosmic rays.
1 Introduction
The energy-spectrum of the diffuse gamma-ray background (DGB) is known accurately from Fermi-LAT measurements: at with (Ackermann et al., 2012b, 2015). The power of its angular anisotropies have been measured to be flat (white-noise) at sr out to () (Ackermann et al., 2012a, 2018). The DGB dipole has not yet been measured although it would carry important cosmological information arising from one of the following three origins: 1. The Compton-Getting (Compton & Getting, 1935) effect from Sun’s motion generates an amplified dipole over that of the CMB, assuming the latter is entirely kinematic at km/s (Kogut et al., 1993). Since is Lorentz invariant (Peebles & Wilkinson, 1968) the dimensionless kinematic DGB dipole would be , an amplification which is comparable (Maoz, 1994) to that for cosmic rays (CR) (Kachelrieß & Serpico, 2006) and the cosmic infrared background (Kashlinsky, 2005a; Kashlinsky & Atrio-Barandela, 2022). 2. The clustering (measured to have white noise angular spectrum) component dipole from the unresolved DGB sources would be using measurements from Ackermann et al. (2012b, 2018) and also here. 3. The Fermi-LAT photons may trace trace other cosmic structures, such as implied by the UHECR Pierre-Auger dipole of (Pierre Auger Collaboration et al., 2017; Aab et al., 2020a).
In proper interpretation the DGB dipole must be described not only with amplitude, but also with its direction. Here, however, fine measurements at high signal/noise are required since the directional uncertainty in the limit of is rad (Fixsen & Kashlinsky, 2011) and only CMB dipole, probed at (Kogut et al., 1993; Fixsen et al., 1994), currently allows high-precision directional determination.
We present the first measurement of the source-subtracted flux dipole over [3–100]GeV using Fermi 13 year data. We assemble the UltraClean Fermi dataset using HEALPix with (Górski et al., 2005) from the 13-year all-sky observations at narrow energy bands. After removing known sources, each -map is cleaned of the Ecliptic Plane, the Galactic plane, and remaining Galactic and extragalactic sources, structured foregrounds and noise excursions via a standard iterative procedure used in cosmic infrared background (CIB) work (see e.g. reviews by Kashlinsky, 2005a; Kashlinsky et al., 2018). Then possible remaining Galaxy emissions are further removed with progressive Galactic cuts in . The clipped narrow -maps were assembled into broad bands of increasing upper energy and the residual map dipoles evaluated for each situation. We find a robust remaining source-subtracted dipole which is highly statistically significant and independent of further Galaxy and source removal, consistent with an extragalactic origin. The signal appears stable in time for at least 6 years. The relative amplitude of the dipole is (6–7)%, which is much higher than could come from the DGB source clustering component and also higher than any kinematic Compton-Getting component, unless the local velocity is km/sec. However, the relative dipole amplitude coincides with that of the UHECR dipole from Pierre Auger Observatory (Pierre Auger Collaboration et al., 2017; Aab et al., 2020a) which we interpret as indicative of a common origin of the [3–100]GeV photons here and the UHECR.
2 Fermi-LAT data and processing
The Fermi Large Area Telescope (LAT) is a pair-conversion telescope covering the nominal GeV energy range (Atwood et al., 2009). It is operated as a sky-survey instrument, having both a wide field of view, 2 sr and large effective area: m2 for 1 GeV photons at near normal incidence. The telescope is comprised of a assembly of modules, that each consist of a tracker and calorimeter to record information needed to reconstruct photon direction and energy. The instrument is enclosed by an active anticoincidence system that allows the onboard electronics to reject charged particle events.
We selected data taken at the start of scientific operations, continuing through the end of mission Cycle 13, specifically, all the weekly photon files 08/31/2008–09/01/2021. We used the weekly photon files resulting from the latest reprocessing, P8R3111https://fermi.gsfc.nasa.gov/ssc/data/access/ and the front-plus-back converting events. To limit contamination from -rays scattered from Earth’s atmosphere, a selection cut was applied to remove data taken when the LAT boresight rocked to with respect to the zenith. The selection cuts resulting from this reprocessing significantly reduce the occurrence of cosmic ray induced spurious (i.e., non photon) events, and importantly, remove residual associated anisotropies (Bruel et al., 2018). It should also be noted that these spurious events can introduce anisotropies in large- or all-sky analyses. This is due to both non-interacting heavy ions and to cosmic-ray electrons leaking through the ribbons of the Anti-Coincidence Detector, the latter source being responsible for the background anisotropy. We also excluded any time interval when the LAT was not in survey mode. To minimize potential contamination from cosmic ray induced events in the detector we selected the “UltraClean” event selection cut and the corresponding instrument-response function, IRFs.
The possible effects on the measured DGB dipole by emissions emanating from within the Solar System are demonstrated below to be negligible.
Our analysis benefits from including as many celestial photons as possible but bright sources above our latitude cuts that are in relatively close proximity would likely introduce anisotropies. Thus we exclude emission from the remaining brightest 3,000+ sources from the 4FGL catalog (Abdollahi et al., 2022) sources then employing the clipping procedure as detailed below.
The GeV energy -ray sky at low Galactic latitudes is dominated by diffuse emissions from interactions of cosmic rays with the interstellar medium as well as with the Milky Way radiation fields. While these foreground emissions, which have been studied extensively (Ackermann et al., 2012b), provide a useful diagnostic tool to study the interstellar medium and cosmic ray propagation they are an impediment to large scale extragalactic studies. The Galactic latitude , and longitude , cuts employed in our analysis partially remove the effects of these structured foregrounds on our analysis. We assess further effects by making incremental cuts at and , removing the Ecliptic Plane and recomputing the dipole.
We apply the clipping procedure well known and commonly used in the source-subtracted CIB studies since the COBE/DIRBE, later refined for and further tested in the various 2MASS, Spitzer and Euclid work (see reviews Kashlinsky, 2005a; Kashlinsky et al., 2018). The method isolates iteratively the pixels with photons exceeding a given threshold of , removing here the entire beam at 95% c.l. around the identified in the given iteration “sources” and proceeds until no more such excursions are found at the given . Typically up to 10 iterations were needed to converge and the results are insensitive at . Of course, the method should be applied to as narrow bands as possible, especially for the -ray sky where adjacent energies often trace different sources. Figs 5,6 show the commonality of the remaining photons for the unclipped and clipped maps demonstrating the efficiency and necessity of clipping. After clipping, most remaining pixels starting already around (3–5) Gev trace different sources at two adjacent bands, and most of the sky becomes progressively darker (no photons in each pixel) at narrow energy bands, as expected. Next we combine different bands into one broader band map and then evaluate the dipoles and the mean remaining flux.
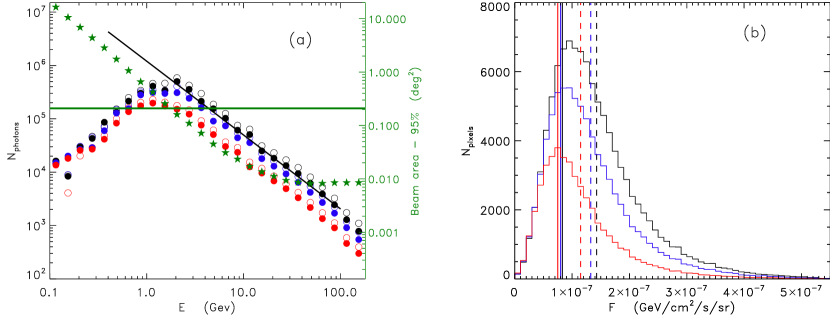
Fig.1a shows the number of photons left in each band after the procedures. The horizontal green line in Fig.1a shows the pixel area (right vertical axis) and the green asterisks mark the 95% LAT beam area which falls below our pixel resolution at GeV. The remaining after clipping -ray sources are unresolved at this resolution.
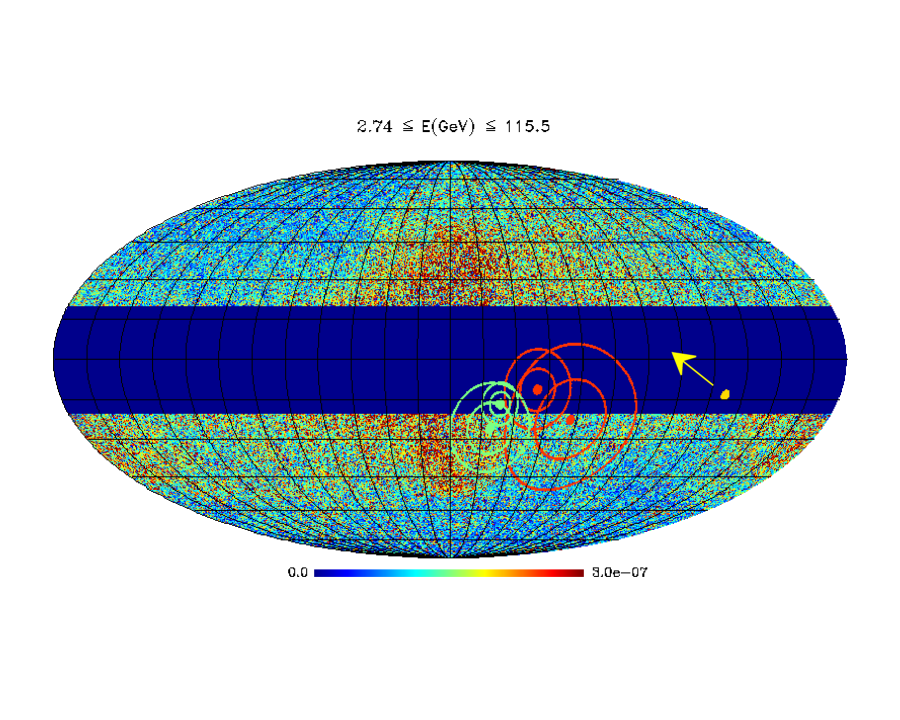
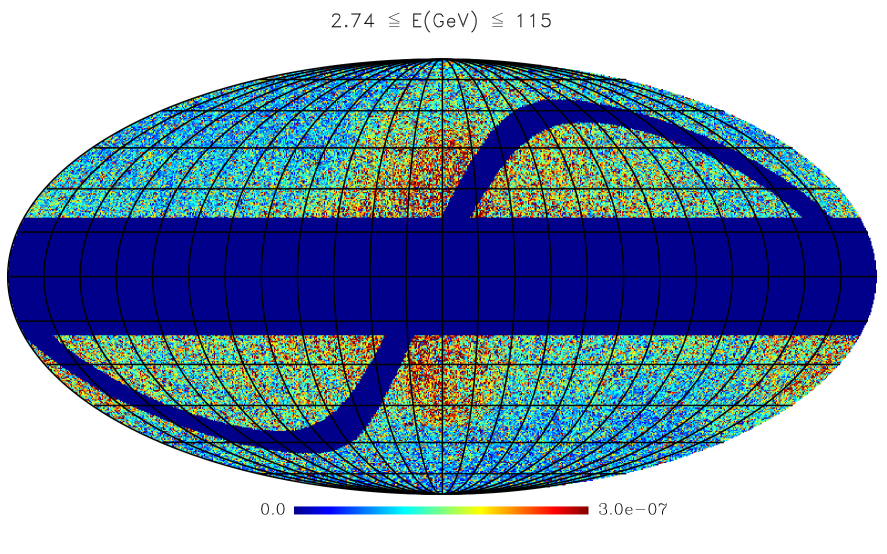
We therefore restrict our dipole DGB analysis to GeV. The clipped maps at narrow energy bands are then coadded up to GeV. Fig.1b shows the consistency of the histograms of the assembled source-subtracted maps for various -cuts and . The resultant clipped map assembled over is shown in Fig.2; the symbols are explained below.
3 Dipole results
Computations of the multipole expansion of source-subtracted, band-added maps were done with standard HEALPix routines: dipole with REMOVEDIPOLE and power spectrum with ANAFAST developed with singular-value-decomposition (Górski et al., 2005).
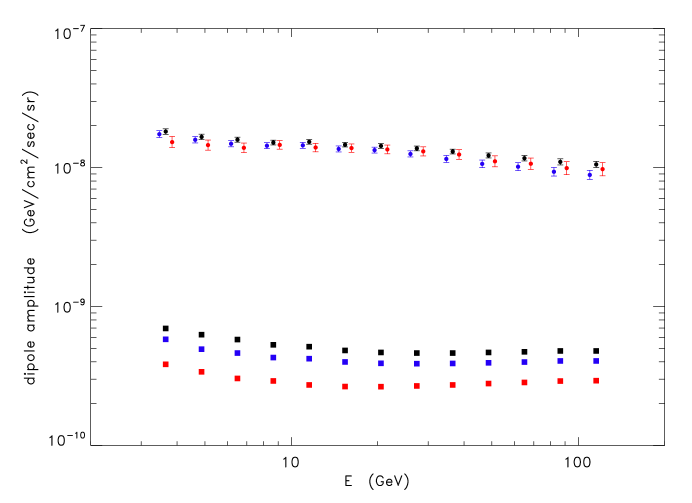
The dipole from the clipped maps is shown with circles in Fig.3. The dashed lines of three colors in Fig. 1b show the mean flux in the clipped maps of 3 values of and the solid lines of the same color show the flux dispersion of each map. The flux dispersion is GeV/cm2/s/sr which introduces random dipole uncertainty in each of the 3 components over a map of pixels of . For the dipole amplitude the uncertainty will be GeV/cm2/s/sr which shows that the dipoles found in Fig.3 are statistically significant. A more accurate estimate of the statistical error can be done by bootstrap. We generated one thousand simulated maps by assigning to each point on the unmasked regions of the sky a value extracted at random from the flux map of 13 years of data. All data points were given the same probability. Following bootstrasp standard practice, the selected values were not removed. Once a random map was generated its dipole was computed using the HEALPix remove_dipole routine. The mean of each dipole component is zero and its dispersion is a measure of the statistical error. The ratio of the signal to its statistical uncertainty is largest in the energy range GeV.
Next, we computed the statistical uncertainty in the dipole direction using the errors by generating gaussian distributed vectors about the dipole components measured from the 13-year flux map, with gaussian random numbers with zero mean and unit variance. These bootstrap error estimates do not probe time-variable component of the dipole that might be present in the data from instrument noise, systematics or genuine -ray variability.
For estimating the time-variations and noise in the maps we assembled 2 time-separated subsets of data: A for years 1-6 and B for years 7-12 with the odd year 13 left out temporarily for this task. Each of the two 6-yr time intervals are longer than the typical variability timescales of -ray sources. The masks from the clipping of sources and Galaxy for the full 13-year map in are applied to each subset and the narrow E-bands are then coadded to produce the 13 wide band maps going from GeV to the given up to GeV. Then, similar to the by-now standard CMB (Smoot et al., 1992; Bennett et al., 1996) and CIB (Arendt et al., 2010; Kashlinsky et al., 2012) noise power processing, the noise properties are computed from the maps, masked in the same way as the combined 13 year data. The resultant noise map is shown in Fig. 9 and the dipole amplitudes of the 13yrs and and dipole powers are compared in Fig. 11. Fig. 10, left displays the histograms in the time-differenced maps with the Ecliptic Plane masked out showing the standard deviations using 12yr data of GeV/cm2/s/sr. The right panel plots the correlation coefficient between the and the final 13 yr maps, and demonstrates negligible to null correlations implying that the two maps are independent with the dipole power from the contributing in quadrature to the signal shown in Fig. 3.
Regarding the possibility of systematics, our analysis is not dependent on a precision spectral determination or on an absolute flux both of which are susceptible to uncertainties in the instrument response. Furthermore, we are not subtracting a Galactic foreground model which may introduce potential systematics. Finally, our error analysis based on the time differences argue against the presence of time dependencies systematics which could arise from systematic effects in the exposure maps.
We evaluated the power spectrum of the dipole- and monopole-removed source-subtracted 13-year maps and find it is approximately white out to the computed in agreement with the earlier analyses (Ackermann et al., 2012b, 2018), except about 20-25% lower because of our (more efficient) source subtraction. The clustering dipole contribution, from averaging the (white) power at to reduce the effects of the cosmic variance at low , is shown with squares in Fig. 3. For the clustering independent of the uncovered dipole, the latter would add in quadrature contributing negligibly in the final dipole balance compared to the found dipole.
The angular uncertainty on the measured -ray dipole is shown in Fig. 2 for two configurations , (green contours), and , (red contours). To estimate the directional uncertainty we likewise generated random dipoles with the uncertainties derived from bootstrap. The angular separations between the measured and simulated dipoles sorted in increasing order and and the 1-,2- confidence intervals were defined as the regions that encloses 68% and 95% of all angular separations. The uncertainties are marked by the two sets (red and green) of small contours. This dipole determination includes diffuse and time-variable contributions. To estimate the direction and its uncertainty of the diffuse -ray component alone, we subtracted the dipole vector from the 13yrs dipole vector and added the errors in quadrature. We repeated the procedure as before and the results are shown by the wider red and green contours. Although the time varying -ray component on the direction has some effect, in Appendix we show that its effect on the dipole amplitude is negligible. The Pierre Auger dipole is shown as a yellow point and the arrow indicates its possible location prior to the deflection produced by a model of the Galactic magnetic field.
4 Discussion
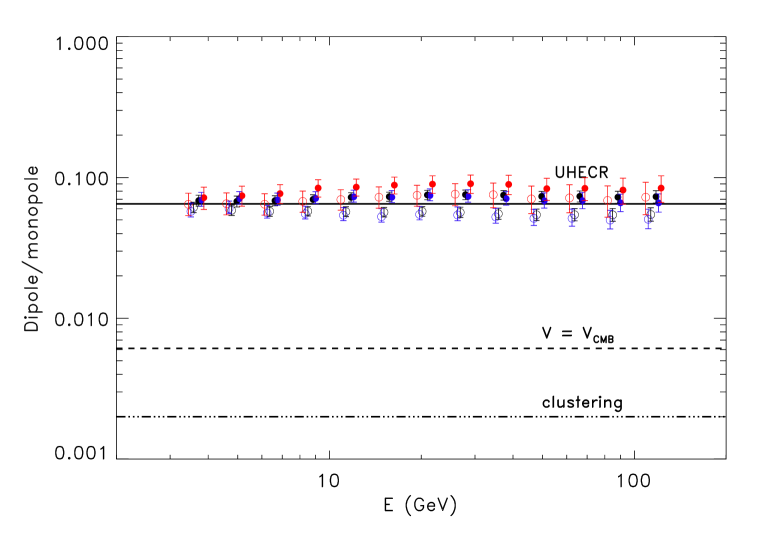
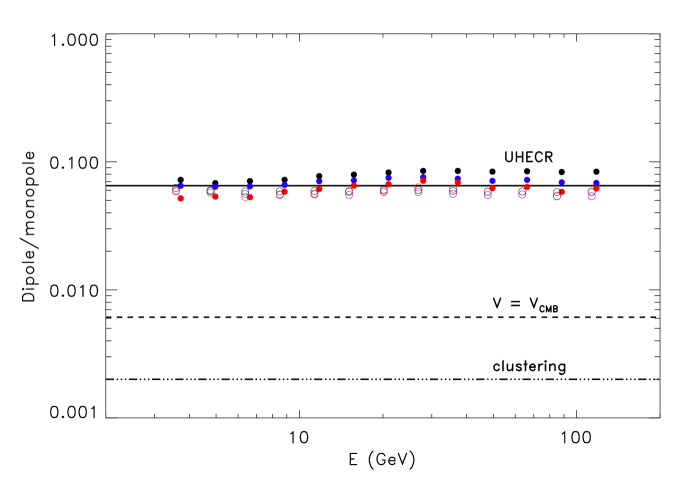
Fig. 4 summarizes our findings in terms of the dimensionless dipole amplitudes. The identified dipole has dimensionless amplitude out to GeV and can be either of Galactic origin, or extragalactic from one of the 3 origins mentioned in the Introduction. It is unlikely to come from the Galaxy as its properties show no dependence on the Galactic cuts, , outside of the Galactic Center for GeV. Foregrounds are removed efficiently here and the DGB is reproduced for the remaining sky as Fig.2 showed.
The dipole directions are consistent for all Galaxy cuts and -configurations with the 68% c.l. errors of 10∘–20∘. The rms directional uncertainty is close to radian (Fixsen & Kashlinsky, 2011). For data in the region and cuts in , the dipoles are located in the range ; for the data in the region and for the same cuts in the dipoles are at Galactic . In Fig. 2 we show the direction and its 68% and 95% angular dispersion for several configurations. We note that the direction comparison is further hampered by the deflection of cosmic rays by the Galactic magnetic field, shown by the (model dependent) location of the UHECR dipole prior to this effect.
We tested for Solar System effects, primarily from the Sun and Moon, by removing the Ecliptic Plane and find no noticeable changes in the dipole as discussed in Appendix. The distribution of Solar-system emissions are expected to be sharply distributed about the ecliptic (Johannesson & Orlando, 2013). We considered the possibility of -ray emission emanating from the Solar system by masking the band of the Ecliptic Plane and find the same signal within the errors, indicating negligible contribution from there demonstrating at most a negligible dipole contribution to the measured signal.
The expected dipole component from clustering, , is shown in Fig.3 to be on average from using the power spectra computed here which is consistent with Ackermann et al. (2012b, 2018); if the found dipole is independent of clustering is added in quadrature making this contribution totally negligible. Cosmic variance affects the measured clustering dipole per probability distribution (Kaiser, 1983; Abbott & Wise, 1984); hence at 95, 99% c.l. , still well below the found dipole. This makes clustering an unlikely origin for the measured dipole. The fact that the measured diffuse emission power spectrum agrees well with the other measurements and shows no drastic dependence on the Galaxy cuts further indicates that the diffuse emission, and likely its dipole, does not have critical Galactic components.
If the dipole originates from the Compton-Getting effect due to our kinematic motion the implied velocity would be km/sec, an order of magnitude larger than the CMB dipole equivalent velocity marked with the dashed line in Fig. 4 and significantly larger than the effective velocities implied in other dipole measurements (Kashlinsky et al., 2008, 2010, 2011; Singal, 2011; Atrio-Barandela et al., 2015; Secrest et al., 2022). Thus the Compton-Getting amplified kinematic origin of the measured DGB dipole also appears to us implausible.
At face-value there appears a commonality with the UHECR dipole from Pierre Auger Observatory (Pierre Auger Collaboration et al., 2017). The dimensionless amplitude of the UHECR dipole at EeV is shown in Fig. 4 with the solid line at 6.5%. It coincides well with the found DGB dipole perhaps suggesting a common origin. The source of the UHECRs in general is still unknown. Active galactic nuclei (AGN) have long been considered as potential sites for production of high-energy cosmic rays including possibly UHECRs (Fang & Murase, 2018; Murase & Stecker, 2022). Also, there has been similar speculation regarding gamma-ray bursts (GRBs) and they cannot currently be ruled out as sources of prolific UHECR emission (Murase et al., 2022). However, both of these populations are well known to be highly isotropic. So, some as yet unidentified subpopulation would be required to produce the dipole anisotropy documented by the Pierre Auger experiment if AGNs or GRBs are its source. Very generally a common origin of UHECR and the [3–100] GeV DGB may be due to pionic photons (Halzen & Hooper, 2002) from photomesonic production (Stecker & Salamon, 1999) arising in several mechanisms. Possible venues may come from UHECRs above the GZK knee around eV (Greisen, 1966; Zatsepin & Kuz’min, 1966) with pions arising from the -resonance: , or more speculatively from proton decay (Sakharov, 1967) , (Tanabashi et al., 2018). Subsequently, and on average the pionic photons would carry of the parent pion’s energy (Mészáros, 2014; Halzen & Kheirandish, 2019; Globus & Blandford, 2023). GZK horizon of Mpc would then apply to the sources in the latter case (Stecker, 1968; Ding et al., 2021) whose precise value depends on the CR composition (Ahlers & Salvado, 2011). The pions trigger electromagnetic cascades, transferring energy from the CRs to the GeV–TeV -ray photons (Fornasa & Sánchez-Conde, 2015), but their energy flux would have to be up to 50% of the CR flux (Kalashev et al., 2009). However, the dipole here corresponds to the [3–100] flux of GeV/cm2/s/sr which is reached for UHECRs around EeV (Mészáros, 2014; Fang & Murase, 2018; Aab et al., 2020b), so it is not clear whether a cascading mechanism can produce the -ray signal out of the UHECR protons. More likely this points to a common origin between the cosmic rays and the high- photons observed here by Fermi-LAT. See possible specific models in e.g. (Waxman, 1995; Fang & Murase, 2018; Ding et al., 2021). In this case the distance to the sources may not exceed the horizon for high- -rays (Nikishov, 1961; Stecker, 1968; Fazio & Stecker, 1970) from CIB and optical background (Kashlinsky, 2005b; Helgason & Kashlinsky, 2012; Fermi-LAT Collaboration et al., 2018). These sources lie at smaller distances than the cluster sample used in the dark flow dipolar probe (Kashlinsky et al., 2008, 2010), or the source sample of the WISE dipole probe (Secrest et al., 2022) and cannot affect those analyses.
However, as a result of magnetic deflection, using UHECR anisotropy information to constrain the spatial distribution or the nature of the comic-ray sources is not plausible given the limitations inherent in galactic and extragalactic magnetic field models (Allard et al., 2022). Indeed, we cannot unambiguously claim an association between the UHECR and gamma-ray dipoles, although the coincidence in amplitude and nominal orientation is intriguing. We would note that though that in the case of a common source the dipole nature of the UHCER flux is likely to be preserved despite magnetic deflection of individual particles.
In addition to the issue of magnetic deflection it must be considered that the sources of gamma-rays and UHECRs maybe not be strictly in common. For example, it is apparently the case that some subset of gamma-ray emitting blazar AGN are prolific sources of high-energy neutrinos while some are not; or perhaps the production sites within the latter are opaque to gamma-ray emission; see e.g. (Plavin et al., 2023). Additionally, there are apparently non-blazar sources of high-energy neutrinos, e.g., NGC 1068 and perhaps the Milky Way itself. The Ice-Cube neutrinos may be unrelated to the Auger UHECRs, but by analogy the underlying UHCER sources may comprise a similarly non-homogeneous population.
Appendix
Map clipping
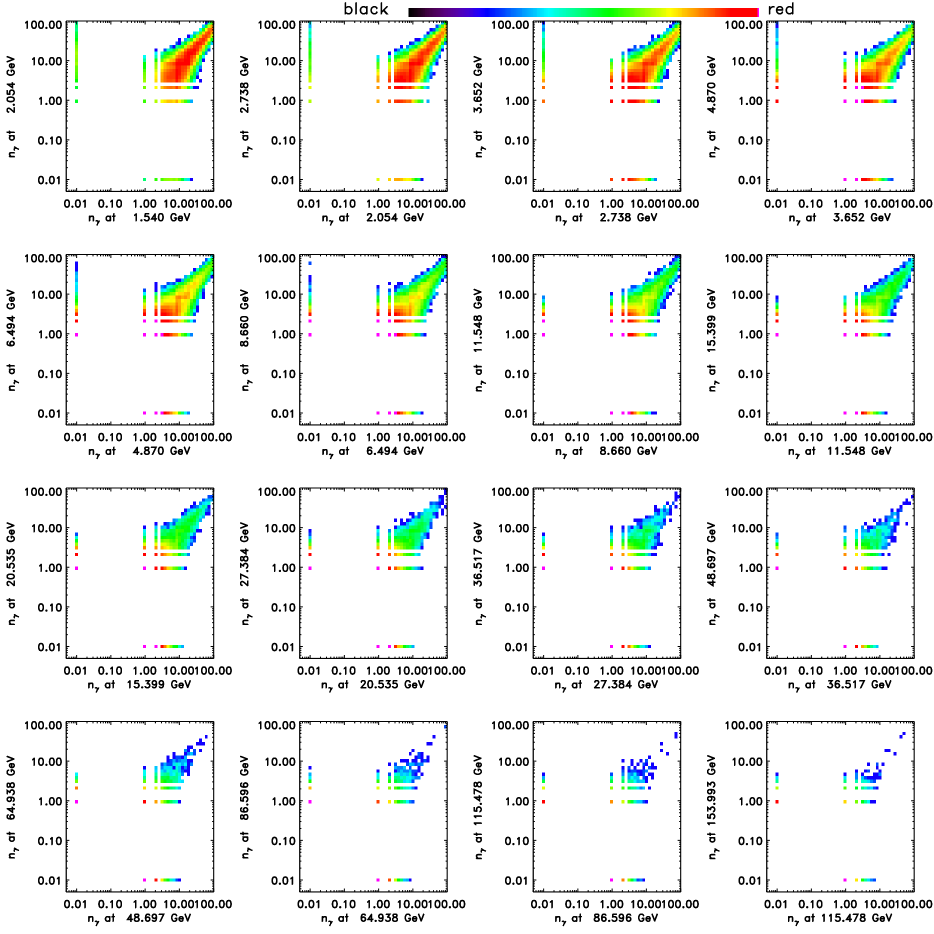
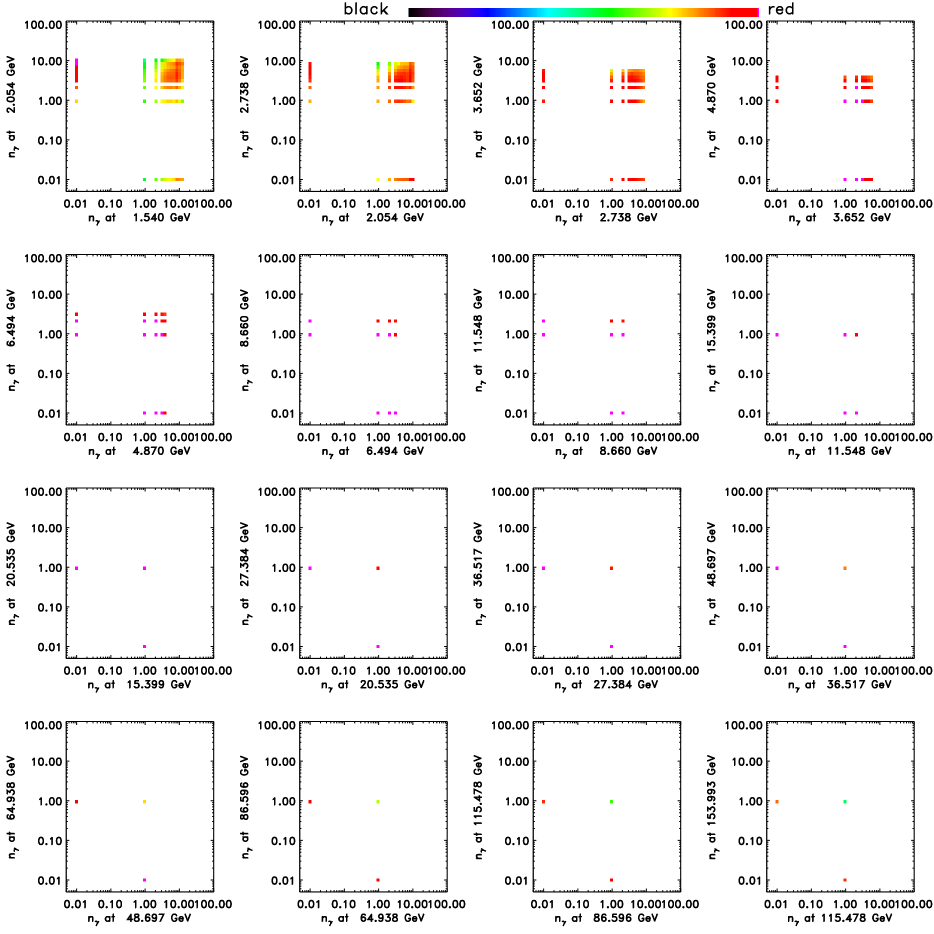
Fig. 5 shows the commonality of photons in unclipped maps at the given between each 2 adjacent bands starting at 1.15 Gev for the energy range at which the DGB dipole will be assessed. Magenta colors correspond to most photons with blue to the fewest. The figure shows that as one reaches higher there are fewer and fewer common pixels even among the two most adjacent bands. Fig. 6 shows the same after clipping.
Testing for null systematics from the plane of the Ecliptic
In principle, the Sun produces diffuse -rays from the inverse Compton scattering on its radiation field and the Moon produces some diffuse gamma-ray component from cosmic-ray interactions. Once averaged over the year, the Sun and the Moon may contribute some anisotropic diffuse components contributions which we test here.
From, e.g., Ackermann et al. (2015) it is evident that the solar system flux can be at a level of up to of the isotropic background level. However, this emission, which is due to cosmic ray interactions with the Solar disk and the Moon as well as the inverse-Compton radiation involving the Solar radiation field, is concentrated along the Ecliptic Plane; see e.g. Fig. 2, Johannesson & Orlando (2013). We also generated emission templates as described therein and examined the latitude profiles. Examination of the resulting latitude profiles suggest that a Ecliptic latitude cut should lead to eliminating of the Solar System emissions. In any case, the Ecliptic latitude cut did not lead to a discernible difference in our dipole determination as noted in the main part.
Fig. 7 shows the same map as used in the main part, Fig. 3, demonstrating no obvious contributions from emissions within the Ecliptic Plane.
Fig. 8 shows the dipole/monopole ratio, as in Fig. 4, when emissions from the Ecliptic Plane are not masked out. The two sets of numbers are essentially identical within the errors demonstrating no substantial contributions to the identified DGB dipole from the Solar System and Moon -ray emissions.
Testing for time-variability with time differenced maps
For estimating the time-variations and noise in the maps we assembled 2 time-separated subsets of data. Subset for years 1–6 and subset for years 7–12 with the odd year 13 left out temporarily in this task. The two 6-yr time intervals are each longer than the variability timescales of -ray sources. The masks from the clipping of sources and Galaxy for the full 13-year map in are applied to each subset and the narrow -bands are then coadded to produce the 13 band maps going from GeV to the given up to the final GeV.
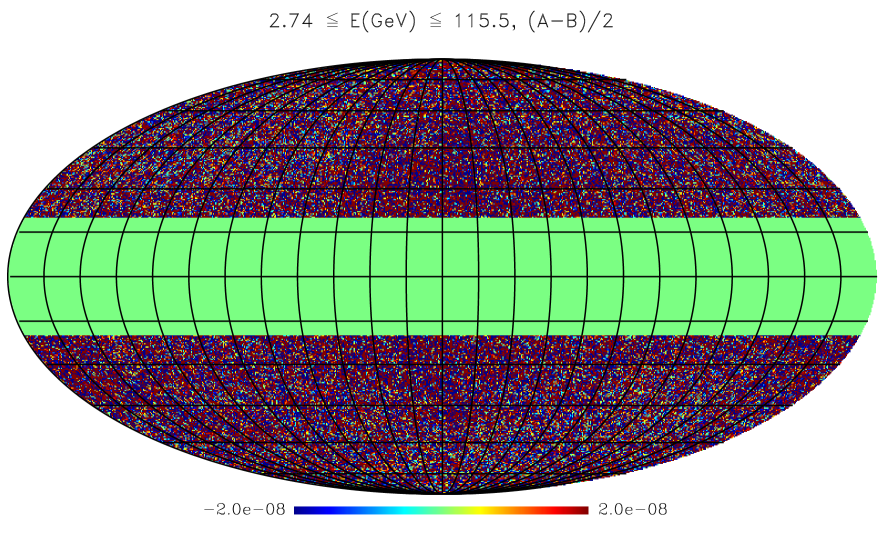
Fig. 9 shows the resultant time-differenced map, , with the Galactic Plane cut out at .
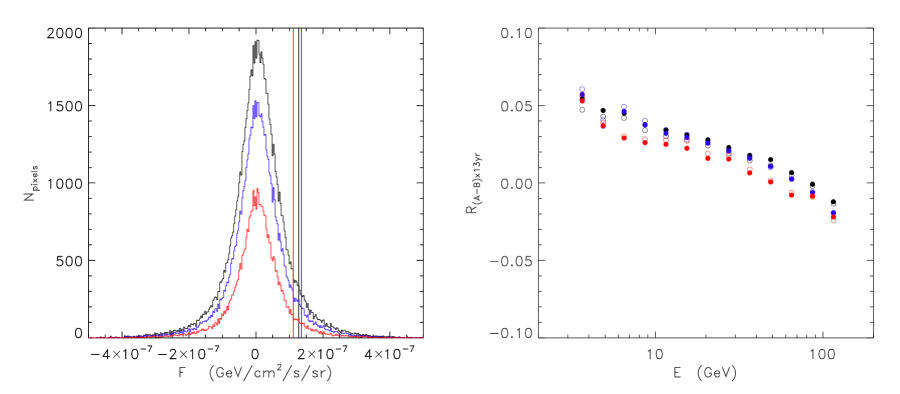
Fig. 10, left displays the histograms in the time-differenced maps with the Ecliptic Plane masked out. The source-clipping mask from the full 13-year datasets has been applied and the sky is kept at and for the black/blue/red colors. The standard deviations are shown with vertical solid lines corresponding to GeV/cm2/s/sr.
Fig. 10, right plots the correlation coefficient, , between the and the final 13 yr maps. The figure demonstrates negligible to null correlations implying that the two maps are independent with the dipole power from the contributing in quadrature to the signal shown in Fig. 3. The precise amplitude, and sign, of the negligible cross-correlation appears sensitive to the (small) addition of -ray photons at higher .
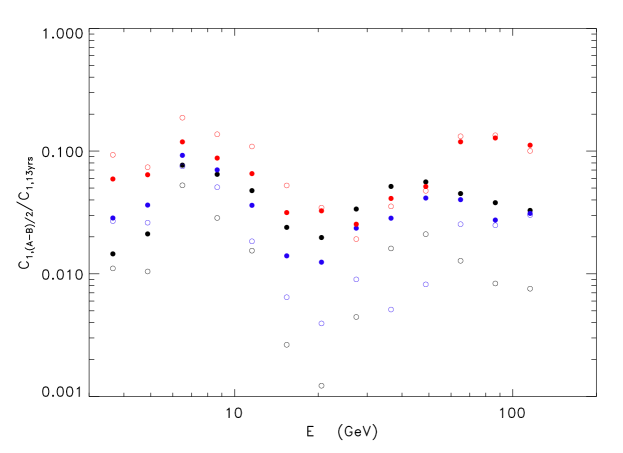
Fig. 11 shows the ratio of the dipole powers, , in the to that in the 13 yr maps. With the uncorrelated time-varying contribution to the 13 yr dipole added in quadrature this implies that the dipole power contributed, , from the time-differenced maps is well below . Whereas the 13 yr maps appears to have a stable dipole for the various considered configurations, the dipole power varies drastically, by more than 2 orders of magnitude, further suggesting the absence of their substantive contributions to the uncovered dipole in Fig. 3.
Thus the time-variations between the two 6 yr subsets cannot make appreciable contribution to the dipole power found here.
Acknowledgments
This work was supported by NASA ROSES 2020 Grant Number 80NSSC20K1597, “Cosmological Dipole of the Extragalactic Gamma-Ray Background with Multi-Year Fermi LAT Data”. F.A.B. acknowledges financial support from Grants PID2021-122938NB-I00 funded by MCIN/AEI/10.13039/501100011033 and by AERDF A way of making Europe” and SA083P17 funded by the Junta de Castilla y León. We thank Rick Arendt for careful inspection of the final maps.
References
- Aab et al. (2020a) Aab, A., Abreu, P., Aglietta, M., et al. 2020a, ApJ, 891, 142
- Aab et al. (2020b) —. 2020b, Phys. Rev. D, 102, 062005
- Abbott & Wise (1984) Abbott, L. F., & Wise, M. B. 1984, ApJ, 282, L47
- Abdollahi et al. (2022) Abdollahi, S., Acero, F., Baldini, L., et al. 2022, ApJS, 260, 53
- Ackermann et al. (2012a) Ackermann, M., Ajello, M., Albert, A., et al. 2012a, Phys. Rev. D, 85, 083007
- Ackermann et al. (2012b) Ackermann, M., Ajello, M., Atwood, W. B., et al. 2012b, ApJ, 750, 3
- Ackermann et al. (2015) Ackermann, M., Ajello, M., Albert, A., et al. 2015, ApJ, 799, 86
- Ackermann et al. (2018) Ackermann, M., Ajello, M., Baldini, L., et al. 2018, Phys. Rev. Lett., 121, 241101
- Ahlers & Salvado (2011) Ahlers, M., & Salvado, J. 2011, Phys. Rev. D, 84, 085019
- Allard et al. (2022) Allard, D., Aublin, J., Baret, B., & Parizot, E. 2022, A&A, 664, A120
- Arendt et al. (2010) Arendt, R. G., Kashlinsky, A., Moseley, S. H., & Mather, J. 2010, ApJS, 186, 10
- Atrio-Barandela et al. (2015) Atrio-Barandela, F., Kashlinsky, A., Ebeling, H., Fixsen, D. J., & Kocevski, D. 2015, ApJ, 810, 143
- Atwood et al. (2009) Atwood, W. B., Abdo, A. A., Ackermann, M., et al. 2009, ApJ, 697, 1071
- Bennett et al. (1996) Bennett, C. L., Banday, A. J., Gorski, K. M., et al. 1996, ApJ, 464, L1
- Bruel et al. (2018) Bruel, P., Burnett, T. H., Digel, S. W., et al. 2018, arXiv e-prints, arXiv:1810.11394
- Compton & Getting (1935) Compton, A. H., & Getting, I. A. 1935, Physical Review, 47, 817
- Ding et al. (2021) Ding, C., Globus, N., & Farrar, G. R. 2021, ApJ, 913, L13
- Fang & Murase (2018) Fang, K., & Murase, K. 2018, Nature Physics, 14, 396
- Fazio & Stecker (1970) Fazio, G. G., & Stecker, F. W. 1970, Nature, 226, 135
- Fermi-LAT Collaboration et al. (2018) Fermi-LAT Collaboration, Abdollahi, S., Ackermann, M., et al. 2018, Science, 362, 1031
- Fixsen & Kashlinsky (2011) Fixsen, D. J., & Kashlinsky, A. 2011, ApJ, 734, 61
- Fixsen et al. (1994) Fixsen, D. J., Cheng, E. S., Cottingham, D. A., et al. 1994, ApJ, 420, 445
- Fornasa & Sánchez-Conde (2015) Fornasa, M., & Sánchez-Conde, M. A. 2015, Phys. Rep., 598, 1
- Globus & Blandford (2023) Globus, N., & Blandford, R. 2023, arXiv e-prints, arXiv:2302.06791
- Górski et al. (2005) Górski, K. M., Hivon, E., Banday, A. J., et al. 2005, ApJ, 622, 759
- Greisen (1966) Greisen, K. 1966, Phys. Rev. Lett., 16, 748
- Halzen & Hooper (2002) Halzen, F., & Hooper, D. 2002, Reports on Progress in Physics, 65, 1025
- Halzen & Kheirandish (2019) Halzen, F., & Kheirandish, A. 2019, Frontiers in Astronomy and Space Sciences, 6, 32
- Helgason & Kashlinsky (2012) Helgason, K., & Kashlinsky, A. 2012, ApJ, 758, L13
- Johannesson & Orlando (2013) Johannesson, G., & Orlando, E. 2013, in International Cosmic Ray Conference, Vol. 33, International Cosmic Ray Conference, 3106
- Kachelrieß & Serpico (2006) Kachelrieß, M., & Serpico, P. D. 2006, Physics Letters B, 640, 225
- Kaiser (1983) Kaiser, N. 1983, ApJ, 273, L17
- Kalashev et al. (2009) Kalashev, O. E., Semikoz, D. V., & Sigl, G. 2009, Phys. Rev. D, 79, 063005
- Kashlinsky (2005a) Kashlinsky, A. 2005a, Phys. Rep., 409, 361
- Kashlinsky (2005b) —. 2005b, ApJ, 633, L5
- Kashlinsky et al. (2012) Kashlinsky, A., Arendt, R. G., Ashby, M. L. N., et al. 2012, ApJ, 753, 63
- Kashlinsky et al. (2018) Kashlinsky, A., Arendt, R. G., Atrio-Barandela, F., et al. 2018, Reviews of Modern Physics, 90, 025006
- Kashlinsky & Atrio-Barandela (2022) Kashlinsky, A., & Atrio-Barandela, F. 2022, MNRAS, 515, L11
- Kashlinsky et al. (2011) Kashlinsky, A., Atrio-Barandela, F., & Ebeling, H. 2011, ApJ, 732, 1
- Kashlinsky et al. (2010) Kashlinsky, A., Atrio-Barandela, F., Ebeling, H., Edge, A., & Kocevski, D. 2010, ApJ, 712, L81
- Kashlinsky et al. (2008) Kashlinsky, A., Atrio-Barandela, F., Kocevski, D., & Ebeling, H. 2008, ApJ, 686, L49
- Kogut et al. (1993) Kogut, A., Lineweaver, C., Smoot, G. F., et al. 1993, ApJ, 419, 1
- Maoz (1994) Maoz, E. 1994, ApJ, 428, 454
- Mészáros (2014) Mészáros, P. 2014, Nuclear Physics B Proceedings Supplements, 256, 241
- Murase et al. (2022) Murase, K., Mukhopadhyay, M., Kheirandish, A., Kimura, S. S., & Fang, K. 2022, ApJ, 941, L10
- Murase & Stecker (2022) Murase, K., & Stecker, F. W. 2022, arXiv e-prints, arXiv:2202.03381
- Nikishov (1961) Nikishov, A. 1961, Zhur. Eksptl’. i Teoret. Fiz., 41
- Peebles & Wilkinson (1968) Peebles, P. J., & Wilkinson, D. T. 1968, Physical Review, 174, 2168
- Pierre Auger Collaboration et al. (2017) Pierre Auger Collaboration, Aab, A., Abreu, P., et al. 2017, Science, 357, 1266
- Plavin et al. (2023) Plavin, A. V., Kovalev, Y. Y., Kovalev, Y. A., & Troitsky, S. V. 2023, MNRAS, 523, 1799
- Sakharov (1967) Sakharov, A. D. 1967, Soviet Journal of Experimental and Theoretical Physics Letters, 5, 24
- Secrest et al. (2022) Secrest, N., von Hausegger, S., Rameez, M., Mohayaee, R., & Sarkar, S. 2022, arXiv e-prints, arXiv:2206.05624
- Singal (2011) Singal, A. K. 2011, ApJ, 742, L23
- Smoot et al. (1992) Smoot, G. F., Bennett, C. L., Kogut, A., et al. 1992, ApJ, 396, L1
- Stecker (1968) Stecker, F. W. 1968, Phys. Rev. Lett., 21, 1016
- Stecker & Salamon (1999) Stecker, F. W., & Salamon, M. H. 1999, ApJ, 512, 521
- Tanabashi et al. (2018) Tanabashi, M., Hagiwara, K., Hikasa, K., et al. 2018, Phys. Rev. D, 98, 030001
- Waxman (1995) Waxman, E. 1995, Phys. Rev. Lett., 75, 386
- Zatsepin & Kuz’min (1966) Zatsepin, G. T., & Kuz’min, V. A. 1966, Soviet Journal of Experimental and Theoretical Physics Letters, 4, 78