Version 4 as of
Primary authors: MIT, NTU, INFN Bari
To be submitted to PRL
Long-range near-side correlation in Collisions at 183-209 GeV with ALEPH Archived Data
Abstract
The first measurement of two-particle angular correlations for charged particles produced in annihilation up to GeV with LEP-II data is presented. Hadronic data, archived at center-of-mass energies ranging from 183 to 209 GeV, were collected using the ALEPH detector at LEP. The angular correlation functions have been measured across a wide range of pseudorapidities and the full azimuth in bins of charged particle multiplicity. Results for data at high energies, which allow for higher event multiplicities reaching approximately 50 than LEP-I at Z pole energy, are presented for the first time. A long-range near-side excess in the correlation function has been identified in the analysis when calculating particle kinematic variables with respect to the thrust axis. Moreover, the two-particle correlation functions were decomposed using a Fourier series, and the resulting Fourier coefficients were compared with event generator outputs. In events with high multiplicity featuring more than 50 particles, the extracted magnitude from the data are compared to those from the Monte Carlo reference.
In heavy-ion collision experiments, two-particle angular correlations Adams et al. (2005); Abelev et al. (2009); Alver et al. (2010); Chatrchyan et al. (2012); Aamodt et al. (2012); Adam et al. (2019) are extracted for studying the Quark-Gluon Plasma (QGP) Busza et al. (2018). In these measurements, a long-range angular correlation, known as the ridge Abelev et al. (2009); Alver et al. (2010), has been observed in various collision systems and at different collision energies. Since the beginning of LHC operations, this ridge structure has also been observed in high-multiplicity proton-proton (pp) collisions by the CMS collaboration Khachatryan et al. (2010) and confirmed by experiments at the LHC and RHIC using smaller collision systems than ion-ion collisions, such as proton-proton Aad et al. (2016), proton-ion (pA) Chatrchyan et al. (2013); Abelev et al. (2013a, b); Aad et al. (2013); Aaij et al. (2016), and deuteron-ion Adare et al. (2013) collisions. In heavy-ion collisions, the ridge structure is associated with the fluctuating initial state of the ions Ollitrault (1992); Alver and Roland (2010). However, the physical origin of the ridge structure in small systems remains under debate Dumitru et al. (2011); Dusling and Venugopalan (2013); Bozek (2012); He et al. (2016); Nagle and Zajc (2018). The potential correlations in the initial state partons arising from hadronic structure make understanding pp and pA measurements challenging. Numerous theoretical models exist to explain these systems with high particle densities. These models incorporate various mechanisms, from initial state correlations as suggested in Dusling and Venugopalan (2013), through final-state interactions He et al. (2016), to hydrodynamic effects Bozek (2012).
Lately, the focus has intensified on assessing two-particle correlations in even smaller systems than pp and pA collisions. This includes systems like photonuclear collisions with ultra-peripheral proton-lead and lead-lead data as demonstrated by ATLAS and CMS Aad et al. (2021); Tumasyan et al. (2023), electron-proton collisions reported by ZEUS Abt et al. (2020), and Badea et al. (2019); Chen et al. (2022, 2023a). Such studies are invaluable complements to those done on larger collision systems, shedding light on the bare minimum conditions required for collective behavior Nagle et al. (2018). Electron beams, in particular, are free from issues like multiple parton interactions and initial state correlations. Notably, no significant ridge-like patterns have been detected in the electron-positron annihilations, giving further clarity to the emergence of the collectivity signal as discussed in various studies Bierlich and Rasmussen (2019); Bierlich et al. (2021); Castorina et al. (2021); Agostini et al. (2021); Larkoski and Melia (2021); Baty et al. (2021).
There are two potential approaches to making progress in detecting a possible ridge-like signal. The first approach involves increasing the final state multiplicity of the system. This is because the probability of parton-parton scattering increases with rising parton density, which results in larger final state multiplicity. Additionally, insights gained from pp and photonuclear collisions suggest that a larger multiplicity decreases the magnitude of the negative direct flow () due to momentum conservation. A diminished could facilitate the detection of the possible ridge-like signal. The second approach involves exploring different physics processes. As recommended in Ref. Nagle et al. (2018), a two-string configuration simulated in AMPT strengthens the ridge-like signal compared to a single-string configuration. Investigating data with a two-string configuration could increase the chances of detecting a ridge-like signal in the most elementary collisions.
This study utilizes archived data collected by the ALEPH detector at LEP-II Decamp et al. (1990) between 1996 and 2000. To analyze these data, an MIT Open Data format was created Tripathee et al. (2017). Unlike the 91.2 GeV sample at LEP-I, which is dominated by -decays, the high-energy sample sees significant contributions from various processes beyond fragmentation, including a notable “radiative-return-to-” effect due to initial-state QED radiation. Adopting the selection criteria from the ALEPH collaboration Heister et al. (2004), we cluster the event into two jets to determine the effective center-of-mass energy () using the equation
| (1) |
where are the angles of these jets to the beam direction. Using this, the visible two-jet invariant mass () is derived, aiding in minimizing the QED radiation background. In our analysis, must exceed , and must surpass . Furthermore, adhering to the hadronic event criteria from previous LEP-I work Badea et al. (2019), events are selected based on the event sphericity axis’s polar angle (), and those with under five tracks or with total reconstructed charged-particle energy below GeV are discarded.
High-quality tracks from particles are selected using requirements identical to those in previous ALEPH analyses Barate et al. (1998). They are also required to have a transverse momentum with respect to the beam axis () above 0.2 GeV/c and in the lab frame. Secondary charged particles from neutral particle decays are suppressed by reconstruction in the energy flow algorithm Barate et al. (1998). We employed the Monte Carlo (MC) events from the ALEPH collaboration for reconstruction effects and data correction. Specifically, we relied on archived pythia 6.1 Sjostrand et al. (2001) MC simulation samples produced by ALEPH detector conditions at LEP-II. These samples informed our tracking efficiency and event selection corrections. The various MC subprocesses were weighted based on cross-sections from event generators.
The analysis procedure aligns with prior two-particle correlation function studies Chatrchyan et al. (2013); Badea et al. (2019). For each event, the efficiency-corrected differential yield of charged-particle pairs, denoted as (where “same” means particles from the same event), is computed. It is then normalized by the average corrected number of charged particles in the event, , yielding:
| (2) |
A mixed-event background correlation, , pairs charged particles from one event with those from 48 random events of the same multiplicity, giving
| (3) |
Here, is the efficiency-corrected pair count from the mixed event. By dividing this by , computed using pairs with and , we obtain the detector’s pair acceptance for uncorrelated particles. Hence, the acceptance-corrected pair yield is:
| (4) |
For multiplicity-dependent analysis, events are grouped into five intervals based on reconstructed charged track count, , with GeV/c. Details, including multiplicity ranges and average track counts before and after correction, are in Table 1.
| range | Fraction of data (%) | ||
|---|---|---|---|
| 58.6 | 15.2 | 17.3 | |
| 33.1 | 23.1 | 25.7 | |
| 3.7 | 32.6 | 35.9 | |
| 0.4 | 42.8 | 47.1 | |
| 53.0 | 58.4 |
Experimentally, the thrust axis Farhi (1977), closely related to the outgoing direction, establishes the coordinate system for thrust coordinate analysis. The thrust axis serves as the reference to address the outgoing-state energy flow orientation in collisions. Including an extra particle representing the event’s unreconstructed momentum in the thrust axis calculation mitigates the effect of detector inefficiencies on the correlation function. All tracks meeting quality criteria then have their kinematic variables (, , ) recalculated, with the thrust axis substituting the beam axis, using the prescription of the LEP-I analysis Badea et al. (2019). Kinematics are recalculated for particles in paired events relative to the signal event’s thrust axis for the background correlation calculation. The and distributions of charged tracks in these paired events are reweighted to align with the distributions of the signal events. This strategy accounts for the random pairing effect under the detector acceptance in the thrust coordinate for different signal events.
In hadronic collision systems, the azimuthal anisotropy of charged particle production is typically quantified with the azimuthal anisotropy coefficients (), Voloshin and Zhang (1996); Poskanzer and Voloshin (1998); Alver and Roland (2010). In particular, the second order coefficient, is sensitive to the collective behavior and the level of thermalization of the system in relativistic heavy ion collisions Ollitrault (1992); Ackermann et al. (2001). However, it is often difficult to make a direct quantitative connection between the size of any associated yields and the corresponding value of because most of the structure of the correlation functions comes from jetlike correlations. These correlations are sometimes referred to as “nonflow” Adler et al. (2003); Adare et al. (2008); Aamodt et al. (2010); Sirunyan et al. (2018).
We employ the Fourier decomposition analysis used in prior studies to investigate potential flow-like signatures. This helps us understand anisotropy harmonics through two-particle azimuthal correlations. The non-flow effects diminish significantly at large . The long-range azimuthal differential yields can be described by:
with representing associated track pairs in specified and ranges. The long-range associated yield is a histogram, and the Discrete Fourier Transform is used to determine Fourier coefficients () and normalization (). These coefficients relate to single-particle Fourier harmonics, assuming they originate from hydrodynamic flow effects. In our approach, the trigger and associated particles are in the same bin, leading to .
This analysis uses Bayesian inference to assess the statistical uncertainties for the observables of interest: correlation yields and flow coefficients . The primary rationale behind adopting the Bayesian analysis is to offer a more detailed estimation of uncertainties, particularly when assuming a Gaussian distribution is not ideal for a data set with a non-Gaussian distribution. With Bayes’ theorem, we obtain the posterior probability for an observable of interest, using a flat prior and a “weighted Poisson distribution Bohm and Zech (2014)” as the likelihood function. Reported central values and uncertainties for pairing yields and flow coefficients are based on the “maximum a posteriori (MAP)” method. The comprehensive Bayesian calculation has been documented in the note Chen et al. (2023b).
Systematic uncertainties for the long-range associated yield and arise from event and track selections, the normalization factor, and residual MC corrections. For event selections, variations involve altering the ISR requirements Heister et al. (2004) on the visible two-jet invariant mass from to and adjusting the effective center-of-mass energy from to . Meanwhile, consistent with the LEP-I analysis approach, the hadronic event selection criteria adjust the number of particles from 13 to 10 and the reconstructed charged-particle energy from 15 GeV to 10 GeV. ISR selections have a more pronounced impact on systematic uncertainties. Track selection changes involve the number of track hits in the time projection chamber, shifting from 4 to 7. Including the factor as the normalization choice also introduces a systematic uncertainty. We evaluate its impact based on the statistical uncertainty of the normalization factor. Generally, these systematic uncertainties affect bins uniformly. Lastly, the residual MC correction factor results in an uncorrelated uncertainty across bins ascertained through different fit attempts on this correction factor. Three function types are evaluated, with half of their maximum deviation deemed as the associated uncertainty.
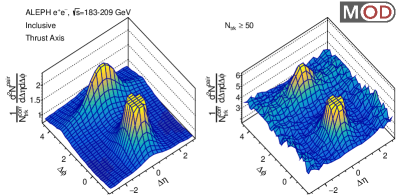
The two-particle correlation functions for inclusive and high multiplicity events are shown in Fig. 1. No significant ridge-like structure was observed in the correlation function at low multiplicity (). In the highest multiplicity bin (), an intriguing U shape was revealed at the large and small phase space, which is studied further in the later sections.
One-dimensional distributions in are studied by averaging the two-particle correlation function over the region between to investigate the long-range correlation in finer detail. Fig. 2 shows the comparisons between data and MC on the long-range azimuthal differential associated yields. The MC simulation aligns well with the data for low multiplicity events with . However, in the highest multiplicity class, where , the data reveals a long-range near-side signal that the MC simulation does not capture. Moreover, the data display a more significant slope when going to large than predictions from MC. We also examined the correlation functions using the pythia 8 simulation, which allows for the inclusion of microscopic collective effects from the shoving mechanism Bierlich et al. (2018, 2021). However, a similar long-range near-side enhancement is not seen in the pythia 8 simulation, either with or without the inclusion of the shoving model.
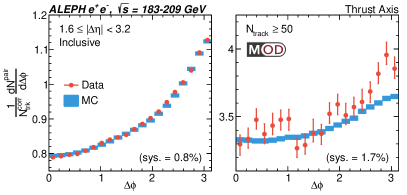
The size of any potential enhancement around is calculated by fitting this distribution from and then performing a zero yield at minimum (ZYAM) subtraction procedure using the fit minimum, Ajitanand et al. (2005). A constant, combined with a three-term Fourier series, was used as the nominal fit function. Fits with a purely-even quartic function and a purely-even quadratic function plus a term were also attempted. Discrepancies resulting from these different choices of fit function were found to be small and are included in the systematic uncertainties of the total near-side yield calculation. After this subtraction and correction for reconstruction effects, the results are shown for and in Fig. 2.
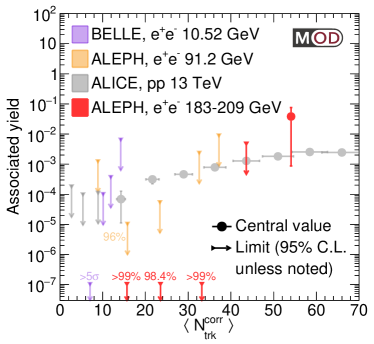
The excess yield of particle pairs near is determined by integrating the data up to the ZYAM fit’s minimum position in . For low multiplicity, a confidence limit (C.L.) on the near-side pair excess is deduced using a bootstrap method Efron (1979). This considers the variability in correlation function data points based on uncertainties. For each bin, the bootstrap samples variations. Most yield a minimum at , implying zero associated yield. If over 5% of variations exceed a yield of , a 95% C.L. is given. Otherwise, a C.L. for variations below this threshold is stated. This typically occurs in low multiplicity scenarios due to minor uncertainties. At high multiplicity, the central value and the total uncertainty are reported, and the results are shown in Fig. 3. The results are also overlayed with the associated yield reported in other small systems: collisions by Belle Chen et al. (2022), ALEPH (LEP-I) Badea et al. (2019), and low-multiplicity collisions by ALICE Acharya et al. (2023). Incorporating the same scaling treatment for and collisions as detailed in ALICE publication Acharya et al. (2023), we scale the axis of the ALICE data by the acceptance correction coefficients and for ALEPH and ALICE experiments, respectively. The scaled for ALICE data points are displayed with uncertainty ranges from the scaling process. A half of the maximum deviation between the correction coefficients is quoted as the relative uncertainty. The reported thrust C.L.s are compatible or lower than the central values of the associated yield reported by CMS and ALICE, although the systematic uncertainties of the CMS measurements at low multiplicity are large. These C.L.s contrast measurements of a nonzero azimuthal anisotropy signal in lower multiplicity pp collisions Aaboud et al. (2017); Khachatryan et al. (2017a). At a high multiplicity above 50, the results are compatible with pp results from ALICE.
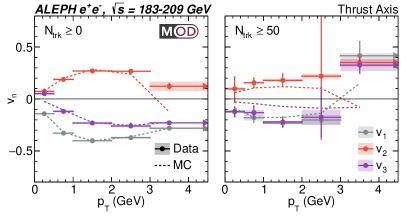
In Fig. 4, the extracted coefficients between the ALEPH data and the archived PYTHIA6 simulation are compared as a function of . The quoted coefficients are obtained from assuming a factorization between and , leading to . The inclusive result, dominated by events with lower , is presented in the left panel. We observe a decent agreement between data and simulation. A difference is seen for high multiplicity events with , as shown in the right panel. The simulation generally predicts a smaller magnitude for , reflecting the more complex event topologies selected by the large particle multiplicity. The data, however, shows an intriguing trend compared to the simulation, especially in and , where the magnitude is larger.
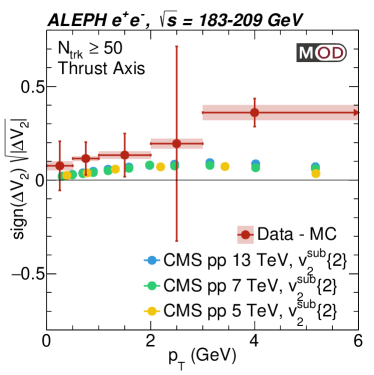
The for high multiplicity events with is also compared with measurements from the CMS collaboration in high multiplicity proton-proton data Khachatryan et al. (2017b) across three different collision energies, as shown in Fig. 5. To further suppress contributions from known processes, the from the simulation is subtracted from that of the data. There is no large dependence of on collision energy in high multiplicity proton-proton collisions. A remarkably similar trend is observed in the ALEPH data compared to in proton-proton collisions. Both datasets exhibit a rising trend as a function of up to 3 GeV with a similar magnitude.
In summary, we present the first measurement of two-particle angular correlations from annihilation at energies – GeV using archived ALEPH LEP-II data recorded between 1996 and 2000. In analyzing the thrust axis of these collisions between to 209 GeV, a long-range near-side excess in the correlation function emerges. For the first time, we decomposed two-particle correlation functions in collisions using a Fourier series. The resulting Fourier coefficients from LEP-II provided a comparison to the archived MC, especially in high multiplicity events where particle counts exceeded 50; the magnitudes of and in data are larger than those in the Monte Carlo reference. Highlighting these contrasts, we present the difference in between data and the MC. The difference between data- and MC-derived as a function of associated particle is remarkably similar to the measured in high multiplicity collisions. These intriguing findings fortify our understanding of the underlying mechanisms in particle collisions and shed light on the origins of flow-like signals in smaller collision systems.
The authors would like to thank the ALEPH Collaboration for their support and foresight in archiving their data. We would like to thank the valuable comments and suggestions from Roberto Tenchini, Guenther Dissertori, Wei Li, Jiangyong Jia, Wit Busza, Néstor Armesto, Jean-Yves Ollitrault, Jürgen Schukraft and Jan Fiete Grosse-Oetringhaus. This work has been supported by the Department of Energy, Office of Science, under Grant No. DE-SC0011088 (to Y.-C.C., Y.C., M.P., T.S., C.M., Y.-J.L.), Eric and Wendy Schmidt AI in Science Postdoctoral Fellowship (A. Badea) and Grant No. DE-SC0012567 (to J.T.).
References
- Adams et al. (2005) J. Adams et al. (STAR), Phys. Rev. Lett. 95, 152301 (2005), eprint nucl-ex/0501016.
- Abelev et al. (2009) B. I. Abelev et al. (STAR), Phys. Rev. C 80, 064912 (2009), eprint 0909.0191.
- Alver et al. (2010) B. Alver et al. (PHOBOS), Phys. Rev. Lett. 104, 062301 (2010), eprint 0903.2811.
- Chatrchyan et al. (2012) S. Chatrchyan et al. (CMS), Eur. Phys. J. C72, 2012 (2012), eprint 1201.3158.
- Aamodt et al. (2012) K. Aamodt et al. (ALICE), Phys. Lett. B 708, 249 (2012), eprint 1109.2501.
- Adam et al. (2019) J. Adam et al. (STAR), Phys. Rev. Lett. 122, 172301 (2019), eprint 1901.08155.
- Busza et al. (2018) W. Busza, K. Rajagopal, and W. van der Schee, Ann. Rev. Nucl. Part. Sci. 68, 339 (2018), eprint 1802.04801.
- Khachatryan et al. (2010) V. Khachatryan et al. (CMS), JHEP 09, 091 (2010), eprint 1009.4122.
- Aad et al. (2016) G. Aad et al. (ATLAS), Phys. Rev. Lett. 116, 172301 (2016), eprint 1509.04776.
- Chatrchyan et al. (2013) S. Chatrchyan et al. (CMS), Phys. Lett. B718, 795 (2013), eprint 1210.5482.
- Abelev et al. (2013a) B. Abelev et al. (ALICE), Phys. Lett. B 719, 29 (2013a), eprint 1212.2001.
- Abelev et al. (2013b) B. B. Abelev et al. (ALICE), Phys. Lett. B 726, 164 (2013b), eprint 1307.3237.
- Aad et al. (2013) G. Aad et al. (ATLAS), Phys. Rev. Lett. 110, 182302 (2013), eprint 1212.5198.
- Aaij et al. (2016) R. Aaij et al. (LHCb), Phys. Lett. B762, 473 (2016), eprint 1512.00439.
- Adare et al. (2013) A. Adare et al. (PHENIX), Phys. Rev. Lett. 111, 212301 (2013), eprint 1303.1794.
- Ollitrault (1992) J.-Y. Ollitrault, Phys. Rev. D46, 229 (1992).
- Alver and Roland (2010) B. Alver and G. Roland, Phys. Rev. C81, 054905 (2010), [Erratum: Phys. Rev.C82,039903(2010)], eprint 1003.0194.
- Dumitru et al. (2011) A. Dumitru, K. Dusling, F. Gelis, J. Jalilian-Marian, T. Lappi, and R. Venugopalan, Phys. Lett. B 697, 21 (2011), eprint 1009.5295.
- Dusling and Venugopalan (2013) K. Dusling and R. Venugopalan, Phys. Rev. D87, 094034 (2013), eprint 1302.7018.
- Bozek (2012) P. Bozek, Phys. Rev. C85, 014911 (2012), eprint 1112.0915.
- He et al. (2016) L. He, T. Edmonds, Z.-W. Lin, F. Liu, D. Molnar, and F. Wang, Phys. Lett. B753, 506 (2016), eprint 1502.05572.
- Nagle and Zajc (2018) J. L. Nagle and W. A. Zajc, Ann. Rev. Nucl. Part. Sci. 68, 211 (2018), eprint 1801.03477.
- Aad et al. (2021) G. Aad et al. (ATLAS), Phys. Rev. C 104, 014903 (2021), eprint 2101.10771.
- Tumasyan et al. (2023) A. Tumasyan et al. (CMS), Phys. Lett. B 844, 137905 (2023), eprint 2204.13486.
- Abt et al. (2020) I. Abt et al. (ZEUS), JHEP 04, 070 (2020), eprint 1912.07431.
- Badea et al. (2019) A. Badea, A. Baty, P. Chang, G. M. Innocenti, M. Maggi, C. Mcginn, M. Peters, T.-A. Sheng, J. Thaler, and Y.-J. Lee, Phys. Rev. Lett. 123, 212002 (2019), eprint 1906.00489.
- Chen et al. (2022) Y. C. Chen et al. (Belle), Phys. Rev. Lett. 128, 142005 (2022), eprint 2201.01694.
- Chen et al. (2023a) Y. C. Chen et al. (Belle), JHEP 03, 171 (2023a), eprint 2206.09440.
- Nagle et al. (2018) J. L. Nagle, R. Belmont, K. Hill, J. Orjuela Koop, D. V. Perepelitsa, P. Yin, Z.-W. Lin, and D. McGlinchey, Phys. Rev. C97, 024909 (2018), eprint 1707.02307.
- Bierlich and Rasmussen (2019) C. Bierlich and C. O. Rasmussen, JHEP 10, 026 (2019), eprint 1907.12871.
- Bierlich et al. (2021) C. Bierlich, S. Chakraborty, G. Gustafson, and L. Lönnblad, JHEP 03, 270 (2021), eprint 2010.07595.
- Castorina et al. (2021) P. Castorina, D. Lanteri, and H. Satz, Eur. Phys. J. A 57, 111 (2021), eprint 2011.06966.
- Agostini et al. (2021) P. Agostini, T. Altinoluk, and N. Armesto, Eur. Phys. J. C 81, 760 (2021), eprint 2103.08485.
- Larkoski and Melia (2021) A. J. Larkoski and T. Melia, JHEP 10, 094 (2021), eprint 2107.04041.
- Baty et al. (2021) A. Baty, P. Gardner, and W. Li (2021), eprint 2104.11735.
- Decamp et al. (1990) D. Decamp et al. (ALEPH), Nucl. Instrum. Meth. A294, 121 (1990), [Erratum: Nucl. Instrum. Meth.A303,393(1991)].
- Tripathee et al. (2017) A. Tripathee, W. Xue, A. Larkoski, S. Marzani, and J. Thaler, Phys. Rev. D96, 074003 (2017), eprint 1704.05842.
- Heister et al. (2004) A. Heister et al. (ALEPH), Eur. Phys. J. C 35, 457 (2004).
- Barate et al. (1998) R. Barate et al. (ALEPH), Phys. Rept. 294, 1 (1998).
- Sjostrand et al. (2001) T. Sjostrand, P. Eden, C. Friberg, L. Lonnblad, G. Miu, S. Mrenna, and E. Norrbin, Comput. Phys. Commun. 135, 238 (2001), eprint hep-ph/0010017.
- Farhi (1977) E. Farhi, Phys. Rev. Lett. 39, 1587 (1977).
- Voloshin and Zhang (1996) S. Voloshin and Y. Zhang, Z. Phys. C70, 665 (1996), eprint hep-ph/9407282.
- Poskanzer and Voloshin (1998) A. M. Poskanzer and S. A. Voloshin, Phys. Rev. C58, 1671 (1998), eprint nucl-ex/9805001.
- Ackermann et al. (2001) K. H. Ackermann et al. (STAR), Phys. Rev. Lett. 86, 402 (2001), eprint nucl-ex/0009011.
- Adler et al. (2003) C. Adler et al. (STAR), Phys. Rev. Lett. 90, 082302 (2003), eprint nucl-ex/0210033.
- Adare et al. (2008) A. Adare et al. (PHENIX), Phys. Rev. C78, 014901 (2008), eprint 0801.4545.
- Aamodt et al. (2010) K. Aamodt et al. (ALICE), Phys. Rev. Lett. 105, 252302 (2010), eprint 1011.3914.
- Sirunyan et al. (2018) A. M. Sirunyan et al. (CMS), Phys. Lett. B776, 195 (2018), eprint 1702.00630.
- Bohm and Zech (2014) G. Bohm and G. Zech, Nucl. Instrum. Meth. A 748, 1 (2014), eprint 1309.1287.
- Chen et al. (2023b) Y.-C. Chen, Y.-J. Lee, Y. Chen, P. Chang, C. McGinn, T.-A. Sheng, G. M. Innocenti, and M. Maggi (2023b), eprint 2309.09874.
- Bierlich et al. (2018) C. Bierlich, G. Gustafson, and L. Lönnblad, Phys. Lett. B 779, 58 (2018), eprint 1710.09725.
- Ajitanand et al. (2005) N. N. Ajitanand, J. M. Alexander, P. Chung, W. G. Holzmann, M. Issah, R. A. Lacey, A. Shevel, A. Taranenko, and P. Danielewicz, Phys. Rev. C72, 011902 (2005), eprint nucl-ex/0501025.
- Acharya et al. (2023) S. Acharya et al. (ALICE) (2023), eprint 2311.14357.
- Efron (1979) B. Efron, Ann. Statist. 7, 1 (1979), URL https://doi.org/10.1214/aos/1176344552.
- Aaboud et al. (2017) M. Aaboud et al. (ATLAS), Phys. Rev. C96, 024908 (2017), eprint 1609.06213.
- Khachatryan et al. (2017a) V. Khachatryan et al. (CMS), Phys. Lett. B765, 193 (2017a), eprint 1606.06198.
- Khachatryan et al. (2017b) V. Khachatryan et al. (CMS), Phys. Lett. B 765, 193 (2017b), eprint 1606.06198.