CD-27 11535: Evidence for a Triple System in the Pictoris Moving Group
Abstract
We present new spatially resolved astrometry and photometry of the CD-27 11535 system, a member of the Pictoris moving group consisting of two resolved K-type stars on a 20-year orbit. We fit an orbit to relative astrometry measured from NIRC2, GPI, and archival NaCo images, in addition to literature measurements. However, the total mass inferred from this orbit is significantly discrepant from that inferred from stellar evolutionary models using the luminosity of the two stars. We explore two hypotheses that could explain this discrepant mass sum; a discrepant parallax measurement from Gaia due to variability, and the presence of an additional unresolved companion to one of the two components. We find that the 20-year orbit could not bias the parallax measurement, but that variability of the components could produce a large amplitude astrometric motion, an effect which cannot be quantified exactly without the individual Gaia measurements. The discrepancy could also be explained by an additional star in the system. We jointly fit the astrometric and photometric measurements of the system to test different binary and triple architectures for the system. Depending on the set of evolutionary models used, we find an improved goodness of fit for a triple system architecture that includes a low-mass ( ) companion to the primary star. Further studies of this system will be required in order to resolve this discrepancy, either by refining the parallax measurement with a more complex treatment of variability-induced astrometric motion, or by detecting a third companion.
1 Introduction
Knowing the precise age of stars is essential to understanding the planets they host. The age of a star, especially a star evolving toward the zero-age main sequence, can be found using evolutionary models based on its mass and absolute luminosity, if the mass is measured independently. As the stars in moving groups formed at the same time, the age of one star provides an estimate of the age of the whole group, especially when the moving group is young (Zuckerman & Song (2004), Bell et al. (2015), Schlieder et al. (2016)). Exoplanet formation and brown dwarf evolution is closely related to that of its host star. Hence, knowing the age of a moving group can reveal the age of various exoplanets and brown dwarfs in it. These accurate ages allow us to constrain evolutionary models for exoplanet and brown dwarfs (Burgasser & Blake, 2009) or simply lead to a better understanding of the formation of specific substellar objects. Binary stars provide the opportunity to discover the mass of the system through direct observation of the orbit. Fitting for the orbit reveals the dynamical total mass which, in turn, reveals the age (Nielsen et al., 2016).
CD-27 11535 (CD-27) is a young K5 star and member of the Pictoris ( Pic) moving group (Torres et al., 2006), with a Gaia Data Release 2 (DR2) distance of pc (Gaia Collaboration et al., 2018). CD-27 was first identified as a young star by Torres et al. (2006) as part of the Search for Associations Containing Young stars (SACY) database, the aim of which was to determine space motion of young stars through radial velocity, derived from spectroscopic observations. The spectroscopic observations also allowed them to determine the spectral type and equivalent width of Li 6708, which can be used to suggest the age of the star (Carlos et al., 2016). For CD-27, they report an equivalent width of 490m for Lithium - certainly indicating youth.
| Parameter | Value | Ref. |
|---|---|---|
| Alternate names | TYC 6820-223-1 | |
| Gaia DR2/3 4107812485571331328 | ||
| WDS 17151-2750 | ||
| ELP 40 | ||
| Position | a | |
| Right Ascension | 17:15: mas | |
| Declination | :49: mas | |
| Proper Motion (mas yr-1) | , | a |
| Parallax (mas) | a | |
| Apparent magnitudes | ||
| b | ||
| c | ||
| d | ||
| c | ||
| e | ||
| e | ||
| e | ||
| Spectral type | K5Ve |
Age estimates of the CD-27 system of 6 Myr by Weise et al. (2010) and 10 Myr by Elliott et al. (2014) both reference the lithium equivalent width measurement by Torres et al. (2006). While an equivalent width of 490 mÅ does indicate an extremely young age (Stanford-Moore et al., 2020), a confounding factor is stellar multiplicity which can affect the interpretation of such a measurement. Following its identification as a young star by Torres et al. (2006), Song et al. (2012) obtained new spectra, and associated the star with the Upper Scorpius subgroup of the Scorpius-Centaurus (Sco-Cen) complex, though they note that the star may be a nearby non-member. Later, Elliott et al. (2014) use radial velocity (RV) measurements to approximate the systemic velocity and employ the convergence method of kinematic trace-back by Torres et al. (2006) to determine group membership. They conclude that CD-27 is a candidate member of Pic, a doubt which stems from the uncertainty in the systemic velocity without an orbital solution. This is further studied by Shkolnik et al. (2017) who assign Pic group membership by their confirmation criteria based on spectral type, proper motion, Li and Hα equivalent widths and RV measurements. Age estimates of the Pic moving group by Nielsen et al. (2016) suggest an age of Myr, as such we expect that of CD-27 to be similar.
CD-27 was first identified as a binary by Elliott et al. (2014) who noted a significant RV difference measured by Torres et al. (2006) and Song et al. (2012) ( and km s-1, respectively), suggesting the system is a single-lined spectroscopic binary. Their analysis yielded an RV of km s-1, closer to the value reported by Torres et al. (2006) but significantly different than the km s-1 reported by Gaia Data Release 2 (DR2; Gaia Collaboration et al., 2018). Elliott et al. (2015) subsequently resolved the system with adaptive optics (AO) observations with an angular separation of , listing the system as “AB, SB1.” Alonso-Floriano et al. (2015), citing Elliott et al. (2015), list the system as an AaAb-B triple system, though it is unclear if this is based on additional data not in either paper, or a misreading of the “AB, SB1” notation. More recently, Bonavita et al. (2022) as part of the SpHere INfrared Exoplanet (SHINE) project also studied the CD-27 system. They fit an orbit to their relative astrometric measurements, yielding a total mass of the system of , larger than their expectation for the total mass of the two stars of – from evolutionary models, depending on the age.
Our investigation into the CD-27 system was initially intended to provide another benchmark system for the Pic moving group, utilizing the method outlined by Nielsen et al. (2016) and Montet et al. (2015) to further constrain the age the association. However, the significant discrepancy between the total mass from the orbit and the masses derived from the luminosity of each component and evolutionary models precluded this analysis. Instead, we explored two scenarios that could explain this discrepancy. We begin with a description of the high angular resolution imaging observations of the system in 2, which we combined with literature measurements to fit an orbit to the relative astrometry in Section 3. We consider the possibility of an additional component within the system and the possibility of an incorrect distance determination in Section 4. We derive limits on the presence of an additional companion in Section 5, and give conclusions and possible next steps for further studies in Section 6.
2 Observations and Data Reduction
To constrain the visual orbit of CD-27 we obtained diffraction-limited images of the system with the Keck/NIRC2 (PI: K. Matthews) and Gemini-S/GPI (Macintosh et al., 2014) instruments. We complemented these observations with archival datasets from VLT/NaCo (Lenzen et al., 2003; Rousset et al., 2003). In total, we collected 18 observations on 11 separate epochs. The NaCo and NIRC2 observations were obtained in a conventional imaging mode, whereas the GPI observations were obtained with a non-redundant aperture mask (Greenbaum et al., 2019). A summary of these imaging observations are given in Table 4. We also obtained high-resolution optical echelle spectra of the system with APO/ARCES (Wang et al., 2003) as a part of a larger radial velocity monitoring program.
2.1 VLT/NaCo Imaging
Observations of CD-27 that were made between 2006 May 27 and 2009 Jun 1 with the NaCo instrument were obtained from the ESO Science Archive Facility111http://archive.eso.org. Two datasets were obtained with the S27 camera (27 mas/px) and the IB2.27 intermediate-band filter, and one was obtained with the S13 camera (13 mas/px) and the broad-band filter. These data were obtained under program IDs 077.C-0483, 081.C-0825, and 083.C-0659. The first two epochs were originally published in Elliott et al. (2015), however the large uncertainty of their separation measurements motivated us to re-analyze their observations.
We used a standard near-infrared data reduction process to reduce and analyse each dataset using associated calibrations obtained from the archive. The dark current was measured by finding the median of several exposures of the same exposure time taken while the instrument light path was blocked. This combined frame was then subtracted from each raw image. We created a flat field and bad pixel map using pairs of lamp-on and lamp-off exposures obtained during the day. These were used to perform the flat field correction of the raw images, and to correct for bad pixels. We did not apply any distortion correction to the image as the effect of distortion over such a small angular separation between the two resolved components of the CD-27 system is negligible. The thermal background within each image was estimated using a median combination of all images, which was then subtracted from each image.
Relative astrometric and photometric measurements were made by fitting the point spread function (PSF) of both components with that of a single star observed on the same (or neighbouring) night with the same instrument configuration. We searched the archive for suitable observations for each of our three datasets. Unlike for CD-27, the individual images for the reference stars were aligned and combined to create a high signal-to-noise (SNR) PSF that could be used for PSF fitting. The centroid of the star in each image was calculated by fitting a two-dimensional Gaussian within a region of four pixels centered on an initial guess for the location of the star. This process was repeated using the result of the first iteration as the guess position for the second.
A model of the two components of the CD-27 system was constructed using two copies of the model PSF interpolated to the positions and , and multiplied by scaling factors and . A background term was added to account for any residual background signal present in the image. We used the implementation of Powell’s method within the scipy.optimize package to find the optimal set of parameters that minimized the residuals after model subtraction in two apertures centered on the positions of the two components. This was repeated for each of the potential PSF calibrator stars. The PSF star that resulted in the smallest amplitude residuals was used to measure the relative astrometry and photometry between the resolved components.
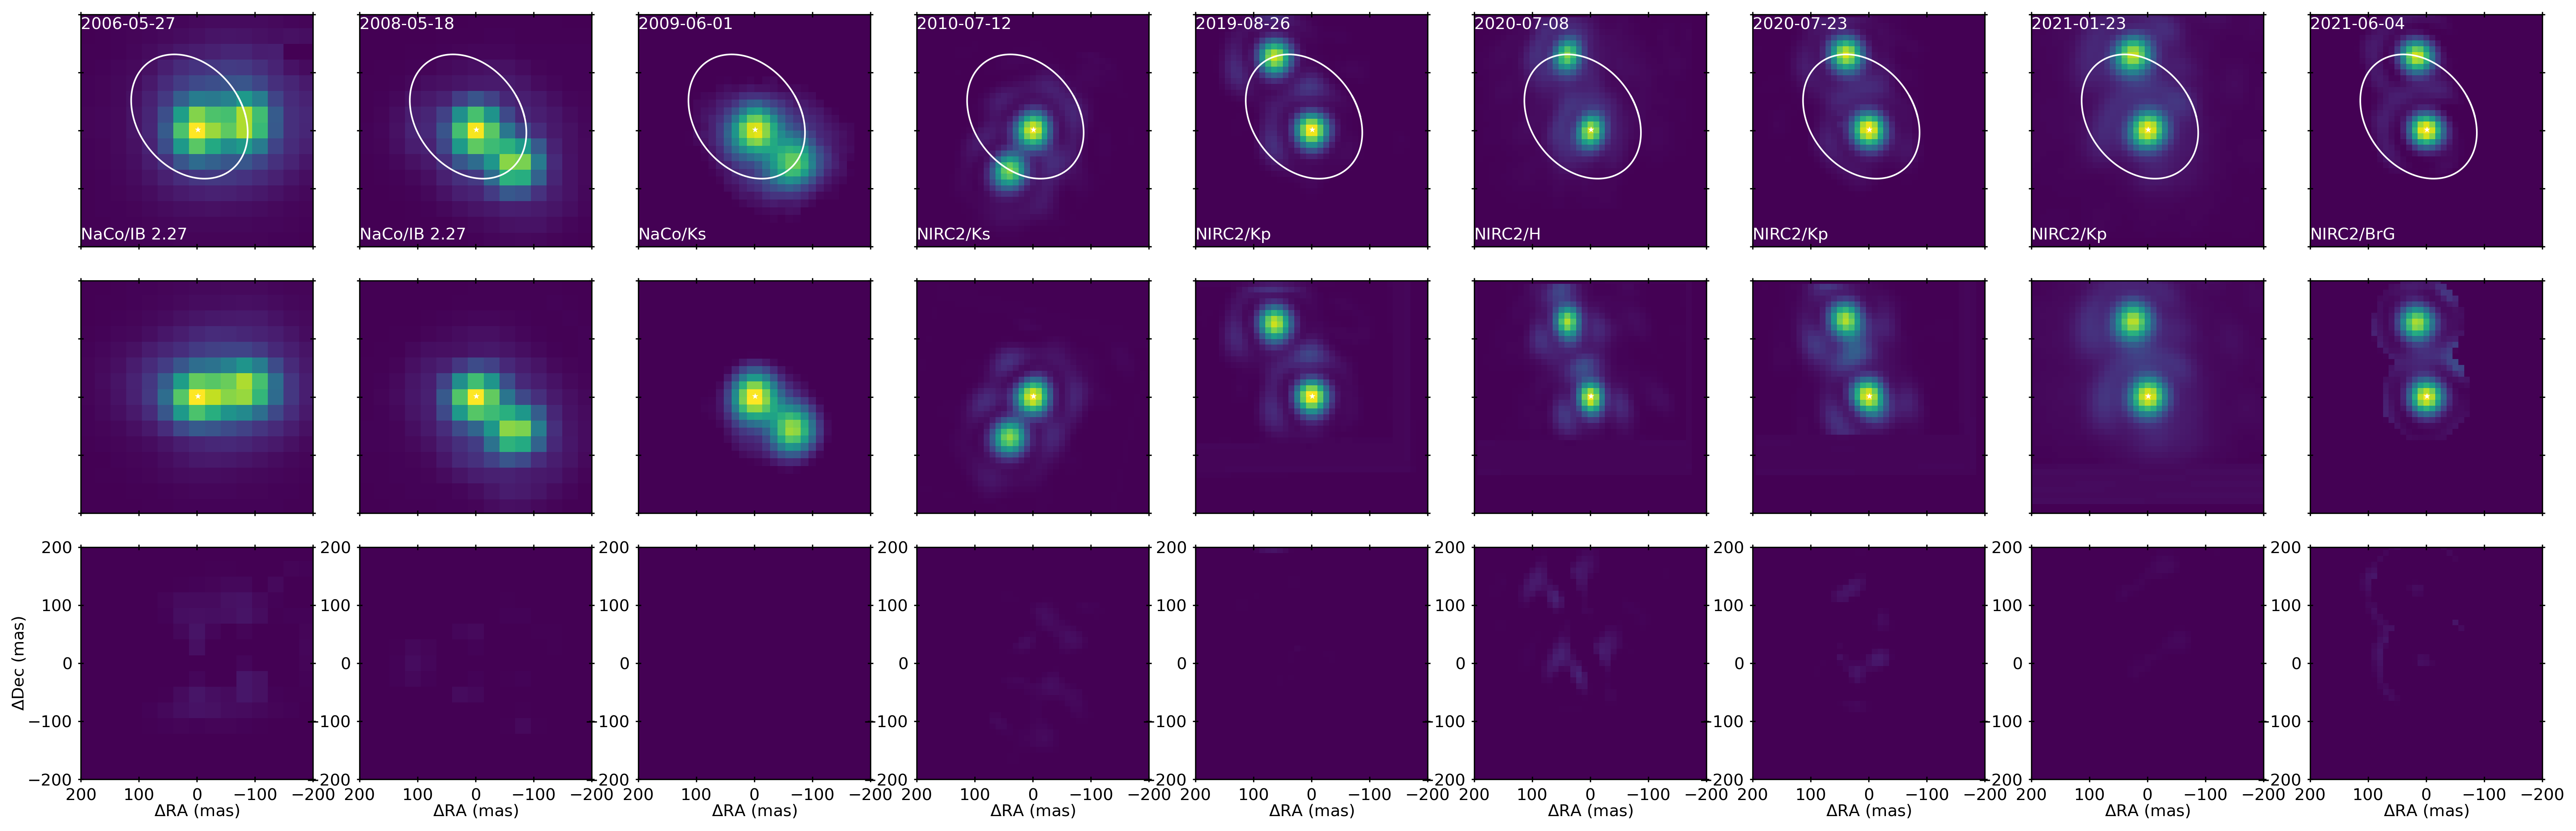
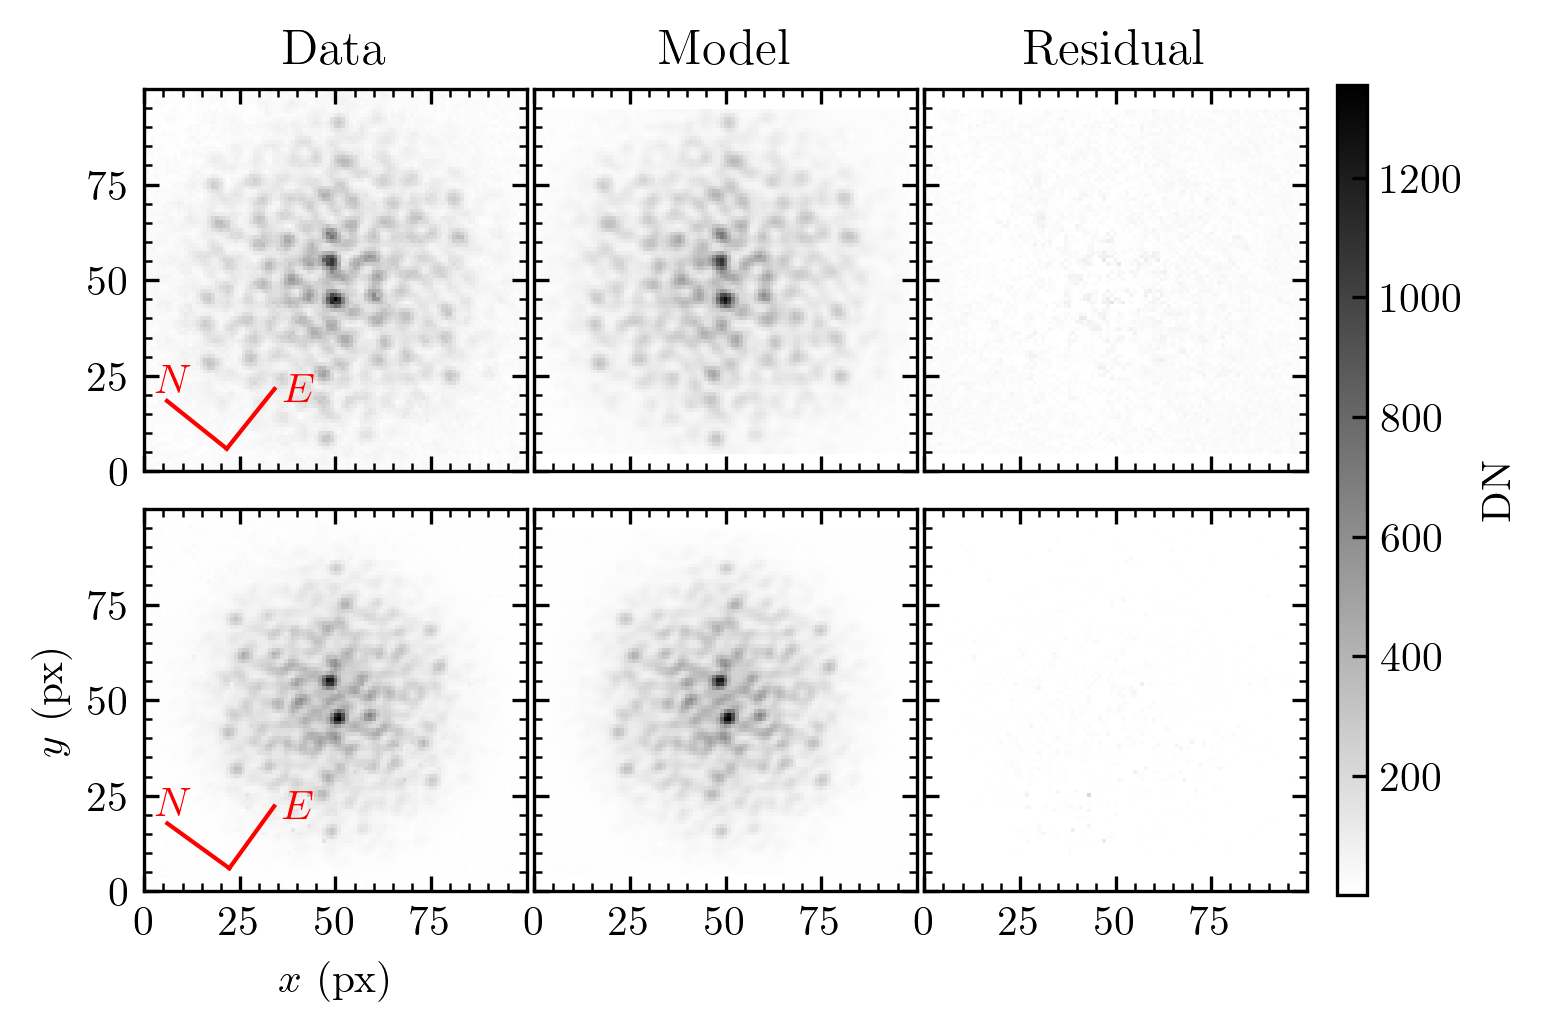
The pixel positions of the two components were converted into an angular separation and position angle using the plate scale and orientation of the detector given in Table 5. Magnitude differences were calculated from the ratio of the two scaling factors. This process was repeated for each image of the CD-27 system, yielding an average and standard deviation for each value that are given in Table 5. The reduced images, the best-fit PSF model, and the corresponding residuals are shown in Figure 1.
2.2 Keck/NIRC2 Imaging
The system was observed on six separate epochs over the course of eleven years with Keck/NIRC2 through seven different filters (, , , , , , ). A single star was observed with the same filter that could act as a PSF reference in all but the last epoch in June 2021. For that epoch, a PSF was constructed using the binary 1RXS J195602.8-320720 after digitally masking the fainter secondary. The observations were reduced using a standard near-infrared reduction pipeline similar to that employed to reduce the NaCo data. The raw images were dark subtracted, divided by a flat field, and cleaned of bad pixels using outlier rejection. The geometric distortion of the detector was corrected using a flux-conserving algorithm (Yelda et al., 2011; Service et al., 2016). The relative position and brightness of the two resolved components of the CD-27 system were calculated using the same PSF fitting approach used for both the NaCo and GPI datasets. This process was repeated for each image yielding an average value and standard deviation for the pixel offsets and flux ratio. These were converted into on-sky separations and position angles using the calibration values listed in Table 5. The reduced images, the best-fit PSF model, and the corresponding residuals for a subset of the observations of the system are shown in Figure 1.
2.3 Gemini-S/GPI Aperture Masking
CD-27 was observed with GPI on 2018 August 15 and 2019 August 05 alongside the PSF calibrator HD 153318 (see Table 4). The GPI images were all processed and reduced with the GPI Data Reduction Pipeline (DRP) v1.5.0 (Perrin et al., 2014). After dark current subtraction and bad pixel interpolation, microspectra within the raw 2-D image were extracted to create an (, , ) data cube (Maire et al., 2014). An image of an argon arc lamp was taken immediately before the data to calibrate the wavelength axis of the data cube. Bad pixels were corrected using outlier rejection both before and after the data cube construction step. The system was clearly resolved into two components within the reduced image (Fig. 2), at an angular separation far beyond what is typically explored with the non-redundant mask (NRM) technique. These observations were scheduled prior to a reliable determination of the orbit of the system.
Rather than using a specialized pipeline to reduce these observations (e.g. Greenbaum et al., 2019), we instead used a similar approach as for the NaCo observations described in the previous section because of the large angular separation between the two components (Fig 2). Observations of the single calibrator star HD 153318 were reduced and used to construct a model of the PSF. Two copies of this PSF were shifted and scaled to fit the two resolved components of the CD-27 system. This process was repeated using the central wavelength slice of each observation from each epoch (19 in 2018, 16 in 2019) yielding an average and standard deviation for each measurement. On-sky separations and position angles were calculated using the relevant calibration measurements given in Table 5. The reduced images, the best-fit PSF model, and the corresponding residuals are shown in Figure 2.
2.4 APO/ARCES Spectra
We obtained optical echelle spectra of CD-27 at the Apache Point Observatory (APO) 3.5m telescope with the ARCES instrument (Wang et al., 2003), on five epochs in 2021. Given the seeing-limited conditions and the close separation of the system, we obtained a blended spectrum of the entire system. The observations were reduced using a standard spectroscopic reduction pipeline that performs bias and flat-field correction, measures and corrects the continuum, and derives a wavelength solution from observations of a ThAr calibration lamp.
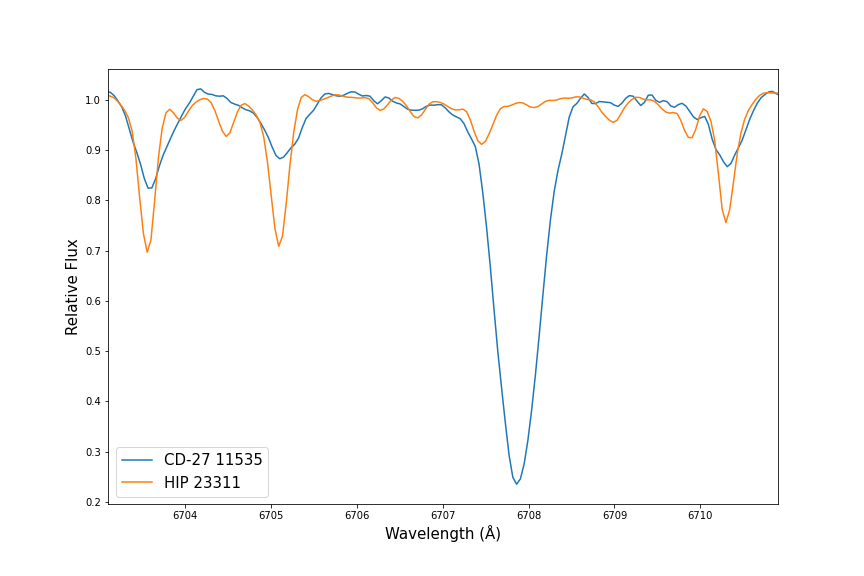
Figure 3 shows the region surrounding the lithium 6707.79 Å line for the CD-27 system taken on 2021 June 20, and for our RV standard HIP 23311 with a spectral type of K3 taken on the same night. Despite the near-equal visual magnitude of A and B, we do not observe double lines in our spectrum, but rather broad lines suggesting some or all of the components are rapid rotators. No significant RV shift is measured over our four months of data. We confirm the strong lithium absorption observed by Torres et al. (2006), though with these unresolved spectra we cannot determine how much lithium corresponds to each component of the system. Nevertheless, given the late spectral types of the components, with a K5 spectral type assigned to the system, this strong lithium absorption is a clear sign of youth, consistent with Pictoris moving group membership.
3 Visual Orbit of CD-27 11535
The relative astrometry derived from our analysis and the literature astrometric measurements are compiled in Table 5. The speckle interferometry measurements from SOAR span 2016 through 2023, and we applied a correction of quadrant for consistency with our measurements.
3.1 Orbit Fitting
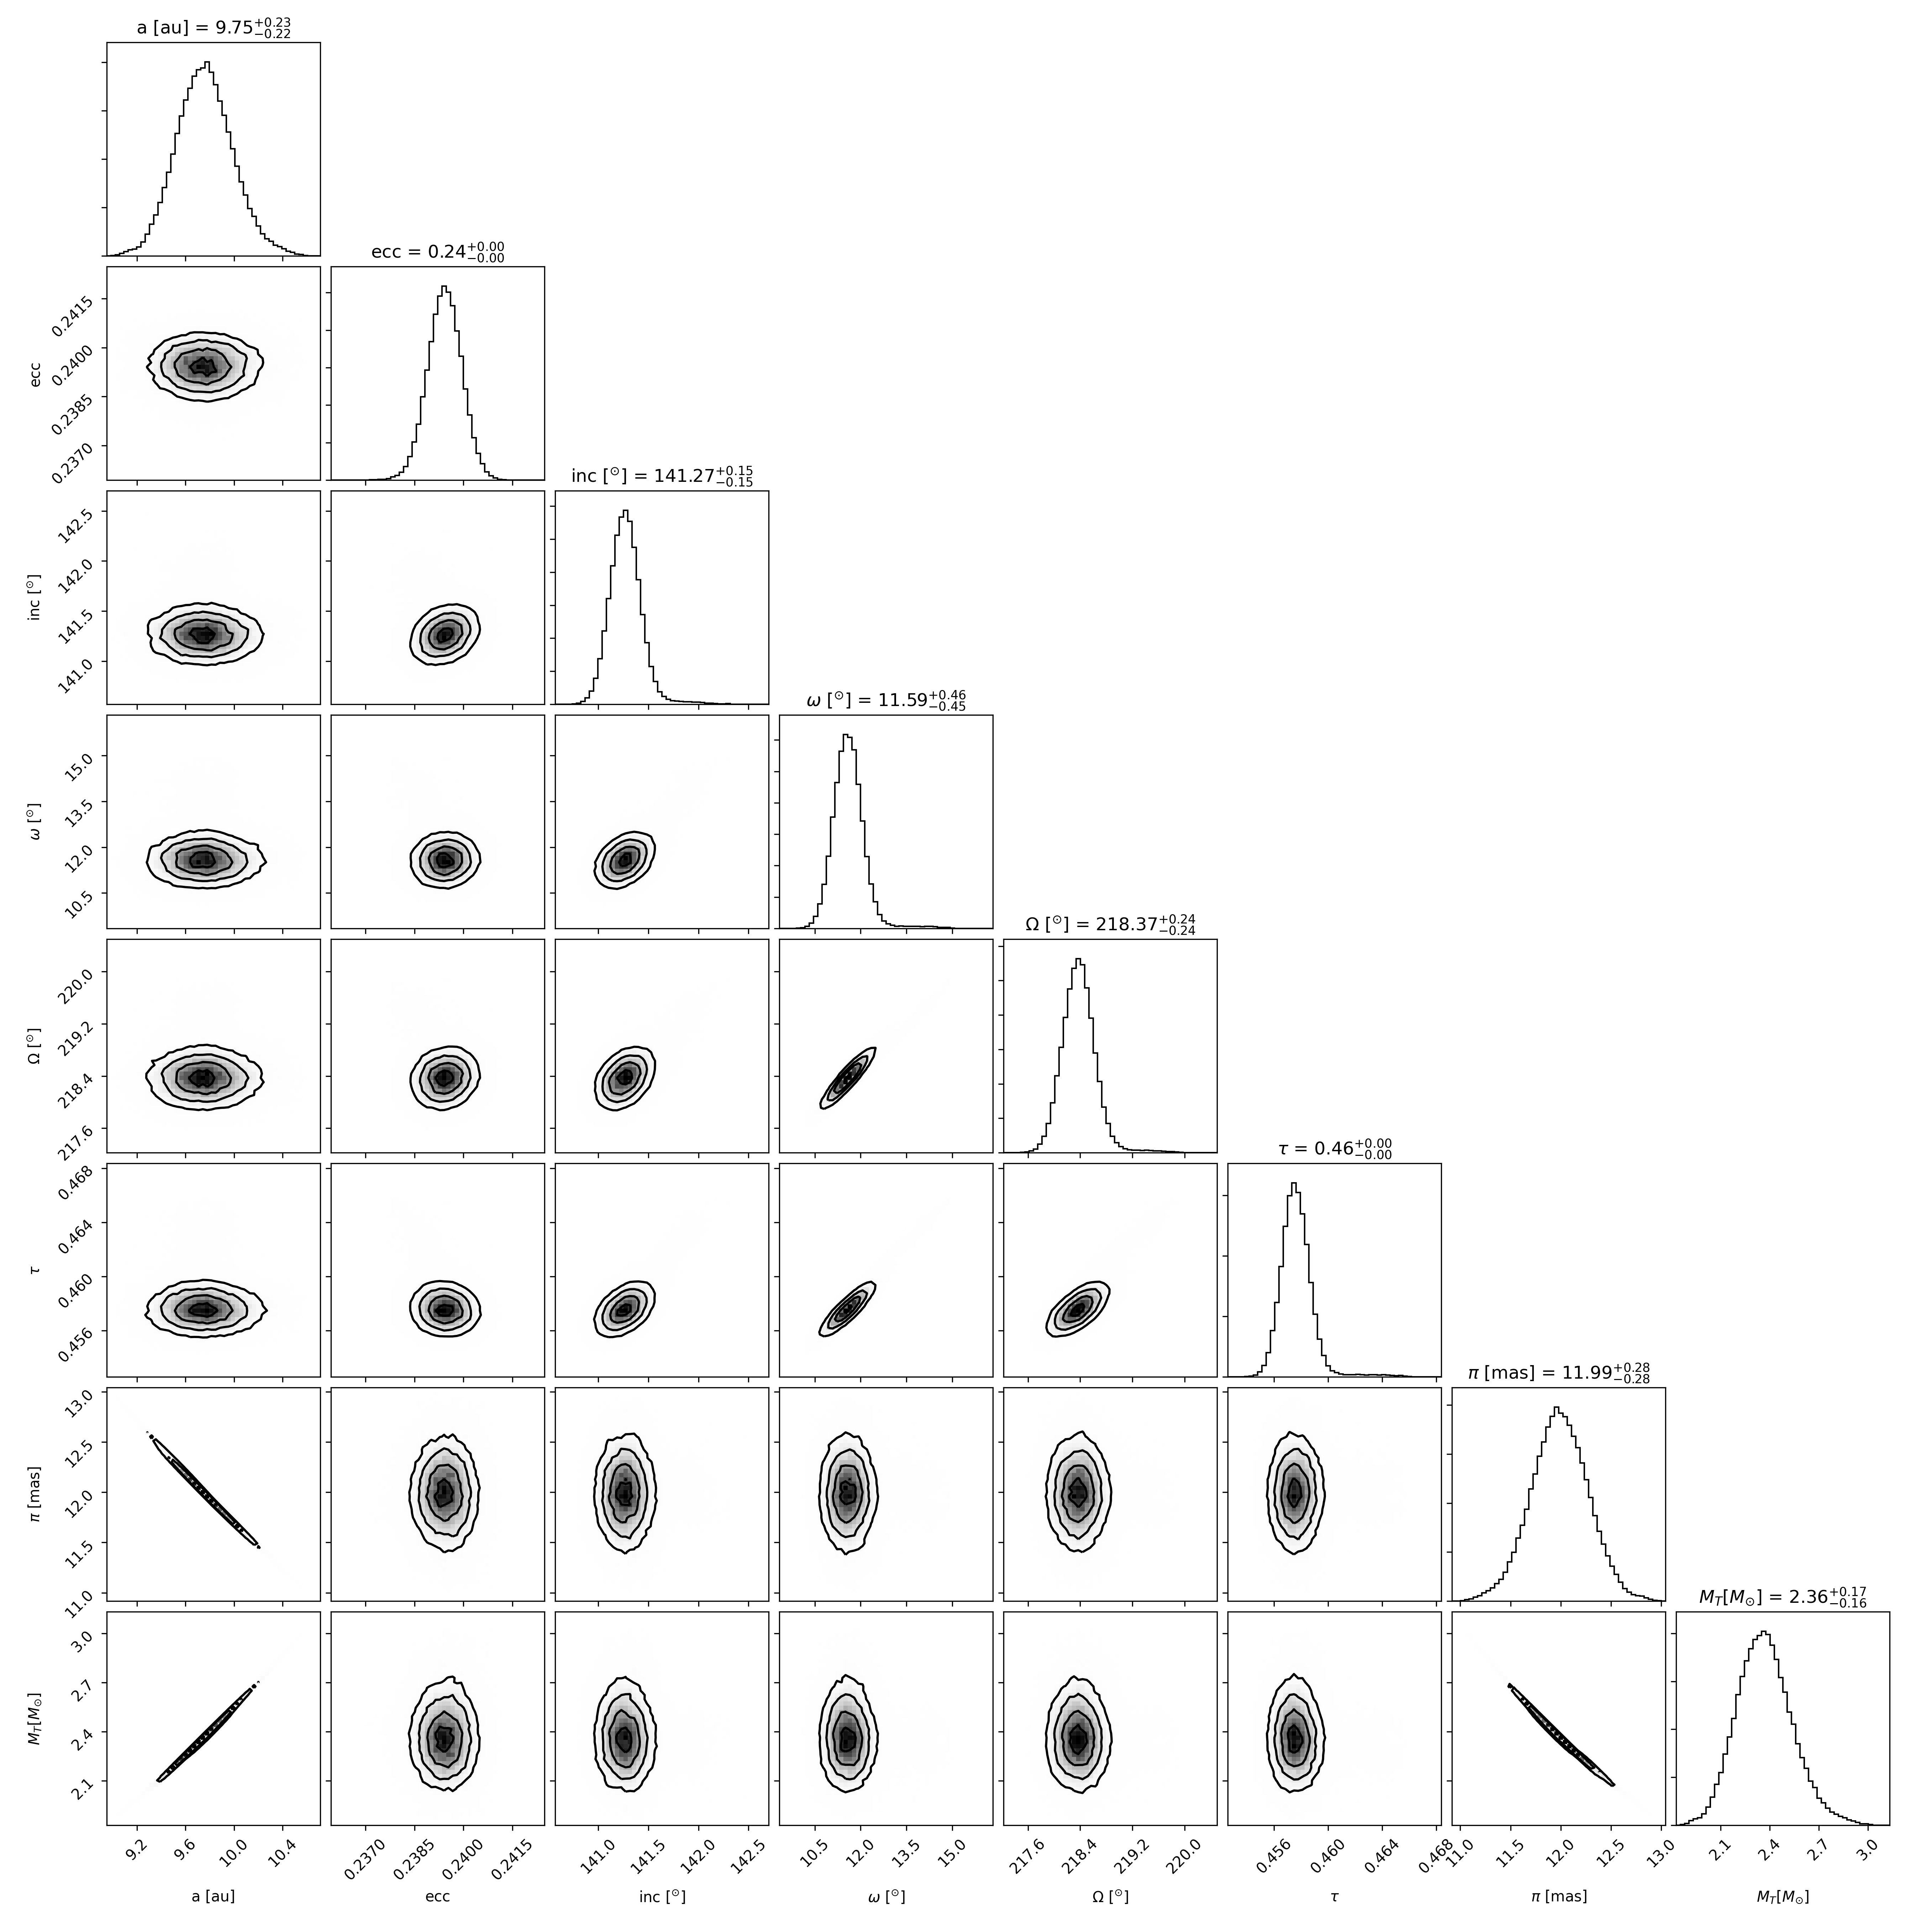
With the astrometry for each epoch collected, we proceed with fitting a Keplarian orbit to the relative astrometry of B with respect to A. To do so, we use a parallel-tempered Markov Chain Monte Carlo (MCMC) procedure (Foreman-Mackey et al., 2013), implemented within the orbit fitting software orbitize! (Blunt et al., 2017). In total, 256 chains are run in parallel at 16 temperatures to sample the posterior distribution of the following eight parameters: semi-major axis (), eccentricity (), inclination angle (), argument of periastron (), position angle of nodes (), normalized epoch of periastron passage (), parallax () and total mass (). Here, is the fraction of the orbit past a given reference date (in our case 2020 Jan 01), and is parameterized by the period (Blunt et al., 2020).
To ensure rapid convergence of the chains, the walkers are initialized from an optimized starting position found using a rejection sampling algorithm (OFTI) to find 256 potential orbits based on the first three NaCo epochs. For the OFTI algorithm, we employ a uniform prior in total mass between 0.5 and 5 . The semi-major axis prior is a log uniform distribution with a minimum value of au and a maximum of au. Eccentricity and epoch of periastron are given uniform priors between 0.0 and 1.0. The argument of periastron and position angle of nodes also have uniform priors between 0.0 and but the inclination angle makes use of a sine prior. Finally, we use a Gaussian prior on the parallax from the parallax and error of mas (DR2; Gaia Collaboration et al. (2018)). The priors used in the MCMC analysis were identical, other than that of the semi-major axis which had a log uniform prior between au and au.
| Parameter | Unit | Orbit | Median, 1- CI | Bonavita et al. (2022) |
|---|---|---|---|---|
| au | 9.7 | |||
| 0.2396 | ||||
| deg | 141.39 | |||
| deg | 11.0 | |||
| deg | 218.1 | |||
| yr | 2029.03 | |||
| yr | 19.81 | |||
| 2.35 |
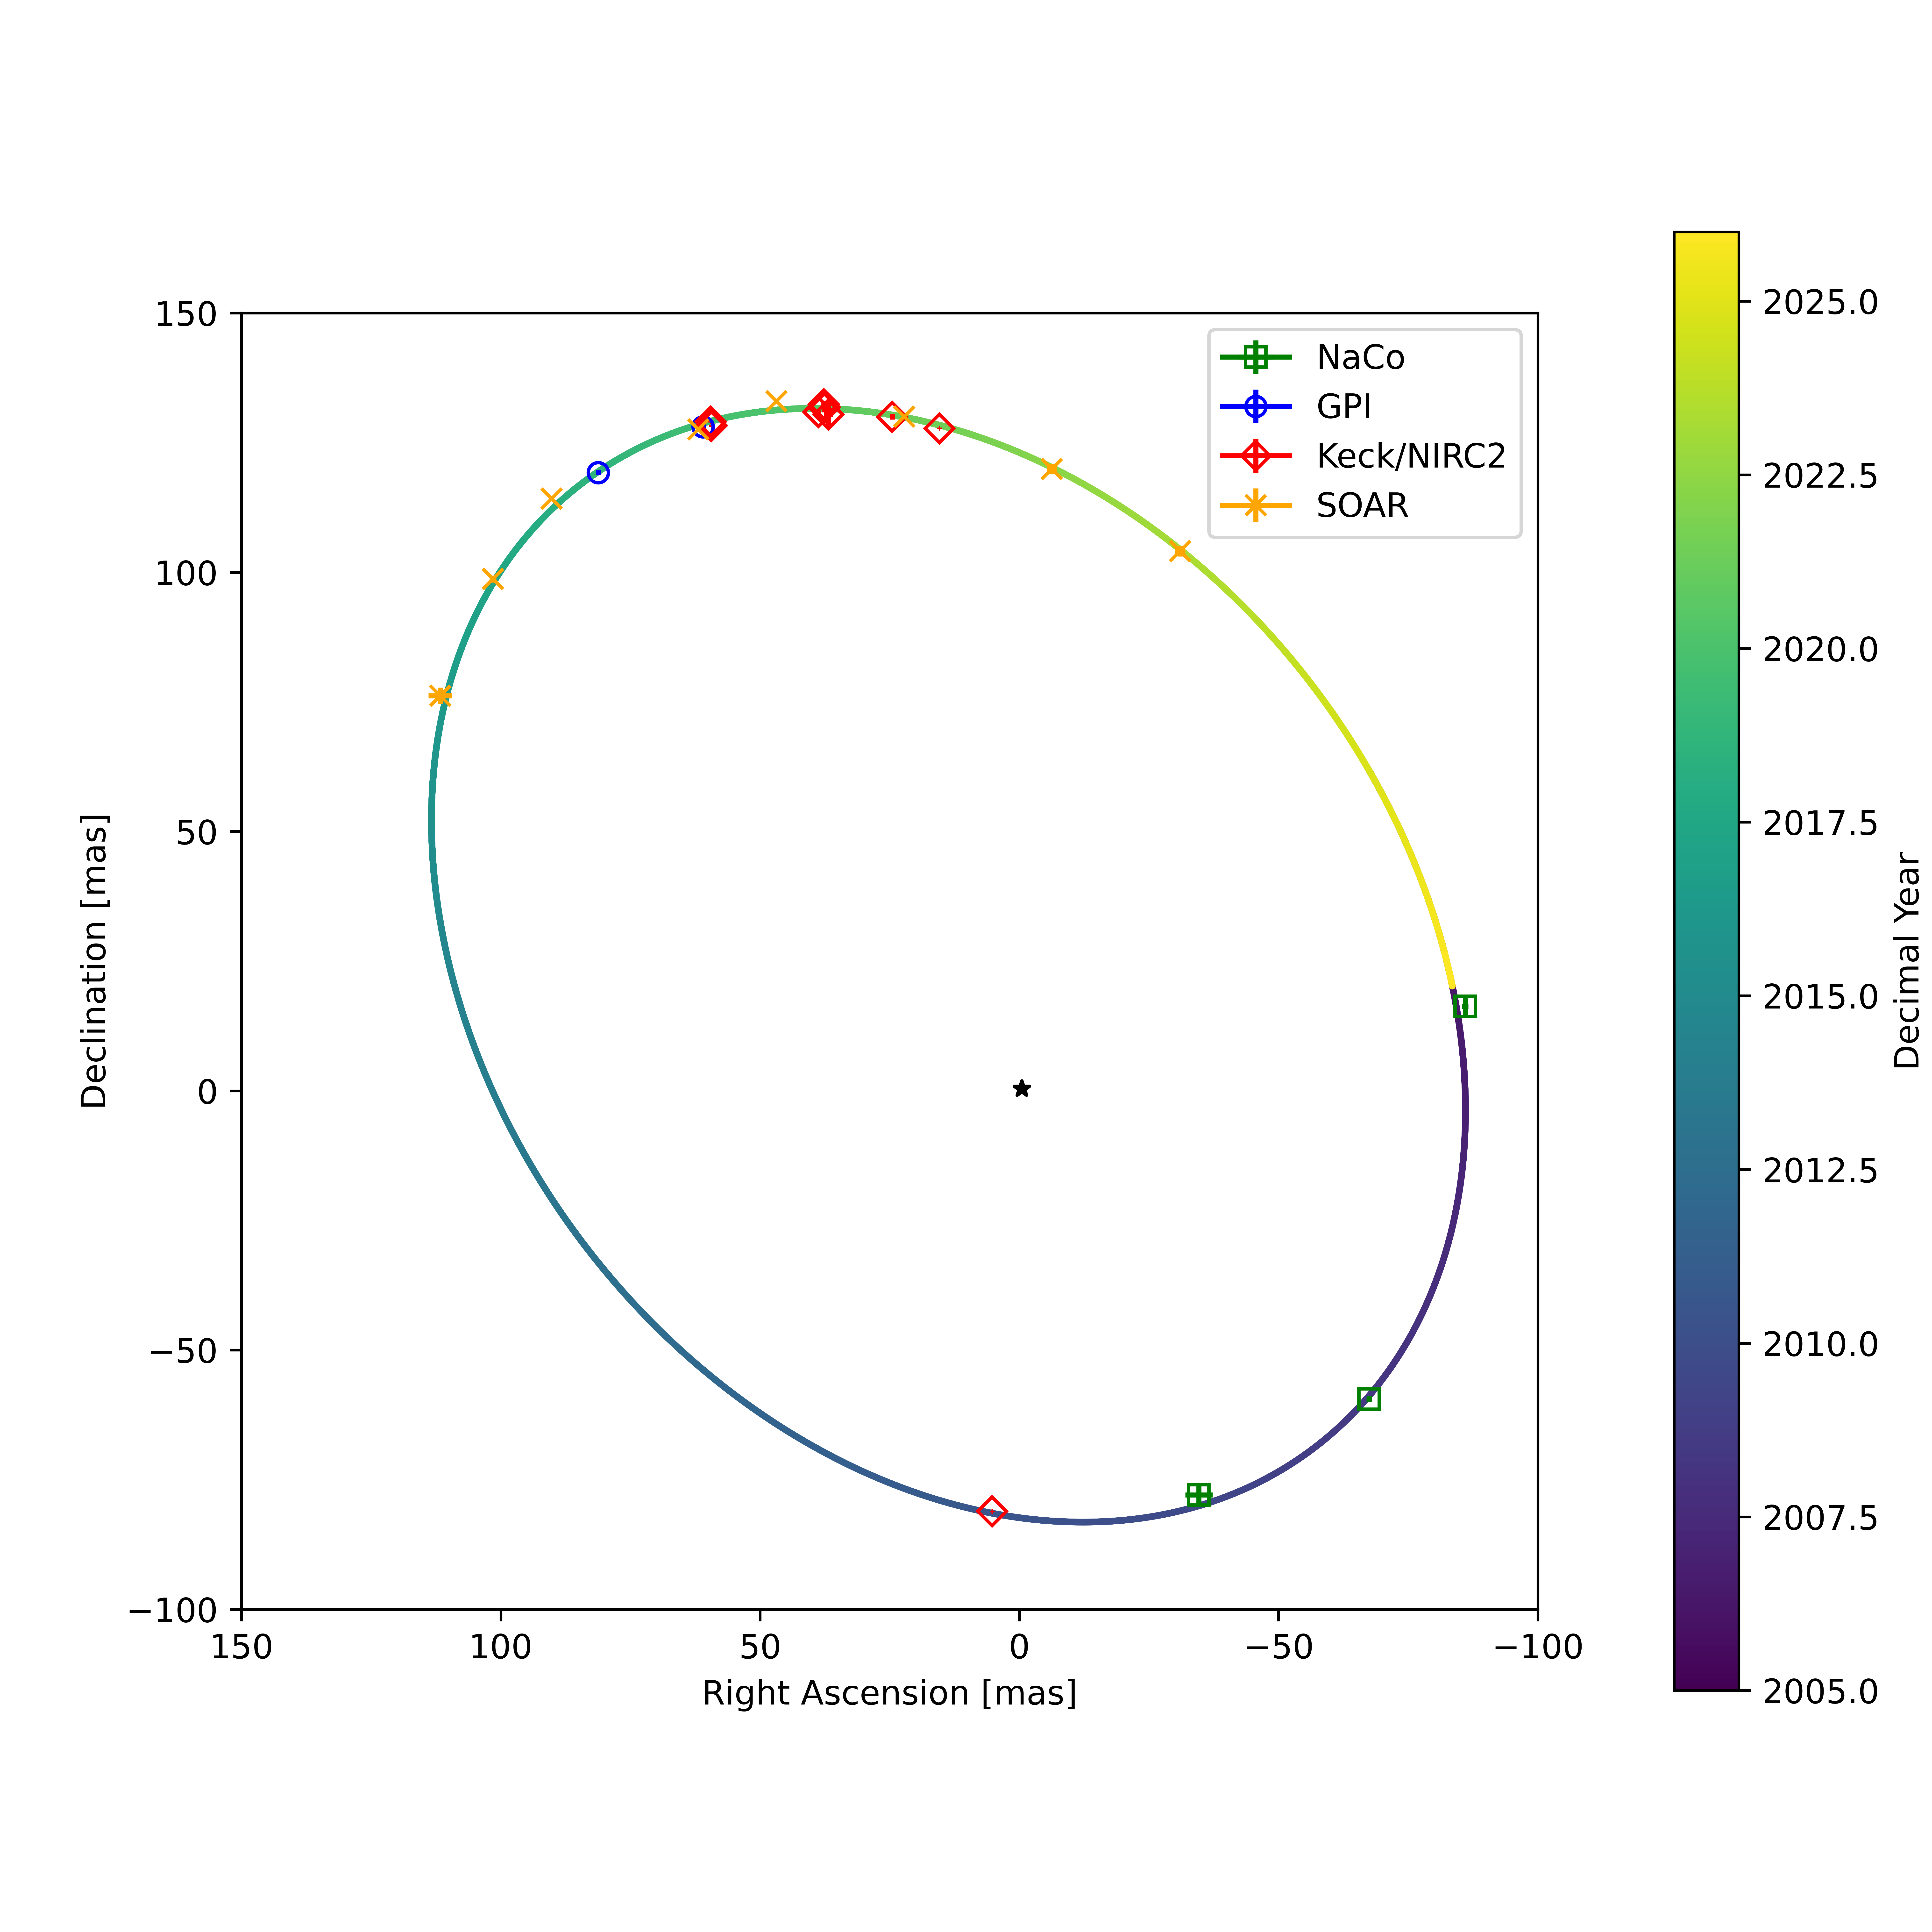
Posteriors from the MCMC fit are given in Table 2 and the orbit is plotted in Figures 4 and 5. The astrometric measurements span almost a complete orbital period resulting in a very well-constrained orbit with a reduced of 9.8. We find a fairly low eccentricity and an inclination of . The semi-major axis of the orbit is au, with a period of yr giving a total mass of .
3.2 Comparison with Previous Studies
Recently, the CD-27 system was included in a sample of binaries characterized with VLT/SPHERE (Bonavita et al., 2022) who presented an initial determination of the orbit of this system. With our improved coverage of the orbit we are able to further constrain the orbital parameters. Although we find similar values for the orbital period and eccentricity (see Table 2), the orbit appears rotated by 180 degrees on the sky. This discrepancy is due the difference between the studies for which component in the system is designated the primary. Bonavita et al. (2022) report an ambiguity in which of the two components is brightest in the near-IR, whereas we are able to differentiate which of the two resolved components is the brightest at a very high confidence (100 in the 2019 Aug 26 epoch).
3.3 Comparison with Evolutionary Models
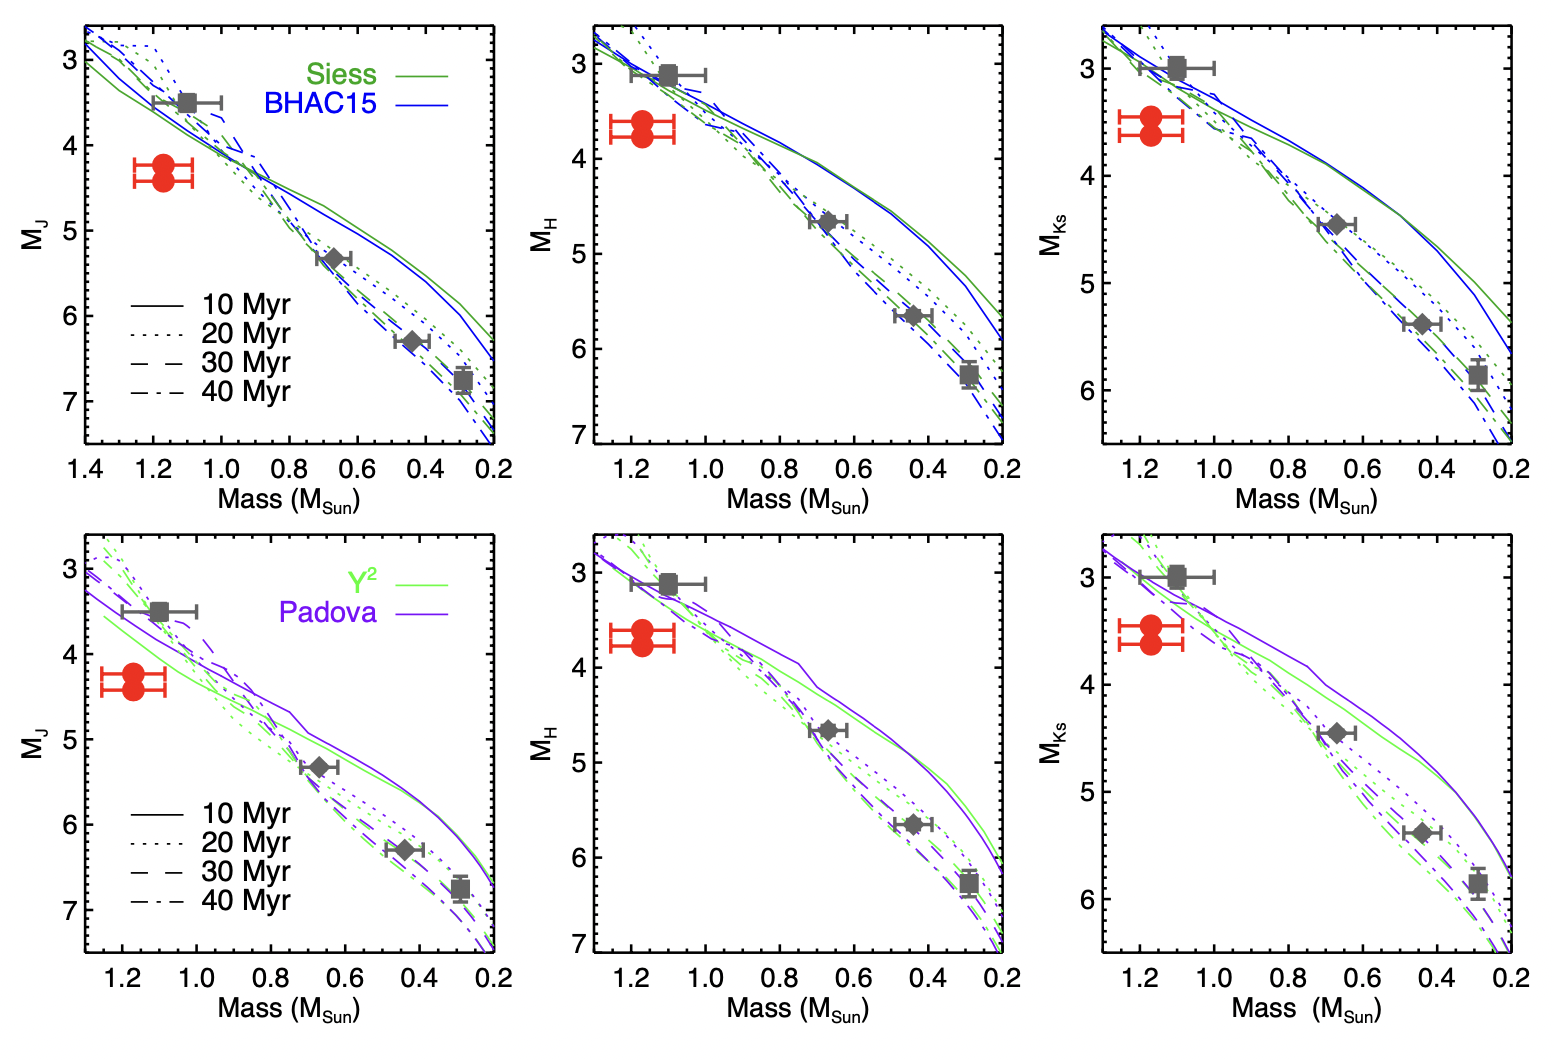
We compare the total system mass from the visual orbit to the masses predicted from four evolutionary model grids. As we do not have a measurement of the mass ratio of the system, we assume a mass ratio of , a reasonable assumption given the near-equal flux ratio. The absolute magnitude of each component was estimated from the apparent magnitude of the blended system reported in the 2MASS catalogue (Cutri et al., 2003), the flux ratio measured in the corresponding filter reported in Table 5, and the distance derived from the Gaia DR2 parallax measurement. We generated mass-magnitude relations from four evolutionary models between 10–40 Myr; Siess (Siess et al., 2000), BHAC15 (Baraffe et al., 2015), Yonsei-Yale (Spada et al., 2013) and Padova PARSEC (Bressan et al., 2012). These models are compared to the mass and absolute magnitudes of the two components of CD-27 in Figure 6.
Given the expected age of Myr for the system, the two components appear either under-luminous or too massive when compared to the evolutionary models. Such a discrepancy is difficult to explain without invoking a systematic error in either—or both —of the component masses or absolute magnitudes. If the two stars were instead above the zero-age main sequence, that could more easily be explained by a different age of the system. This discrepancy is not sensitive to our assumed mass ratio, as changing this simply shifts the components in opposite directions horizontally relative to the model tracks. This would indeed move one of the two stars closer to the main sequence but the other would become an even greater outlier.
4 Possible Causes of the Discrepancy
4.1 An Additional Component
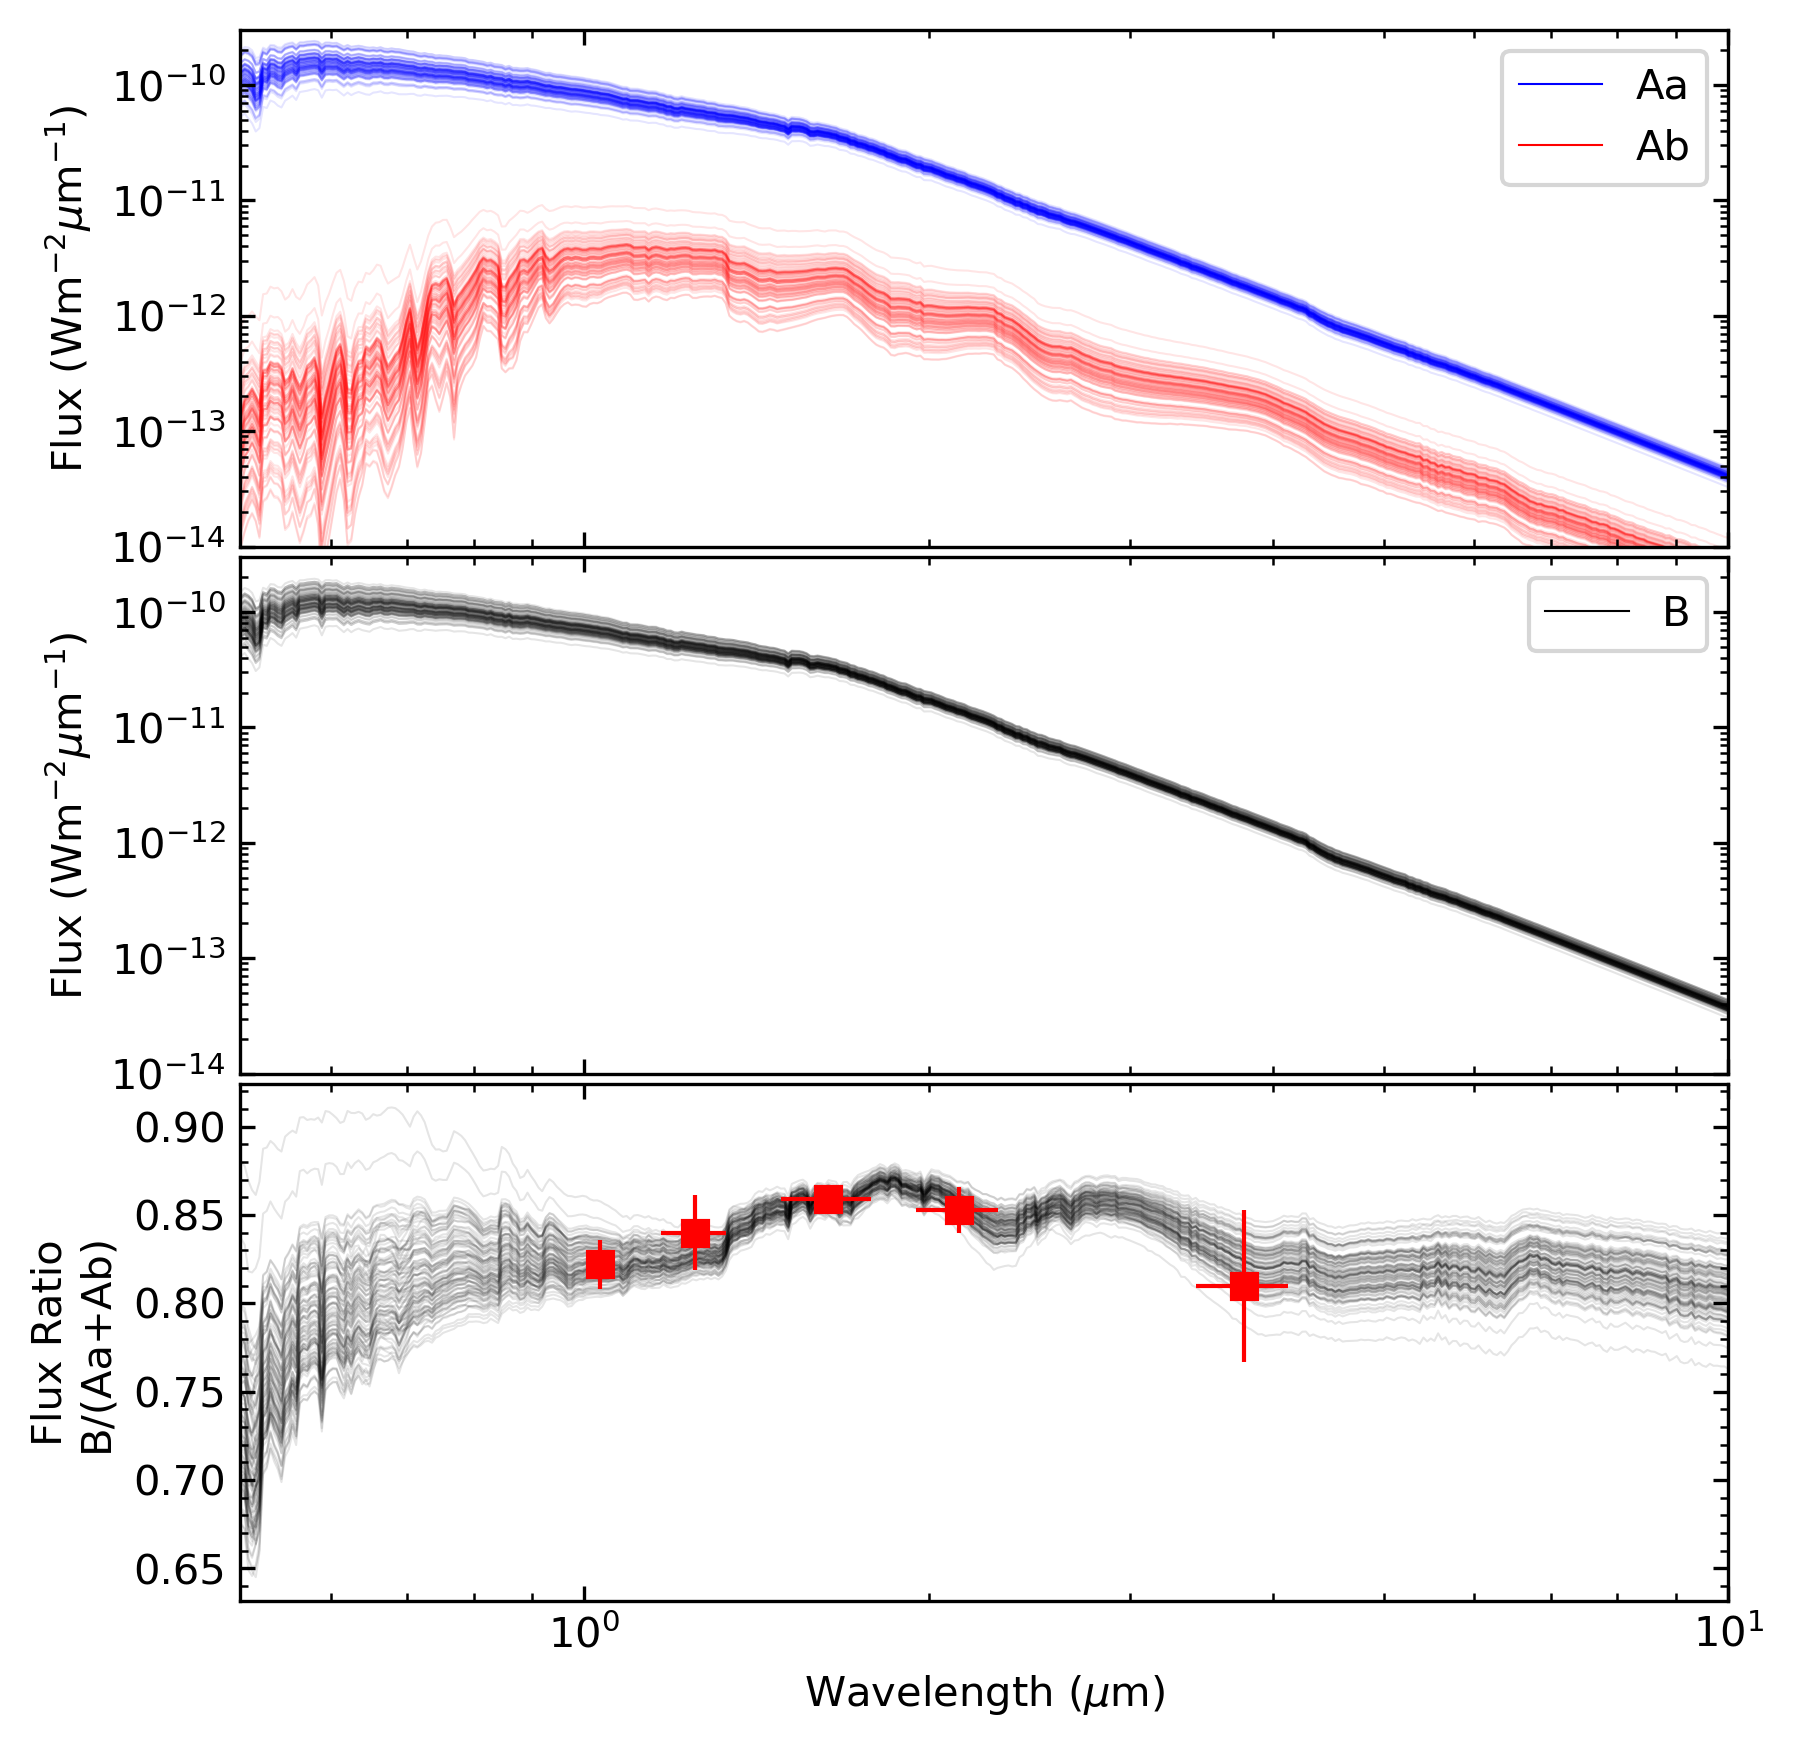
A low-mass third companion to either of the two resolved components of the system could explain the discrepancy between the total mass from the orbit, and the mass predicted from the absolute magnitude of each component. We test this hypothesis by simultaneously fitting the visual orbit and the spectral energy distribution of both of the resolved components under various assumptions regarding the system architecture. Specifically, we investigate a binary (AB) and a triple with the additional companion around either the primary (AaAb-B), or the secondary (A-BaBb). We also test the effect of removing the Gaia DR2 parallax constraint on the quality of the fit. We use Metropolis-Hastings MCMC implemented within the emcee package (Foreman-Mackey et al., 2013) to simultaneously fit the visual orbit, the flux ratios between the two resolved components, and the total near-infrared flux of the system. The visual orbit is fit as before (Section 3). The flux ratios and total flux of the system are estimated from the four aforementioned evolutionary models, with an independent fit performed per model grid. Due to the 2.9 d variability of the system (Kiraga, 2012), we only use flux ratio measurements taken on 2020 July 24 that were taken in five different bands within an hour and, consequently, would be less affected by variability. For each fit, we run 128 chains in parallel for steps. The walkers are initialised with uniform distributions, centred at the values reported in Section 3. At each step in the fit, the flux of each constituent star is generated using an interpolating function given its age, mass and the evolutionary model, from which the flux ratio between the two resolved components is determined. The absolute magnitude of the blended system is calculated and converted into an apparent magnitude using the parallax, which is then compared to the 2MASS measurements for the system Cutri et al. (2003). We use priors to keep the age between 10 and 100 Myr (consistent with the amount of lithium absorption observed), the parallax positive, and the mass of the constituent stars between 0.1 and 1.5 . The priors on the orbital parameters are as used in Section 3. The lower bound on the star mass prior was set by the minimum mass reported in the evolutionary models.
| Configuration | Prior on Parallax | Evolutionary Model | Min | Age (Myr) | Parallax (mas) | () | () | () |
|---|---|---|---|---|---|---|---|---|
| AaAb-B | Flat | BHAC15 | ||||||
| Padova | ||||||||
| Seiss | ||||||||
| Yonsei-Yale | ||||||||
| Gaia DR2 | BHAC15 | |||||||
| Padova | ||||||||
| Seiss | ||||||||
| Yonsei-Yale | ||||||||
| A-B | Flat | BHAC15 | ||||||
| Padova | ||||||||
| Seiss | ||||||||
| Yonsei-Yale | ||||||||
| Gaia DR2 | BHAC15 | |||||||
| Padova | ||||||||
| Seiss | ||||||||
| Yonsei-Yale | ||||||||
| A-BaBb | Flat | BHAC15 | ||||||
| Padova | ||||||||
| Seiss | ||||||||
| Yonsei-Yale | ||||||||
| Gaia DR2 | BHAC15 | |||||||
| Padova | ||||||||
| Seiss | ||||||||
| Yonsei-Yale |
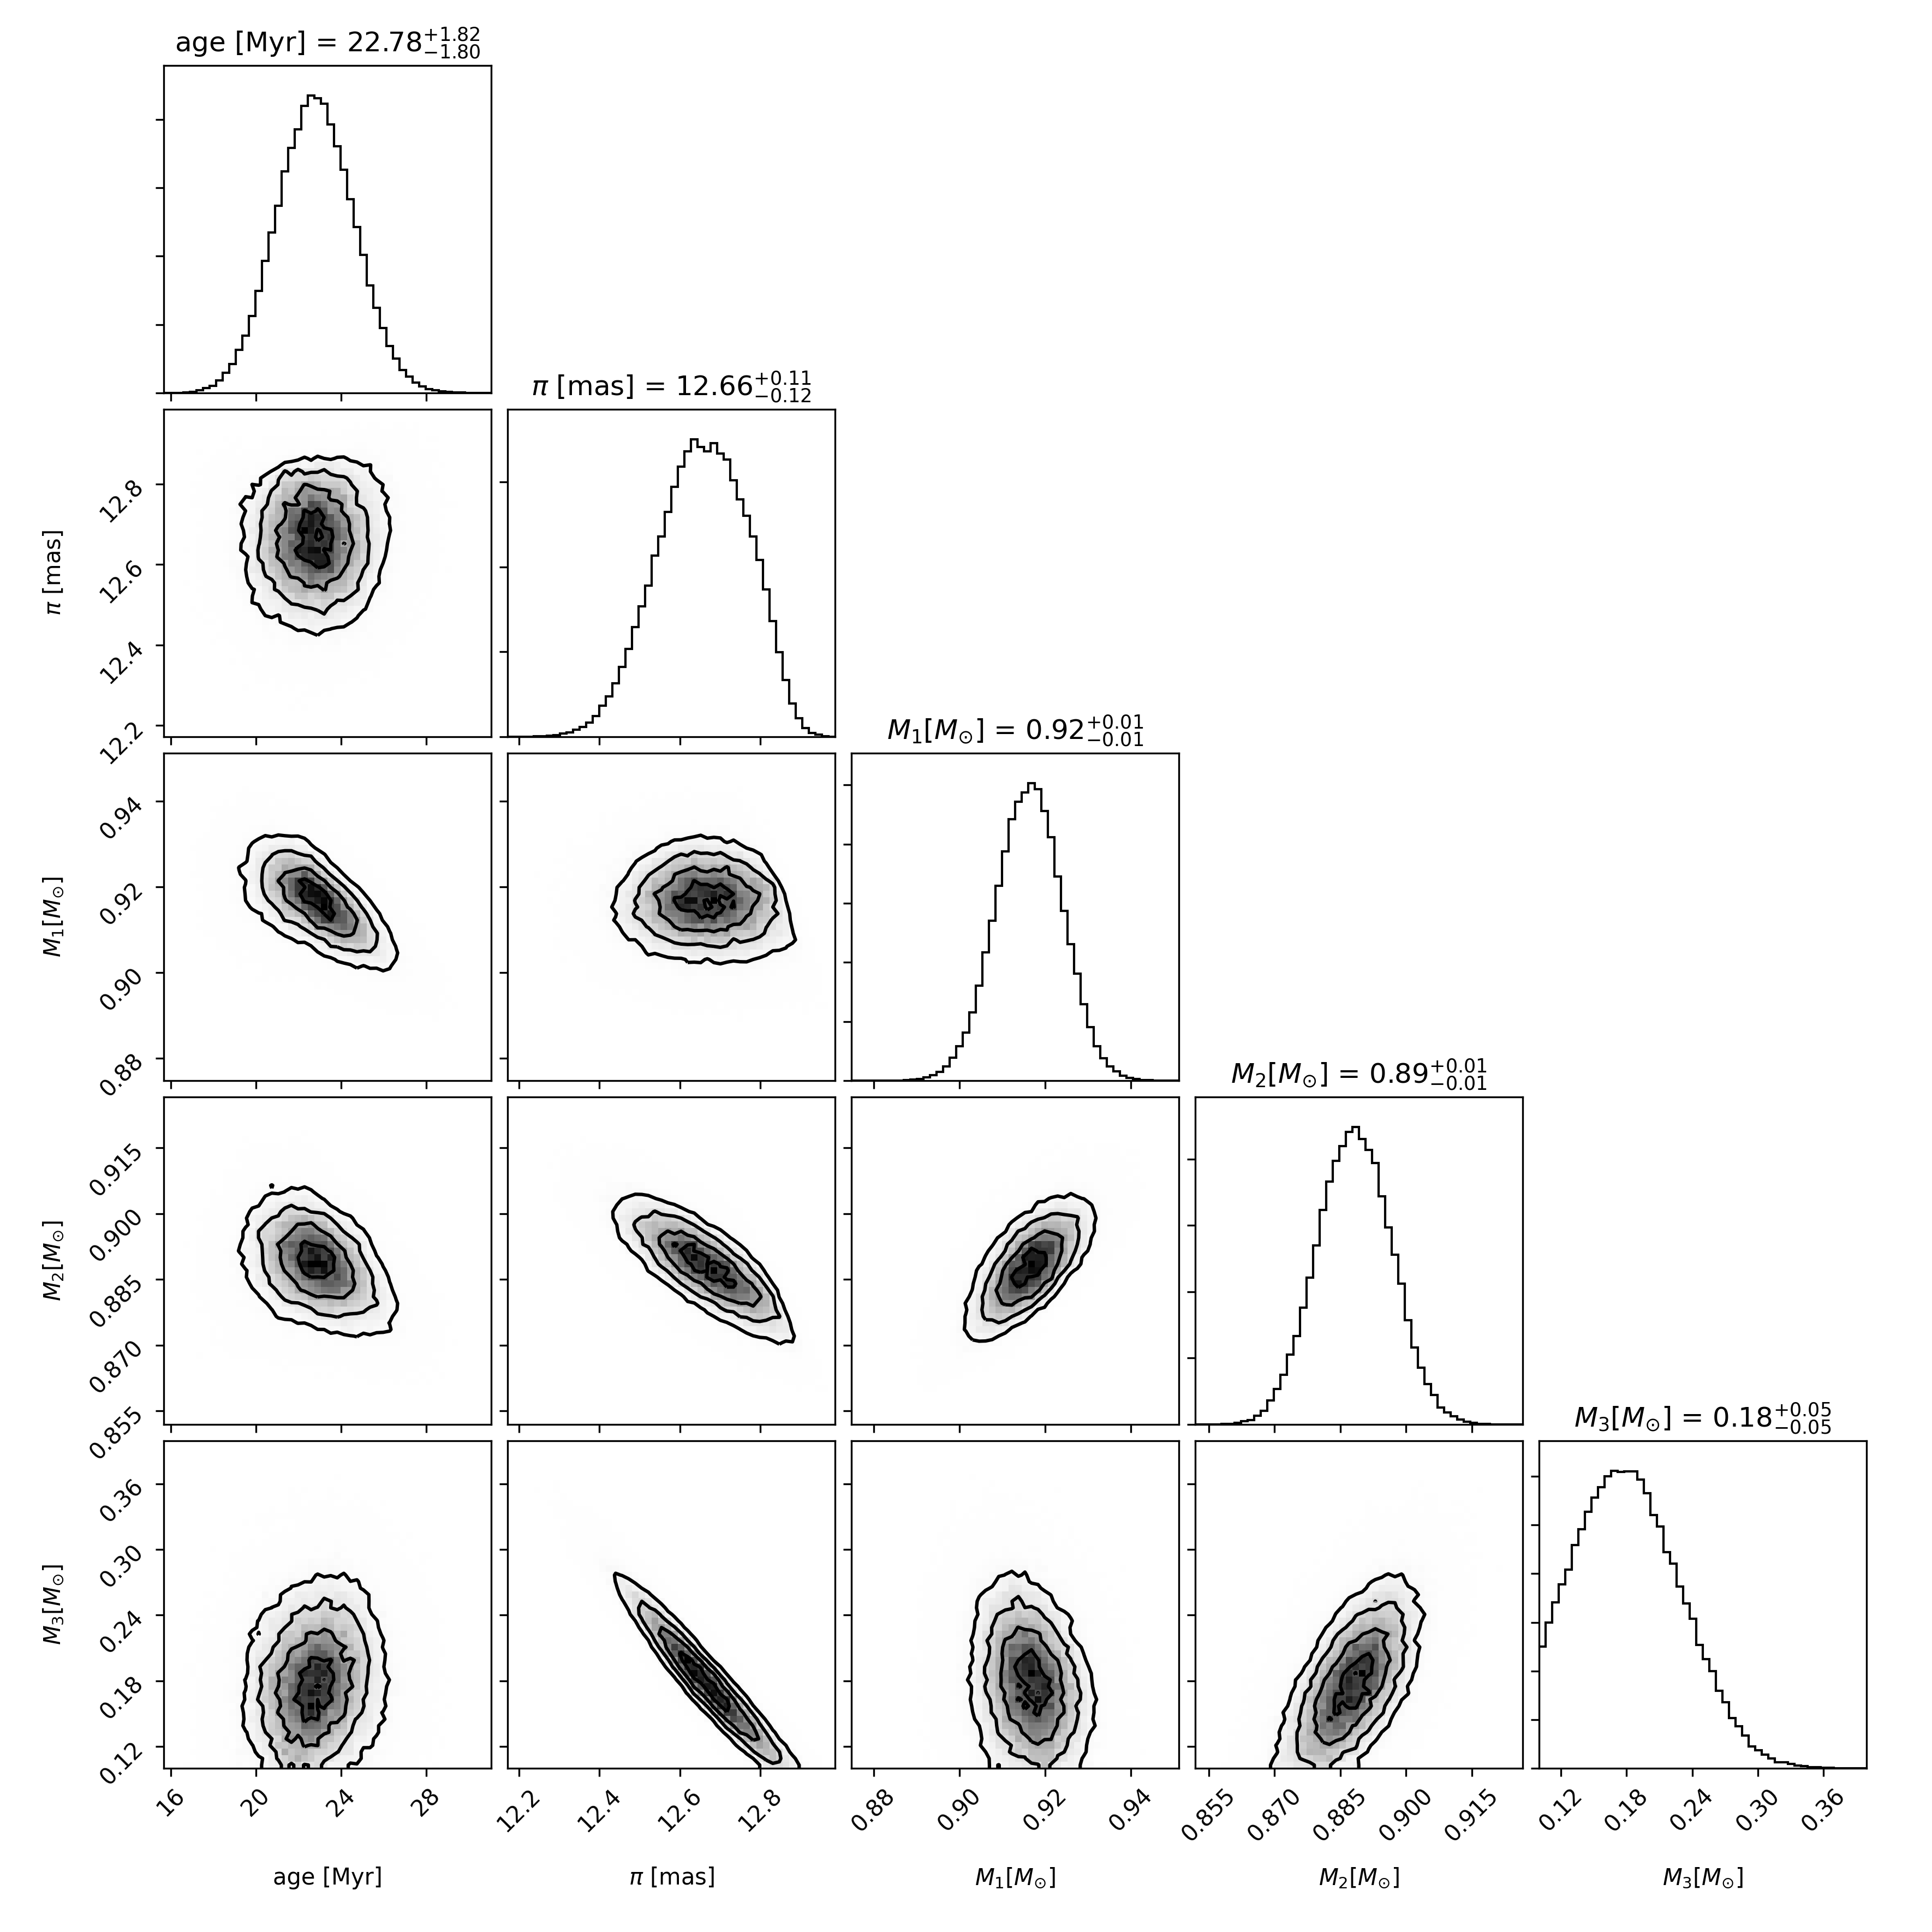
The results of our experiment are reported in Table 7. We find a best fit to the BHAC15 and Padova model grids in the AaAb-B configurations, with a minimum of 2.8, excluding the contribution from the visual orbit fit, compared with 5 for the A-B configuration, and 10–12 for the A-BaBb configuration. The Seiss and Yonsei-Yale models show similar goodness of fit for the A-B and AaAb-B configurations, with the A-BaBb configuration being more strongly disfavoured. The fits with and without a prior on the parallax give a generally similar goodness of fit, due in part to the relatively large uncertainty of the Gaia DR2 parallax measurement. This joint fit of the astrometric and photometric measurements of the CD-27 system provides some evidence of an unresolved companion to the A component within the CD-27 system, although the improvement in the goodness of fit does depend on which evolutionary model is used. We compute the component masses for the AaAb-B system architecture by taking the weighted average of the four model-dependent results and find , and . The age of the system with this method is Myr and the parallax is mas.
4.2 An Overestimated Distance
Estimating the system mass and absolute magnitudes of both components requires a reliable measurement of the system parallax. The discrepancy between measured and predicted system mass could be explained by decreasing the distance to the star. This would cause a decrease in the system mass due to a decrease in the semi-major axis, and would decrease the absolute magnitudes of the two components. This scenario was considered in Section 4.1, where we found no significant difference in the goodness of fit when comparing fits where the parallax was constrained based on the Gaia DR2 measurement to those where it was allowed to float freely. Nevertheless, the large uncertainty on the parallax measurement suggests this is a plausible explanation for the observed discrepancy.
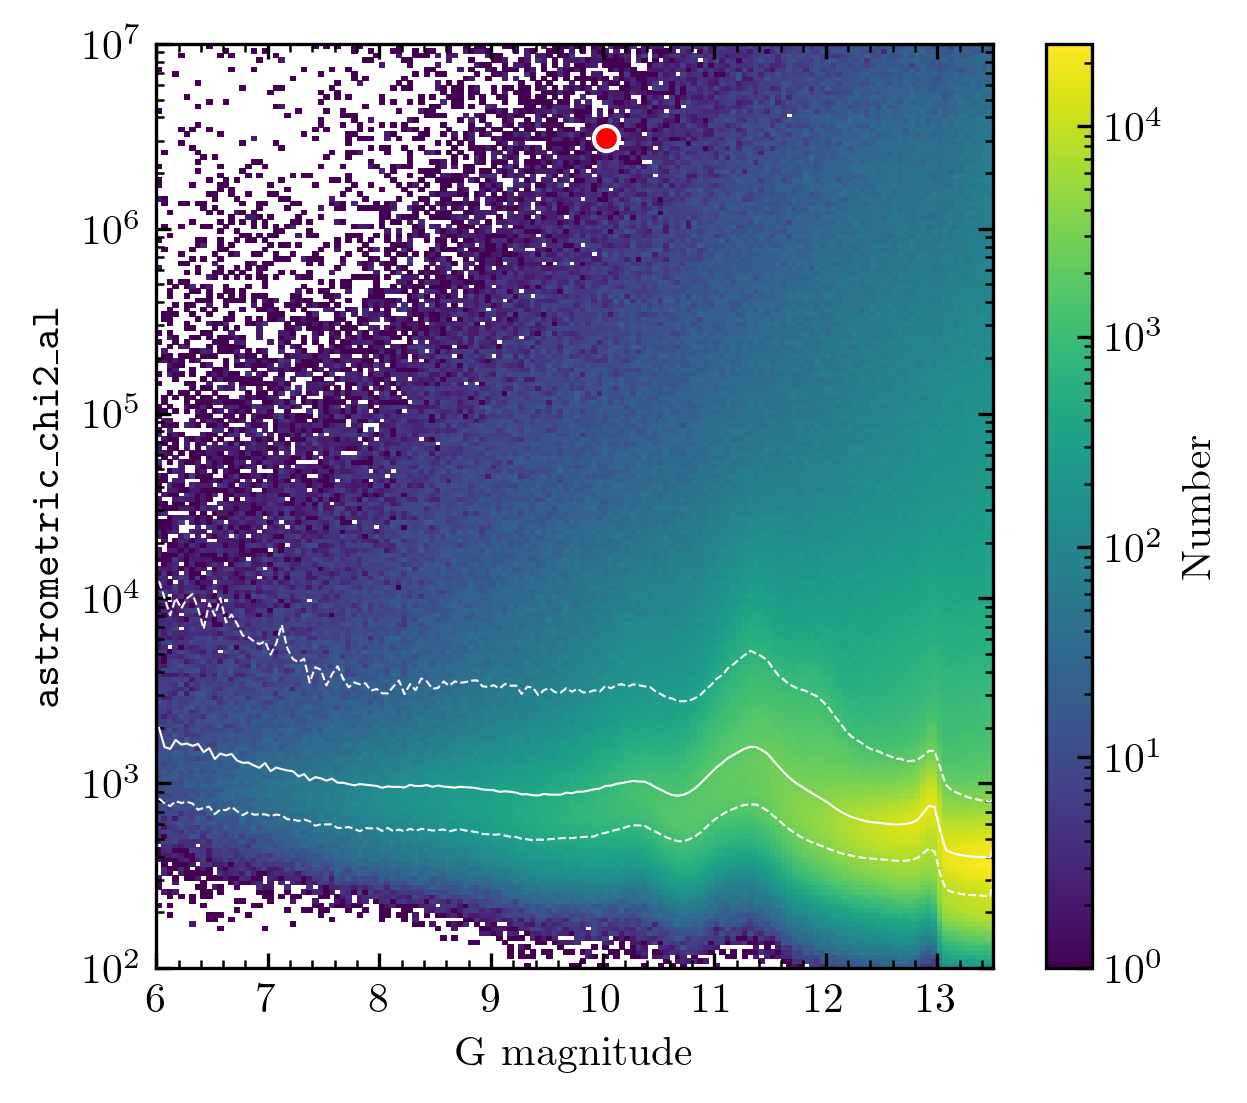
The astrometric parameters of the CD-27 system reported in Gaia DR2 are derived from a five-parameter astrometric fit (position, proper motion, parallax) based on 111 measurements taken over the course of almost two years. All of the sources within Gaia DR2 were treated as single stars, assuming constant linear motion over the time-span of the mission. Stars that deviate from linear motion for whatever reason will still be fit using the same five-parameter model, but the goodness of fit will suffer due to the incorrect assumption of linear motion. For CD-27, Gaia DR2 reports a unit weight error of , well above the typical value of for stars with (Gaia Collaboration et al., 2018). This poor goodness of fit is reflected in the unusually large uncertainties on the five fitted astrometric parameters. The goodness of fit is significantly worse in the subsequent Gaia Data Release 3 (DR3; Gaia Collaboration et al., 2021), as shown in Figure 8, and only a two-parameter solution was presented. The star was not listed in the non-single star supplement in DR3, suggesting that an astrometric binary solution was attempted, but rejected.
We consider two plausible causes for this apparent deviation from linear motion that could explain the poor goodness of fit in both Gaia DR2 and DR3, and that could have biased the parallax measurement reported in Gaia DR2. We first consider the effect of orbital motion of the two known components over the course of the Gaia observations. We use the orbit fit presented in Section 3 and the flux ratios in Table 5, under the assumption that , to predict the motion of the photocenter as observed by Gaia from 2014 Jul 25 to 2016 May 23. We predict almost linear motion in the declination direction with little change in right ascension. This would manifest itself as a small change to the measured proper motion of the system rather than inducing significant non-linear motion. It is unlikely that the orbital motion of the two resolved components could explain the poor goodness of fit in Gaia DR2.
Another source of non-linear astrometric motion in long-period binary systems is the variability of one or both of the components. So-called variability-induced movers (VIMs; Wielen, 1996) are systems in which the periodic variability of an unresolved binary causes the photocenter to move in a characteristic fashion. Several examples have been identified in the Hipparcos and Gaia DR3 catalogues. Using the measured 15% amplitude of the -band variability of this system (Kiraga, 2012), we estimate that the variability can shift the Gaia photocenter relative to the barycenter by as much as 10 mas between minima and maxima if the variability is confined to one component. Given this is comparable to the amplitude of the parallax signal, it is likely that significant variability could significantly bias the parallax measurements. Unfortunately, without access to the individual Gaia measurements, it is not possible to attempt to fit the parallax whilst simultaneously modelling this effect. CD-27 is not flagged as a variability-induced mover in Gaia DR3, and it is not possible to ascertain whether such a solution was attempted.
5 Limits on the Presence of Additional Companions
5.1 Lower Limit from Spectroscopy
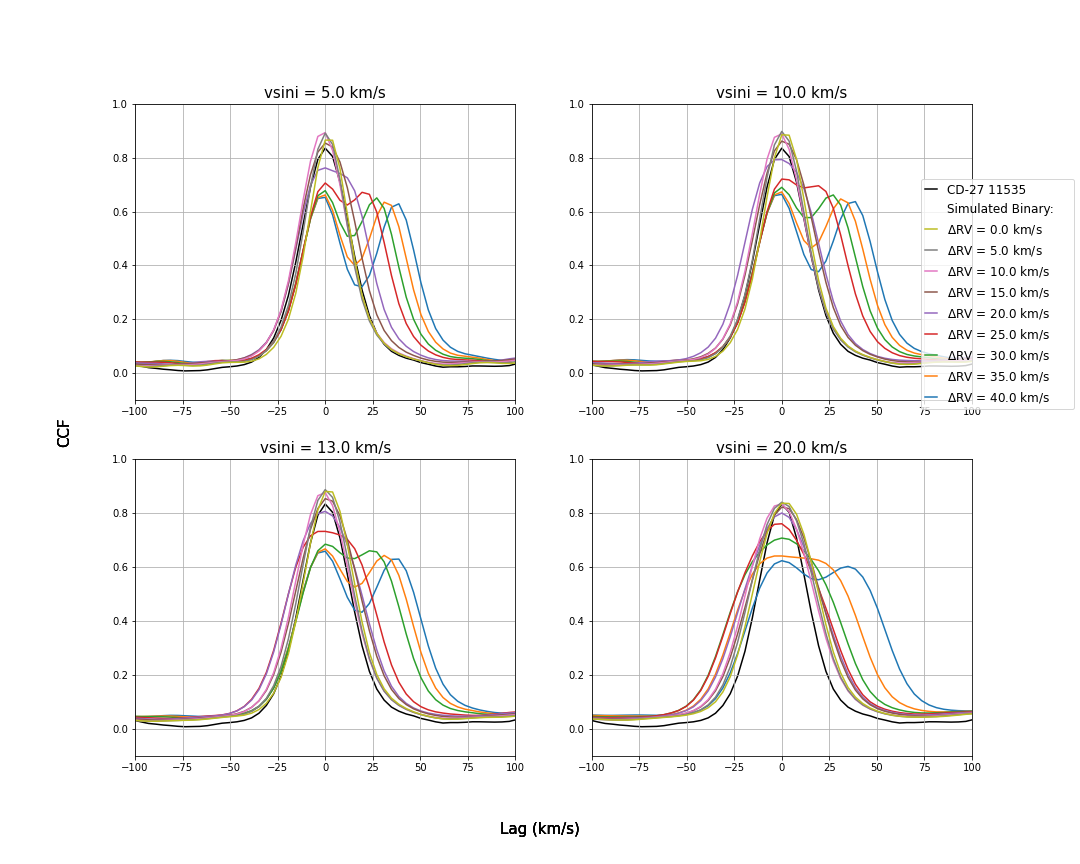
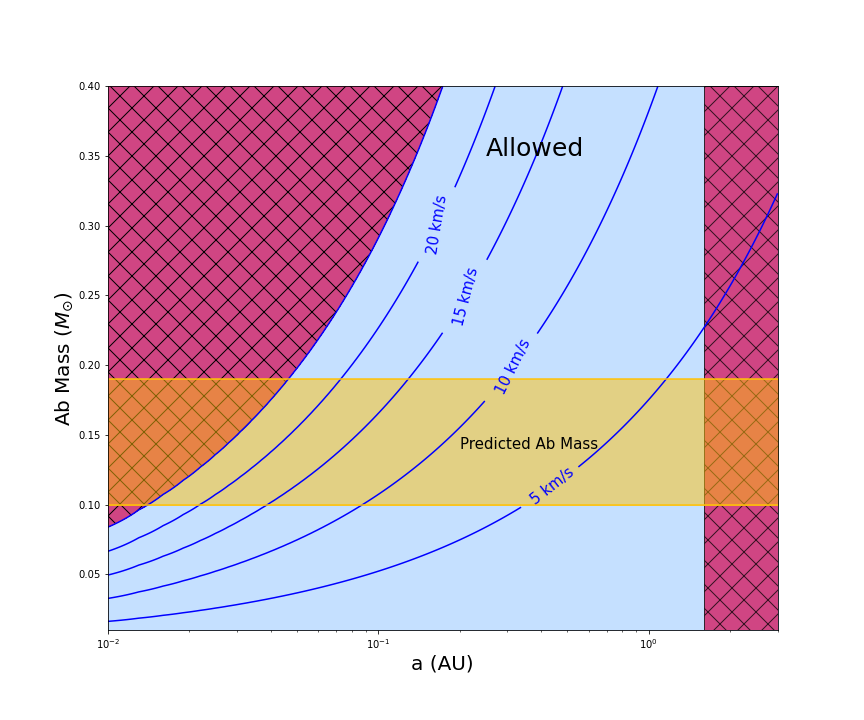
Our spectroscopic measurements can be used to place a lower limit on the orbital period of an additional companion within the system. A low-mass companion on a very short orbital period would induce a significant change of the radial velocity of the star it orbits, so long as the orbit is not face-on. We search for the effects of a third component within the ARCES spectra by cross-correlating each with the spectrum of HIP 41277, a K8 star with a comparable to CD-27. We use eight orders of the ARCES spectrum covering 5500 Å to 6700 Å, each with several lines and high signal-to-noise. The resulting cross-correlation function has a single peak for each epoch, and we do not measure a significant variation of the radial velocity. To explore the effects of relative radial velocity and rotational broadening on the cross-correlation function, we generate a synthetic binary spectrum with varying radial velocity offsets and rotational velocities which we cross-correlate with the spectrum of HIP 41277. We generate the simulated binary by combining two copies of a spectrum of a K5 star we observed as an RV standard (HIP 48331; Soubiran et al., 2013). Each spectrum is rotationally-broadened and scaled based on the predicted optical flux ratio for the two stars. We sum and normalize the blended spectrum, which is then cross-correlated with HIP 41277. This process is repeated for a grid of radial velocity offsets (six between 0 km s-1 and 40 km s-1) and (four between 5 km s-1 and 20 km s-1. The resulting cross-correlation functions are shown in Figure 12. At small delta RV ( km s-1) and ( km s-1), the cross-correlation function has a single peak. When lines are broadened by rotation ( km s-1), a larger delta RV ( km s-1) is required to resolve them. We identify the delta RV at which we detect two visually distinct peaks in the cross-correlation function, indicating a detectable separation between the primary and secondary absorption lines. Typical for K-type stars in the Pic moving group are to km s-1 (Zuckerman et al., 2001). For km s-1, the smallest delta RV at which we see two distinct peaks is km s-1. For km s-1, the smallest delta RV at which we see two distinct peaks is km s-1. The predicted delta RV from our orbit fit for A and B alone is km s-1. Thus, there can be an additional delta radial velocity km s-1 caused by the orbit of a companion around either component that would remain undetectable in our ARCES spectra. This upper limit on the radial velocity, assuming zero eccentricity and a 90-degree inclination angle and the masses given in Table 3 row 2, corresponds to a semi-major axis larger than au (orbital period yr).
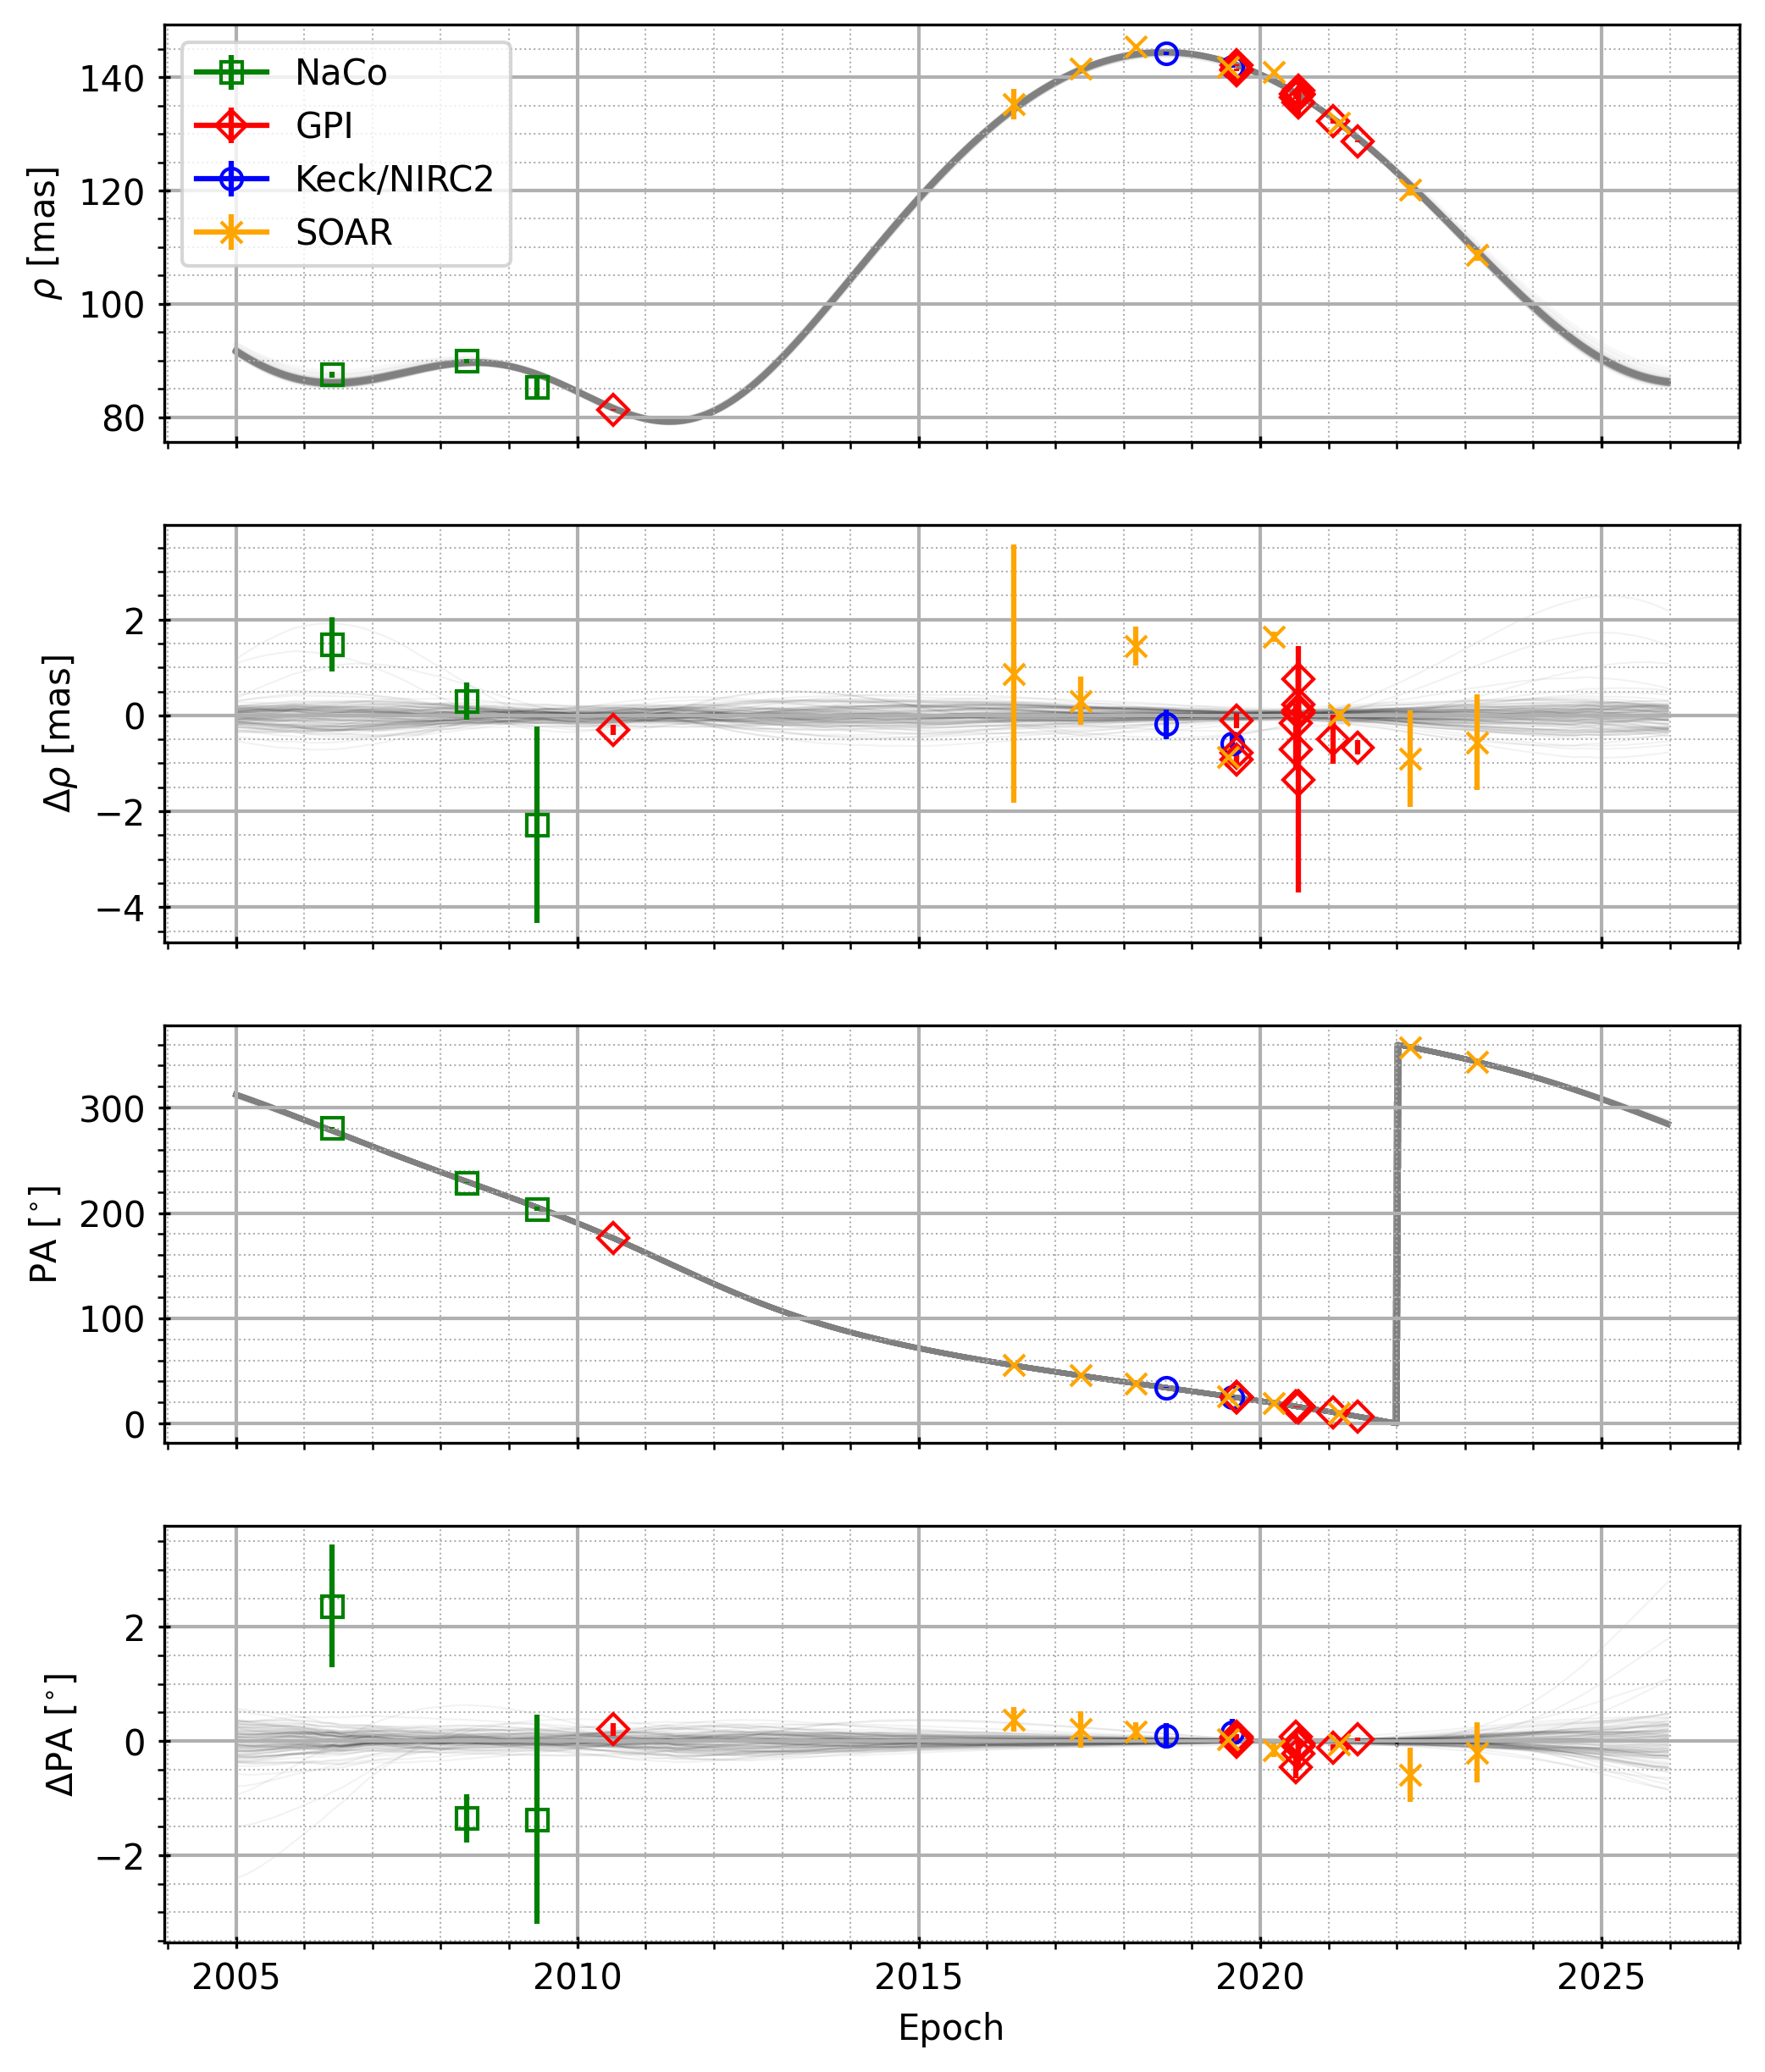
5.2 Upper Limit from Astrometry
As there is no obvious Keplerian signal in the residuals of the orbit fit to our astrometric measurements (Fig. 5, second and fourth panels), we can place an upper limit on the semi-major axis of an inner binary. We make the conservative assumption that an orbit with a photocenter semi-amplitude of 2 mas in the near-infrared would have easily been detected. Using the predicted masses and fluxes of the three components given for the AaAb-B configuration in Table 3, we convert this maximum photocenter semi-major axis into an upper limit on the total semi-major axis of the inner subsystem. We compute the reduced mass and reduced flux , from which we can calculate the total semi-major axis as . We find a conservative upper limit for the semi-major axis of the inner binary of 1.6 au (orbital period yr). The allowed phase space for the semi-major axis of an inner binary is shown in Figure 9.
6 Conclusion
We have presented resolved astrometric measurements of the young CD-27 11535 system that we used to refine the visual orbit of the system. Our analysis revealed a significant discrepancy between the total system mass, and the masses of the components estimated for evolutionary models. We explored two scenarios that could explain this discrepancy; either an unresolved companion to either of the two stars, or a biased parallax measurement caused by the photometric variability of either or both of the components. Our joint fit of the visual orbit and resolved photometry provides evidence for a low-mass star present around the A component of the system. Our most favoured configuration for this scenario is a K-type star and M dwarf in a short but unknown orbit (with a semi-major axis between 0.04 and 1.6 au), with a more distant K-type star in a 20-year orbit with a semi-major axis of 9.8 au. This configuration is favoured for the BHAC15 and Padova model grids regardless of whether the parallax is constrained using the Gaia DR2 measurement or not.
An alternative explanation for the observed discrepancy between the measured and predicted system mass is a bias in the parallax measurement reported in Gaia DR2. CD-27 has a very poor goodness of fit in both Gaia DR2 and DR3, so much so that only a two-parameter fit is provided in the DR3. We exclude the possibility that this poor goodness of fit is caused by the photocenter orbit of the known binary; the orbital motion is almost linear over the Gaia baseline. Instead, it is likely that the photometric variability of one or both of the components is causing a significant motion of the photocenter relative to the barycenter on periods comparable to the 2.9 d variability measured by Kiraga (2012). The amplitude of this variability-induced motion is predicted to be on the same order as the amplitude of the parallax signal. Unfortunately, without the individual Gaia measurements, it is impossible to re-fit the parallax accounting for this effect.
Currently, the uncertainty regarding the architecture of the system is primarily driven by uncertainty in the parallax. The upcoming Gaia data releases will contain the individual astrometric measurements made during the five and ten-year duration of the mission, covering a good fraction of the orbital period of the system. With these data in hand, we will be able to jointly fit the systemic motion and parallax of the system, the orbital motion, and motion induced by variability of either or both of the resolved components. With a refined distance estimate in hand, we will be able to re-visit the observed discrepancy between the measured and predicted system mass. In the mean time, interferometric observations from CHARA (ten Brummelaar et al., 2005) and VLTI (Correia et al., 2003), as well as high-resolution near-infrared spectroscopic observations, will be able to place improved constraints on the presence of additional companions, complementing the analysis performed here. A complete characterization of the CD-27 system, both in terms of an improved distance determination, and a more detailed search for additional companion, will be necessary before the system can be used as a valuable benchmark for the study of the evolution of young stars.
References
- Alonso-Floriano et al. (2015) Alonso-Floriano, F. J., Caballero, J. A., Cortés-Contreras, M., Solano, E., & Montes, D. 2015, A&A, 583, A85, doi: 10.1051/0004-6361/201526795
- Baraffe et al. (2015) Baraffe, I., Homeier, D., Allard, F., & Chabrier, G. 2015, A&A, 577, A42, doi: 10.1051/0004-6361/201425481
- Bell et al. (2015) Bell, C. P. M., Mamajek, E. E., & Naylor, T. 2015, MNRAS, 454, 593, doi: 10.1093/mnras/stv1981
- Blunt et al. (2017) Blunt, S., Nielsen, E. L., De Rosa, R. J., et al. 2017, AJ, 153, 229, doi: 10.3847/1538-3881/aa6930
- Blunt et al. (2020) Blunt, S., Wang, J. J., Angelo, I., et al. 2020, AJ, 159, 89, doi: 10.3847/1538-3881/ab6663
- Bonavita et al. (2022) Bonavita, M., Gratton, R., Desidera, S., et al. 2022, A&A, 663, A144, doi: 10.1051/0004-6361/202140510
- Bressan et al. (2012) Bressan, A., Marigo, P., Girardi, L., et al. 2012, MNRAS, 427, 127, doi: 10.1111/j.1365-2966.2012.21948.x
- Burgasser & Blake (2009) Burgasser, A. J., & Blake, C. H. 2009, The Astronomical Journal, 137, 4621, doi: 10.1088/0004-6256/137/6/4621
- Carlos et al. (2016) Carlos, M., Nissen, P. E., & Meléndez, J. 2016, Astronomy & Astrophysics, 587, A100, doi: 10.1051/0004-6361/201527478
- Chauvin et al. (2015) Chauvin, G., Vigan, A., Bonnefoy, M., et al. 2015, A&A, 573, A127
- Correia et al. (2003) Correia, S., Richichi, A., & Schöller, M. 2003, Ap&SS, 286, 191, doi: 10.1023/A:1026124026341
- Cutri et al. (2003) Cutri, R. M., Skrutskie, M. F., van Dyk, S., et al. 2003, 2MASS All Sky Catalog of point sources.
- De Rosa et al. (2020) De Rosa, R. J., Nguyen, M. M., Chilcote, J., et al. 2020, J. Astron. Telesc. Instrum. Syst., 6, 015006
- Ehrenreich et al. (2010) Ehrenreich, D., Lagrange, A. M., Montagnier, G., et al. 2010, A&A, 523, A73, doi: 10.1051/0004-6361/201014763
- Elliott et al. (2014) Elliott, P., Bayo, A., Melo, C. H. F., et al. 2014, A&A, 568, A26, doi: 10.1051/0004-6361/201423856
- Elliott et al. (2015) Elliott, P., Huélamo, N., Bouy, H., et al. 2015, A&A, 580, A88, doi: 10.1051/0004-6361/201525794
- Foreman-Mackey et al. (2013) Foreman-Mackey, D., Hogg, D. W., Lang, D., & Goodman, J. 2013, PASP, 125, 306, doi: 10.1086/670067
- Gaia Collaboration et al. (2018) Gaia Collaboration, Brown, A. G. A., Vallenari, A., et al. 2018, A&A, 616, A1, doi: 10.1051/0004-6361/201833051
- Gaia Collaboration et al. (2021) —. 2021, A&A, 649, A1, doi: 10.1051/0004-6361/202039657
- Greenbaum et al. (2019) Greenbaum, A. Z., Cheetham, A., Sivaramakrishnan, A., et al. 2019, AJ, 157, 249
- Høg et al. (2000) Høg, E., Fabricius, C., Makarov, V. V., et al. 2000, A&A, 355, L27
- Kiraga (2012) Kiraga, M. 2012, Acta Astron., 62, 67. https://arxiv.org/abs/1204.3825
- Lenzen et al. (2003) Lenzen, R., Hartung, M., Brandner, W., et al. 2003, Proc. SPIE, 4841, 944
- Macintosh et al. (2014) Macintosh, B., Graham, J. R., Ingraham, P., et al. 2014, PNAS, 111, 12661
- Maire et al. (2014) Maire, J., Ingraham, P. J., De Rosa, R. J., et al. 2014, Proc. SPIE, 9147, 85
- Montet et al. (2015) Montet, B. T., Bowler, B. P., Shkolnik, E. L., et al. 2015, ApJ, 813, L11, doi: 10.1088/2041-8205/813/1/L11
- Nielsen et al. (2016) Nielsen, E. L., De Rosa, R. J., Wang, J., et al. 2016, AJ, 152, 175, doi: 10.3847/0004-6256/152/6/175
- Perrin et al. (2014) Perrin, M. D., Maire, J., Ingraham, P., et al. 2014, in Proc. SPIE, Vol. 9147, Ground-based and Airborne Instrumentation for Astronomy V, 91473J, doi: 10.1117/12.2055246
- Rousset et al. (2003) Rousset, G., Lacombe, F., Puget, P., et al. 2003, Proc. SPIE, 4839, 140
- Schlieder et al. (2016) Schlieder, J. E., Skemer, A. J., Maire, A.-L., et al. 2016, ApJ, 818, 1, doi: 10.3847/0004-637X/818/1/1
- Service et al. (2016) Service, M., Lu, J. R., Campbell, R., et al. 2016, PASP, 128, 095004, doi: 10.1088/1538-3873/128/967/095004
- Shkolnik et al. (2017) Shkolnik, E. L., Allers, K. N., Kraus, A. L., Liu, M. C., & Flagg, L. 2017, AJ, 154, 69, doi: 10.3847/1538-3881/aa77fa
- Siess et al. (2000) Siess, L., Dufour, E., & Forestini, M. 2000, A&A, 358, 593
- Song et al. (2012) Song, I., Zuckerman, B., & Bessell, M. S. 2012, AJ, 144, 8, doi: 10.1088/0004-6256/144/1/8
- Soubiran et al. (2013) Soubiran, C., Jasniewicz, G., Chemin, L., et al. 2013, A&A, 552, A64, doi: 10.1051/0004-6361/201220927
- Spada et al. (2013) Spada, F., Demarque, P., Kim, Y.-C., & Sills, A. 2013, ApJ, 776, 87, doi: 10.1088/0004-637X/776/2/87
- Stanford-Moore et al. (2020) Stanford-Moore, S. A., Nielsen, E. L., De Rosa, R. J., Macintosh, B., & Czekala, I. 2020, ApJ, 898, 27, doi: 10.3847/1538-4357/ab9a35
- ten Brummelaar et al. (2005) ten Brummelaar, T. A., McAlister, H. A., Ridgway, S. T., et al. 2005, ApJ, 628, 453, doi: 10.1086/43072910.48550/arXiv.astro-ph/0504082
- Tokovinin (2023) Tokovinin, A. 2023, Private Communication
- Tokovinin et al. (2018) Tokovinin, A., Mason, B. D., Hartkopf, W. I., Mendez, R. A., & Horch, E. P. 2018, The Astronomical Journal, 155, 235, doi: 10.3847/1538-3881/aabf8d
- Tokovinin et al. (2022) Tokovinin, A., Mason, B. D., Mendez, R. A., & Costa, E. 2022, The Astronomical Journal, 164, 58, doi: 10.3847/1538-3881/ac78e7
- Tokovinin et al. (2020) Tokovinin, A., Mason, B. D., Mendez, R. A., Costa, E., & Horch, E. P. 2020, The Astronomical Journal, 160, 7, doi: 10.3847/1538-3881/ab91c1
- Tokovinin et al. (2021) Tokovinin, A., Mason, B. D., Mendez, R. A., et al. 2021, The Astronomical Journal, 162, 41, doi: 10.3847/1538-3881/ac00bd
- Tokovinin et al. (2019) Tokovinin, A., Mason, B. D., Mendez, R. A., Horch, E. P., & Briceñ o, C. 2019, The Astronomical Journal, 158, 48, doi: 10.3847/1538-3881/ab24e4
- Torres et al. (2006) Torres, C. A. O., Quast, G. R., da Silva, L., et al. 2006, A&A, 460, 695, doi: 10.1051/0004-6361:20065602
- Wang et al. (2003) Wang, S.-i., Hildebrand, R. H., Hobbs, L. M., et al. 2003, in Society of Photo-Optical Instrumentation Engineers (SPIE) Conference Series, Vol. 4841, Instrument Design and Performance for Optical/Infrared Ground-based Telescopes, ed. M. Iye & A. F. M. Moorwood, 1145–1156, doi: 10.1117/12.461447
- Weise et al. (2010) Weise, P., Launhardt, R., Setiawan, J., & Henning, T. 2010, A&A, 517, A88, doi: 10.1051/0004-6361/201014453
- Wielen (1996) Wielen, R. 1996, A&A, 314, 679
- Yelda et al. (2011) Yelda, S., Lu, J. R., Ghez, A. M., et al. 2011, ApJ, 726, 114, doi: 10.1088/0004-637X/726/2/114
- Zuckerman & Song (2004) Zuckerman, B., & Song, I. 2004, ARA&A, 42, 685, doi: 10.1146/annurev.astro.42.053102.134111
- Zuckerman et al. (2001) Zuckerman, B., Song, I., Bessell, M. S., & Webb, R. A. 2001, ApJ, 562, L87, doi: 10.1086/337968
Table 4 presents the observing log of all epochs for CD-27 and calibrators for which we reduced data. Table 10 contains all astrometric and photometric measurements of the star - both our own and those found in the literature - as well as the residuals compared to the median orbit. Figure 10 shows the corner plot of the orbital parameters from the initial orbitize! fit and reveals convergence. Figure 11 displays the covariance between the system age, parallax and component masses from the joint fit in section 4 using the evolutionary model and system architecture with the lowest - AaAb-B and Padova PAR-SEC. Figure 12 shows the cross-correlation function between one observed spectrum of CD-27 and HIP 41277, as well as a simulated binary and HIP 41277 for various and RV.
| UT Start | Target | Camera | Filter | DIMM seeing | Airmass | Program ID | |||
|---|---|---|---|---|---|---|---|---|---|
| (s) | (asec) | ||||||||
| VLT/NaCo | |||||||||
| 2006-05-27T04:40:28 | CD-27 11535 | S27 | IB2.27 | 1.2 | 50 | 12 | 0.99–1.34 | 1.01–1.03 | 077.C-0483 |
| 2006-05-27T01:23:21 | 1RXS J125608.8-692652 | S27 | IB2.27 | 50 | 1.2 | 16 | 1.19–1.62 | 1.41 | 077.C-0483 |
| 2006-05-27T02:00:28 | HD 112245 | S27 | IB2.27 | 75 | 0.8 | 13 | 1.08–1.95 | 1.26–1.27 | 077.C-0483 |
| 2006-05-27T06:57:01 | CD-54 7336 | S27 | IB2.27 | 75 | 0.8 | 12 | 0.93–1.32 | 1.18–1.20 | 077.C-0483 |
| 2008-05-18T04:17:54 | CD-27 11535 | S27 | IB2.27 | 60 | 1.0 | 12 | 0.67–1.23 | 1.08–1.11 | 081.C-0825 |
| 2008-05-19T06:22:59 | GSC 06242-00004 | S27 | IB2.27 | 150 | 0.4 | 12 | 0.70–0.92 | 1.00–1.01 | 081.C-0825 |
| 2008-05-19T05:57:49 | TYC 6234-1287-1 | S27 | IB2.27 | 40 | 1.5 | 12 | 0.59–0.72 | 1.01 | 081.C-0825 |
| 2008-05-17T03:27:16 | CD-25 11504 | S27 | IB2.27 | 100 | 0.6 | 12 | 0.65–0.81 | 1.09–1.12 | 081.C-0825 |
| 2008-05-17T03:50:14 | V* V2505 Oph | S27 | IB2.27 | 120 | 0.5 | 12 | 0.59–0.67 | 1.07–1.09 | 081.C-0825 |
| 2009-06-01T06:13:30 | CD-27 11535 | S13 | /ND | 5 | 2 | 9 | 1.32–1.84 | 1.03 | 083.C-0659 |
| 2009-06-01T00:27:49 | 2MASS J12205449-6457242 | S13 | /ND | 5 | 2 | 6 | 0.58–0.74 | 1.31–1.34 | 083.C-0659 |
| 2009-06-01T02:08:17 | CD-40 8031 | S13 | /ND | 5 | 2 | 3 | 0.90 | 1.05 | 083.C-0659 |
| 2009-06-01T03:24:20 | V* NZ Lup | S13 | /ND | 5 | 2 | 3 | 0.78 | 1.06 | 083.C-0659 |
| Keck/NIRC2 | |||||||||
| 2010-07-12T08:59:21 | CD-27 11535 | Narrow | 0.100 | 100 | 6 | 1.51–1.52 | U104N2 | ||
| 2010-07-12T09:58:40 | HD 172649 | Narrow | 0.032 | 100 | 6 | 1.05–1.06 | U104N2 | ||
| 2019-08-26T05:14:34 | CD-27 11535 | Narrow | 0.050 | 100 | 22 | 1.48 | U204 | ||
| 2019-08-26T05:20:45 | CD-27 11535 | Narrow | 0.050 | 100 | 22 | 1.48 | U204 | ||
| 2019-08-26T05:28:22 | CD-27 11535 | Narrow | 0.050 | 100 | 42 | 1.48 | U204 | ||
| 2019-08-26T05:53:51 | HD 160934 | Narrow | 0.018 | 100 | 42 | 1.33 | U204 | ||
| 2019-08-26T05:53:51 | HD 160934 | Narrow | 0.018 | 100 | 42 | 1.33 | U204 | ||
| 2019-08-26T06:06:23 | HD 160934 | Narrow | 0.018 | 100 | 42 | 1.33–1.34 | U204 | ||
| 2020-07-09T07:16:01 | CD-27 11535 | Narrow | 0.05 | 100 | 41 | 1.56–1.58 | D309 | ||
| 2020-07-09T07:26:26 | CD-27 11535 | Narrow | 0.60 | 10 | 41 | 1.53–1.55 | D309 | ||
| 2020-07-09T07:56:21 | HD 153318 | Narrow | 0.60 | 10 | 42 | 1.60 | D309 | ||
| 2020-07-09T08:19:32 | HD 153318 | Narrow | 0.05 | 100 | 41 | 1.60 | D309 | ||
| 2020-07-24T06:46:54 | CD-27 11535 | Narrow | 0.05 | 100 | 25 | 1.51 | U216 | ||
| 2020-07-24T06:53:56 | CD-27 11535 | Narrow | 0.05 | 100 | 25 | 1.50 | U216 | ||
| 2020-07-24T07:00:53 | CD-27 11535 | Narrow | 0.05 | 100 | 25 | 1.49–1.50 | U216 | ||
| 2020-07-24T07:09:30 | CD-27 11535 | Narrow | 2.00 | 4 | 25 | 1.48–1.49 | U216 | ||
| 2020-07-24T07:16:52 | CD-27 11535 | Narrow | 0.30 | 10 | 25 | 1.48 | U216 | ||
| 2020-07-24T07:25:54 | HD 153318 | Narrow | 0.30 | 10 | 50 | 1.60–1.61 | U216 | ||
| 2020-07-24T07:39:45 | HD 153318 | Narrow | 2.00 | 4 | 25 | 1.61–1.62 | U216 | ||
| 2020-07-24T07:47:25 | HD 153318 | Narrow | 0.05 | 100 | 25 | 1.62–1.63 | U216 | ||
| 2020-07-24T07:53:55 | HD 153318 | Narrow | 0.05 | 100 | 25 | 1.63–1.64 | U216 | ||
| 2020-07-24T08:00:26 | HD 153318 | Narrow | 0.05 | 100 | 15 | 1.64–1.65 | U216 | ||
| 2021-01-23T16:25:29 | CD-27 11535 | Narrow | 0.3 | 50 | 15 | 2.51–2.62 | D297 | ||
| 2021-01-23T16:16:42 | HD 153318 | Narrow | 0.1 | 100 | 20 | 2.45–2.38 | D297 | ||
| 2021-06-04T11:33:58 | CD-27 11535 | Narrow | BrG | 0.3 | 100 | 12 | 1.52–1.54 | D335 | |
| 2021-06-04T12:22:24 | 1RXS J195602.8-320720 | Narrow | BrG | 1.0 | 30 | 12 | 1.68–1.70 | D335 | |
| Gemini-S/GPI | |||||||||
| 2018-08-15T01:05:15 | CD-27 11535 | H | 59.6 | 1 | 19 | 1.01–1.03 | GS-2017B-Q-22 | ||
| 2018-08-15T01:46:28 | HD 153318 | H | 59.6 | 1 | 20 | 1.07–1.11 | GS-2017B-Q-22 | ||
| 2019-08-05T02:14:09 | CD-27 11535 | 59.6 | 1 | 16 | 1.04–1.06 | GS-2019B-Q-120 | |||
| 2019-08-05T02:41:50 | HD 153318 | 59.6 | 1 | 16 | 1.09–1.13 | GS-2019B-Q-120 | |||
| UT Date | Instrument | Filter | Plate Scale | True North | residual | residual | Flux Ratio | Calib. | Data | ||
|---|---|---|---|---|---|---|---|---|---|---|---|
| (mas px-1) | (deg) | (mas) | (mas) | (deg) | (deg) | Ref. | Ref. | ||||
| 2006 May 27 | NaCo | IB2.27 | a | ||||||||
| 2008 May 18 | NaCo | IB2.27 | a | ||||||||
| 2009 Jun 01 | NaCo | /ND | b | ||||||||
| 2010 Jul 12 | NIRC2 | c | |||||||||
| 2018 Aug 15 | GPI | – | d | ||||||||
| 2019 Aug 05 | GPI | – | d | ||||||||
| 2019 Aug 26 | NIRC2 | e | |||||||||
| 2019 Aug 26 | NIRC2 | e | |||||||||
| 2019 Aug 26 | NIRC2 | e | |||||||||
| 2020 Jul 09 | NIRC2 | e | |||||||||
| 2020 Jul 09 | NIRC2 | e | |||||||||
| 2020 Jul 24 | NIRC2 | e | |||||||||
| 2020 Jul 24 | NIRC2 | e | |||||||||
| 2020 Jul 24 | NIRC2 | e | |||||||||
| 2020 Jul 24 | NIRC2 | e | |||||||||
| 2020 Jul 24 | NIRC2 | e | |||||||||
| 2021 Jan 22 | NIRC2 | e | |||||||||
| 2021 Jun 04 | NIRC2 | BrG | e | ||||||||
| Literature Measurements | |||||||||||
| 2016 May 20 | SOAR | f | |||||||||
| 2017 May 15 | SOAR | f | |||||||||
| 2018 Mar 07 | SOAR | g | |||||||||
| 2019 Jul 15 | SOAR | h | |||||||||
| 2020 Mar 13 | SOAR | i | |||||||||
| 2021 Feb 27 | SOAR | j | |||||||||
| 2022 Mar 12 | SOAR | k | |||||||||
| 2023 Mar 06 | SOAR | k | |||||||||