The Ubiquity and Magnitude of Large FeK Equivalent Widths in AGN Extended Regions
Abstract
Narrow Fe K fluorescent emission lines arising at kpc-scale separations from the nucleus have only been detected in a few AGN. The detections require that the extended line emission be spatially resolved and sufficiently bright. Compared to narrow Fe K lines arising closer to the nucleus, they have much lower fluxes but show substantially larger equivalent widths, . We show that, in the optically-thin limit, a purely analytical argument naturally predicts large, 1 keV, values for such lines, regardless of the details of equivalent hydrogen column density, , or reprocessor geometry. Monte Carlo simulations corroborate this result and show that the simple analytic prescription holds up to higher approaching the Compton-thick regime. We compare to Chandra observations from the literature and discuss that our results are consistent with the large values reported for local AGN, for which the line is detected in extended, up to kpc-scale, regions. We argue that large from kpc-scale regions in AGN should be ubiquitous, because they do not depend on the absolute luminosity of the central X-ray source, and are measured only against the scattered continuum. We predict values to be of the order of 1 keV or larger, even for covering factors 1, and for arbitrarily small column densities. We propose that the large-scale molecular material that is now routinely being detected with the Atacama Large Millimeter/Submillimeter Array (ALMA) may act as an extended X-ray scattering reprocessor giving rise to kpc-scale Fe K emission.
I Introduction
In the X-ray spectra of galaxies that harbor a nuclear actively accreting, supermassive ( / ) black hole (SMBH), collectively known as Active Galactic Nuclei (AGN), the spatial origin of the fluorescent, narrow (Full Width at Half Maximum, FWHM km s-1) Fe K emission line at a rest energy of 6.4 keV, remains elusive. This line is ubiquitous in both Type 1 and Type 2 Seyfert galaxies and AGN111We use these terms interchangeably in this paper. with 2–10 keV luminosities erg s-1. The line mean FWHM is 2000 km s-1 established from Chandra High Energy Transmission Grating (HETG) spectra [2, 3, 4, 5], although [6] has suggested that the HETG line widths might actually be over-estimated. Although other, ionized Fe emission lines in the X-ray regime are also reported in AGN, all observational evidence strongly suggests that emission peaking at 6.4 keV is the most common Fe fluorescence feature in AGN X-ray spectra. The material in which this line arises must then be neutral and relatively cool [7, and references therein]. Because the line is narrow, it must be associated with distant matter at tens of thousands of gravitational radii from the strong-gravity regime associated with the central black hole. In this paper we are not concerned with broad Fe K line emission, which may also be observed in AGN and is a manifestation of gravitational redshifting and Doppler broadening in the strong-gravity regime. All reference to “Fe K emission” and “the line” will imply the narrow line.
The spatial origin of the narrow line is thus often associated with the putative obscuring, geometrically thick, dusty, molecular “torus” at a few parsecs from the SMBH. Regardless of the specific details of the torus geometry and structure, it remains an essential component of the AGN unification paradigm [8, 9, see [10, 11, 12] for reviews]. The distance from the SMBH and size can be estimated directly from the narrow-line FWHM if the BH mass is known. This allowed [4, 5] to establish that there is variation from object to object, with distances ranging from the Broad Line Region (BLR) to the Narrow Line Region (NLR) Estimates are also based on near- and mid-IR reverberation time lags [e.g. 13, 14, 15, 16, 17], assuming the X-ray torus is essentially the same as the IR torus. Further, although X-ray Fe K reverberation is mostly associated with a broad Fe K line [e.g. 18, 19, 20, 21, 22], narrow-line reverberation results suggest that in a prominent AGN such as NGC 4151 narrow Fe K emission may originate in the inner BLR222This object was formerly also a famous candidate for relativistic Fe K reverberation, but this is no longer the case; see [24]. [24]. In some sense the torus represents a transition region between the optical BLR closer to the nucleus and the optical NLR in the outer circumnuclear galactic environment.
Thus Fe K emission origin in the BLR is also possible [e.g. 25, who report clumpy structures], but also in the region further out from the torus. It is this spatially “extended” Fe K line emission that we are concerned with in this paper, as opposed to the usual pc-scale narrow Fe K emission closer to the nucleus. Molecular, geometrically thick obscuring material in this region beyond the torus is reported e.g. by [26] at 30 pc, while [27] [see also 28, 29] consider whether kpc-scale dust filaments might be sufficient to account for all obscuration. Notably, extended, specifically Fe K emission, has been reported in a few nearby AGN, in which the size scale could be spatially resolved via Chandra CCD-imaging observations. These are usually systems estimated to be “Compton thick,” i.e. with equivalent neutral hydrogen column densities cm-2, where the Thomson optical depth becomes 1. The flux of this extended line is usually much lower than that of the usual line associated with the torus, and as low as just a few percent of the total Fe K emission associated with a given object. In order of increasing distance from the nucleus, such emission is reported to originate up to tens of pc for Circinus [30], hundreds of pc for NGC 4945 [31, 32], 300 pc for Mrk 3 [33]333[66] report a column density in the Compton-thin regime., 1 kpc for ESO 428G014 [35], and 2.2 kpc for NGC 1068 [36, 37]. Further, in NGC 5643 [38] an elongated north-south Fe K emission feature is identified over 65 pc [38]. In the case of NGC 4388, thought to be a “Compton-thin” AGN [39], [40] stack Chandra ACIS-S data from two observations and obtain significant detections of extended Fe K emission out to 0.8 kpc or 10 arcsec, most prominent in three regions, labeled “cones.” They use the disk-reflection continuum model of [41] with a Gaussian emission line to measure values of eV and keV, for the nucleus and the extended region, respectively. In addition, these authors compile a sample of six AGN from the literature with spatially resolved Fe K extended emission and measured equivalent widths, , which provides an extended emission baseline for comparative studies. The measured values all fall in the 1-2 keV range.
These consistently large values provide the motivation for this paper, in which we use an analytical approximation to show that these observed large values are to be expected in extended AGN regions, regardless of the column density of the extended region, even when the material is Compton-thin. We use Monte Carlo (MC) simulations to calculate the extended region values for a wide range of column densities, and intrinsic continuum slopes, and show that the analytical approximation is useful for column densities up to several factors of cm-2, a regime in which line-emitting matter is optically-thin to scattering or absorption at 6.4 keV.
The structure of the paper is as follows: Sec. II introduces the analytical approximation (II.1) and presents the results of MC simulations (II.2). Sec. III compares our results with published results from Chandra observations. We discuss our findings in Sec. IV and conclude with Sec. V which includes an overall summary.
II The Fe K emission line EW in the Optically-Thin Limit
II.1 Analytical Calculation
We detail below how the Fe K emission line equivalent width, , can be obtained analytically in the optically-thin limit. This discussion is based on the very definition of equivalent width, which is given by the line flux normalized by a continuum at the line peak energy. The choice of continuum is usually what the observer measures, which may consist of contributions from more than one physically distinct regions in the source, if it is not spatially resolved. Alternatively, EW values may be calculated with respect to different continuum components obtained from modeling the net spectrum.
II.1.1 Fe K line flux
Following [42], we assume a uniform, spherical distribution for the reprocessing material, with an X-ray point source located at the center, and an incident power-law continuum photons cm-2 s-1. The line flux is proportional to the number of continuum photons above the Fe K edge threshold, keV for Fe i, that are removed, or
| (1) |
where is the covering factor, the fluorescence yield for neutral Fe, the fraction of emission-line photons appearing in the Fe K, and not the Fe K, line, is the K-shell photoelectric absorption cross-section, and is the Fe abundance relative to hydrogen.
We set . We use and cm-2 from fits to Verner tables [see also 43].
It is important to note that in Equation II.1.1 line photons, once created, do not further interact with the reprocessing matter either by absorption or scattering. In other words, the reprocessor is optically-thin () to scattering and absorption at 6.4 keV. To linearly expand the exponential, we also impose optically thin conditions for the material to Fe-K absorption just above the Fe K edge, and thus also to all higher energies, since absorption opacity decreases with energy. In short, the optically-thin condition, both to scattering and absorption, leads to photons interacting with the material at most once for all energies higher than 6.4 keV.
By expanding the exponential, we then obtain the approximate relation
| (2) |
II.1.2 Fe K line-normalizing continuum
In general, there are two main components to the continuum emission: The direct, unscattered continuum, consisting of source photons that are neither scattered nor absorbed; and the scattered continuum. However, studies that report extended Fe K emission exclude by design emission from the AGN nucleus, and there is no other direct hard X-ray emission from the extended region. Only the scattered continuum is then of relevance for our purposes. The normalizing continuum, due to photons scattered into the line-of-sight by material with a Thomson depth , is thus given by
| (3) | |||||
where keV, the weighted average energy of the centroids of the Fe K and K emission lines. is the number of electrons per hydrogen atom. The energy is low enough that the scattering cross-section is essentially the Thomson one, , and the medium is optically thin to scattering (). As in the previous section, the optically-thin limit implies that after the first scattering a continuum photon never interacts with the medium again, i.e. the photon escape probability is essentially unity because the medium is optically thin to scattering and absorption at 6.4 keV.
It is worth pointing out that, since at lower energies the absorption opacity increases substantially, at some critical energy below 6.4 keV for a given , the medium will no longer be in the optically-thin limit, and one would see absorption imprints on the scattered continuum. However, this does not affect our calculations and results, which do not involve these lower energies. Observationally, the scattered continuum may indeed show absorption signatures at low energies, and these could potentially be utilized to constrain modeling, provided the features are not too weak or swamped by other spectral features in the soft X-ray band.
II.1.3 Fe K EW
We finally obtain an expression for the EW of the Fe K line by dividing Equation II.1.1 by Equation 3:
| (4) | |||
| (5) |
We have assumed standard values for normalizing the constants in this expression [see 42]. In addition, if the hydrogen and helium abundances are and , respectively, the number of electrons per hydrogen atom is given by for the [44] abundances. While we do not assume a particular iron abundance, the value in the equation is the [44] value for solar Fe abundance.
This result, following directly from the imposed optically-thin limit, has a remarkable implication: The EW is independent of the covering factor and column density, with the implication that the EW is also independent of the detailed geometry, even though a spherical geometry was initially assumed.
II.2 Monte Carlo Simulations
We now investigate the same question, namely the magnitude of for pure reflection as a function of , by adopting a numerical approach. We show that results from Monte Carlo (MC) simulations of AGN X-ray reprocessing are entirely consistent with the above analytic approximation, but in addition extend the analytic result closer to the Compton-thick regime.
Specifically, we probe the parameter space defined by , , intrinsic power law continuum index, , and the cosine of the angle between the torus symmetry axis and the observer, . To this end, we use the MC results of ray-tracing simulations that were performed to construct the model tables now incorporated in the mytorus model for X-ray spectral fitting. Since we are interested in pure reflection, the direct continuum is irrelevant for this analysis.

We make use of the original MC simulations for the mytorus model, which are described in detail in [43] [see also 45]. Briefly, these are simulations of Green’s functions, covering values across the Thomson-thin to Compton-thick regime, for incident photon energies up to 500 keV, and solar Fe abundance. The reprocessed (“reflected”) continuum and its associated Fe K/ and Ni K emission are generated self-consistently with no ad hoc components. Using the simulation output grid, we calculate , i.e. the equivalent width for the 0th order Fe K fluorescent line (or more precisely the weighted centroid of Fe K1 and Fe K2) relative to the Compton scattered continuum as a function of:
-
1.
the cosines of the centers of 10 angle bins, , corresponding to line-of-sight angles from (bin 1) to (bin 10);
-
2.
13 values of the intrinsic incident power-law index from to 2.6;
-
3.
28 values of equatorial equivalent hydrogen column density from to cm-2).
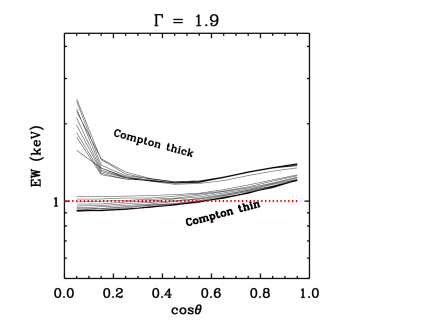
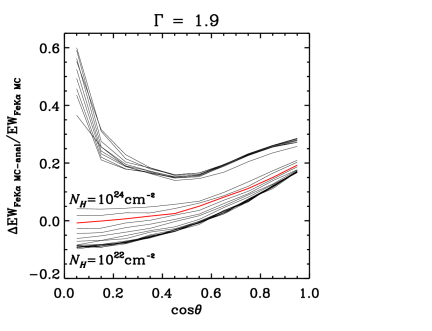
We show the simulation-based dependence of on for and all angle bins in Figure 1. In a given angle bin, there appears to be no dependence on up to cm-2. This can also be seen in Figure 2, which plots against . Here, there are two distinct groups of curves: The lower group corresponds to values from (lowest curve) to cm-2 (topmost curve). The upper group of curves corresponds to values in the Compton-thick regime, from to cm-2. In both Figures, the analytical result of the previous Section is overplotted as a dotted red line, and clearly agrees best with the MC result for bin 5 (, ).
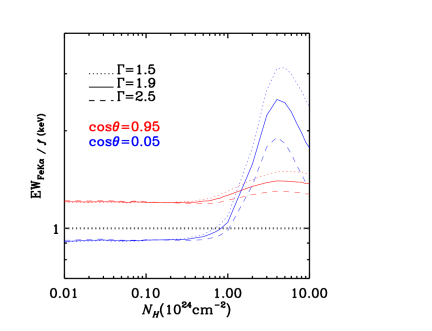
It can be seen in Figure 1 that there are two extreme cases for and , effectively defining an “envelope” in (and ). In Figure 3 we show the dependence of on for three characteristic values covering a plausible range between and . Here, is normalized by the factor (see Equation II.1.3), thus removing the explicit dependence on . Note that for (and given that ).
III Comparison with Chandra Observations
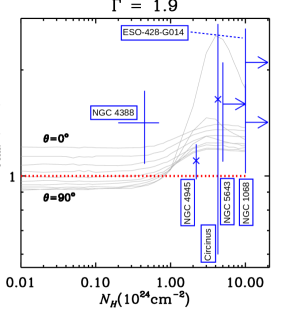
Figure 4 is a modified version of Figure 1, with the Chandra-based compilation of results for detected extended Fe K emission presented in [40, Table 4] overplotted. As explained by these authors, the reported results for Circinus cover a range of earlier results in . For clarity, we show here the full range in for this object, taking into account uncertainties. The average central value is shown with a cross. For the remaining systems, we show single central values with uncertainties from the references reported in [40]. Observationally estimated values compiled by [40] do not have uncertainties. For NGC 4388 the horizontal “error bar” represents the range of reported central values. Three other AGN have lower limits in as indicated by the arrows.
Focusing on values shown in Figure 4, we note that all reported values are within a factor of 2 of the analytic approximation of 1 keV. In the case of Compton-thin NGC 4388 in particular, which is most consistent with the assumptions of the analytic approximation, is also close to the analytic value within the reported errors. Finally, all values are consistent with the MC values within the reported uncertainties and ranges.
IV Results and Discussion
A key result from this work is that the optically-thin analytic approximation for is surprisingly close to the MC results for column densities that go well beyond the optically-thin regime, up to cm-2. In this regime, is only weakly dependent on . We discuss these results further below.
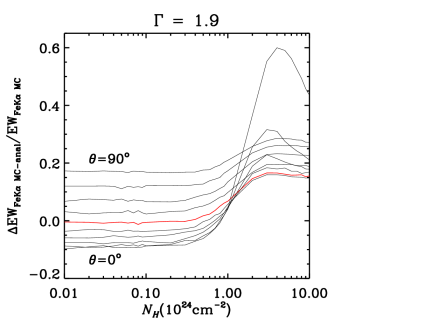
Figures 1 and 2 show that the estimated analytically is within 20% for all MC estimates, regardless of bin, and up to cm-2. This is highlighted in the fractional difference versions of the figures, i.e. Figures 5 and 6. For the agreement is within 1%, and even at 1024 cm-2 it is within 5% (red curve in Figure 5). The optically-thin analytic approximation for was derived assuming a spherical geometry, which necessarily has material intercepting the line of sight, and it aligns most closely with the MC angular bin that has the smallest non-zero column density. This is the grazing-incidence angle bin, which has its bin boundary at , corresponding to . The analytic approximation does not agree as well with MC results for other angle bins, in particular those not intercepting any material, even for small column densities, because it assumes non-zero columns of material in the line of sight. Even so, an agreement within 20% for all bins is a significant result.
Further, Figure 3 shows that curves of as a function of diverge for different values above cm-2, implying that the dependence of in the analytic approximation fails to capture the physics above this column density. Thus, the analytic approximation breaks down above cm-2, and this column density represents the approximate upper limit of applicability of the analytic approximation. This column density corresponds to a Thomson depth of 0.32.
One might ask whether the toroidal geometry which is assumed in the mytorus simulations might reduce the generality of these results. In the optically-thin regime, the agreement with the analytical approximation, which does not assume such a geometry, is one indication that this should not be an issue. In the Compton-thick regime, we note the independent MC results of [46], who assume a uniform spherical geometry, obtaining 1 keV that increases with optical depth / column density. Even though these authors do not exclude the direct continuum in their calculations as we do, excluding the direct continuum would only further enhance the large effect, as we oberve. Finally, even if the toroidal geometry were to have some effect, we still see that regardless of angle , remains 1 keV for all probed. This strongly suggests that the dominant effect is the exclusion of the direct continuum.
In the case of a clumpy geometry, each clump will produce a large as, once more, this would be measured relative to the scattered continuum only. The ensemble of clumps would then give rise to an overall large . In the limit of a high-filling factor, the results would be as for a sphere, discussed above [see 46], and in the optically thin limit the analytic approximation would once again hold.
Overall, given the simple assumptions underlying the analytic approximation, and the fact that one might expect it to fail significantly above 1022 cm-2, this is a significant result, that provides a simple explanation for large equivalent widths of Fe K emission lines in extended AGN regions.
[40] note that values are 3 times larger in the extended region compared to those for regions closer to the nucleus. They attribute this to differences in geometry or Fe abundance between the circumnuclear and the extended region. However, it should be pointed out that a major issue with such an explanation is that increasing the Fe abundance does not linearly increase because more Fe also means more absorption (including of line photons), and not just K- but also L-shell absorption. To increase by a factor of 3, you need at least an order of magnitude increase in Fe abundance [see 47, Fig. 17], by which point the continuum will have become completely skewed and wrong. Further, as also explained by [40, see also references therein], an increase in iron abundance would mainly be introduced via delayed SN Ia enrichment over timescales of 1 Gyr, but this would be unlikely to remain preferentially in the extended circumnuclear region over such prolonged periods of time. Differences in geometry would imply that somehow more X-ray reprocessing material would be located at larger scales compared to those usually attributed to torus-like structures, which are thought to be up to few pc based on virial assumptions for the Fe K line width, IR reverberation mapping, and ALMA sub-mm imaging [e.g. 4, 48, 49, 50, 51]. [40] further consider the possibility of an intrinsically depressed AGN continuum which would naturally favor larger EW measurements. This however should also affect the EW measured for Fe K emission originating closer to the central AGN.
Instead, qualitatively in the extended region would naturally be expected to be larger than that for the more common narrow Fe K line arising closer to the nucleus, simply because the extended-emission line equivalent width is measured only with respect to the scattered continuum, which is not the case for the more common line. This is a key point, and to our knowledge, no previous work on has appropriately taken this into account. In this paper we are highlighting and quantifying this effect both analytically and computationally. Both approaches corroborate the qualitative expectation, and are also in agreement with each other.
Both of the analytical expressions for the line flux (Equations II.1.1 and II.1.1), as well as the one for the normalizing scattered continuum (Equation 3), assume that the reprocessing matter is optically thin to both absorption and scattering. Line photons effectively do not interact with this matter after being created; similarly, continuum photons never interact with the medium after the first scattering (either by absorption or further scattering). Put differentely, in both cases, we are setting the photon escape probability function to unity, which is justified in this regime. In general, the expression (Equation II.1.3) should include such an escape function both in the numerator and the denominator. These functions will be different in general, but when the medium is optically thin, one can reasonably assume that the spatial distribution of line creation sites and that of scattering sites are the same because both are distributed uniformly in the medium. However, as the optical depth increases, these distributions will not remain the same, and the two escape functions become different. What we have effectively done is to use the MC results as a computational experiment to probe the evolution of these escape functions. As we have shown, the reasonable, qualitative assumption that the spatial distributions of the line creation and continuum scattering sites are similar holds up to column densities cm-2. Therefore, they cancel out in the analytical expression, thus making independent of .
As to the actual nature of the extended emission material, we note that cold, molecular material due to outflows in AGN at larger, tens to hundreds of pc, scales has also been detected in the sub-mm [52, 53, 54, 55, 56]. Recently, detections of molecular tori with extended diameter sizes up to 50 pc are reported [57, 58] extending the obscuring torus itself beyond the pc-scale paradigm. The proposed combined emerging molecular and IR picture includes both outflows and feeding inflows from resonant molecular reservoirs at 100 pc [59, 60, 61, 62, 63, 57, 51] or more. Overall, such molecular material would also be a candidate for an extended X-ray reprocessor.
It is clear that even AGN with moderate levels of obscuration, such as NGC 4388 and Mrk 3, do show extended Fe K emission over spatial scales of at least hundreds of parsecs, with associated keV-scale EWs. Our MC results have shown that a large would be naturally expected for all . Since NGC 4388 is Compton-thin, its large should also be better predicted by the analytic approximation (which, however, is based on the stricter optically-thin condition) and the analytical result of 1 keV for is in good agreement with the lower limit of the value reported by the Chandra analysis, i.e. 1.085 keV. The analytical result is also entirely consistent with values of 0.71 keV reported as due to molecular clouds around Sgr A∗ scattering X-ray emission from nuclear flares [64], although these clouds are thought to be located tens rather than hundreds of parsecs away from the nucleus.
Thus, overall, both the MC results and the analytical approximation suggest that large signatures should be ubiquitous at kpc-scale distances from AGN, and the few available observational results are in support of this picture.
V Summary and Conclusions
We have shown that the narrow Fe K emission equivalent width observed at kpc scales in AGN can be predicted both analytically and numerically, and have compared these predictions to observed results from the literature. Our main conclusions are:
-
1.
Calculations of in the optically-thin limit, coupled with the absence of the direct X-ray AGN continuum from the extended region, lead to an analytic approximate estimate 1 keV that is independent of or geometric details such as covering factor.
-
2.
Using state-of-the-art MC ray-tracing simulations with mytorus, we show that :
-
(a)
is independent of up to 4 cm-2;
-
(b)
is mildly dependent on the angle to the line-of-sight, , and the power law index, ;
-
(c)
is within 20% (1%) of for all (for ) up to 4 cm-2;
-
(d)
is consistently keV as the increases into the Compton-thick regime, suggesting that large values are to be expected for all .
-
(a)
-
3.
We argue that these results should remain unaffected by toroidal, spherical, or clumpy geometries. However, the results do not carry over to the absolute flux of the Fe K line (as opposed to the EW): [65] showed that for line flux, the optically-thin approximation breaks down at a column density of only .
-
4.
Both and are within a factor of 2 from observational estimates for at kpc scales in local AGN.
The and good agreement up to cm-2 directly demonstrates and quantifies a reasonable expectation in the optically-thin regime. Beyond this, the MC results show that will remain larger than 1 keV into the Compton-thick regime, a prediction that should be tested further with more observational data. This agreement, as well as the order-of-magnitude agreement with observational results, suggest that the relative prevalence of narrow Fe K AGN emission at kpc scales beyond the “canonical” torus follows a roughly predictable pattern across AGN and at least two orders of magnitude in . Larger AGN samples with such detections, as well as multiwavelength detections in the IR and sub-mm, would provide further insight into the nature and frequency of large-scale X-ray AGN reflection. It also remains to be explored whether similar behavior can be established at the smaller spatial scales of Galactic X-ray binaries.
Acknowledgements.
We thank the anonymous referee for their constructive comments that helped improve this paper. P.T. acknowledges support from NASA grants 80NSSC18K0408 (solicitation NNH17ZDA001N-ADAP) and 80NSSC22K0411 (solicitation NNH21ZDA001N-ADAP). This work is supported by NASA under the CRESST Cooperative Agreement, award number 80GSFC21M0002.References
- Note [1] We use these terms interchangeably in this paper.
- Yaqoob and Padmanabhan [2004] T. Yaqoob and U. Padmanabhan, ApJ 604, 63 (2004), astro-ph/0311551 .
- Nandra [2006] K. Nandra, MNRAS 368, L62 (2006), astro-ph/0602081 .
- Shu et al. [2010] X. W. Shu, T. Yaqoob, and J. X. Wang, ApJS 187, 581 (2010), arXiv:1003.1790 [astro-ph.HE] .
- Shu et al. [2011] X. W. Shu, T. Yaqoob, and J. X. Wang, ApJ 738, 147 (2011), arXiv:1107.0195 .
- Liu [2016] J. Liu, MNRAS 463, L108 (2016), arXiv:1608.07351 [astro-ph.HE] .
- Ghisellini et al. [1994] G. Ghisellini, F. Haardt, and G. Matt, MNRAS 267, 743 (1994), arXiv:astro-ph/9401044 [astro-ph] .
- Antonucci [1993] R. Antonucci, ARA&A 31, 473 (1993).
- Urry and Padovani [1995] C. M. Urry and P. Padovani, PASP 107, 803 (1995), astro-ph/9506063 .
- Netzer [2015] H. Netzer, ARA&A 53, 365 (2015), arXiv:1505.00811 .
- Hickox and Alexander [2018] R. C. Hickox and D. M. Alexander, ARA&A 56, 625 (2018), arXiv:1806.04680 [astro-ph.GA] .
- Padovani et al. [2017] P. Padovani, D. M. Alexander, R. J. Assef, B. De Marco, P. Giommi, R. C. Hickox, G. T. Richards, V. Smolčić, E. Hatziminaoglou, V. Mainieri, and M. Salvato, A&A Rv 25, 2 (2017), arXiv:1707.07134 [astro-ph.GA] .
- Burtscher et al. [2013] L. Burtscher, K. Meisenheimer, K. R. W. Tristram, W. Jaffe, S. F. Hönig, R. I. Davies, M. Kishimoto, J. U. Pott, H. Röttgering, M. Schartmann, G. Weigelt, and S. Wolf, A&A 558, A149 (2013), arXiv:1307.2068 [astro-ph.CO] .
- Pozo Nuñez et al. [2015] F. Pozo Nuñez, M. Ramolla, C. Westhues, M. Haas, R. Chini, K. Steenbrugge, A. Barr Domínguez, L. Kaderhandt, M. Hackstein, W. Kollatschny, M. Zetzl, K. W. Hodapp, and M. Murphy, A&A 576, A73 (2015), arXiv:1502.06771 [astro-ph.GA] .
- Almeyda et al. [2020] T. Almeyda, A. Robinson, M. Richmond, R. Nikutta, and B. McDonough, ApJ 891, 26 (2020), arXiv:2002.12823 [astro-ph.GA] .
- Sobrino Figaredo et al. [2020] C. Sobrino Figaredo, M. Haas, M. Ramolla, R. Chini, J. Blex, K. W. Hodapp, M. Murphy, W. Kollatschny, D. Chelouche, and S. Kaspi, AJ 159, 259 (2020), arXiv:2004.10244 [astro-ph.GA] .
- Lyu and Rieke [2021] J. Lyu and G. H. Rieke, ApJ 912, 126 (2021), arXiv:2011.07638 [astro-ph.GA] .
- Fabian et al. [2009] A. C. Fabian, A. Zoghbi, R. R. Ross, P. Uttley, L. C. Gallo, W. N. Brandt, A. J. Blustin, T. Boller, M. D. Caballero-Garcia, J. Larsson, J. M. Miller, G. Miniutti, G. Ponti, R. C. Reis, C. S. Reynolds, Y. Tanaka, and A. J. Young, Nature 459, 540 (2009).
- Zoghbi et al. [2010] A. Zoghbi, A. C. Fabian, P. Uttley, G. Miniutti, L. C. Gallo, C. S. Reynolds, J. M. Miller, and G. Ponti, MNRAS 401, 2419 (2010), arXiv:0910.0367 [astro-ph.HE] .
- Zoghbi et al. [2013] A. Zoghbi, C. Reynolds, E. M. Cackett, G. Miniutti, E. Kara, and A. C. Fabian, ApJ 767, 121 (2013), arXiv:1302.1761 [astro-ph.HE] .
- Kara et al. [2016] E. Kara, W. N. Alston, A. C. Fabian, E. M. Cackett, P. Uttley, C. S. Reynolds, and A. Zoghbi, MNRAS 462, 511 (2016), arXiv:1605.02631 [astro-ph.HE] .
- Cackett et al. [2021] E. M. Cackett, M. C. Bentz, and E. Kara, iScience 24, 102557 (2021), arXiv:2105.06926 [astro-ph.GA] .
- Note [2] This object was formerly also a famous candidate for relativistic Fe K reverberation, but this is no longer the case; see [24].
- Zoghbi et al. [2019] A. Zoghbi, J. M. Miller, and E. Cackett, ApJ 884, 26 (2019), arXiv:1908.09862 [astro-ph.HE] .
- Wang et al. [2017] J.-M. Wang, P. Du, M. S. Brotherton, C. Hu, Y.-Y. Songsheng, Y.-R. Li, Y. Shi, and Z.-X. Zhang, Nature Astronomy 1, 775 (2017), arXiv:1710.03419 [astro-ph.GA] .
- Hicks et al. [2009] E. K. S. Hicks, R. I. Davies, M. A. Malkan, R. Genzel, L. J. Tacconi, F. Müller Sánchez, and A. Sternberg, ApJ 696, 448 (2009), arXiv:0902.0978 [astro-ph.GA] .
- Prieto et al. [2014] M. A. Prieto, M. Mezcua, J. A. Fernández-Ontiveros, and M. Schartmann, MNRAS 442, 2145 (2014), arXiv:1405.5653 [astro-ph.GA] .
- Goulding and Alexander [2009] A. D. Goulding and D. M. Alexander, MNRAS 398, 1165 (2009), arXiv:0906.0772 [astro-ph.CO] .
- Goulding et al. [2012] A. D. Goulding, D. M. Alexander, F. E. Bauer, W. R. Forman, R. C. Hickox, C. Jones, J. R. Mullaney, and M. Trichas, ApJ 755, 5 (2012), arXiv:1205.1800 [astro-ph.GA] .
- Marinucci et al. [2013] A. Marinucci, G. Miniutti, S. Bianchi, G. Matt, and G. Risaliti, MNRAS 436, 2500 (2013), arXiv:1309.4456 [astro-ph.CO] .
- Marinucci et al. [2012] A. Marinucci, G. Risaliti, J. Wang, E. Nardini, M. Elvis, G. Fabbiano, S. Bianchi, and G. Matt, MNRAS 423, L6 (2012), arXiv:1202.1279 [astro-ph.CO] .
- Marinucci et al. [2017] A. Marinucci, S. Bianchi, G. Fabbiano, G. Matt, G. Risaliti, E. Nardini, and J. Wang, MNRAS 470, 4039 (2017), arXiv:1706.06362 [astro-ph.HE] .
- Guainazzi et al. [2012] M. Guainazzi, V. La Parola, G. Miniutti, A. Segreto, and A. L. Longinotti, A&A 547, A31 (2012), arXiv:1209.0706 [astro-ph.CO] .
- Note [3] [66] report a column density in the Compton-thin regime.
- Fabbiano et al. [2017] G. Fabbiano, M. Elvis, A. Paggi, M. Karovska, W. P. Maksym, J. Raymond, G. Risaliti, and J. Wang, ApJL 842, L4 (2017), arXiv:1705.10680 [astro-ph.HE] .
- Young et al. [2001] A. J. Young, A. S. Wilson, and P. L. Shopbell, ApJ 556, 6 (2001), arXiv:astro-ph/0104027 [astro-ph] .
- Bauer et al. [2015] F. E. Bauer, P. Arévalo, D. J. Walton, M. J. Koss, S. Puccetti, P. Gandhi, D. Stern, D. M. Alexander, M. Baloković, S. E. Boggs, W. N. Brandt, M. Brightman, F. E. Christensen, A. Comastri, W. W. Craig, A. Del Moro, C. J. Hailey, F. A. Harrison, R. Hickox, B. Luo, C. B. Markwardt, A. Marinucci, G. Matt, J. R. Rigby, E. Rivers, C. Saez, E. Treister, C. M. Urry, and W. W. Zhang, ApJ 812, 116 (2015), arXiv:1411.0670 [astro-ph.HE] .
- Fabbiano et al. [2018] G. Fabbiano, A. Paggi, A. Siemiginowska, and M. Elvis, ApJL 869, L36 (2018), arXiv:1812.02764 [astro-ph.HE] .
- Yaqoob et al. [2023] T. Yaqoob, P. Tzanavaris, and S. LaMassa, MNRAS 522, 394 (2023).
- Yi et al. [2021] H. Yi, J. Wang, X. Shu, G. Fabbiano, C. Pappalardo, C. Wang, and H. Yu, ApJ 908, 156 (2021), arXiv:2012.04900 [astro-ph.GA] .
- Magdziarz and Zdziarski [1995] P. Magdziarz and A. A. Zdziarski, MNRAS 273, 837 (1995).
- Yaqoob et al. [2001] T. Yaqoob, I. M. George, K. Nandra, T. J. Turner, P. J. Serlemitsos, and R. F. Mushotzky, ApJ 546, 759 (2001), astro-ph/0008471 .
- Murphy and Yaqoob [2009] K. D. Murphy and T. Yaqoob, MNRAS 397, 1549 (2009), arXiv:0905.3188 [astro-ph.HE] .
- Anders and Grevesse [1989] E. Anders and N. Grevesse, GeCoA 53, 197 (1989).
- Yaqoob [2012] T. Yaqoob, MNRAS 423, 3360 (2012), arXiv:1204.4196 [astro-ph.HE] .
- Leahy and Creighton [1993] D. A. Leahy and J. Creighton, MNRAS 263, 314 (1993).
- George and Fabian [1991] I. M. George and A. C. Fabian, MNRAS 249, 352 (1991).
- Gandhi et al. [2015] P. Gandhi, S. F. Hönig, and M. Kishimoto, ApJ 812, 113 (2015), arXiv:1502.02661 [astro-ph.HE] .
- García-Burillo et al. [2016] S. García-Burillo, F. Combes, C. Ramos Almeida, A. Usero, M. Krips, A. Alonso-Herrero, S. Aalto, V. Casasola, L. K. Hunt, S. Martín, S. Viti, L. Colina, F. Costagliola, A. Eckart, A. Fuente, C. Henkel, I. Márquez, R. Neri, E. Schinnerer, L. J. Tacconi, and P. P. van der Werf, ApJL 823, L12 (2016), arXiv:1604.00205 [astro-ph.GA] .
- García-Burillo et al. [2019] S. García-Burillo, F. Combes, C. Ramos Almeida, A. Usero, A. Alonso-Herrero, L. K. Hunt, D. Rouan, S. Aalto, M. Querejeta, S. Viti, P. P. van der Werf, H. Vives-Arias, A. Fuente, L. Colina, J. Martín-Pintado, C. Henkel, S. Martín, M. Krips, D. Gratadour, R. Neri, and L. J. Tacconi, A&A 632, A61 (2019), arXiv:1909.00675 [astro-ph.GA] .
- Hönig [2019] S. F. Hönig, ApJ 884, 171 (2019), arXiv:1909.08639 [astro-ph.GA] .
- Curran et al. [2008] S. J. Curran, B. S. Koribalski, and I. Bains, MNRAS 389, 63 (2008), arXiv:0807.4766 [astro-ph] .
- Zschaechner et al. [2016] L. K. Zschaechner, F. Walter, A. Bolatto, E. P. Farina, J. M. D. Kruijssen, A. Leroy, D. S. Meier, J. Ott, and S. Veilleux, ApJ 832, 142 (2016), arXiv:1609.06316 [astro-ph.GA] .
- Gallimore et al. [2016] J. F. Gallimore, M. Elitzur, R. Maiolino, A. Marconi, C. P. O’Dea, D. Lutz, S. A. Baum, R. Nikutta, C. M. V. Impellizzeri, R. Davies, A. E. Kimball, and E. Sani, ApJL 829, L7 (2016), arXiv:1608.02210 [astro-ph.GA] .
- Alatalo et al. [2011] K. Alatalo, L. Blitz, L. M. Young, T. A. Davis, M. Bureau, L. A. Lopez, M. Cappellari, N. Scott, K. L. Shapiro, A. F. Crocker, S. Martín, M. Bois, F. Bournaud, R. L. Davies, P. T. de Zeeuw, P. A. Duc, E. Emsellem, J. Falcón-Barroso, S. Khochfar, D. Krajnović, H. Kuntschner, P. Y. Lablanche, R. M. McDermid, R. Morganti, T. Naab, T. Oosterloo, M. Sarzi, P. Serra, and A. Weijmans, ApJ 735, 88 (2011), arXiv:1104.2326 [astro-ph.CO] .
- Bolatto et al. [2021] A. D. Bolatto, A. K. Leroy, R. C. Levy, D. S. Meier, E. A. C. Mills, T. A. Thompson, K. L. Emig, S. Veilleux, J. Ott, M. Gorski, F. Walter, L. A. Lopez, and L. Lenkić, ApJ 923, 83 (2021), arXiv:2109.10437 [astro-ph.GA] .
- Combes et al. [2019] F. Combes, S. García-Burillo, A. Audibert, L. Hunt, A. Eckart, S. Aalto, V. Casasola, F. Boone, M. Krips, S. Viti, K. Sakamoto, S. Muller, K. Dasyra, P. van der Werf, and S. Martin, A&A 623, A79 (2019), arXiv:1811.00984 [astro-ph.GA] .
- García-Burillo et al. [2021] S. García-Burillo, A. Alonso-Herrero, C. Ramos Almeida, O. González-Martín, F. Combes, A. Usero, S. Hönig, M. Querejeta, E. K. S. Hicks, L. K. Hunt, D. Rosario, R. Davies, P. G. Boorman, A. J. Bunker, L. Burtscher, L. Colina, T. Díaz-Santos, P. Gandhi, I. García-Bernete, B. García-Lorenzo, K. Ichikawa, M. Imanishi, T. Izumi, A. Labiano, N. A. Levenson, E. López-Rodríguez, C. Packham, M. Pereira-Santaella, C. Ricci, D. Rigopoulou, D. Rouan, T. Shimizu, M. Stalevski, K. Wada, and D. Williamson, A&A 652, A98 (2021), arXiv:2104.10227 [astro-ph.GA] .
- Ramos Almeida and Ricci [2017] C. Ramos Almeida and C. Ricci, Nature Astronomy 1, 679 (2017), arXiv:1709.00019 [astro-ph.GA] .
- Alonso-Herrero et al. [2018] A. Alonso-Herrero, M. Pereira-Santaella, S. García-Burillo, R. I. Davies, F. Combes, D. Asmus, A. Bunker, T. Díaz-Santos, P. Gandhi, O. González-Martín, A. Hernán-Caballero, E. Hicks, S. Hönig, A. Labiano, N. A. Levenson, C. Packham, C. Ramos Almeida, C. Ricci, D. Rigopoulou, D. Rosario, E. Sani, and M. J. Ward, ApJ 859, 144 (2018), arXiv:1804.04842 [astro-ph.GA] .
- Izumi et al. [2018] T. Izumi, K. Wada, R. Fukushige, S. Hamamura, and K. Kohno, ApJ 867, 48 (2018), arXiv:1809.09154 [astro-ph.GA] .
- Alonso-Herrero et al. [2019] A. Alonso-Herrero, S. García-Burillo, M. Pereira-Santaella, R. I. Davies, F. Combes, M. Vestergaard, S. I. Raimundo, A. Bunker, T. Díaz-Santos, P. Gandhi, I. García-Bernete, E. K. S. Hicks, S. F. Hönig, L. K. Hunt, M. Imanishi, T. Izumi, N. A. Levenson, W. Maciejewski, C. Packham, C. Ramos Almeida, C. Ricci, D. Rigopoulou, P. F. Roche, D. Rosario, M. Schartmann, A. Usero, and M. J. Ward, A&A 628, A65 (2019), arXiv:1906.06889 [astro-ph.GA] .
- Alonso-Herrero et al. [2021] A. Alonso-Herrero, S. García-Burillo, S. F. Hönig, I. García-Bernete, C. Ramos Almeida, O. González-Martín, E. López-Rodríguez, P. G. Boorman, A. J. Bunker, L. Burtscher, F. Combes, R. Davies, T. Díaz-Santos, P. Gandhi, B. García-Lorenzo, E. K. S. Hicks, L. K. Hunt, K. Ichikawa, M. Imanishi, T. Izumi, A. Labiano, N. A. Levenson, C. Packham, M. Pereira-Santaella, C. Ricci, D. Rigopoulou, P. Roche, D. J. Rosario, D. Rouan, T. Shimizu, M. Stalevski, K. Wada, and D. Williamson, A&A 652, A99 (2021), arXiv:2107.00244 [astro-ph.GA] .
- Ponti et al. [2010] G. Ponti, R. Terrier, A. Goldwurm, G. Belanger, and G. Trap, ApJ 714, 732 (2010), arXiv:1003.2001 [astro-ph.HE] .
- Yaqoob et al. [2010] T. Yaqoob, K. D. Murphy, L. Miller, and T. J. Turner, MNRAS 401, 411 (2010), arXiv:0909.0899 [astro-ph.HE] .
- Guainazzi et al. [2016] M. Guainazzi, G. Risaliti, H. Awaki, P. Arevalo, F. E. Bauer, S. Bianchi, S. E. Boggs, W. N. Brandt, M. Brightman, F. E. Christensen, W. W. Craig, K. Forster, C. J. Hailey, F. Harrison, M. Koss, A. Longinotti, C. Markwardt, A. Marinucci, G. Matt, C. S. Reynolds, C. Ricci, D. Stern, J. Svoboda, D. Walton, and W. Zhang, MNRAS 460, 1954 (2016), arXiv:1605.02467 [astro-ph.HE] .