Crypto Wash Trading: Direct vs. Indirect Estimation
Abstract
Recent studies using indirect statistical methods estimate that around 70% of traded value on centralized crypto exchanges like Binance, can be characterized as wash trading. This paper turns to NFT markets, where transaction transparency, including analysis of roundtrip trades and common wallet activities, allows for more accurate direct estimation methods to be applied. We find roughly 30% of NFT volume and between 45-95% of traded value, involve wash trading. More importantly, our approach enables a critical evaluation of common indirect estimation methods used in the literature. We find major differences in their effectiveness; some failing entirely. Roundedness filters, like those used in Cong et al. (2023), emerge as the most accurate. In fact, the two approaches can be closely aligned via hyper-parameter optimization if direct data is available.
Keywords: Cryptocurrency, Financial Fraud, Non-Fungible Tokens (NFTs), Wash Trading
1 Introduction
In stock and commodity markets, wash trading has been deemed illegal since 1936. This malpractice involves either a single actor, or a coalition of actors engaging in self-directed trades to artificially manipulate market activity, aiming to exploit these distortions for profit. The SEC rigorously polices such activities in conventional financial markets; however, cryptocurrencies remain less stringently regulated. Crypto traders can manipulate the appearance of market demand by easily creating and trading between multiple anonymous accounts. Accordingly, this subject is of considerable interest and debate to both practicioners and academics (Cong et al. 2023, Decrypt 2023, Bonifazi et al. 2023, Morgia et al. 2023, von Wachter et al. 2022).
Addressing wash trading in cryptocurrencies is complex: Approximately 83.3% of crypto trades occur on private, centralized exchanges like Binance, which often conduct off-chain transactions, limiting transparency (Shimron 2022). These exchanges usually provide only basic details such as trade pair and size, without revealing trader identities, making wash trading detection challenging. Additionally, there might be little incentive for these exchanges to combat wash trading, as the resulting inflated trading volumes can be advantageous. To tackle this challenge, current research utilizes sophisticated, yet indirect, statistical methods for pattern recognition. Studies like (Cong et al. 2023) estimate that up to 70% of the traded value on some exchanges could be attributed to wash trading—an alarming finding. However, without access to direct wash trading data, the accuracy of such indirect approaches remains open for debate.
Research Questions
This paper seeks to bridge this gap by focusing on a specific segment of crypto markets: Non-Fungible Tokens (NFTs). These tokens are unique for their on-chain trading nature and inherent transaction transparency. NFTs are usually traded on decentralized exchanges, where every transaction is recorded on a public ledger, revealing comprehensive details including the identities (wallet addresses) of buyers and sellers. Such transparency facilitates a more direct analysis of trading patterns, better enabling the identification of practices like wash trading. Consequently, NFTs provide a distinct advantage in data transparency and pattern identification compared to traditional centralized exchanges. In particular, NFT data can help answer several interrelated questions:
First, can we leverage increased NFT transparency to establish a more direct estimation method for wash trading levels? Relatedly, what effect does wash trading have on crypto prices and trader profits? Second, and perhaps more crucially, how do more direct estimation methods compare to indirect statistical approaches used in studies like Cong et al. (2023)? Do the two methodologies align, and if discrepancies exist, is there a way to harmonize them?
Data
We concentrated our data collection on two of the top NFT marketplaces: LooksRare and Blur. From these platforms, we amassed a comprehensive dataset encompassing all recorded transactions. Each transaction in our dataset is represented by a single row, detailing critical information such as the transaction hash, block number, NFT seller and buyer, the NFT collection, tokenId, price, and date of the transaction. This rich dataset offers an insightful view into the NFT trading landscape, encapsulating a diverse range of transactions across numerous collections. The depth of this data, covering thousands of NFT collections and a vast number of transactions with significant total value in ETH for both platforms, provides a fertile ground for our analysis of wash trading practices, enabling us to observe and decipher patterns and anomalies indicative of such activities. The details are discussed in §3.
Direct Estimation
Using this dataset, we apply four distinct filters to “directly” estimate wash trading in NFT markets. Filter 1 targets the simplest form of wash trading by flagging transactions where the buyer and seller are using the same wallet address, effectively identifying cases where an individual is blatantly selling an NFT to themselves. Filter 2 steps up in complexity by detecting back-and-forth trades, activated when buyer and seller identities are inverted for the same NFT in sequential transactions, pointing to a scenario where a trader uses two accounts to repeatedly trade the same NFT. Filter 3 goes further by flagging instances where the same buyer acquires the same NFT three or more times, targeting wash traders cycling an NFT through multiple accounts, with the Filter triggering when the NFT completes at least three such cycles. Finally, Filter 4 identifies cases with common upstream buyer and seller wallet addresses, indicative of a single entity controlling both sides of a transaction, such as when the same wallet funds both the initial and subsequent purchases of an NFT. These filters yield a conservative, yet likely precise, estimate of wash trading. While one could theoretically devise more complex obfuscation strategies to evade these filters, higher complexity implies higher implementation costs, which would naturally restrict their use in practice. This crucial aspect reinforces the credibility of our estimate. Accordingly, we refer to our methodology as the “direct” estimation method in this study. The details are discussed in §4.
Indirect Estimation
We also adapted the approach developed in Cong et al. (2023) in the context of centralized exchanges, to our NFT data set, with the objective of comparing it to our direct estimation approach. As mentioned, Cong et al. (2023) utilized statistical tools to identify irregularities in trading patterns, particularly focusing on fungible tokens. A key aspect of their methodology is the use of roundedness in transaction amounts, Benford’s law, and tail distribution analysis as proxies for detecting wash trading. They observed roundedness clustering in transaction amounts, where legitimate trades disproportionately end in round numbers, as a significant indicator of potential wash trading. In addition to this clustering, they also quantified wash trading activities, setting a specific threshold to discern normal trading from potential manipulation. Furthermore, they applied Benford’s law to analyze the distribution of the first significant digit in transaction sizes, identifying deviations from expected patterns that could signal manipulative practices. Finally, their examination of the tail distribution of trade sizes focused on uncovering anomalies that diverged from typical market behavior, further aiding in the identification of suspect trading activities. Accordingly, we refer to such methods as “indirect” estimation methods, in our study. The details are discussed in §5.
Results
Direct estimation flagged 968472 trades (26.94%) on Blur and 118055 trades (29.42%) on LooksRare as wash trades. These accounted for 45.4% and 94.8% of the total trading value on their respective platforms. As a comparison, Cong et al. (2023) reported wash trading values averaging 77.5%, with a median of 79.1%, across unregulated cryptocurrency exchanges. In particular, they found that wash trades on twelve Tier-2 (based on web traffic) exchanges exceeded 80% of the total trade value. These findings reveal considerable variations in wash trading values across different exchanges and highlight the complexities involved in detecting and quantifying such activities in various market contexts. Our research also reveals compelling evidence that wash trading increases NFT prices, but only limited evidence that such practices lead to significant profit gains for those engaged in them.
Using these direct estimation results as a benchmark, we then adapted the four different indirect statistical methods used in Cong et al. (2023), to our NFT data. Our results are summarized below.
-
1.
Benford’s Law: Benford’s Law predicts that in many natural datasets, the first digit is more likely to be small, a pattern expected in genuine financial transactions. The Benford’s Law test revealed that both wash and legitimate trades on LooksRare and Blur significantly deviated from Benford’s expected distribution, with -values close to zero indicating significant differences. Suprisingly, legitimate trades displayed higher -statistics, with 3238.61 vs 1009.16 on LooksRare and 12546.7 vs 9217.82 on Blur, compared to wash trades, suggesting stronger deviation from Benford’s Law for legitimate trades. Thus, while Benford’s Law provides an insightful perspective, it does not effectively differentiate wash from legitimate trades in NFT marketplaces.
-
2.
Trade-Size Clustering: This method assesses the clustering of trade sizes around round numbers, based on the human tendency to prefer rounded figures in financial transactions. Analysis of trade-size clustering using Student’s -test showed significant differences between wash and legitimate trades on LooksRare. Legitimate trades exhibited a -statistic of 492.33 in the 500 unit window size, indicating a stronger clustering around round numbers compared to wash trades, which scored 172.36. On both platforms, the legitimate trades group achieved double -statistics compared to the wash group. This analysis suggests that trade-size clustering is a highly effective method for distinguishing wash from legitimate trades, demonstrating clear differences in trading behaviors.
-
3.
Tail Distribution: This method investigates whether the tail distribution of trade sizes adheres to a power-law, a common characteristic in financial data. Legitimate empirical distribution of trade sizes in financial markets typically displays a power-law tail, characterized by a Pareto-Lévy regime with the power-law exponent in the range of 1 to 2. This pattern reflects the impact of large investors and strategic trading behaviors, making it a critical marker for analyzing market dynamics. In our study, among the four groups analyzed—Blur wash, Blur legitimate, LooksRare wash, and LooksRare legitimate trades—only Blur’s wash trades (Hill exponent 1.9636) and LooksRare’s legitimate trades (Hill exponent 1.9529) fell within the Pareto-Lévy regime. This outcome, where only a subset conforms to expected power law behavior, is not a natural expectation for the power law test. Consequently, while the power law test of tail distribution offers valuable insights, it does not effectively differentiate between wash and legitimate trades in our analysis.
-
4.
Trade-Size Roundedness: This method evaluates the roundedness of trade sizes, with the hypothesis that wash trades will exhibit a lower level of roundedness. On Blur, it flagged trades () as wash trades, and on LooksRare, trades (), with accuracies of and respectively compared to our direct estimation - 968472 trades (26.94%) on Blur and 118055 trades (29.42%) on LooksRare respectively. Thus, the roundedness test proved to be highly effective, with results closely aligning with those from the direct estimation.
Our investigation into indirect statistical methods for detecting wash trading contributes to a broader understanding of market dynamics, applicable beyond just NFT markets. While the Benford test showed limited effectiveness, this insight is valuable for refining statistical methods across trading platforms for various financial assets. The effectiveness of trade-size clustering underscores the universality of human behavioral patterns in trading contexts. Furthermore, our analysis challenges the standard application of the Pareto-Lévy regime for power-law tails, suggesting a need for adaptable approaches in diverse market environments.
Notably, we observed key trends and optimization challenges in our application of trade-size roundedness as an indirect method for quantifying wash trading. The method, when applied with a default 1% threshold as used by Cong et al. (2023), yielded accuracies of 65.65% for LooksRare and 68.22% for Blur. However, our analysis revealed that adjusting the roundness level threshold significantly impacts the accuracy. As the roundness threshold increases, the response of other metrics such as precision, recall, and fallout is not linear but exhibits a quadratic trend. This indicates a complex, non-monotonic relationship between the threshold setting and these metrics, with precision decreasing and both recall and fallout increasing in a curved pattern. This complexity in the metric responses highlights the importance of a nuanced approach to setting the roundness threshold for effective wash trade detection. Intriguingly, setting the threshold to zero so that all transactions are flagged as legitimate trades, an extreme and theoretically trivial case, resulted in an accuracy exceeding 70% for both platforms, highlighting the sensitivity of this method to parameter settings. These findings, while pointing to the effectiveness of the roundedness test, also emphasize the need for careful calibration of hyper-parameters to ensure meaningful detection of wash trading across different markets.
The rest of the paper is structured as follows. In Section 2, we review prior work, setting the stage for our own investigations. Section 3 describes our data and summary statistics. Section 4 details our direct estimation methodology, where we introduce and describe four unique filters developed to identify wash trading behaviors, and presents the results of applying these direct estimation methods. In Section 5, we apply and analyze the effectiveness of Cong et al. (2023)’s indirect statistical methods in the context of NFT markets, offering a comparative perspective. The paper culminates in Section 6, where we discuss our findings in depth, reflecting on the complexities of the NFT market and the implications of our research for future studies and regulatory interventions.
2 Prior Work
Illicit market behaviors like wash trading on cryptocurrency exchanges and NFT marketplaces have attracted substantial academic interest. Initially scrutinized in traditional financial market settings, studies like those by Mao et al. (2015), Cao et al. (2014), Zitzewitz (2012), O’Hara et al. (2014) have laid the foundation for understanding market deceptions. These seminal works span from recognizing fraudulent transactions in monetary networks to examining the impact of odd-lot trades in equity markets, offering crucial perspectives on market scheming and the development of detection methods in financial trading environments.
Building upon these foundational studies, Cong et al. (2023) introduce systematic tests for detecting fake transactions in cryptocurrency exchanges, which we apply to our own NFT dataset. Their findings highlight the prevalence of wash trading in unregulated markets, with over 70% of the traded value on such exchanges attributed to this practice.
Further, Bonifazi et al. (2023) analyzed the profitability of wash trading in NFTs, Morgia et al. (2023) investigated the exploitation of token reward systems of NFT trading platforms, and von Wachter et al. (2022) quantified suspicious behavior in NFT markets. Compared to all these works, our study extends the existing literature by providing a comprehensive comparison of direct and indirect methods for detecting wash trading. This approach allows us to offer new insights into the effectiveness of these methods in various market contexts, not limited to NFTs, thereby contributing to a broader understanding of market dynamics.
Regarding general NFT market studies, Huang and Goetzmann (2023) explore the behavioral bias of selection-neglect and its interaction with market dynamics during the NFT bubble. Fridgen et al. (2023) examine the herding behavior towards “blue-chip” NFTs, shedding light on factors influencing NFT pricing and market liquidity.
We aim to extend this body of work by offering new insights and analyses on wash trading across financial markets, beyond the NFT marketplaces. Our study is distinguished as the first to conduct a side-by-side comparison of direct and indirect wash trading detection methods. This comparison reveals that not all indirect methods are equally effective across different market types, highlighting the necessity of fine-tuning these methods according to specific market dynamics for accurate detection.
3 Data Collection
Our study focuses on the NFT marketplaces LooksRare and Blur, selected due to their significant and different roles in the NFT market. As of February 2023, Blur emerged as the top NFT marketplace with a market share of 56.8%, while LooksRare held a market share of 1.0% and sat in 5th place (CoinGecko 2023). This selection is particularly relevant for analyzing different aspects of NFT wash trading: LooksRare is known for its problematic token reward system, which has been criticized for paving the way to severe wash trading (Morgia et al. 2023), whereas Blur’s program, more focused on user loyalty and platform engagement, offers a contrasting perspective (Barter 2023).
We collected all events emitted by the LooksRare and Blur exchange contracts. For LooksRare, our data covers all transactions from 11:04 December 29th, 2021 to 19:45 April 07th, 2023. For Blur, our data covers all transactions from 00:00 October 19th, 2022 to 00:00 September 12th, 2023. In both datasets, each transaction is represented by a single row, with the schema detailed as follows:
-
•
Transaction hash: A unique identifier for the transaction on the blockchain.
-
•
Block number: The specific block on the blockchain where the transaction is recorded.
-
•
NFT seller: The address of the individual or entity selling the NFT.
-
•
NFT buyer: The address of the individual or entity purchasing the NFT.
-
•
NFT collection: The specific collection to which the NFT belongs.
-
•
NFT tokenId: A unique identifier for the specific NFT within its collection.
-
•
Price: The sale price of the NFT, denominated in ETH.
-
•
Date: The date and time when the transaction occurred.
The datasets from LooksRare and Blur exchanges are substantial, with the Blur exchange dataset occupying 875 MB and comprising 3,594,371 transactions, and the LooksRare dataset at 242 MB with 936,348 transactions.
Our data collection process combined several methodologies. Firstly, we identified the contract addresses of LooksRare and Blur on the Ethereum blockchain. We then scraped their Ethereum logs, utilizing a combination of our own Ethereum archive node and the Ethereum ETL data set available on Google BigQuery. Our Ethereum archive node is running the Erigon consensus client on servers located on Penn’s campus. The Ethereum ETL dataset is a public, up-to-date database of raw Ethereum logs, generated by the open-source Ethereum ETL package (Medvedev et al. 2023). After obtaining the raw log files, we used the ABI (Application Binary Interface) of the Blur and LooksRare exchange contracts to parse events into CSV format, followed by data cleaning. The entire parsing and data analysis process was conducted using the Web3.py library, a Python library designed for interacting with Ethereum. Web3.py enables querying and interacting with Ethereum nodes, facilitating direct communication with the blockchain. This tool was instrumental in our comprehensive data collection, allowing us to accurately capture and analyze the nuances of NFT transactions across these platforms.
In total, we identified 9462 NFT collections on LooksRare and 7637 NFT collections on Blur. Figure 1(a) shows a histogram of total sale value per collection on LooksRare, and Figure 1(b) shows a histogram of total-sales value per collection on Blur. The figures exclude any outlier collections that amassed total sale value above the 99th percentile - 791.26 ETH on LooksRare and 3292.66 ETH on Blur respectively. Each bin of histograms represents an even intervals from 0 to 99th percentile of total sale value.
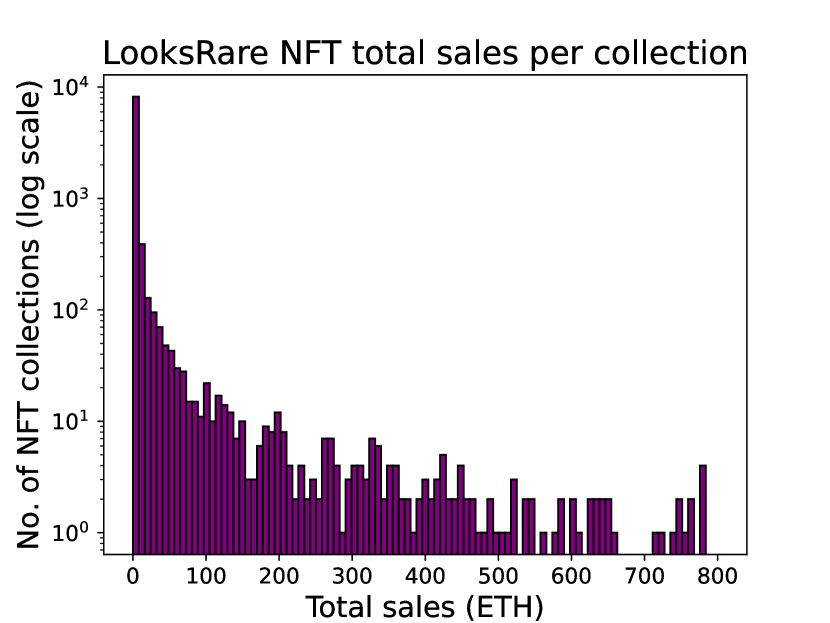
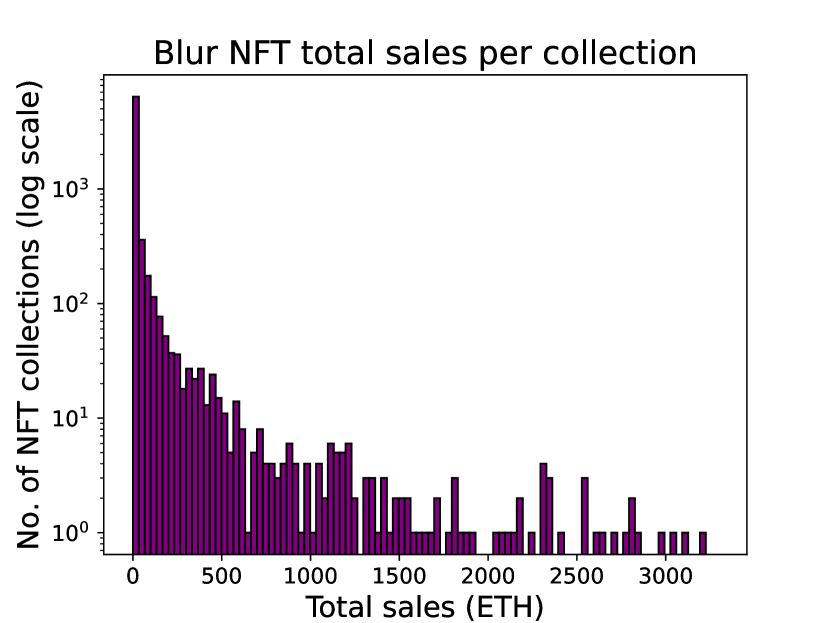
These histograms illustrate the distribution of total sales per NFT collection on LooksRare and Blur, with each bar representing a range of sales in ETH. The height of each bar reflects the number of collections within that sales range, displayed on a logarithmic scale. This scale choice allows for a comprehensive view of sales distributions across diverse value ranges, making it easier to observe and compare patterns across the spectrum. The exclusion of the top 1% of collections is a deliberate choice to prevent scale distortion from exceptionally high sales, thus offering a clearer, more focused comparison across the broader range of collections. This representation is designed to enable the identification of general sales trends and potential outliers within the data.
The histograms for both LooksRare and Blur display a distribution that is heavily skewed to the left, indicating that a majority of NFT collections fall into the lower sales value category. This suggests that while there are a large number of NFT collections available on both platforms, the bulk of these collections are what might be termed “small fish,” with only a few reaching higher sales value. This concentration in the lower end of the sales spectrum illustrates the long-tail nature of NFT collections in these marketplaces.
A technical note: transactions on LooksRare involve trading NFT for Ether, whereas Blur involves a mixture of Ether, Wrapped Ether (wETH), as well as their own Blur Pool token.222Blur implements its own token to reduce gas costs when interacting with the Blur exchange contract. Like wrapped Ether, Blur pool tokens can be minted by depositing ETH, and redeemed for ETH in the pool. Since all three tokens (ETH, wETH, and Blur Pool Tokens) trade at the same valuation, we can treat all payments as being in Ether. Our LooksRare data set has 401340 transactions that amounts to a total value of 10250305.34 ETH. As for the Blur data set, it has 3594370 transactions that amounts to a total value of 3580487.51 ETH.
4 Direct Estimation
In developing our direct estimator for wash trading, we started from four basic filters, and adapted them to the NFT setting. We discuss each in detail next.
4.1 Wash Trading Filters
| Filters | Functions |
|---|---|
| 1 | Buyer = Seller |
| 2 | Back & Forth Trades |
| 3 | Bought same NFTs 3 times and plus |
| 4 | Funded by same wallet |
Filter 1 flags trades where the buyer and seller account is one and the same – this is the most naïve form of wash-trading – literally selling the NFT to oneself.
Filter 2 detects back and forth trades, meaning, if buyer and seller are inverted for the same exact NFT, then Filter 2 will be triggered. This is intended to flag slightly more sophisticated wash trading activity, where the wash trader has created two accounts and sells the same NFT back and forth between these two accounts. It gets triggered even when there is just one instance of inversion between buyer and seller identities for the exact same NFT. This means if an NFT is sold from Address to Address , and then subsequently sold back from Address to Address , Filter 2 would identify this as a potential wash trade.
Filter 3 flags trades where the same buyer purchased the same NFT, three or more times. Imagine a slightly more sophisticated wash trader, who generates multiple (more than two) accounts, and trades a single NFT between these accounts in a cycle. Unlike Filter 2, which flags direct back-and-forth trades between two accounts, Filter 3 identifies circular trading patterns involving three or more accounts. Filter 3 will flag this activity as wash trading, if the NFT passes around the cycle at least three times. For example, if an NFT is first sold to Buyer , who then sells it to Buyer , and Buyer subsequently sells it to Buyer , who then completes the loop by selling it back to Buyer , this Filter would flag the activity when Buyer acquires the NFT for the third time. This cycle could involve numerous parties and is designed to detect complex wash trading schemes where a single entity might be operating multiple accounts to simulate a closed loop of trades.
Finally, Filter 4 detects transactions with a common upstream wallet that has funded both the buyer and seller, indicating potential control over both sides of the trade. In our dataset, we analyze the transfer history up to one degree upstream for both buyers and sellers. This means, for example, if Wallet sells an NFT to Wallet , the Filter checks if there is a Wallet that previously transferred funds to both Wallet and Wallet . The presence of such a common upstream wallet suggests a single entity may be orchestrating the trade from behind the scenes, using different wallets to create the illusion of a genuine transaction.
When implementing these filters, we have to make a decision about granularity. For example, in Filter 2, when we say “the same” NFT was traded back and forth between, does the same NFT mean the same NFT contract (e.g. Bored Apes) or the same exact NFT (e.g. Bored Ape #3401). We can ask a similar question for Filter 3 as well. For Filter 2, we consider a typical wash trader would buy and sell from same NFT collections back and forth, but not necessarily the same token. Thus, we set Filter 2 at the collection level. For Filter 3, since it is reasonable for an legitimate trader to buy multiple tokens from the same collection, we impose Filter 3 up to token level so as not to over-estimate the number of wash trades.
To mitigate potential false positives in Filter 4, which identifies common upstream wallets, we exclude all contract addresses. This targeted approach, described in the Data section, focuses on Externally-Owned Accounts (EOAs) to accurately isolate wash trading. For instance, if both buyer and seller minted Wrapped Ether (wETH), they would have received a “payment” from the wETH smart contract. Similarly, if both parties sold NFTs on OpenSea before transacting on LooksRare, they could mistakenly be flagged due to payments from OpenSea’s contract. Since wETH and OpenSea’s exchange are contracts, they would be excluded by our filter. To further reduce the chance of false positives, we also manually excluded Externally Owned Accounts (EOAs) that were known to belong to centralized exchanges (e.g. Binance).
Identifying upstream activity for a given address can be challenging because the Ethereum Remote Procedure Call node (RPC) does not allow users to search the chain for transactions that involve a given address. To identify upstream activity, we used Alchemy’s getAssetTransfers function, which allowed us to collect one degree upstream transfers to all buyers and sellers from the trading data. Alchemy’s getAssetTransfers, also allowed us to restrict our searches to EOAs, prevents the type of false-positives that could arise from common contracts like wETH or on-chain exchanges.
4.2 Direct Estimation Results
In this section, we establish our benchmark results and general statistics stemming from the “direct” estimation method. We applied the aforementioned filters on our LooksRare data and Blur data. The results are summarized in Tables 2 and 3, respectively.
On LooksRare, Filter 1 only flagged 57 trades, whereas Filter 4 flagged 98955 trades as wash trades. In total, filters 1 through 4 collectively identified 118055 wash trades, which is not simply the sum of the individual filters’ results. This is because a single transaction may meet the criteria of multiple filters, and the last line in the table represents any transaction flagged by at least one of these filters (logical OR). Therefore, 29.42% of wash trades on LooksRare contributed 94.8% of the value in ETH.
On Blur, Filter 1 flagged the least, 5264 trades, while Filter 4 flagged the most, 715942 trades. Here, the combination of filters 1 through 4 caught 968472 trades, with 26.94% of transactions accounting for 45.4% of the value. Again, this cumulative count is due to the application of a logical OR across the filters, leading to a non-summative total as transactions could be flagged by multiple filters.
The notable discrepancy in wash trade value between LooksRare and Blur, 94.8% versus 45.4%, despite having a similar fraction of wash trades (29.42% on LooksRare and 26.94% on Blur), can be contextualized through the insights from Morgia et al. (2023). Their study of the NFT ecosystem on Ethereum indicates that LooksRare, despite processing fewer transactions, specializes in higher-value NFTs. This emphasis on more expensive assets is a key factor contributing to the stark difference in wash trade value observed.
| Filters | Wash Trades % | Wash Value % | Count |
| 1 | 0.01% | 0.05% | 57 |
| 2 | 7.65% | 92.42% | 30692 |
| 3 | 8.99% | 88.25% | 36095 |
| 4 | 24.66% | 78.52% | 98955 |
| 1, 2, 3, and 4 | 29.42% | 94.8% | 118055 |
| Filters | Wash Trades % | Wash Value % | Count |
| 1 | 0.15% | 0.36% | 5264 |
| 2 | 7.07% | 26.9% | 254003 |
| 3 | 5.17% | 22.92% | 185653 |
| 4 | 19.92% | 22.05% | 715942 |
| 1, 2, 3, and 4 | 26.94% | 45.4% | 968472 |
Does wash trading drive up NFT prices?
A question that follows is whether wash trading drives up NFT prices - specifically, median prices. Given the high variance between top and bottom collection in total sales, it is sensible to measure each collection by their median sold price instead of total sum of sales. Similar to total sales per collection, median price per collection exhibits concentration on the lower end - 19.76 ETH achieves 99th percentile on LooksRare and 7.35 ETH for Blur, yet the single top collection went for 11538.0 ETH and 187.0 ETH on LooksRare and Blur respectively.
In our study, we sub-sampled NFT collections into two groups: those involved in wash trading and those not involved. For each group, we calculated the median sale price for every NFT collection, which entails accounting for the various tokens traded from that collection. Excluding the outlier median price beyond the 99th percentile, we obtain the following results shown in Figure 3.
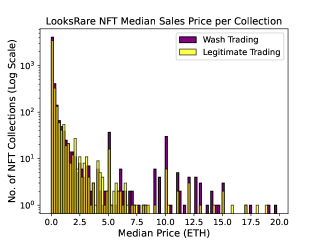
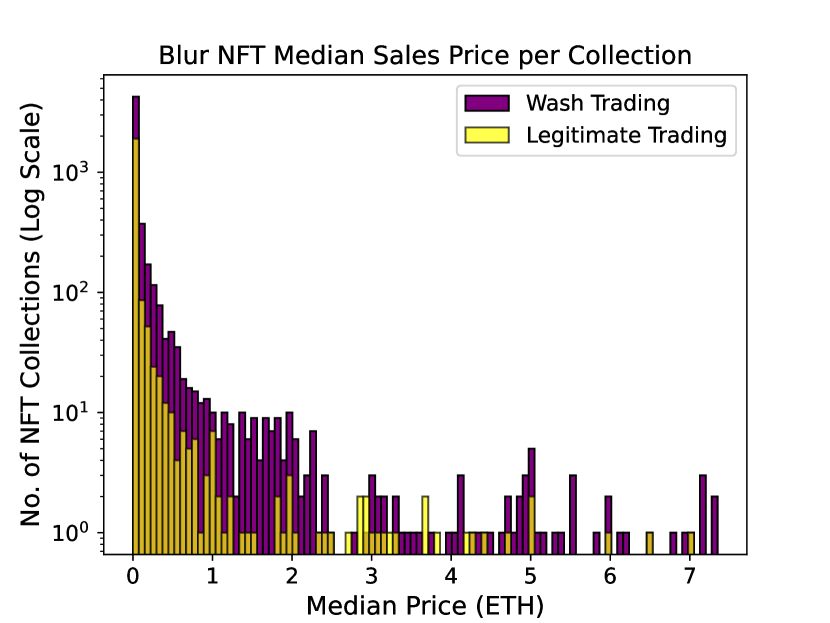
The histograms display the distribution of median sales prices for NFT collections, categorized by whether the trades were identified as wash trading (purple bars) or legitimate trading (yellow bars). Prices are shown on a logarithmic scale to more clearly present the wide range of values. Collections with median prices in the top 1% are excluded to prevent skewing the distribution. These visualizations help illustrate the difference in pricing behavior between suspected wash trades and legitimate transactions across the two marketplaces.
The histograms for LooksRare and Blur reveal that NFT collections involved in wash trading typically exhibit higher median sales prices compared to legitimate trading collections, with this trend more pronounced on Blur. Once we had these median prices for every collection in a group, we then calculated the overall median of these median prices. For collections involved in wash trading, the median of the median sale prices was 0.0365 ETH on LooksRare and 0.0185 ETH on Blur. In contrast, collections not involved in wash trading had slightly lower median sale prices, with 0.035 ETH on LooksRare and 0.01 ETH on Blur. This suggests that wash trading may play a role in elevating the perceived value of NFT collections, impacting the median sale price across different tokens within these collections.
Does wash trading increase wash trader profits?
Given wash trading seems to lead to increased median prices, it naturally follows to ask whether this activity actually increases the profit of wash traders? To help answer this question, we collapsed the wash traders into groups based on their connectivity through trades. Since wash trading usually takes more than one wallet, we group buyer and seller as one entity if their transaction is flagged as wash trading. Filtering through every transaction, eventually we obtained a complete list of disjoint wash trading groups. To illustrate, consider the following toy example involving 3 traders and 2 transactions. Suppose there are traders , and , in which the transaction from to is flagged as wash trade and the one from to is not.
In this case, trader and are both considered to be wash traders and a single wash trading group that either makes a profit or takes a loss through their transaction with legitimate trader . To calculate the profit, we gather the revenue and expense of each trader and wash group.
We collapsed 15435 wash traders on LooksRare into 2508 disjoint wash trading groups. As for Blur, 79189 wash traders were categorized into 1438 wash groups. Excluding the traders who took a loss, Figure 4 compares the wash trading group to legitimate trader profits:
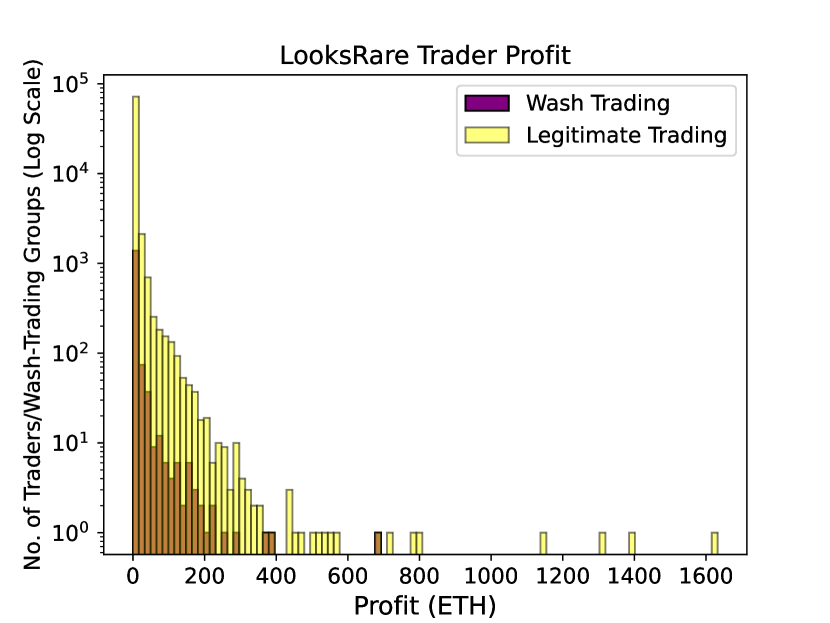
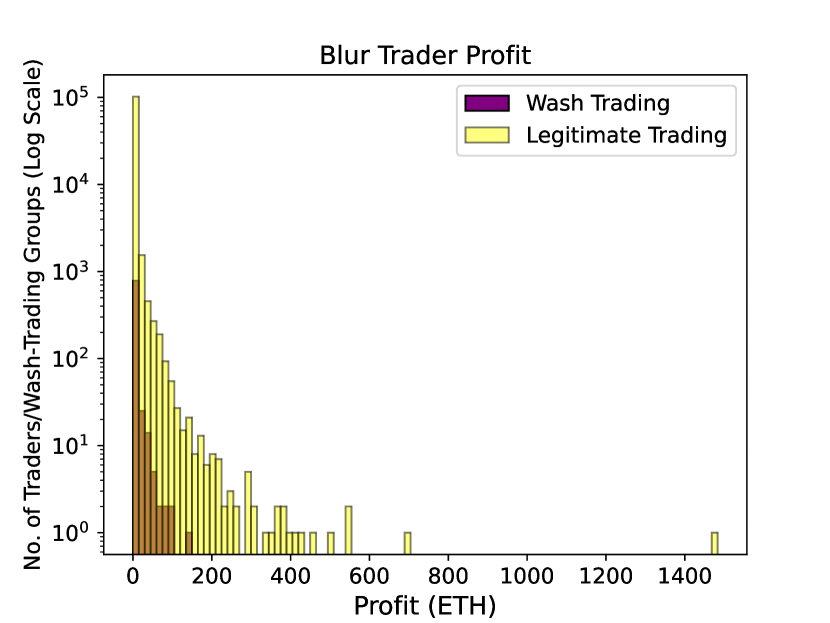
These histograms visualize the profits earned by traders involved in wash trading versus those engaging in legitimate trading across both platforms. In each histogram, the x-axis represents the profit range in ETH, while the y-axis shows the number of traders or wash trading groups on a logarithmic scale, enabling a clear comparison of the frequency of profit amounts.
The histograms reveal that, across various profit brackets, wash traders do not consistently secure higher profits when compared to their legitimate counterparts. This visual evidence is corroborated by empirical data indicating that on LooksRare, the median profit for wash trading groups is approximately zero ETH, with a maximum profit reaching 689.82 ETH. In contrast, legitimate traders attain a median profit of 0.02 ETH and can achieve up to 1632.48 ETH at the higher end. Similarly, on Blur, wash trading groups achieve a median profit close to zero ETH, with their most profitable outcomes peaking at 145.58 ETH. This is lower than the median profit for legitimate traders, which stands at 0.01 ETH, and legitimate traders also reach a much more substantial maximum profits of 1483.32 ETH. These findings suggest that while wash trading may influence market dynamics, it does not necessarily result in greater profitability for those who engage in it.
Note, similar filters than the ones we use in this section have been employed by practitioners on different datasets. Our high-level findings are generally consistent with prior analyses, e.g., those posted in a blog by Hildobby (2022).
Summary of Direct Estimation Findings
As a summary, the application of direct estimation filters across LooksRare and Blur data yields the following key insights:
-
(R1)
Wash trading is identified as a percentage of total trades 29.42% on LooksRare and 26.94% on Blur; yet these trades contribute disproportionately to the total value, accounting for 94.8% and 45.4% of the value in ETH, respectively.
-
(R2)
NFT collections implicated in wash trading show higher median sales prices when compared to legitimate trading collections, with a more noticeable discrepancy observed on Blur. This indicates a potential influence of wash trading on inflating NFT collection values.
-
(R3)
Wash trading activities do not guarantee higher profits. Data reveals that wash traders do not consistently outperform legitimate traders in terms of profit margins.
5 Indirect Estimation
As mentioned in the introduction, the indirect statistical methods developed in Cong et al. (2023) were designed to identify crypto wash trading on centralized exchanges. In particular, they applied four distinct methods - Benford’s Law, Trade-Size Clustering, Tail Distribution, and Trade-Size Roundedness, each providing binary outcomes (yes/no) on the presence of anomalies, with only Trade-Size Roundedness quantifying the actual fraction of wash value. Here, we adapt these methods and tailor them to our NFT dataset. Our main objective is to contrast the results obtained using indirect estimation with those obtained using direct estimation in Section 4.
5.1 Benford’s Law
Benford’s Law, also known as the First-Digit Law, is a statistical principle that predicts the frequency distribution of the first digits in numerical datasets. Specifically, it posits that in many naturally occurring collections of numbers, the leading digit is likely to be small. For example, the number 1 will appear as the leading digit about 30% of the time, while larger numbers like 9 will appear as the first digit less frequently, about 5% of the time.
In a genuinely random set of financial figures, such as stock prices, transaction amounts, or accounting data, the distribution of first digits should conform to Benford’s distribution. If the data significantly deviates from what Benford’s Law predicts, it may suggest that the numbers have been manipulated or that there are artificial forces influencing the market, such as price fixing or wash trading.
We extracted the first significant number of each NFT price (e.g. 1 for 0.125 ETH), then apply the Benford law test on 4 groups of sub-samples: wash and legitimate trades of LooksRare and Blur flagged by our 4 filters. The null hypothesis is that the empirical distribution of the first significant digit of traded prices should follow Benford’s law. We set to be the probability of making a Type I error, that is, incorrectly concluding the empirical distribution does not follow Benford’s law. Our results are illustrated in Figures 5 and 6.
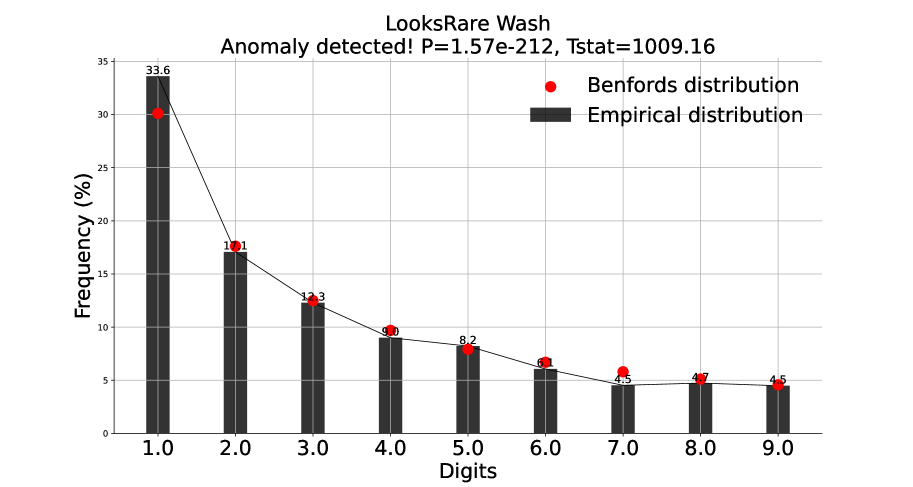
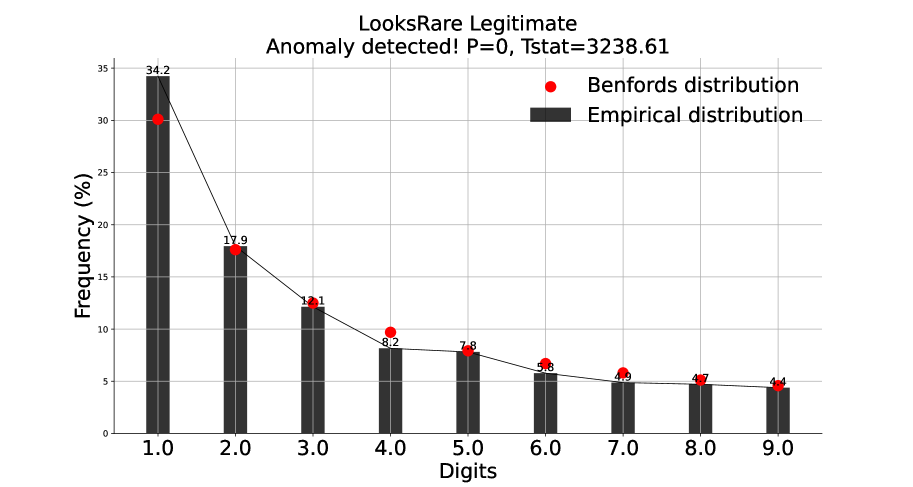
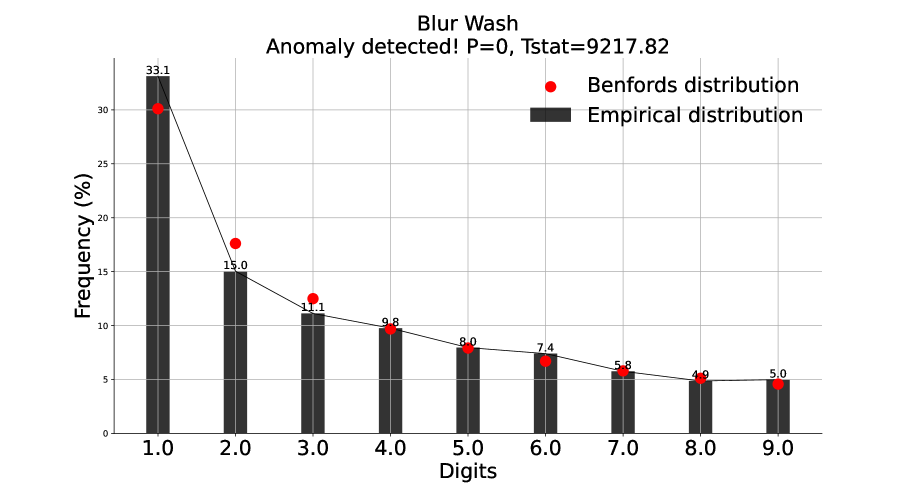

In these visualizations, the black bars denote the empirical distribution of the first significant digit in the datasets, contrasting with the red dots that represent the expected distribution according to Benford’s Law. A deviation from the red dots visually indicates a potential non-conformity with Benford’s Law. The graphs also include a -value, which mathematically quantifies the likelihood of the empirical distribution occurring if Benford’s Law were indeed the governing rule; a lower -value signals a statistically notable divergence. Additionally, the -statistic is included as a numerical measure of this deviation’s extent: higher values correspond to a more significant departure from the expected Benford distribution.
For LooksRare and Blur, both wash and legitimate trades showed significantly low -values, indicating a notable deviation from Benford’s Law for all categories. Surprisingly, legitimate trades registered higher -statistics than wash trades on both platforms. These results indicate that Benford’s Law, while a valid tool in numerous contexts, does not seem to apply effectively in our setting.
This contrasts with the findings in Cong et al. (2023) where regulated exchanges consistently conformed to Benford’s Law, while many unregulated exchanges, particularly those classified as Tier-2 by web traffic, displayed significant deviations from it.
5.2 Trade-Size Clustering
Trade-Size clustering is based on the idea that legitimate traders prefer round numbers in trade sizes, which reflects a broader behavioral pattern in financial markets aimed at minimizing negotiation efforts and transaction costs. Such clustering also serves as a cognitive simplification strategy, with traders opting for round figures as intuitive benchmarks in decision-making processes. Adapting Cong et al. (2023)’s methodology to our context, we examine trade-size clustering in the NFT prices, where NFTs are traded for ETH. To maintain consistency with the original method’s focus on meaningful round trade sizes, the base unit for our analysis is set in 0.001 ETH. We specifically look for clustering at multiples of 100 base units of ETH to discern patterns that may distinguish between legitimate and algorithm-driven wash trading behaviors. Figures 7 and 8 illustrate our findings.
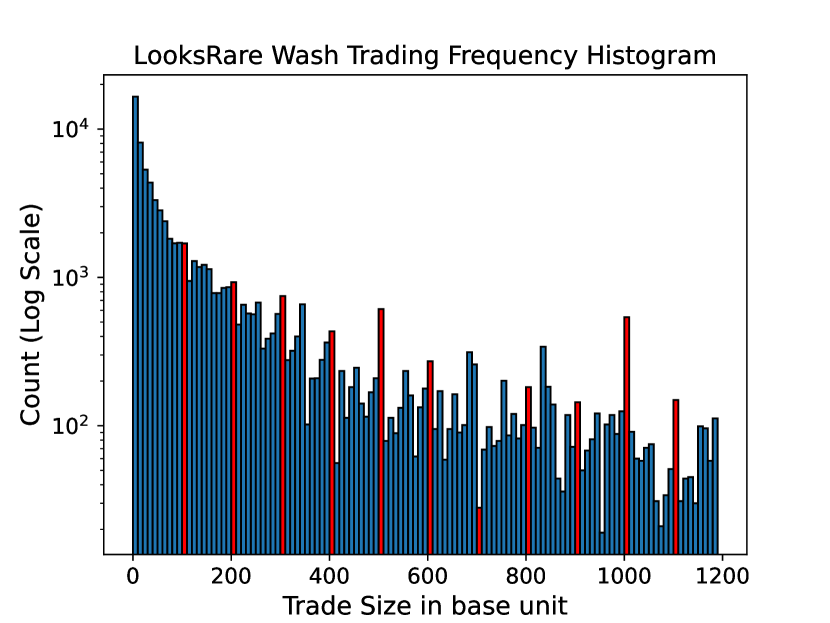
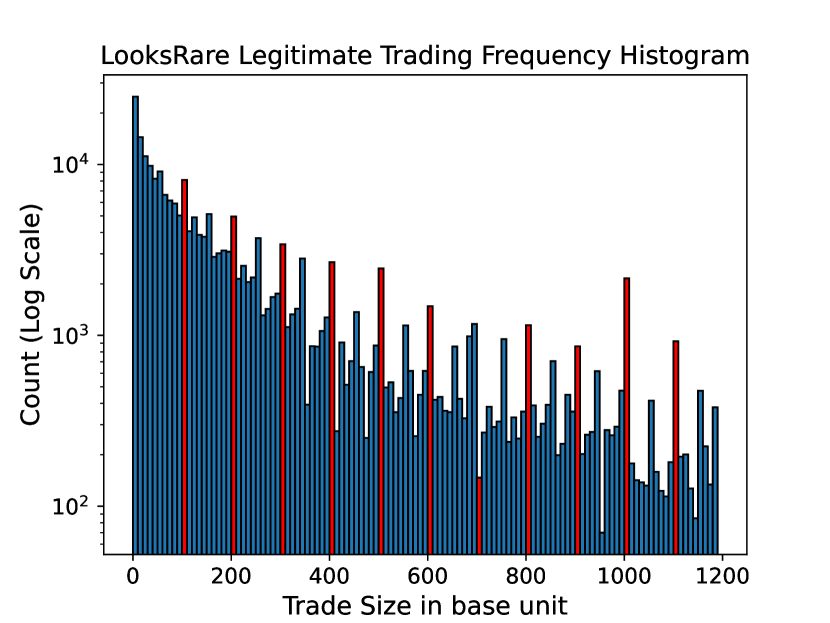
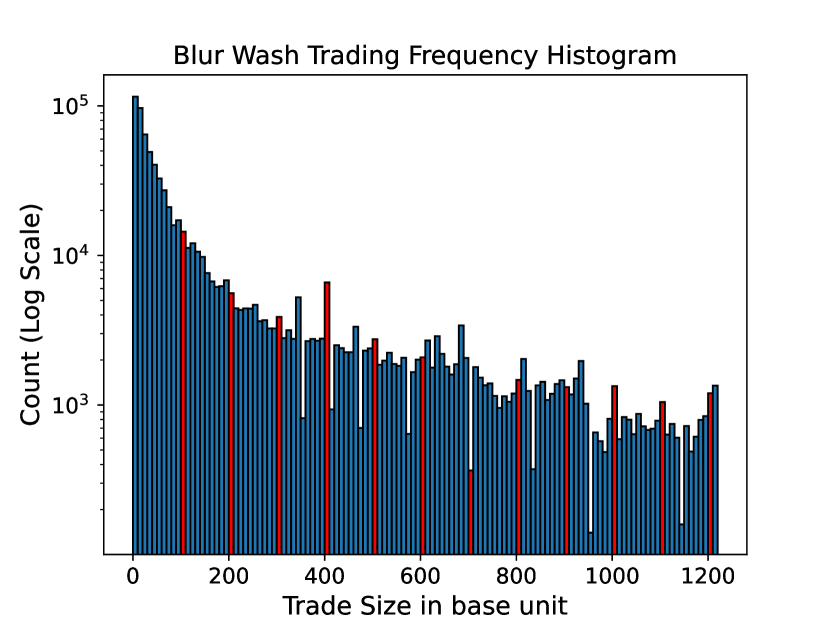
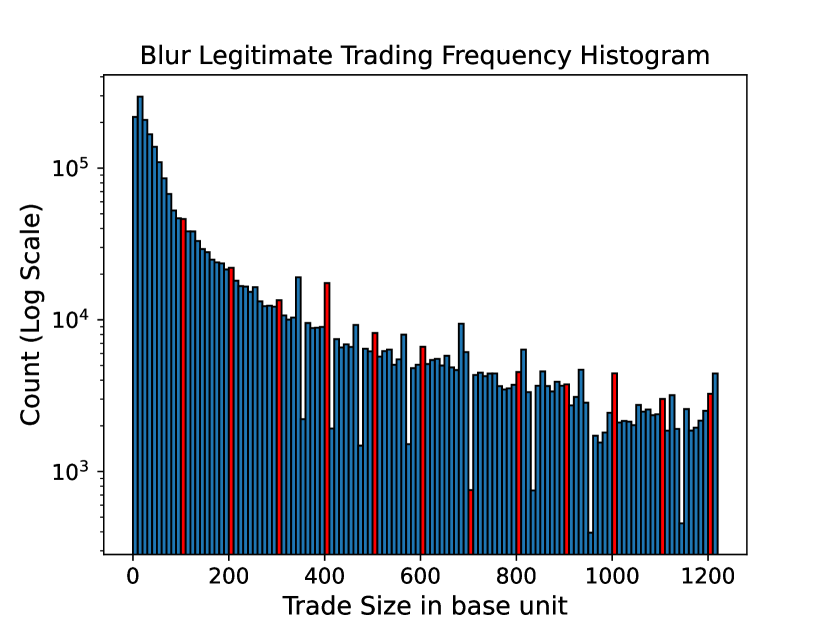
These histograms represent the frequency of trade sizes, plotted on a logarithmic scale. The blue bars indicate the count of trades at each size interval, while red bars highlight trade sizes that are multiples of 100s, aiding in the visual detection of patterns. Regular peaks at these intervals could suggest a propensity for trades to cluster around round numbers, which may be characteristic of either manual trading preferences or algorithmic trading activity. Differences between wash and legitimate trades could indicate manipulative practices in the former.
Note, in these visualizations, we truncated LooksRare trade sizes above the 75th percentile and Blur trade sizes above the 80th percentile to eliminate the noise introduced by outliers. The bins start from 0 base unit upwards to its respective maximum with 10 as increment. We highlight every bin that sits at the multiple of 100 base units to illustrate the clustering effect. For LooksRare, it is evident that legitimate trades exhibit clustering around the multiple of 100s, whereas the wash trades counterpart does not display a strong clustering effect. For Blur, wash and legitimate trades do not visually differentiate.
To further quantify the effect of trade-size clustering, we reproduce Cong et al. (2023)’s Student’s -test on our trading data sets, in which the test statistic is calculated as:
| (1) |
where denotes the average of rounded trade frequencies minus unrounded frequencies, is the sample standard deviation and is the sample size. Cong et al. (2023) computed trade frequency of a given trade size based on two sets of observation windows: windows centered on multiples of 100 units (100X) with radius of 50 units (100X-50, 100X+50), and windows cented on multiples of 500 units (500X) with radius of 100 units (500X-100, 500X+100).
Given the set of windows, say (100X-50, 100X+50), trade frequency is defined to be the number of transaction with size over the total transaction numbers in (100X-50, 100X+50). We consider trade sizes as multiple of 100s or 500s, depending on observation windows, to be round. Any other trade sizes within the same window are consider to be unrounded.
Similarly, our null hypothesis of the test is that the difference between frequencies at rounded numbers and nearby unrounded trades is zero. Consider the results of the -stats of each sub-sample:
| Windows in 100s | Windows in 500s | |
|---|---|---|
| LooksRare wash | 23.47 | 172.36 |
| LooksRare legitimate | 144.30 | 492.33 |
| Blur wash | -116.94 | 423.94 |
| Blur legitimate | -24.52 | 897.53 |
In the LooksRare dataset, the positive -statistics for both wash and legitimate trades, especially in the 500 unit windows, suggest a significant clustering at rounded trade sizes. This is more pronounced in legitimate trades, aligning with the hypothesis that legitimate trading activities are more influenced by human cognitive biases towards round numbers.
In contrast, Blur exhibits a more complex pattern. The negative -statistics for wash trades in 100 unit windows and legitimate trades in 100 unit windows suggest a tendency to avoid round numbers in these cases. However, the substantial positive values in the 500 unit windows for both wash and legitimate trades indicate a strong preference for rounded numbers at these larger trade windows. Particularly, the exceptionally high -statistic in the 500 unit window for legitimate trades (897.53) points to a very significant clustering effect.
These results imply that while the preference for round numbers is a consistent trend in larger trade sizes across both platforms, there is a notable divergence in behavior at smaller trade size windows, especially on the Blur platform.
Our results represent an interesting parallel to those of Cong et al. (2023). In their study, regulated exchanges, analogous to our legitimate trades, showed consistent clustering, indicative of standard trader behavior favoring round numbers. Our results mirror this pattern for larger trade sizes in legitimate trades. However, the divergence between legitimate and wash trades at smaller trade sizes, particularly on Blur, differs. This divergence may reflect different trading strategies or a mix of algorithmic and human trading activities, which is a level of detail not distinctly addressed in Cong et al. (2023)’s study.
5.3 Tail Distribution
The tail distribution test acknowledges that distributions within economic and financial domains, including cryptocurrency markets, often display “fat tails”, which are aptly described by power-law distributions. Such distributions are mathematically characterized by their Cumulative Density Function (CDF), denoted as
| (2) |
where represents the power-law exponent. This framework effectively captures the increased probability of encountering extreme trade size values. The prevalence of power-law tails in financial datasets is frequently linked to the trading activities of large investors, who typically engage in substantial volume transactions while striving to mitigate their impact on the market. This observation is consistent with theories suggesting that trade size distributions are shaped by the strategic decisions of these significant market players, as well as by other contributory factors such as limited information regarding asset valuation and herding behavior among investors.
To adapt this methodology to our NFT datasets, we truncate data points below the 90th percentile and then estimate the tail exponent of the power law distribution, , through both Ordinary Least Square (OLS) and Maximum Likelihood Estimation (MLE) using the Hill estimator. The resulting exponents, and , are expected to fall within the Pareto-Lévy regime () for traditional financial assets and Bitcoin that do not have explicit market manipulation. Deviation from such a regime is considered to be anomalous. Our results are illustrated in Figures 9 and 10.
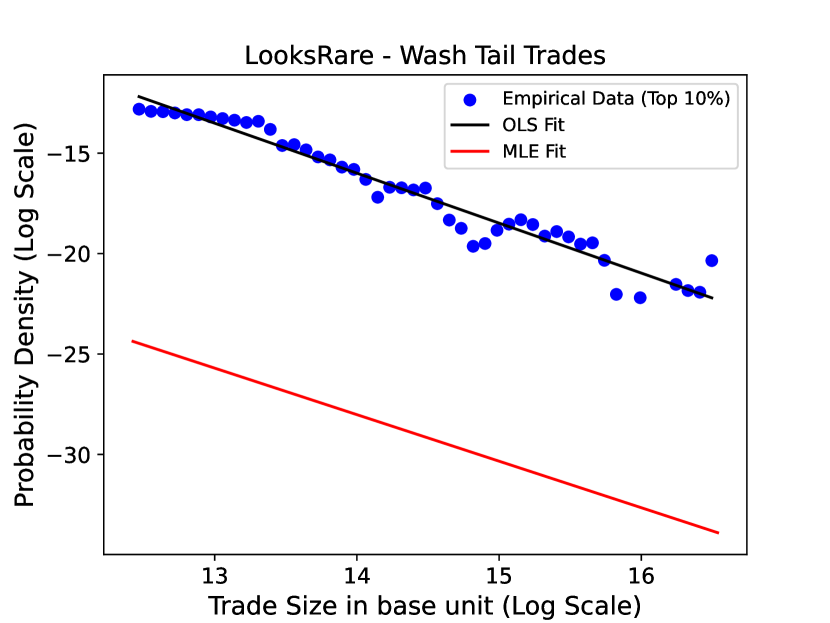
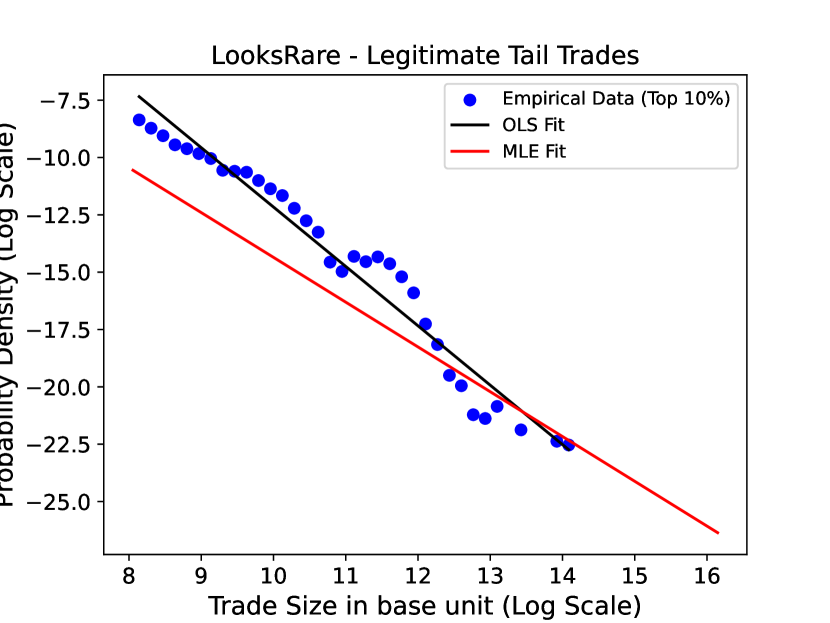
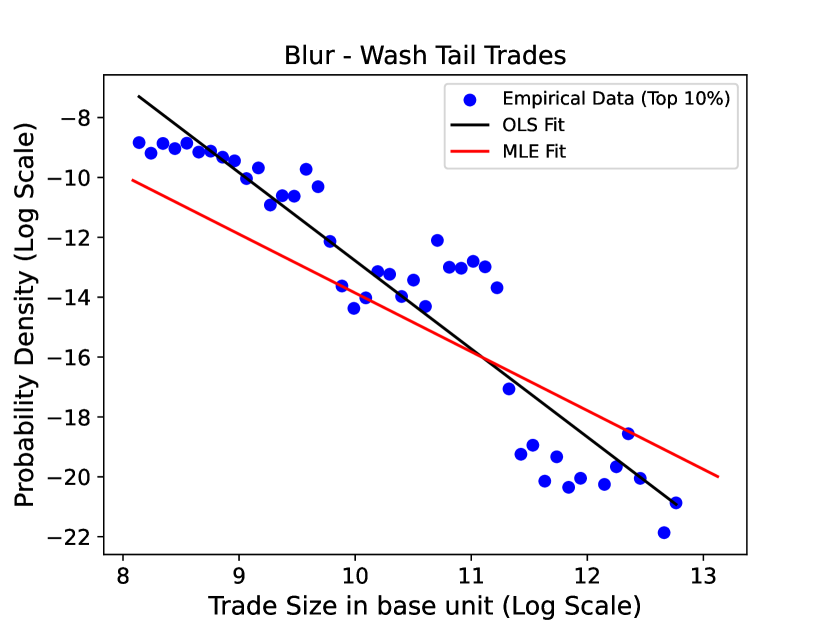
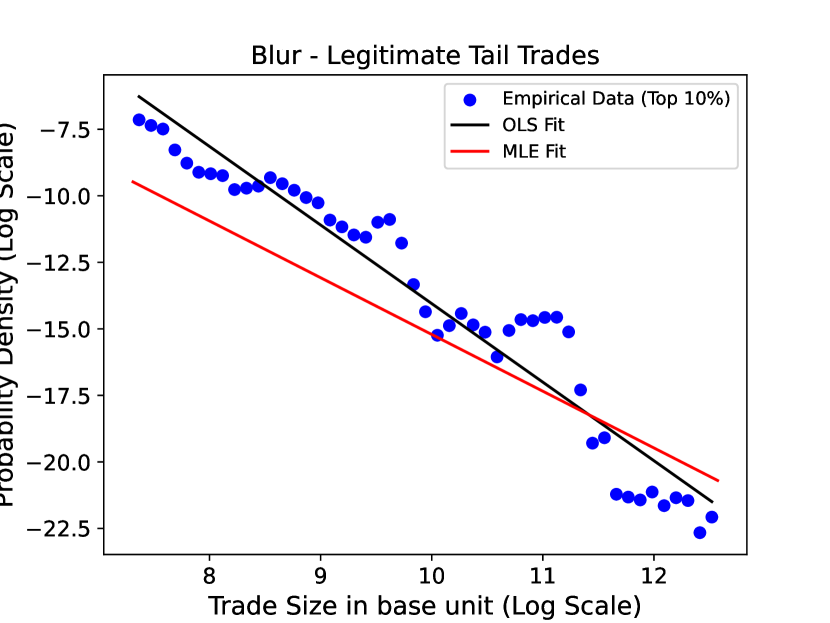
The plots depict trade sizes against their respective probability densities on a log-log scale. Blue dots represent empirical data for the top 10% of trade sizes, highlighting the tail of the distribution. The red line is the fit from Ordinary Least Squares (OLS), and the black line is the fit from Maximum Likelihood Estimation (MLE) using the Hill estimator. Steeper slopes on these lines correspond to higher values of the power-law exponent, indicating “thinner tails”, whereas shallower slopes indicate “fatter tails”, characteristic of larger trades having a higher likelihood. Comparing the fits to the empirical data points provides insight into the conformity of trade-size distributions to expected power-law behavior in the absence of manipulation.
| LooksRare wash | 2.4872 | 2.3166 |
| LooksRare legitimate | 2.5894 | 1.9529 |
| Blur wash | 2.9442 | 1.9636 |
| Blur legitimate | 2.9526 | 2.1325 |
Visually, the MLE method seems to fit the log-log data points more accurately compared to OLS. Interestingly, the MLE and OLS regression lines intersect for all the subsamples, except for the LooksRare Wash Trades subsample, where they appear to run parallel to each other. This divergence in the LooksRare Wash Trades could be due to unique characteristics of this dataset, such as specific tail behavior, the presence of outliers, or idiosyncrasies in the trade size distribution that are better captured by the MLE method. The parallel nature of the lines in this particular case indicates a consistent proportional difference in the scaling of trade sizes, suggesting that the underlying distribution of this subsample might deviate from the typical power-law pattern observed in the other subsamples.
In terms of the estimators, a striking observation emerges: among legitimate subsamples, only the “LooksRare legitimate” trades, as per the MLE Hill exponent, conform to the expected Pareto-Lévy regime. Surprisingly, the “Blur wash” trades also fit within this regime, suggesting that the power-law behavior of these trades might deviate from what’s observed in traditional financial markets.
This result is in contrast to Cong et al. (2023)’s findings, where power-law distribution with stable Pareto–Lévy distributions (with exponents between 1 and 2) was a common characteristic in the tails of trade-size distributions for regulated exchanges and some unregulated exchanges. While they reported a variety of divergent behaviors in tail distributions, particularly on unregulated Tier-2 exchanges, our results reveal a more pronounced deviation from the expected power-law exponent range. This suggests that the tail behavior in trade sizes, especially in the context of our dataset, may not conform to traditional financial market patterns, reinforcing the idea that market dynamics can significantly vary and that analytical methods, such as power-law fitting, need to be contextually adapted for accurate interpretation across different market types.
5.4 Trade-size Roundedness
Among all the indirect statistical methods analyzed in Cong et al. (2023), Trade-size Roundedness stands out for its ability to classify individual trades as wash trades. By contrast, Benford’s law (Section 5.1), and the power-law tails (Section 5.3) are distribution-level analyses, and cannot call out specific trades as wash trades. This trade-level classification parallels our direct detection methods from Section 4, and this unique capability allows us to compute classification metrics, a distinctive feature not available in other indirect tests.
The basic intuition between the roundedness filter in Cong et al. (2023) is that legitimate trades should occur at “rounded” prices. In the context of NFTs, this means that a sale for a “round” price (e.g. 2.1 ETH) is an legitimate sale, whereas a sale for an unrounded price (e.g. 2.12824 ETH) is a wash trade.
A critical question in this analysis is: what classifies a “round” price? In Cong et al. (2023), a price is defined to be “round” if the last nonzero digit is more than 1% of the total price. For example, is “round” because is more than of . On the other hand, is not round because the last nonzero digit, , is less than of . It should be clear that this threshold is somewhat arbitrary, and this roundedness filter could be applied for varying definitions of roundedness. Although Cong et al. (2023) only considered the cutoff for roundedness, with our richer data set, we can examine the efficacy of the filter at different roundedness cutoffs.
For example, a sale price of would be considered round at the level (because is more than 1% of the sale price ), but would not be considered round at the level (because is not more than 2% of the sale price).
Do wash trades have low round level?
Before we attempt to find the optimal roundedness cutoff, the first question we need to ask is whether the intuition that legitimate trades exhibit rounder prices than wash trades even makes sense. So our first question is: are rounder sale prices more likely to be legitimate than wash trades?
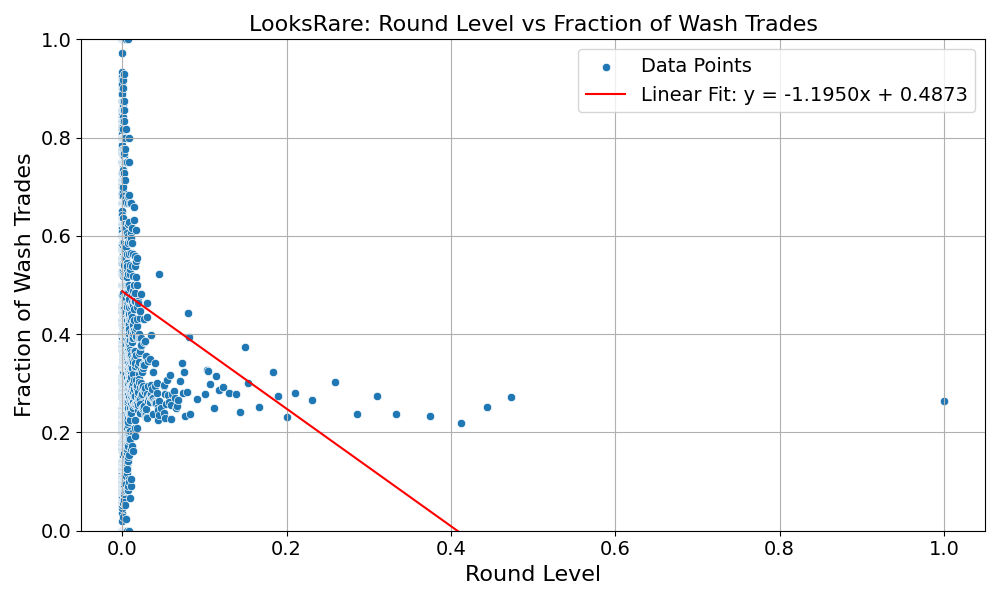
To answer this question, we calculate a linear regression – with sale price as our independent variable and fraction of wash trades at that price as our dependent variable. If our intuition is correct, this regression should have a clear downward trend, indicating that rounder trades are less likely to be wash trades. Figure 11 validates this intuition.
-0.0275, -value =
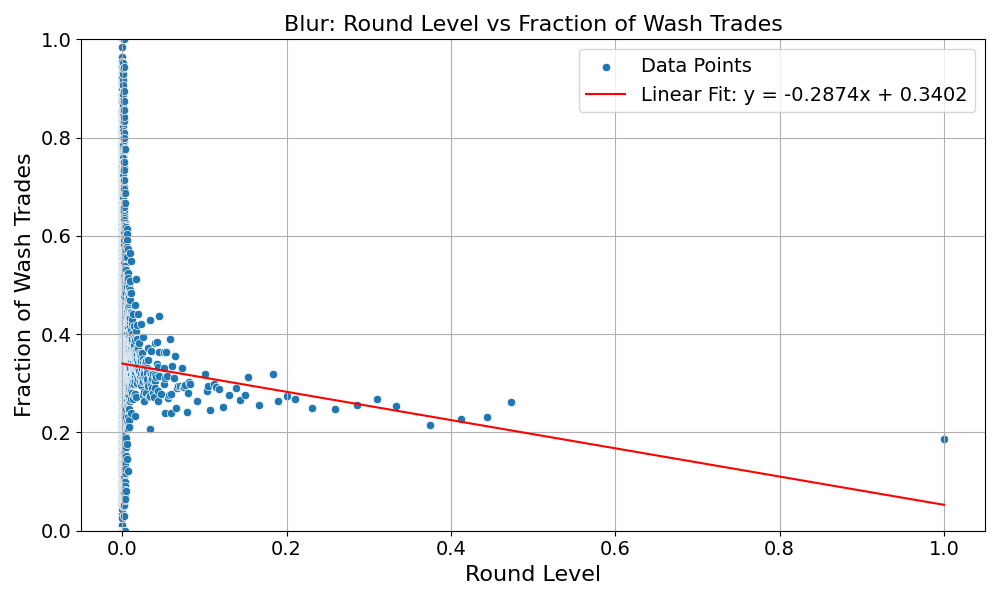
Each plot in Figure 11 displays a scatter of data points representing the fraction of wash trades at a given roundness level. The linear regression line (in red) provides a model of the relationship between roundness and the likelihood of a trade being a wash. The slope of the line suggests a trend where a higher round level correlates with a lower fraction of wash trades, which is consistent with the heuristic of using the using higher roundedness to classify trades as organic.
Notice that there are no data points for roundedness levels between .5 and 1. This is an artifact of the definition of roundedness. See Lemma 1 in Appendix A for the details.
For both LooksRare and Blur (Figure 11), we observe notable downward trends. The fraction of wash trades tends to decrease as the round level of trade value increases. Specifically, for LooksRare, the regression yielded an -value of -0.0275 and a statistically significant -value of , indicating a weak but significant inverse relationship. This suggests that higher roundness levels are associated with a reduced likelihood of wash trading. For Blur, the slope was also negative, but the correlation was not statistically significant (). These findings lend empirical support to Cong et al. (2023)’s rationale, which posits that wash trading is less prevalent in more rounded trade value, potentially due to the use of algorithms in wash trading that result in less rounded trade sizes.
Is a Fixed 1% Threshold Optimal?
As discussed, Cong et al. (2023) employ a roundedness filter with a cutoff of 1%, i.e., trades which were rounded to the 1% level (or higher) were considered legitimate. In this Section, we assess the accuracy of this filter to our datasets from LooksRare and Blur.
In Tables 6 and 7, we assess the accuracy, precision and recall of the 1% roundedness filter (using our direct-estimation methods as ground truth). Accuracy measures the proportion of trades correctly classified by the roundedness filter. Precision measures the fraction of true wash trades among those classified as wash trades by the roundedness filter. Recall measures the fraction of wash trades that were correctly identified by the roundedness filter.
Accuracy, Precision and Recall are trade-level measures, but Cong et al. (2023) were more interested in identifying the fraction of wash trades at the venue level (rather than classifying individual trades as wash trades). Thus in the final row of Tables 6 and 7, we report “1% vs Direct,” which reports simply what fraction of trades are identified as wash trades using the roundedness estimator as compared to direct estimation. We report this additional metric as a way to gauge whether the 1% roundedness heuristic can accurately estimate the fraction of wash trades that occur on a platform.
| Category | Percentage |
|---|---|
| LooksRare Accuracy | 65.65% |
| LooksRare Precision | 38.31% |
| LooksRare Recall | 27.51% |
| 1% vs Direct | 21.12% vs 29.42% |
| Category | Percentage |
|---|---|
| Blur Accuracy | 68.22% |
| Blur Precision | 35.09% |
| Blur Recall | 21.11% |
| 1% vs Direct | 16.21% vs 26.94% |
The data presented in Tables 6 and 7 show that employing the roundedness filter with a default 1% threshold delivers consistent accuracy when applied to both LooksRare and Blur platforms. Moreover, the roundedness filter, as a metric to assess the proportion of wash trading, generally results in an underestimation of the amount of wash trading on the platform by up to 10%. This uniformity in accuracy and the tendency of the round filter to underestimate highlight the need for potential adjustments in the threshold to accurately capture the prevalence of wash trading. To further elucidate these findings, the following confusion matrices (Figures 12(a) and 12(b)) provide a visual representation of the roundedness filter’s classification effectiveness, shedding light on its precision and recall in distinguishing between wash and legitimate trades.
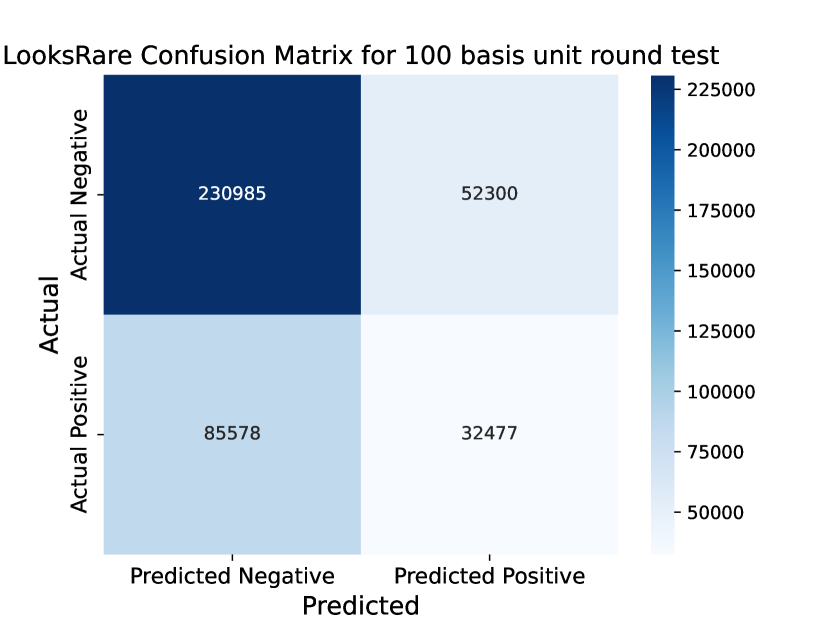
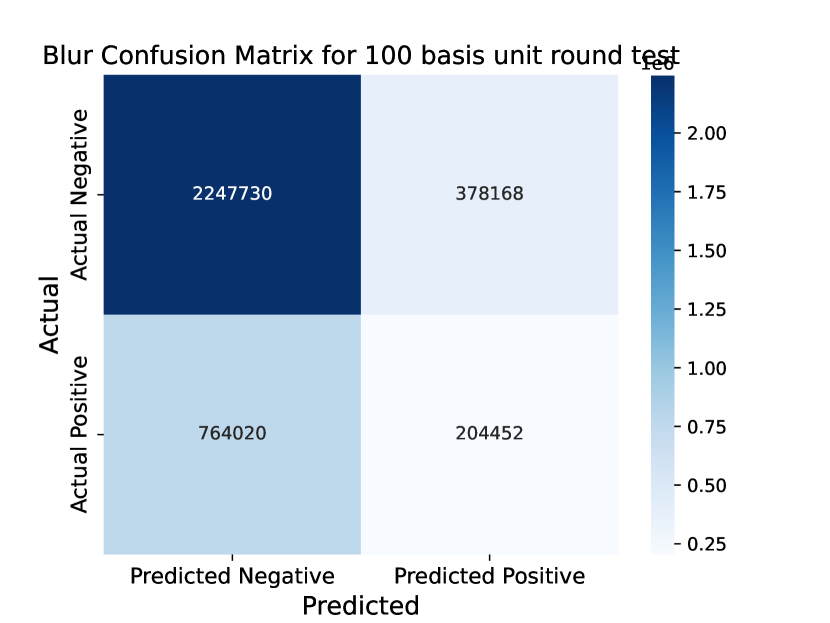
The confusion matrices in Figure 12(a) and 12(b) assess the performance of the 1% roundedness filter to identify wash trades. The top left quadrant displays the true negatives: actual legitimate trades that were correctly predicted as such. The top right quadrant represents false positives: legitimate trades incorrectly labeled as wash trades. The bottom left quadrant shows false negatives: wash trades that were not detected and were mislabeled as legitimate. Finally, the bottom right quadrant shows true positives: actual wash trades correctly identified. The intensity of the color corresponds to the count of trades in each category, with darker colors signifying higher frequencies.
The confusion matrices for LooksRare and Blur platforms, show a substantial concentration in the True Negatives (TN) quadrant. This highlights the conservative nature of this filter – it rarely mislabels legitimate trades as wash trades. Increasing the roundedness cutoff would make it less likely the roundedness filter would label trades as legitimate, and thus reduce the frequency of “Predicted Negatives”. This indicates that we might be able to get better performance from the roundedness filter by increasing the roundedness cutoff.
In the next section, we explore how increasing the roundedness cutoff affects the accuracy of the roundedness filter.
Benefits of Adaptive Roundness Thresholds
Looking at the confusion matrices (Figures 12(a) and 12(b)), we see a moderate concentration in the lower-left quadrant (False-Negatives). These are wash trades that were incorrectly labelled as legitimate. Increasing the roundedness cutoff would cause the filter classify more trades as wash trades, and potentially increase the overall accuracy of the filter.
There is, however, a clear tradeoff. Increasing the roundedness cutoff will decrease false negatives, but it will increase false positives. To explore this tradeoff, we characterized precision, recall, fallout, and accuracy of the roundedness classifier across a variety of roundedness cutoffs ranging from 0.01% to 9%.
Figures 13(a) and 13(b) plot four common metrics used to judge the quality of a classifier: precision (PPV), recall (TPR), fallout (FPR), and accuracy (ACC) for varying roundness thresholds. Precision measures the proportion of true positives among all identified positives, while recall assesses the proportion of true positives identified out of all actual positives. Fallout is the proportion of false positives out of all actual negatives, indicating the rate of false alarms. Accuracy represents the proportion of true results (both true positives and true negatives) among the total number of cases examined.
As expected, as the threshold increases, the recall increases (a larger fraction of trades classified as wash trades are indeed wash trades). Interestingly, both precision and accuracy decrease as the roundedness threshold increases.
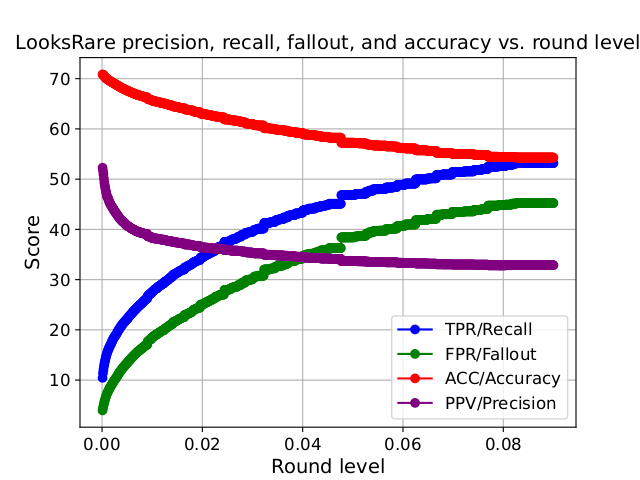
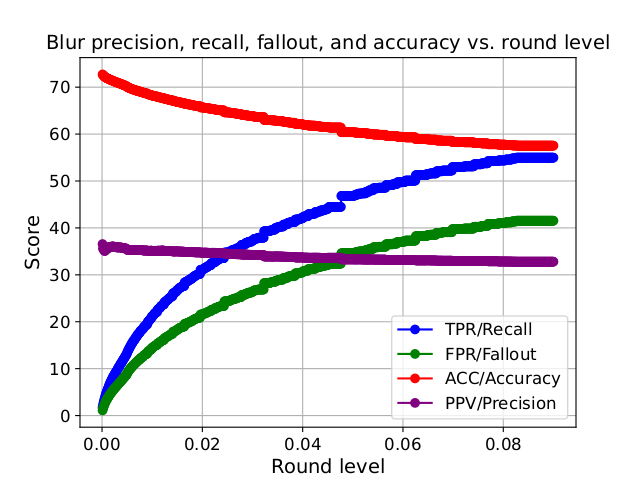
When the cutoff threshold is 0, all prices are considered “round” so the roundedness classifier classifies all trades as legitimate. Since the majority of trades on both platforms are, in fact, legitimate, this means the accuracy of the roundedness classifier is over 70% when the cutoff is 0. Of course, setting the cutoff to 0 means the classifier is completely independent of the trade.
The plots show that for LooksRare, increasing the cutoff leads to large losses in precision, whereas for Blur, increasing the roundedness cutoff yields big gains in recall for only small losses in precision. This indicates that when using this type of classifier, a platform-specific calibration can be beneficial. Specifically, for Blur, a higher roundedness cutoff offers better tradeoffs, whereas for LooksRare, a lower roundedness cutoff tends to offer better performance.
Summary of Indirect Estimation Findings
This summary encapsulates the key insights derived from the application of indirect estimation methods across our NFT dataset, covering the four distinct methodologies: Benford’s Law, Trade-Size Clustering, Tail Distribution, and Trade-Size Roundedness.
-
(I1)
Benford’s Law: Wash and legitimate trades from both LooksRare and Blur exhibited significant deviations from Benford’s Law. Notably, legitimate trades showed higher deviations than wash trades, challenging the traditional application of Benford’s Law in this context.
-
(I2)
Trade-Size Clustering: Legitimate trades of LooksRare and Blur exhibit pronounced clustering around round numbers, contrasting with less evident clustering in wash trades and reinforcing the method’s effectiveness across different trading scenarios.
-
(I3)
Tail Distribution: The power-law behavior of NFT trade sizes diverges from traditional financial market patterns, indicating the limited applicability of the Tail Distribution method in this analysis.
-
(I4)
Trade-Size Roundedness: Regression analysis validated the rationale that wash trades have lower roundness levels. The fixed 1% threshold proved generally effective, yet our findings also indicate room for optimization by fine-tuning this threshold to enhance detection accuracy in specific market contexts.
6 Discussion
Wash trading is rampant on decentralized NFT marketplaces, but wash trading activity varies significantly across different platforms. Our analysis indicates that on Blur, approximately 26.94% of trades, amounting to 45.4% of the total trading value, were flagged as wash trades. In stark contrast, LooksRare exhibited a higher incidence, with 29.42% of trades identified as wash trades, representing a staggering 94.8% of the total trading value. This disparity not only confirms the widespread presence of wash trading in our context of NFTs, but also underscores the significant differences in its manifestation across various markets.
The application of Cong et al. (2023)’s statistical tests to NFT trading datasets in our study has provided valuable insights, underscoring the broader applicability of these methods in detecting wash trading behaviors in diverse marketplaces, including but not limited to NFT DEXs.
The Benford test did not distinctly differentiate between wash and legitimate trades, suggesting that while this method has been effective in more traditional financial datasets, its applicability might vary across different types of markets.
The trade-size clustering heuristic, however, showed promise in both NFT and likely other market contexts. Our analysis indicated that legitimate trades often exhibit more clustering around round numbers, a pattern less pronounced in wash trades, which tend to be algorithmically driven.
Contrary to our expectations, the tail distribution analysis did not conform to the typical power-law behaviors seen in traditional financial assets, indicating the need for a more nuanced approach in interpreting these results across different market types.
The most compelling findings came from the trade-size roundedness test, where we observed a clear correlation between roundness levels and the fraction of wash trades. This test, showing a high degree of effectiveness in our NFT dataset, also suggests potential applicability in other markets, particularly when optimizing the roundness threshold for specific market characteristics. This points to the broader relevance of adapting and fine-tuning analytical tools like the trade-size roundedness test to enhance wash trade detection across various trading platforms.
Overall, our analysis across different heuristics indicates that while some methods developed for cryptocurrency CEXs are informative when applied to NFT DEXs, their effectiveness can vary drastically. This variability highlights the importance of a flexible, market-specific approach in analyzing wash trading behaviors, applicable across a spectrum of trading platforms and market types. As markets continue to evolve, refining these tools to suit the specific dynamics of different trading activities becomes essential.
Looking ahead, our study paves the way for further research in developing specialized models and heuristics tailored to the unique patterns of various trading platforms. Additionally, exploring the impact of regulatory and technological changes on market dynamics and wash trading activities will enrich our understanding of these phenomena. As more data becomes available with the maturation of markets like NFTs, opportunities arise to enhance these methodologies, improving our grasp of market behaviors and the efficacy of regulatory measures across diverse trading environments.
References
- (1)
-
Barter (2023)
Barter, J. (2023), ‘Blur continues momentum
with incentive program’, Meta Digest .
Accessed: 2023-11-23.
https://metadigest.io/blur-continues-momentum-with-incentive-program/ -
Bonifazi et al. (2023)
Bonifazi, G., Cauteruccio, F., Corradini, E., Marchetti, M., Montella, D.,
Scarponi, S., Ursino, D. and Virgili, L. (2023), ‘Performing wash trading on NFTs: Is the game worth
the candle?’, Big Data and Cognitive Computing 7(1).
https://www.mdpi.com/2504-2289/7/1/38 - Cao et al. (2014) Cao, Y., Li, Y., Coleman, S., Belatreche, A. and McGinnity, T. M. (2014), Detecting wash trade in the financial market, in ‘2014 IEEE Conference on Computational Intelligence for Financial Engineering & Economics (CIFEr)’, pp. 85–91.
- CoinGecko (2023) CoinGecko (2023), ‘Most popular NFT marketplaces by market share’, https://www.coingecko.com/research/publications/market-share-nft-marketplaces. Accessed: 2023-11-23.
-
Cong et al. (2023)
Cong, L. W., Li, X., Tang, K. and Yang, Y. (2023), ‘Crypto wash trading’, Management Science 69(11), 6427–6454.
https://doi.org/10.1287/mnsc.2021.02709 -
Decrypt (2023)
Decrypt (2023), ‘How much wash trading is
really happening on blur?’.
https://decrypt.co/122369/wash-trading-blur-ethereum-nfts -
Fridgen et al. (2023)
Fridgen, G., Kraeussl, R., Papageorgiou, O. and Tugnetti, A.
(2023), ‘Pricing dynamics and herding
behavior of NFTs’, Center for Financial Studies Working Paper No. 709
.
https://ssrn.com/abstract=4337173 - Hildobby (2022) Hildobby (2022), ‘NFT wash trading on Ethereum’, https://community.dune.com/blog/nft-wash-trading-on-ethereum.
-
Huang and Goetzmann (2023)
Huang, D. and Goetzmann, W. N. (2023), Selection-neglect in the NFT bubble, Working Paper 31498, National Bureau
of Economic Research.
http://www.nber.org/papers/w31498 -
Mao et al. (2015)
Mao, R., Li, Z. and Fu, J. (2015),
Fraud transaction recognition: A money flow network approach, in
‘Proceedings of the 24th ACM International on Conference on Information and
Knowledge Management’, CIKM ’15, Association for Computing Machinery, New
York, NY, USA, p. 1871–1874.
https://doi.org/10.1145/2806416.2806647 - Medvedev et al. (2023) Medvedev, E., Silberling, M., Razhev, M., Filatov, E. and Svanevik, A. (2023), ‘Ethereum ETL’, https://github.com/blockchain-etl/ethereum-etl.
- Morgia et al. (2023) Morgia, M. L., Mei, A., Mongardini, A. M. and Nemmi, E. N. (2023), ‘A game of NFTs: Characterizing NFT wash trading in the Ethereum blockchain’.
-
O’Hara et al. (2014)
O’Hara, M., Yao, C. and Ye, M. (2014), ‘What’s not there: Odd lots and market data’, The Journal of Finance
69(5), 2199–2236.
http://www.jstor.org/stable/43612955 -
Shimron (2022)
Shimron, L. (2022), ‘DEXs gain market share
as faith in centralized crypto players erodes’, Forbes .
https://www.forbes.com/sites/leeorshimron/2022/11/23/dexs-gain-market-share-as-faith-in-centralized-crypto-players-erodes/?sh=6f91cde83f40 - von Wachter et al. (2022) von Wachter, V., Jensen, J. R., Regner, F. and Ross, O. (2022), ‘NFT wash trading: Quantifying suspicious behaviour in NFT markets’.
-
Zitzewitz (2012)
Zitzewitz, E. (2012), ‘Forensic economics’,
Journal of Economic Literature 50(3), 731–69.
https://www.aeaweb.org/articles?id=10.1257/jel.50.3.731
Appendix A Roundedness
Lemma 1 explains the absence of data points between 0.5 and 1 for round level.
Lemma 1.
Fix , denote its last non-zero digit as , then .
Proof.
Fix . Suppose is a digit number, where . Let be the last non-zero digit of , say -th digit of . Without loss of generality, we assume . Denote to be the -th digit of , then we may rewrite:
| (3) | ||||
| (4) |
For the sake of contradiction, we assume , that is to say
| (5) |
Expanding and , we get
| (6) | ||||
| (7) |
Note the fact that
| (8) |
and
| (9) |
It follows that
| (10) |
Contradiction, as desired.
∎